Attached files
| file | filename |
|---|---|
| EX-95 - EX-95 - HEADWATERS INC | hw-20160630xex95.htm |
| EX-32 - EX-32 - HEADWATERS INC | hw-20160630xex32.htm |
| EX-31.2 - EX-31.2 - HEADWATERS INC | hw-20160630ex31236a056.htm |
| EX-31.1 - EX-31.1 - HEADWATERS INC | hw-20160630ex3110f537b.htm |
| EX-12 - EX-12 - HEADWATERS INC | hw-20160630ex1298917fe.htm |
| EX-10.60 - EX-10.60 - HEADWATERS INC | hw-20160630ex106092296.htm |
UNITED STATES
SECURITIES AND EXCHANGE COMMISSION
Washington, D.C. 20549
FORM 10-Q
|
☒ |
QUARTERLY REPORT PURSUANT TO SECTION 13 OR 15(d) OF THE SECURITIES EXCHANGE ACT OF 1934 |
For the quarterly period ended June 30, 2016
or
|
☐ |
TRANSITION REPORT PURSUANT TO SECTION 13 OR 15(d) OF THE SECURITIES EXCHANGE ACT OF 1934 |
For the transition period from to
Commission file number: 1-32459
HEADWATERS INCORPORATED
(Exact name of registrant as specified in its charter)
|
Delaware |
|
87-0547337 |
|
(State or other jurisdiction of incorporation or organization) |
|
(I.R.S. Employer Identification No.) |
|
|
|
|
|
10701 South River Front Parkway, Suite 300 |
|
|
|
South Jordan, Utah |
|
84095 |
|
(Address of principal executive offices) |
|
(Zip Code) |
(801) 984-9400
(Registrant’s telephone number, including area code)
Not applicable
(Former name, former address and former fiscal year, if changed since last report)
Indicate by check mark whether the registrant (1) has filed all reports required to be filed by Section 13 or 15(d) of the Securities Exchange Act of 1934 during the preceding 12 months (or for such shorter period that the registrant was required to file such reports), and (2) has been subject to such filing requirements for the past 90 days. Yes ☒ No ☐
Indicate by check mark whether the registrant has submitted electronically and posted on its corporate Web site, if any, every Interactive Data File required to be submitted and posted pursuant to Rule 405 of Regulation S-T during the preceding 12 months (or for such shorter period that the registrant was required to submit and post such files). Yes ☒ No ☐
Indicate by check mark whether the registrant is a large accelerated filer, an accelerated filer, a non-accelerated filer, or a smaller reporting company (as defined in Rule 12b-2 of the Exchange Act).
|
|
Large accelerated filer ☒ |
|
Accelerated filer ☐ |
|
|
Non-accelerated filer ☐ |
|
Smaller reporting company ☐ |
Indicate by check mark whether the registrant is a shell company (as defined in Rule 12b-2 of the Exchange Act). Yes ☐ No ☒
The number of shares outstanding of the Registrant’s common stock as of July 29, 2016 was 74,109,015.
HEADWATERS INCORPORATED
|
|
|
|
|
|
|
Page No. |
|
PART I — FINANCIAL INFORMATION |
|
|
|
|
||
|
|
Condensed Consolidated Balance Sheets — As of September 30, 2015 and June 30, 2016 |
3 |
|
|
4 | |
|
|
5 | |
|
|
Condensed Consolidated Statements of Cash Flows — For the nine months ended June 30, 2015 and 2016 |
6 |
|
|
7 | |
|
MANAGEMENT’S DISCUSSION AND ANALYSIS OF FINANCIAL CONDITION AND RESULTS OF OPERATIONS |
32 | |
| 43 | ||
| 43 | ||
|
|
||
| 45 | ||
| 45 | ||
| 45 | ||
| 45 | ||
| 45 | ||
| 45 | ||
| 46 | ||
|
|
|
|
| 47 | ||
Forward-looking Statements
This Quarterly Report on Form 10-Q contains forward-looking statements relating to Headwaters’ operations that are based on management’s current expectations, estimates and projections about the industries in which Headwaters operates. Words such as “may,” “should,” “anticipates,” “expects,” “intends,” “plans,” “targets,” “forecasts,” “projects,” “believes,” “seeks,” “schedules,” “estimates,” “budgets,” “goals,” “outlook” and similar expressions are intended to help identify such forward-looking statements. Forward-looking statements include Headwaters’ expectations as to the managing and marketing of coal combustion products, the production and marketing of building products, the sales to oil refineries of residue hydrocracking catalysts, the development, commercialization, and financing of new products and other strategic business opportunities and acquisitions, and other information about Headwaters which are not purely historical by nature, including those statements regarding Headwaters’ future business plans, the operation of facilities, the availability of feedstocks, and the marketability of the coal combustion products, building products and catalysts. These statements are not guarantees of future performance and are subject to certain risks, uncertainties and other factors, many of which are beyond the Company’s control and are difficult to predict. Therefore, actual outcomes and results may differ materially from what is expressed or forecasted in such forward-looking statements. The reader should not place undue reliance on these forward-looking statements, which speak only as of the date of this report. Unless legally required, Headwaters undertakes no obligation to update publicly any forward-looking statements, whether as a result of new information, future events or otherwise. Among the important factors that could cause actual results to differ materially from those in the forward-looking statements are: changing feedstock and energy prices; actions of competitors or regulators; technological developments; potential disruption of the Company’s production facilities, transportation networks and information technology systems due to war, terrorism, malicious attack, civil accidents, political events, civil unrest or severe weather; potential environmental liability or product liability under existing or future laws and litigation; potential liability resulting from other pending or future litigation; changed accounting rules under generally accepted accounting principles promulgated by rule-setting bodies; and the factors set forth under the heading “Risk Factors” in the Company’s Annual Report on Form 10-K, quarterly reports on Form 10-Q and other periodic reports. In addition, such results could be affected by general domestic and international economic and political conditions and other unpredictable or unknown factors not discussed in this report which could have material adverse effects on forward-looking statements.
Our internet address is www.headwaters.com. There we make available, free of charge, our annual report on Form 10-K, quarterly reports on Form 10-Q, current reports on Form 8-K and any amendments to those reports, as soon as reasonably practicable after we electronically file such material with, or furnish it to, the Securities and Exchange Commission (SEC). Our reports can be accessed through the investor relations section of our web site. The information found on our web site is not part of this or any report we file with or furnish to the SEC.
2
HEADWATERS INCORPORATED
CONDENSED CONSOLIDATED BALANCE SHEETS
(Unaudited)
|
|
|
September 30, |
|
June 30, |
|
||
|
(in thousands, except par value) |
|
2015 |
|
2016 |
|
||
|
ASSETS |
|
|
|
|
|
|
|
|
Current assets: |
|
|
|
|
|
|
|
|
Cash and cash equivalents |
|
$ |
142,597 |
|
$ |
87,503 |
|
|
Trade receivables, net |
|
|
134,384 |
|
|
136,137 |
|
|
Inventories |
|
|
55,074 |
|
|
65,684 |
|
|
Current income taxes |
|
|
329 |
|
|
3,675 |
|
|
Other |
|
|
11,827 |
|
|
10,109 |
|
|
Total current assets |
|
|
344,211 |
|
|
303,108 |
|
|
Property, plant and equipment, net |
|
|
185,718 |
|
|
190,089 |
|
|
Other assets: |
|
|
|
|
|
|
|
|
Goodwill |
|
|
178,199 |
|
|
218,722 |
|
|
Intangible assets, net |
|
|
143,718 |
|
|
182,633 |
|
|
Deferred income taxes |
|
|
92,852 |
|
|
74,824 |
|
|
Other |
|
|
34,321 |
|
|
43,440 |
|
|
Total other assets |
|
|
449,090 |
|
|
519,619 |
|
|
Total assets |
|
$ |
979,019 |
|
$ |
1,012,816 |
|
|
|
|
|
|
|
|
|
|
|
LIABILITIES AND STOCKHOLDERS’ EQUITY |
|
|
|
|
|
|
|
|
Current liabilities: |
|
|
|
|
|
|
|
|
Accounts payable |
|
$ |
25,306 |
|
$ |
23,760 |
|
|
Accrued personnel costs |
|
|
52,544 |
|
|
42,301 |
|
|
Accrued interest |
|
|
2,295 |
|
|
4,918 |
|
|
Other accrued liabilities |
|
|
49,486 |
|
|
60,771 |
|
|
Current portion of long-term debt |
|
|
4,250 |
|
|
4,250 |
|
|
Total current liabilities |
|
|
133,881 |
|
|
136,000 |
|
|
Long-term liabilities: |
|
|
|
|
|
|
|
|
Long-term debt, net |
|
|
558,080 |
|
|
552,798 |
|
|
Income taxes |
|
|
6,590 |
|
|
3,015 |
|
|
Other |
|
|
30,186 |
|
|
35,910 |
|
|
Total long-term liabilities |
|
|
594,856 |
|
|
591,723 |
|
|
Total liabilities |
|
|
728,737 |
|
|
727,723 |
|
|
Commitments and contingencies |
|
|
|
|
|
|
|
|
Redeemable non-controlling interest in consolidated subsidiary |
|
|
12,431 |
|
|
12,544 |
|
|
Stockholders’ equity: |
|
|
|
|
|
|
|
|
Common stock, $0.001 par value; authorized 200,000 shares; issued and outstanding: 73,896 shares at September 30, 2015 (including 83 shares held in treasury) and 74,105 shares at June 30, 2016 (including 99 shares held in treasury) |
|
|
74 |
|
|
74 |
|
|
Capital in excess of par value |
|
|
728,667 |
|
|
731,630 |
|
|
Retained earnings (accumulated deficit) |
|
|
(489,889) |
|
|
(457,847) |
|
|
Treasury stock |
|
|
(1,001) |
|
|
(1,308) |
|
|
Total stockholders’ equity |
|
|
237,851 |
|
|
272,549 |
|
|
Total liabilities and stockholders’ equity |
|
$ |
979,019 |
|
$ |
1,012,816 |
|
See accompanying notes.
3
HEADWATERS INCORPORATED
CONDENSED CONSOLIDATED STATEMENTS OF INCOME
(Unaudited)
|
|
|
Three Months Ended |
|
Nine Months Ended |
|
||||||||
|
|
|
June 30, |
|
June 30, |
|
||||||||
|
(in thousands, except per-share amounts) |
|
2015 |
|
2016 |
|
2015 |
|
2016 |
|
||||
|
Revenue: |
|
|
|
|
|
|
|
|
|
|
|
|
|
|
Building products |
|
$ |
147,830 |
|
$ |
162,642 |
|
$ |
371,770 |
|
$ |
423,682 |
|
|
Construction materials |
|
|
91,900 |
|
|
97,741 |
|
|
240,802 |
|
|
255,494 |
|
|
Energy technology |
|
|
3,564 |
|
|
2,083 |
|
|
10,044 |
|
|
4,040 |
|
|
Total revenue |
|
|
243,294 |
|
|
262,466 |
|
|
622,616 |
|
|
683,216 |
|
|
Cost of revenue: |
|
|
|
|
|
|
|
|
|
|
|
|
|
|
Building products |
|
|
100,801 |
|
|
111,409 |
|
|
264,474 |
|
|
297,742 |
|
|
Construction materials |
|
|
63,850 |
|
|
66,577 |
|
|
174,099 |
|
|
181,059 |
|
|
Energy technology |
|
|
1,881 |
|
|
949 |
|
|
4,453 |
|
|
1,736 |
|
|
Total cost of revenue |
|
|
166,532 |
|
|
178,935 |
|
|
443,026 |
|
|
480,537 |
|
|
Gross profit |
|
|
76,762 |
|
|
83,531 |
|
|
179,590 |
|
|
202,679 |
|
|
Operating expenses: |
|
|
|
|
|
|
|
|
|
|
|
|
|
|
Selling, general and administrative |
|
|
38,906 |
|
|
42,408 |
|
|
105,286 |
|
|
115,172 |
|
|
Amortization |
|
|
4,557 |
|
|
5,029 |
|
|
13,603 |
|
|
14,410 |
|
|
Total operating expenses |
|
|
43,463 |
|
|
47,437 |
|
|
118,889 |
|
|
129,582 |
|
|
Operating income |
|
|
33,299 |
|
|
36,094 |
|
|
60,701 |
|
|
73,097 |
|
|
Other income (expense): |
|
|
|
|
|
|
|
|
|
|
|
|
|
|
Net interest expense |
|
|
(8,083) |
|
|
(9,270) |
|
|
(56,000) |
|
|
(25,543) |
|
|
Other, net |
|
|
122 |
|
|
(207) |
|
|
(180) |
|
|
(288) |
|
|
Total other income (expense), net |
|
|
(7,961) |
|
|
(9,477) |
|
|
(56,180) |
|
|
(25,831) |
|
|
Income from continuing operations before income taxes |
|
|
25,338 |
|
|
26,617 |
|
|
4,521 |
|
|
47,266 |
|
|
Income tax benefit (provision) |
|
|
(2,220) |
|
|
(9,090) |
|
|
760 |
|
|
(14,190) |
|
|
Income from continuing operations |
|
|
23,118 |
|
|
17,527 |
|
|
5,281 |
|
|
33,076 |
|
|
Income (loss) from discontinued operations, net of income taxes |
|
|
(110) |
|
|
258 |
|
|
(387) |
|
|
(186) |
|
|
Net income |
|
|
23,008 |
|
|
17,785 |
|
|
4,894 |
|
|
32,890 |
|
|
Net income attributable to non-controlling interest |
|
|
(191) |
|
|
(269) |
|
|
(695) |
|
|
(848) |
|
|
Net income attributable to Headwaters Incorporated |
|
$ |
22,817 |
|
$ |
17,516 |
|
$ |
4,199 |
|
$ |
32,042 |
|
|
|
|
|
|
|
|
|
|
|
|
|
|
|
|
|
Basic income per share attributable to |
|
|
|
|
|
|
|
|
|
|
|
|
|
|
Headwaters Incorporated: |
|
|
|
|
|
|
|
|
|
|
|
|
|
|
From continuing operations |
|
$ |
0.31 |
|
$ |
0.23 |
|
$ |
0.06 |
|
$ |
0.43 |
|
|
From discontinued operations |
|
|
0.00 |
|
|
0.00 |
|
|
0.00 |
|
|
0.00 |
|
|
|
|
$ |
0.31 |
|
$ |
0.23 |
|
$ |
0.06 |
|
$ |
0.43 |
|
|
Diluted income per share attributable to |
|
|
|
|
|
|
|
|
|
|
|
|
|
|
Headwaters Incorporated: |
|
|
|
|
|
|
|
|
|
|
|
|
|
|
From continuing operations |
|
$ |
0.30 |
|
$ |
0.23 |
|
$ |
0.06 |
|
$ |
0.43 |
|
|
From discontinued operations |
|
|
0.00 |
|
|
0.00 |
|
|
0.00 |
|
|
0.00 |
|
|
|
|
$ |
0.30 |
|
$ |
0.23 |
|
$ |
0.06 |
|
$ |
0.43 |
|
See accompanying notes.
4
HEADWATERS INCORPORATED
CONDENSED CONSOLIDATED STATEMENT OF CHANGES IN STOCKHOLDERS’ EQUITY (Unaudited)
For the Nine Months Ended June 30, 2016
|
|
|
|
|
|
|
|
|
|
|
Retained |
|
|
|
|
|
|
||
|
|
|
|
|
|
|
|
Capital in |
|
earnings |
|
|
|
Total |
|
||||
|
|
|
Common stock |
|
excess |
|
(accumulated |
|
Treasury |
|
stockholders’ |
|
|||||||
|
(in thousands) |
|
Shares |
|
Amount |
|
of par value |
|
deficit) |
|
stock |
|
equity |
|
|||||
|
Balances as of September 30, 2015 |
|
73,896 |
|
$ |
74 |
|
$ |
728,667 |
|
$ |
(489,889) |
|
$ |
(1,001) |
|
$ |
237,851 |
|
|
Issuance of common stock pursuant to employee stock purchase plan |
|
45 |
|
|
0 |
|
|
718 |
|
|
— |
|
|
— |
|
|
718 |
|
|
Issuance of restricted stock, net of cancellations |
|
90 |
|
|
0 |
|
|
— |
|
|
— |
|
|
— |
|
|
0 |
|
|
Exercise of stock appreciation rights |
|
74 |
|
|
0 |
|
|
— |
|
|
— |
|
|
— |
|
|
0 |
|
|
Tax shortfall from exercise of stock appreciation rights and vesting of restricted stock |
|
— |
|
|
— |
|
|
(399) |
|
|
— |
|
|
— |
|
|
(399) |
|
|
Stock-based compensation |
|
— |
|
|
— |
|
|
2,337 |
|
|
— |
|
|
— |
|
|
2,337 |
|
|
Net 16 share increase in treasury stock held for deferred compensation plan obligations, at cost |
|
— |
|
|
— |
|
|
307 |
|
|
— |
|
|
(307) |
|
|
0 |
|
|
Net income attributable to Headwaters Incorporated for the nine months ended June 30, 2016 |
|
— |
|
|
— |
|
|
— |
|
|
32,042 |
|
|
— |
|
|
32,042 |
|
|
Balances as of June 30, 2016 |
|
74,105 |
|
$ |
74 |
|
$ |
731,630 |
|
$ |
(457,847) |
|
$ |
(1,308) |
|
$ |
272,549 |
|
See accompanying notes.
5
HEADWATERS INCORPORATED
CONDENSED CONSOLIDATED STATEMENTS OF CASH FLOWS
(Unaudited)
|
|
|
Nine Months Ended |
|
||||
|
|
|
June 30, |
|
||||
|
(in thousands) |
|
2015 |
|
2016 |
|
||
|
Cash flows from operating activities: |
|
|
|
|
|
|
|
|
Net income |
|
$ |
4,894 |
|
$ |
32,890 |
|
|
Adjustments to reconcile income to net cash provided by operating activities: |
|
|
|
|
|
|
|
|
Depreciation and amortization |
|
|
39,793 |
|
|
43,053 |
|
|
Interest expense related to amortization of debt issue costs and debt discount |
|
|
5,611 |
|
|
1,745 |
|
|
Stock-based compensation |
|
|
2,069 |
|
|
2,337 |
|
|
Deferred income taxes |
|
|
954 |
|
|
17,629 |
|
|
Tax benefit from exercise of stock appreciation rights and vesting of restricted stock |
|
|
0 |
|
|
(332) |
|
|
Net loss (gain) on disposition of property, plant and equipment |
|
|
95 |
|
|
(1,631) |
|
|
Loss on sale of discontinued operations, net of income taxes |
|
|
219 |
|
|
3,072 |
|
|
Net loss of unconsolidated joint ventures |
|
|
247 |
|
|
36 |
|
|
Decrease in trade receivables |
|
|
506 |
|
|
4,579 |
|
|
Increase in inventories |
|
|
(8,927) |
|
|
(1,879) |
|
|
Decrease in accounts payable and accrued liabilities |
|
|
(29,479) |
|
|
(18,062) |
|
|
Other changes in operating assets and liabilities, net |
|
|
(10,788) |
|
|
(4,030) |
|
|
Net cash provided by operating activities |
|
|
5,194 |
|
|
79,407 |
|
|
|
|
|
|
|
|
|
|
|
Cash flows from investing activities: |
|
|
|
|
|
|
|
|
Business acquisitions, net of cash acquired |
|
|
(1,200) |
|
|
(106,924) |
|
|
Investments in unconsolidated joint venture |
|
|
(125) |
|
|
0 |
|
|
Purchase of property, plant and equipment |
|
|
(26,524) |
|
|
(31,419) |
|
|
Proceeds from disposition of property, plant and equipment |
|
|
716 |
|
|
8,795 |
|
|
Net decrease (increase) in long-term receivables and deposits |
|
|
3,847 |
|
|
(200) |
|
|
Net change in other assets |
|
|
(423) |
|
|
1,869 |
|
|
Net cash used in investing activities |
|
|
(23,709) |
|
|
(127,879) |
|
|
|
|
|
|
|
|
|
|
|
Cash flows from financing activities: |
|
|
|
|
|
|
|
|
Net proceeds from issuance of long-term debt |
|
|
414,675 |
|
|
0 |
|
|
Payments on long-term debt |
|
|
(448,736) |
|
|
(6,937) |
|
|
Dividends paid to non-controlling interest in consolidated subsidiary |
|
|
(1,184) |
|
|
(735) |
|
|
Employee stock purchases |
|
|
633 |
|
|
718 |
|
|
Tax benefit from exercise of stock appreciation rights and vesting of restricted stock |
|
|
0 |
|
|
332 |
|
|
Net cash used in financing activities |
|
|
(34,612) |
|
|
(6,622) |
|
|
|
|
|
|
|
|
|
|
|
Net decrease in cash and cash equivalents |
|
|
(53,127) |
|
|
(55,094) |
|
|
Cash and cash equivalents, beginning of period |
|
|
152,542 |
|
|
142,597 |
|
|
Cash and cash equivalents, end of period |
|
$ |
99,415 |
|
$ |
87,503 |
|
See accompanying notes.
6
HEADWATERS INCORPORATED
NOTES TO CONDENSED CONSOLIDATED FINANCIAL STATEMENTS
June 30, 2016
(Unaudited)
1.Nature of Operations and Basis of Presentation
Description of Business and Organization – Headwaters Incorporated (Headwaters) is a building materials company incorporated in Delaware, providing products and services in two core business segments.
The building products segment designs, manufactures, and sells a wide variety of building products, including exterior vinyl siding accessories (such as shutters, mounting blocks, and vents), manufactured architectural stone, roofing materials and concrete block. Revenues from Headwaters’ building products businesses are diversified geographically and also by end use, including new housing construction and residential repair and remodeling, as well as commercial construction.
The construction materials segment is the nationwide leader in the management and marketing of coal combustion products (CCPs), including fly ash which primarily is sold directly to concrete manufacturers who use it as a mineral admixture for the partial replacement of portland cement in concrete. Headwaters’ construction materials business is comprised of a nationwide supply, storage and distribution network. Headwaters also provides services to electric utilities related to the management of CCPs.
In addition to the two building materials segments described above, Headwaters also has a non-core energy technology segment which has been focused on reducing waste and increasing the value of energy-related feedstocks, primarily in the areas of low-value oil and coal. In oil, Headwaters’ heavy oil upgrading process uses a liquid catalyst precursor to generate a highly active molecular catalyst to convert low-value residual oil into higher-value distillates that can be further refined into gasoline, diesel and other products. In coal, Headwaters owned and operated coal cleaning facilities that separate ash from waste coal to provide a refined coal product that is higher in Btu value and lower in impurities than the feedstock coal. As described in Note 4, Headwaters disposed of its remaining coal cleaning facilities in 2013 and the results of Headwaters’ coal cleaning operations have been presented as discontinued operations for all periods.
Basis of Presentation – Headwaters’ fiscal year ends on September 30 and unless otherwise noted, references to years refer to Headwaters’ fiscal year rather than a calendar year. The unaudited interim condensed consolidated financial statements include the accounts of Headwaters, all of its subsidiaries and other entities in which Headwaters has a controlling interest. All significant intercompany transactions and accounts are eliminated in consolidation. Due to the seasonality of most of Headwaters’ operations and other factors, the consolidated results of operations for any particular period are not indicative of the results to be expected for a full fiscal year. During the nine months ended June 30, 2015 and 2016, approximately 9% of Headwaters’ total revenue and cost of revenue was for services. Substantially all service-related revenue for both periods was in the construction materials segment.
The accompanying unaudited interim condensed consolidated financial statements have been prepared in accordance with the rules and regulations of the Securities and Exchange Commission (SEC) for quarterly reports on Form 10-Q. In the opinion of management, all adjustments considered necessary for a fair presentation have been included, which consist of normal recurring adjustments. Certain information and footnote disclosures normally included in annual financial statements prepared in accordance with U.S. generally accepted accounting principles have been condensed or omitted. These unaudited interim condensed consolidated financial statements should be read in conjunction with the consolidated financial statements and notes thereto included in Headwaters’ Annual Report on Form 10-K for the year ended September 30, 2015 (Form 10-K) and in Headwaters’ Quarterly Reports on Form 10-Q for the quarters ended December 31, 2015 and March 31, 2016.
Recent Accounting Pronouncements – In November 2015, the Financial Accounting Standards Board (FASB) issued Accounting Standards Update (ASU) 2015-17, Balance Sheet Classification of Deferred Taxes (ASC Topic 740). This new rule was issued to simplify the presentation of deferred income taxes to require that all deferred income tax assets and liabilities be classified as noncurrent in the balance sheet. Early application of ASU 2015-17
7
HEADWATERS INCORPORATED
NOTES TO CONDENSED CONSOLIDATED FINANCIAL STATEMENTS
June 30, 2016
(Unaudited)
is permitted and Headwaters elected to adopt the ASU effective as of December 31, 2015, with retrospective application to the September 30, 2015 balance sheet.
The effect of the adoption of ASU 2015-17 was to reclassify net deferred income tax assets of approximately $23.4 million as of September 30, 2015 as noncurrent instead of current. Accordingly, total current assets in the September 30, 2015 balance sheet were reduced by that amount, and total other assets were increased by the same amount. There was no effect on total assets or on net income.
In May 2014, the FASB issued ASU 2014-09, Revenue from Contracts with Customers (ASC Topic 606). This new revenue standard creates a single source of revenue guidance for all companies in all industries and is more principles-based than current revenue guidance. In August 2015, the FASB issued ASU 2015-14, Revenue from Contracts with Customers (Topic 606): Deferral of the Effective Date, which deferred the effective date of ASU 2014-09. The mandatory adoption date of ASC 606 for Headwaters is now October 1, 2018. There are two methods of adoption allowed, either a “full” retrospective adoption or a “modified” retrospective adoption. Headwaters continues to evaluate ASC 606, but at the current time does not know what impact the new standard will have on revenue recognized and other accounting decisions in future periods, if any, nor what method of adoption will be selected if the impact is material.
In February 2016, the FASB issued ASU 2016-02, Leases (ASC Topic 842). This new standard establishes a right-of-use (ROU) model that requires a lessee to record a ROU asset and a lease liability on the balance sheet for all leases with terms longer than 12 months. Leases will be classified as either finance or operating, with classification affecting the pattern of expense recognition in the Statement of Income. The mandatory adoption date of ASC 842 for Headwaters is October 1, 2019. A modified retrospective transition approach is required for leases existing at, or entered into, after the beginning of the earliest comparative period presented in the financial statements, with certain practical expedients available. Headwaters currently expects that upon adoption of ASC 842, ROU assets and lease liabilities will be recognized in the balance sheet in amounts that will be material.
In March 2016, the FASB issued ASU 2016-09, Improvements to Employee Share-Based Payment Accounting (ASC Topic 718, Compensation—Stock Compensation), which changes how companies account for certain aspects of share-based payments to employees. Among other things, the new rules eliminate the requirement to record excess tax benefits in additional paid-in capital and instead require all such tax benefits to be recorded in the income statement. Most of the amendments are mandatory while one, how to account for forfeitures, requires a policy election. The adoption date for Headwaters is no later than October 1, 2017. Different methods of adoption are required for the various amendments and early adoption is permitted, but all of the amendments must be adopted in the same period. Headwaters is evaluating ASU 2016-09 and at the current time does not know what effects adoption of the new standard will have on its financial statements and whether the impact will be material, nor has it been determined when the new standard will be adopted.
Headwaters has reviewed other recently issued accounting standards which have not yet been adopted in order to determine their potential effect, if any, on the results of operations or financial position of Headwaters. Based on the review of these other recently issued standards, Headwaters does not currently believe that any of those accounting pronouncements will have a significant effect on its current or future financial position, results of operations, cash flows or disclosures.
Reclassifications – Certain prior period amounts, including the changes described above for deferred income taxes, have been reclassified to conform to the current period’s presentation. The reclassifications had no effect on net income or on total assets.
2.Segment Reporting
Headwaters currently operates three business segments: building products, construction materials and energy technology. These segments are managed and evaluated separately by management due to differences in their operations, products and services. Revenues for the building products segment consist of product sales to wholesale and retail distributors, contractors and other users of building products. Revenues for the construction materials segment consist primarily of CCP sales to ready-mix concrete businesses, with a smaller amount from services
8
HEADWATERS INCORPORATED
NOTES TO CONDENSED CONSOLIDATED FINANCIAL STATEMENTS
June 30, 2016
(Unaudited)
provided to coal-fueled electric generating utilities. Continuing revenues for the energy technology segment consist primarily of catalyst sales to oil refineries. As described in Note 4, Headwaters sold all of its coal cleaning facilities in 2012 and 2013 and the results of operations have been reflected as discontinued operations in the accompanying Statements of Income for all periods. Intersegment sales are immaterial.
The following segment information has been prepared in accordance with ASC Topic 280 Segment Reporting. Segment performance is evaluated primarily on revenue and operating income, although other factors are also used, such as Adjusted EBITDA, a non-GAAP financial measure. Headwaters defines Adjusted EBITDA as income from continuing operations plus net interest expense, income taxes, depreciation and amortization, stock-based compensation, cash-based compensation tied to stock price, goodwill and other impairments, and other non-routine adjustments that arise from time to time.
Segment costs and expenses considered in deriving segment operating income include cost of revenue, amortization, and segment-specific selling, general and administrative expenses. Amounts included in the Corporate column represent expenses that are not allocated to any segment and include administrative departmental costs and general corporate overhead. Segment assets reflect those specifically attributable to individual segments and primarily include cash, accounts receivable, inventories, property, plant and equipment, goodwill and intangible assets. Certain other assets are included in the Corporate column. The net operating results of the discontinued coal cleaning business are reflected in the single line item for discontinued operations.
|
|
|
Three Months Ended June 30, 2015 |
|
|||||||||||||
|
|
|
Building |
|
Construction |
|
Energy |
|
|
|
|
|
|
|
|||
|
(in thousands) |
|
products |
|
materials |
|
technology |
|
Corporate |
|
Totals |
|
|||||
|
Segment revenue |
|
$ |
147,830 |
|
$ |
91,900 |
|
$ |
3,564 |
|
$ |
0 |
|
$ |
243,294 |
|
|
Depreciation and amortization |
|
$ |
(9,660) |
|
$ |
(3,774) |
|
$ |
(345) |
|
$ |
(158) |
|
$ |
(13,937) |
|
|
Operating income (loss) |
|
$ |
22,838 |
|
$ |
18,427 |
|
$ |
(993) |
|
$ |
(6,973) |
|
$ |
33,299 |
|
|
Net interest expense |
|
|
|
|
|
|
|
|
|
|
|
|
|
|
(8,083) |
|
|
Other income (expense), net |
|
|
|
|
|
|
|
|
|
|
|
|
|
|
122 |
|
|
Income tax expense |
|
|
|
|
|
|
|
|
|
|
|
|
|
|
(2,220) |
|
|
Income from continuing operations |
|
|
|
|
|
|
|
|
|
|
|
|
|
|
23,118 |
|
|
Loss from discontinued operations, net of income taxes |
|
|
|
|
|
|
|
|
|
|
|
|
|
|
(110) |
|
|
Net income |
|
|
|
|
|
|
|
|
|
|
|
|
|
$ |
23,008 |
|
|
Capital expenditures |
|
$ |
6,062 |
|
$ |
1,521 |
|
$ |
44 |
|
$ |
1,423 |
|
$ |
9,050 |
|
|
Segment assets as of September 30, 2015 |
|
$ |
412,867 |
|
$ |
294,057 |
|
$ |
45,671 |
|
$ |
226,424 |
|
$ |
979,019 |
|
|
|
|
Three Months Ended June 30, 2016 |
|
|||||||||||||
|
|
|
Building |
|
Construction |
|
Energy |
|
|
|
|
|
|
|
|||
|
(in thousands) |
|
products |
|
materials |
|
technology |
|
Corporate |
|
Totals |
|
|||||
|
Segment revenue |
|
$ |
162,642 |
|
$ |
97,741 |
|
$ |
2,083 |
|
$ |
0 |
|
$ |
262,466 |
|
|
Depreciation and amortization |
|
$ |
(10,118) |
|
$ |
(4,535) |
|
$ |
(326) |
|
$ |
(177) |
|
$ |
(15,156) |
|
|
Operating income (loss) |
|
$ |
24,603 |
|
$ |
20,945 |
|
$ |
(1,106) |
|
$ |
(8,348) |
|
$ |
36,094 |
|
|
Net interest expense |
|
|
|
|
|
|
|
|
|
|
|
|
|
|
(9,270) |
|
|
Other income (expense), net |
|
|
|
|
|
|
|
|
|
|
|
|
|
|
(207) |
|
|
Income tax expense |
|
|
|
|
|
|
|
|
|
|
|
|
|
|
(9,090) |
|
|
Income from continuing operations |
|
|
|
|
|
|
|
|
|
|
|
|
|
|
17,527 |
|
|
Income from discontinued operations, net of income taxes |
|
|
|
|
|
|
|
|
|
|
|
|
|
|
258 |
|
|
Net income |
|
|
|
|
|
|
|
|
|
|
|
|
|
$ |
17,785 |
|
|
Capital expenditures |
|
$ |
8,101 |
|
$ |
1,712 |
|
$ |
14 |
|
$ |
710 |
|
$ |
10,537 |
|
|
Segment assets as of June 30, 2016 |
|
$ |
483,371 |
|
$ |
326,409 |
|
$ |
38,955 |
|
$ |
164,081 |
|
$ |
1,012,816 |
|
9
HEADWATERS INCORPORATED
NOTES TO CONDENSED CONSOLIDATED FINANCIAL STATEMENTS
June 30, 2016
(Unaudited)
|
|
|
Nine Months Ended June 30, 2015 |
|
|||||||||||||
|
|
|
Building |
|
Construction |
|
Energy |
|
|
|
|
|
|
|
|||
|
(in thousands) |
|
products |
|
materials |
|
technology |
|
Corporate |
|
Totals |
|
|||||
|
Segment revenue |
|
$ |
371,770 |
|
$ |
240,802 |
|
$ |
10,044 |
|
$ |
0 |
|
$ |
622,616 |
|
|
Depreciation and amortization |
|
$ |
(27,075) |
|
$ |
(11,309) |
|
$ |
(1,039) |
|
$ |
(370) |
|
$ |
(39,793) |
|
|
Operating income (loss) |
|
$ |
39,465 |
|
$ |
40,090 |
|
$ |
(1,131) |
|
$ |
(17,723) |
|
$ |
60,701 |
|
|
Net interest expense |
|
|
|
|
|
|
|
|
|
|
|
|
|
|
(56,000) |
|
|
Other income (expense), net |
|
|
|
|
|
|
|
|
|
|
|
|
|
|
(180) |
|
|
Income tax benefit |
|
|
|
|
|
|
|
|
|
|
|
|
|
|
760 |
|
|
Income from continuing operations |
|
|
|
|
|
|
|
|
|
|
|
|
|
|
5,281 |
|
|
Loss from discontinued operations, net of income taxes |
|
|
|
|
|
|
|
|
|
|
|
|
|
|
(387) |
|
|
Net income |
|
|
|
|
|
|
|
|
|
|
|
|
|
$ |
4,894 |
|
|
Capital expenditures |
|
$ |
18,214 |
|
$ |
3,895 |
|
$ |
273 |
|
$ |
4,142 |
|
$ |
26,524 |
|
|
|
|
Nine Months Ended June 30, 2016 |
|
|||||||||||||
|
|
|
Building |
|
Construction |
|
Energy |
|
|
|
|
|
|
|
|||
|
(in thousands) |
|
products |
|
materials |
|
technology |
|
Corporate |
|
Totals |
|
|||||
|
Segment revenue |
|
$ |
423,682 |
|
$ |
255,494 |
|
$ |
4,040 |
|
$ |
0 |
|
$ |
683,216 |
|
|
Depreciation and amortization |
|
$ |
(29,275) |
|
$ |
(12,318) |
|
$ |
(973) |
|
$ |
(487) |
|
$ |
(43,053) |
|
|
Operating income (loss) |
|
$ |
50,508 |
|
$ |
47,113 |
|
$ |
(3,990) |
|
$ |
(20,534) |
|
$ |
73,097 |
|
|
Net interest expense |
|
|
|
|
|
|
|
|
|
|
|
|
|
|
(25,543) |
|
|
Other income (expense), net |
|
|
|
|
|
|
|
|
|
|
|
|
|
|
(288) |
|
|
Income tax expense |
|
|
|
|
|
|
|
|
|
|
|
|
|
|
(14,190) |
|
|
Income from continuing operations |
|
|
|
|
|
|
|
|
|
|
|
|
|
|
33,076 |
|
|
Loss from discontinued operations, net of income taxes |
|
|
|
|
|
|
|
|
|
|
|
|
|
|
(186) |
|
|
Net income |
|
|
|
|
|
|
|
|
|
|
|
|
|
$ |
32,890 |
|
|
Capital expenditures |
|
$ |
25,249 |
|
$ |
3,688 |
|
$ |
14 |
|
$ |
2,468 |
|
$ |
31,419 |
|
3.Acquisitions
Roofing Businesses – On November 13, 2015, Headwaters acquired 100% of the equity interests in several related companies, together which comprise a stone-coated metal roofing business located in California known as Metro Roof Products. On December 3, 2015, Headwaters acquired certain assets and assumed certain liabilities of Enviroshake Inc., a Canadian company that manufactures and sells composite roofing products, primarily in the U.S. and Canada. These acquisitions are expected to expand Headwaters’ presence in the niche roofing products sector.
Combined consideration paid for the two roofing acquisitions, net of cash acquired, was approximately $57.0 million. Direct acquisition costs were not material. Results of operations are being reported within the building products segment and have been included with Headwaters’ consolidated results beginning November 13, 2015 and December 3, 2015, respectively.
Metro is a manufacturer of stone-coated metal roofing materials in the U.S., selling products with an aesthetic resemblance to tile, shake, slate, or asphalt, but which offer the strength and durability of steel. Metro sells to both distributors and contractors. Enviroshake manufactures composite roofing products that replicate the look of cedar shake, cedar shingle and slate and uses a direct distribution model to market and sell its products to customers. The acquisitions of Metro and Enviroshake increase the number of specialty niche roofing products that Headwaters provides to its core customers and is an area of continuing focus for Headwaters.
The roofing acquisitions have been accounted for as business combinations in accordance with the requirements of ASC 805 Business Combinations. The following table sets forth the combined estimated fair values of assets acquired and liabilities assumed for the acquisitions as of the acquisition dates, using available information and assumptions Headwaters deems to be reasonable at the current time. Headwaters is in the process of finalizing all of
10
HEADWATERS INCORPORATED
NOTES TO CONDENSED CONSOLIDATED FINANCIAL STATEMENTS
June 30, 2016
(Unaudited)
the estimated amounts shown below, including the third-party valuations of the fair values of the acquired intangible assets; therefore, the provisional measurements shown in the table are subject to change.
|
|
|
(in thousands) |
|
|
|
Current assets |
|
$ |
7,401 |
|
|
Current liabilities |
|
|
(1,326) |
|
|
Property, plant and equipment |
|
|
1,411 |
|
|
Intangible assets: |
|
|
|
|
|
Customer relationships (12-year life) |
|
|
8,040 |
|
|
Trade names (indefinite life) |
|
|
5,566 |
|
|
Intellectual property (indefinite life) |
|
|
9,800 |
|
|
Goodwill |
|
|
26,103 |
|
|
Net assets acquired |
|
$ |
56,995 |
|
The process of identifying and valuing the intangible assets that were acquired has not been completed. When those intangible assets have been identified and valued, and estimated useful lives are determined, amortization of the intangible assets will be adjusted effective as of the acquisition dates. Future growth attributable to such things as new customers, geographic presence and assembled workforce are additional assets that are not separable and which contributed to recorded goodwill, most of which is expected to be tax deductible over a 15-year period.
Synthetic Materials – On March 17, 2016, Headwaters acquired 100% of the equity interests in a synthetic gypsum processing and marketing business known as Synthetic Materials, LLC (SynMat), with operations in several locations in the Eastern U.S. This acquisition is expected to expand Headwaters’ presence in the CCP industry.
Consideration paid on the date of acquisition, net of cash acquired, was approximately $33.2 million, which is subject to adjustment for the final calculation of acquisition-date working capital. The working capital adjustment is currently expected to be finalized in the September 2016 quarter. In addition to the net cash paid as of the acquisition date, approximately $12.0 million of liabilities have been recorded for future estimated payments, all of which are expected to be made within 12 months from the acquisition date. Direct acquisition costs were not material. Results of operations are being reported within the construction materials segment and have been included with Headwaters’ consolidated results beginning March 17, 2016.
Synthetic gypsum is used as a substitute for mined gypsum with application in the manufacture of wallboard and cement and as an agricultural soil amendment, among other uses. SynMat is a leading processor of synthetic gypsum and Headwaters expects marketing and operational synergies in the combination of Headwaters' current CCP operations with those of SynMat.
The SynMat acquisition has been accounted for as a business combination in accordance with the requirements of ASC 805 Business Combinations. The following table sets forth the estimated fair values of assets acquired and liabilities assumed as of the acquisition date, using available information and assumptions Headwaters deems to be reasonable at the current time. Headwaters is in the process of finalizing all of the estimated amounts shown below, including the third-party valuations of the fair values of the acquired intangible assets; therefore, the provisional measurements shown in the table are subject to change.
|
|
|
(in thousands) |
|
|
|
Current assets |
|
$ |
4,210 |
|
|
Current liabilities |
|
|
(1,453) |
|
|
Property, plant and equipment |
|
|
3,258 |
|
|
Intangible assets: |
|
|
|
|
|
Contracts (20-year life) |
|
|
17,370 |
|
|
Customer relationships (15-year life) |
|
|
2,880 |
|
|
Trade names (indefinite life) |
|
|
5,650 |
|
|
Goodwill |
|
|
13,249 |
|
|
Net assets acquired |
|
$ |
45,164 |
|
11
HEADWATERS INCORPORATED
NOTES TO CONDENSED CONSOLIDATED FINANCIAL STATEMENTS
June 30, 2016
(Unaudited)
The process of identifying and valuing the intangible assets that were acquired is in the early stages. When those intangible assets have been identified and valued, and estimated useful lives are determined, amortization of the intangible assets will be adjusted effective as of the acquisition date. Future growth attributable to such things as new customers, geographic presence and assembled workforce are additional assets that are not separable and which contributed to recorded goodwill, all of which is expected to be tax deductible over a 15-year period.
Other – During the March 2016 quarter, Headwaters acquired certain decking manufacturing assets for cash consideration of approximately $6.3 million. The assets are being relocated to one of Headwaters’ current manufacturing sites. This acquisition provides an opportunity to expand distribution to existing customers, develop additional decking related products, and increase Headwaters’ product and manufacturing expertise. During the June 2016 quarter, Headwaters’ minority-owned subsidiary acquired for cash consideration of $10.4 million all of the equity interests in several related companies, together which comprise a concrete roof tile business which Headwaters will continue to operate in Florida. This acquisition is expected to expand Headwaters’ presence in that niche roofing sector.
Subsequent to June 30, 2016, Headwaters entered into a definitive agreement, subject to certain closing conditions, to acquire substantially all the assets and certain liabilities of Krestmark Industries, L.P. and its affiliates for $240.0 million, subject to adjustments. Krestmark is a manufacturer of high quality vinyl windows, selling to a diverse customer base of homebuilders, lumber yards and distributors in the South Central region of the U.S. Headwaters believes Krestmark fits well into its strategy of increasing sales to core customers, with a strong focus on customer service and niche positioning. Headwaters intends to finance the acquisition by borrowing.
Combined Financial Information – No revenue or earnings from the acquired businesses described above are included in Headwaters’ Statements of Income for the 2015 periods. The actual revenue from the acquired businesses included in Headwaters’ Statements of Income for the three and nine months ended June 30, 2016 was approximately $15.6 million and $22.2 million, respectively. The actual earnings (loss) from the acquired businesses included in Headwaters’ Statements of Income for the three and nine months ended June 30, 2016 was approximately $0.9 million and $(0.4) million, respectively.
The following unaudited information presents the pro forma consolidated revenue and net income for Headwaters for the periods indicated as if the 2016 acquisitions had been included in Headwaters’ consolidated results of operations beginning October 1, 2014.
|
|
|
|
Three months ended |
|
|
Nine months ended |
|
||||||
|
|
|
|
June 30, |
|
|
June 30, |
|
||||||
|
Unaudited (in thousands) |
|
2015 |
|
2016 |
|
2015 |
|
2016 |
|
||||
|
|
|
|
|
|
|
|
|
|
|
|
|
|
|
|
Pro forma revenue |
|
$ |
262,730 |
|
$ |
262,766 |
|
$ |
669,483 |
|
$ |
702,300 |
|
|
Pro forma net income |
|
$ |
26,179 |
|
$ |
17,830 |
|
$ |
8,461 |
|
$ |
33,579 |
|
The above unaudited pro forma results have been calculated by combining the historical results of Headwaters and the acquired businesses as if all acquisitions had occurred as of the beginning of the fiscal year prior to the acquisition dates, and then adjusting the income tax provisions as if they had been calculated on the resulting, combined results. The pro forma results include estimates for intangible asset amortization and therefore will change when the final intangible asset values and useful lives have been determined.
The pro forma results reflect elimination of the following expenses that were incurred in the nine months ended June 30, 2016 (since for purposes of the pro forma presentation they have been reflected in 2015 instead of in 2016): $0.5 million of direct acquisition costs and $0.5 million of nonrecurring expense related to the fair value adjustments to acquisition-date inventories. For all periods presented, historical depreciation and amortization expense of the acquired companies was adjusted to reflect the acquisition date fair value amounts of the related tangible assets. No other material pro forma adjustments were deemed necessary, either to conform the acquisitions to Headwaters’ accounting policies or for any other situation. The pro forma information is not necessarily indicative of the results that would have been achieved had the transactions occurred on the date indicated or that may be achieved in the future.
12
HEADWATERS INCORPORATED
NOTES TO CONDENSED CONSOLIDATED FINANCIAL STATEMENTS
June 30, 2016
(Unaudited)
Non-controlling Interest in Consolidated Subsidiary – In fiscal 2014, Headwaters acquired 80% of the equity interests of Entegra, and the non-controlling owners have the right to require Headwaters to acquire the non-controlling 20% equity interest. This put right is not deemed to be a freestanding financial instrument and because it is not solely within the control of Headwaters, the non-controlling interest does not qualify as permanent equity and has been reported outside the stockholders’ equity section of the balance sheet as temporary, or mezzanine, equity. The value of the non-controlling interest was affected by the lack of control as well as the estimated fair values of the put and call rights.
Because there is no fixed redemption date for the put right, Headwaters compares the carrying value of the non-controlling interest to its estimated redemption value. The estimated redemption value is calculated based on a prescribed EBITDA formula to determine the price that would be paid if the put right were to have been exercised at the end of the reporting period. If applicable, the carrying amount is increased, but not decreased, to the estimated redemption value. The following table summarizes the activity of the non-controlling interest during the nine months ended June 30, 2016:
|
|
|
(in thousands) |
|
|
|
Balance as of September 30, 2015 |
|
$ |
12,431 |
|
|
Net income attributable to non-controlling interest |
|
|
848 |
|
|
Dividends paid to non-controlling interest |
|
|
(735) |
|
|
Balance as of June 30, 2016 |
|
$ |
12,544 |
|
4.Discontinued Operations
In 2011, the Board of Directors committed to a plan to sell Headwaters’ coal cleaning business, which was part of the energy technology segment. At that time the business met all of the criteria for classification as held for sale and presentation as a discontinued operation. Following the sale of all remaining coal cleaning facilities in 2013, there are no remaining assets held for sale.
The results of operations for the coal cleaning business have been presented as discontinued operations for all periods presented and certain summarized information for the discontinued business is shown in the following table:
|
|
|
|
Three Months Ended |
|
|
Nine Months Ended |
|
||||||
|
|
|
June 30, |
|
June 30, |
|
||||||||
|
(in thousands) |
|
2015 |
|
2016 |
|
2015 |
|
2016 |
|
||||
|
Gain (loss) from operations of discontinued operations before income taxes |
|
$ |
(132) |
|
$ |
440 |
|
$ |
(168) |
|
$ |
2,781 |
|
|
Gain (loss) on disposal |
|
|
22 |
|
|
(32) |
|
|
(219) |
|
|
(3,072) |
|
|
Income tax benefit (provision) |
|
|
0 |
|
|
(150) |
|
|
0 |
|
|
105 |
|
|
Income (loss) from discontinued operations, net of income taxes |
|
$ |
(110) |
|
$ |
258 |
|
$ |
(387) |
|
$ |
(186) |
|
The gain (loss) from operations reflected in the table above represents primarily the activity related to certain litigation which commenced prior to disposal of the business. Certain of this litigation was settled favorably to Headwaters during the March 2016 quarter, resulting in a gain. In accordance with terms of the settlement agreement, Headwaters received additional consideration in the June 2016 quarter and could receive additional cash receipts in the future, dependent primarily upon future coal sales by the buyer. These potential cash receipts, including the above revenue amounts, are being recognized in the periods when received.
Headwaters sold all of its coal cleaning facilities in 2012 and 2013, and recognized estimated gains on the sales dates. Subsequent to the dates of sale, adjustments of the previously recognized estimated gains on the sales transactions have been recorded, including the reported amounts reflected in the table. Headwaters currently expects that additional adjustments to the recognized gains and losses may be recorded in the future as certain contingencies are resolved. For all sales transactions, a majority of the consideration was in the form of potential production royalties and deferred purchase price, which amounts are dependent upon future plant production levels. Potential future production royalties and deferred purchase price on the sales transactions were not considered as being
13
HEADWATERS INCORPORATED
NOTES TO CONDENSED CONSOLIDATED FINANCIAL STATEMENTS
June 30, 2016
(Unaudited)
probable in the original gain calculations and are being accounted for in the periods if and when any such amounts are received.
In accordance with the terms of the asset purchase agreement for one of the sales transactions, the buyer of the coal cleaning facilities agreed to assume the lease and reclamation obligations related to certain of the facilities. Subsequent to the date of sale, the Headwaters subsidiaries which sold the facilities amended the purchase agreement to provide the buyer with additional time to make payments, as well as fulfill contractual requirements related to the assumed reclamation obligations. One of Headwaters’ subsidiaries is currently performing permit reclamation responsibilities at one site. As of September 30, 2015 and June 30, 2016, approximately $7.4 million and $9.6 million, respectively, was accrued for this reclamation liability.
Headwaters currently expects to continue to reflect as discontinued operations all activity related to the former coal cleaning business, at least until such time as the significant reclamation obligation is satisfied.
5.Inventories
Inventories consisted of the following at:
|
(in thousands) |
|
September 30, 2015 |
|
June 30, 2016 |
|
||
|
|
|
|
|
|
|
|
|
|
Raw materials |
|
$ |
12,831 |
|
$ |
17,440 |
|
|
Finished goods |
|
|
42,243 |
|
|
48,244 |
|
|
|
|
$ |
55,074 |
|
$ |
65,684 |
|
6.Intangible Assets
The following table summarizes the gross carrying amounts and related accumulated amortization of intangible assets as of:
|
|
|
|
|
|
|
|
September 30, 2015 |
|
June 30, 2016 |
|
||||||||
|
|
|
|
|
|
|
|
Gross |
|
|
|
|
Gross |
|
|
|
|
||
|
|
|
Estimated |
|
Carrying |
|
Accumulated |
|
Carrying |
|
Accumulated |
|
|||||||
|
(in thousands of dollars) |
|
useful lives |
|
Amount |
|
Amortization |
|
Amount |
|
Amortization |
|
|||||||
|
Trade names |
|
Indefinite |
|
$ |
15,300 |
|
$ |
— |
|
$ |
27,785 |
|
$ |
— |
|
|||
|
Intellectual property |
|
Indefinite |
|
|
— |
|
|
— |
|
|
10,650 |
|
|
— |
|
|||
|
CCP contracts |
|
15 |
- |
20 |
years |
|
|
112,300 |
|
|
69,875 |
|
|
129,670 |
|
|
74,391 |
|
|
Customer relationships |
|
5 |
- |
17 |
years |
|
|
109,078 |
|
|
57,844 |
|
|
120,729 |
|
|
64,129 |
|
|
Trade names |
|
5 |
- |
20 |
years |
|
|
66,960 |
|
|
36,554 |
|
|
66,960 |
|
|
39,097 |
|
|
Patents and patented technologies |
|
5 |
- |
19 |
years |
|
|
14,526 |
|
|
12,574 |
|
|
15,021 |
|
|
12,731 |
|
|
Other |
|
5 |
- |
17 |
years |
|
|
4,585 |
|
|
2,184 |
|
|
4,685 |
|
|
2,519 |
|
|
|
|
|
|
|
|
|
$ |
322,749 |
|
$ |
179,031 |
|
$ |
375,500 |
|
$ |
192,867 |
|
The above table includes preliminary amounts for the intangible assets acquired in 2016 because the process of identifying and valuing those assets is in the early stages. Total amortization expense related to intangible assets was approximately $4.6 million and $5.0 million for the June 2015 and 2016 quarters, respectively, and approximately $13.6 million and $14.4 million for the nine months ended June 30, 2015 and 2016, respectively.
Total estimated annual amortization expense for 2016 through 2021 is shown in the following table; however, the amounts will change once the intangible assets for the recent acquisitions are identified and valuations are finalized.
14
HEADWATERS INCORPORATED
NOTES TO CONDENSED CONSOLIDATED FINANCIAL STATEMENTS
June 30, 2016
(Unaudited)
|
Year ending September 30: |
|
(in thousands) |
|
|
|
2016 |
|
$ |
19,333 |
|
|
2017 |
|
|
18,936 |
|
|
2018 |
|
|
18,891 |
|
|
2019 |
|
|
17,869 |
|
|
2020 |
|
|
13,635 |
|
|
2021 |
|
|
13,574 |
|
7.Long-term Debt
The total undiscounted face amount of Headwaters’ outstanding long-term debt was approximately $573.9 million as of September 30, 2015 and $567.0 million as of June 30, 2016. As of those dates, the discounted carrying value of long-term debt consisted of the following:
|
|
|
September 30, |
|
June 30, |
|
||
|
(in thousands) |
|
2015 |
|
2016 |
|
||
|
Senior secured term loan, due March 2022 (face amount $423,938 as of September 30, 2015 and $420,750 as of June 30, 2016) |
|
$ |
414,490 |
|
$ |
412,426 |
|
|
7¼% Senior notes, due January 2019 (face amount $150,000 as of September 30, 2015 and $146,250 as of June 30, 2016) |
|
|
147,840 |
|
|
144,622 |
|
|
Carrying amount of long-term debt, net of discounts and debt issue costs |
|
|
562,330 |
|
|
557,048 |
|
|
Less current portion |
|
|
(4,250) |
|
|
(4,250) |
|
|
Long-term debt |
|
$ |
558,080 |
|
$ |
552,798 |
|
Senior Secured Term Loan – In March 2015, Headwaters entered into a Term Loan Facility, under which a senior secured loan for $425.0 million was obtained. The loan will mature in March 2022, subject to certain exceptions described below. The Term Loan Facility requires scheduled quarterly repayments in an aggregate annual amount equal to 1.0% of the original principal amount (subject to reduction for certain permitted prepayments), with the balance due at maturity. In the event that in October 2018 Headwaters has more than $50.0 million outstanding of the 7¼% senior notes and has not received a binding commitment to refinance those notes, the maturity date of the Term Loan Facility will be October 2018.
The Term Loan Facility allows Headwaters to request one or more incremental term loans and certain other types of incremental debt in an aggregate amount not to exceed $150.0 million plus an additional amount which is dependent on Headwaters’ pro forma net leverage ratio, as defined. Any additional borrowings are contingent upon the receipt of commitments by existing or additional lenders.
Borrowings under the Term Loan Facility bear interest at a rate equal to, at Headwaters’ option, either (a) a base rate determined by reference to the highest of (i) the publicly announced prime rate of the administrative agent, (ii) the federal funds rate plus 0.50%, and (iii) the eurocurrency (LIBO) rate for a one-month interest period plus 1.0%, subject in all cases to a 2.0% floor; or (b) a eurocurrency (LIBO) rate determined by reference to the cost of funds for eurocurrency deposits in dollars, subject to a 1.0% floor; plus, in each case, an applicable margin of 3.0% for any eurocurrency loan and 2.0% for any alternate base rate loan. Interest is payable quarterly, and as of June 30, 2016, the interest rate on borrowings under the Term Loan Facility was 4.0%.
Headwaters may voluntarily repay outstanding loans under the Term Loan Facility at any time without premium or penalty, other than customary breakage costs with respect to LIBO rate loans, which shall be subject to a prepayment premium of 1.0%. The Term Loan Facility requires Headwaters to prepay outstanding term loans, subject to certain exceptions, with (i) up to 50% of Headwaters’ annual excess cash flow, as defined, to the extent such excess cash flow exceeds $1.0 million, commencing with fiscal year 2016, with such required prepayment to be reduced by the amount of voluntary prepayments of term loans and certain other types of senior secured debt; (ii) 100% of the net cash proceeds of certain non-ordinary course asset sales; and (iii) 100% of the net cash proceeds of certain issuances of debt. Headwaters was not required to make any prepayments under these requirements during the nine months ended June 30, 2016.
15
HEADWATERS INCORPORATED
NOTES TO CONDENSED CONSOLIDATED FINANCIAL STATEMENTS
June 30, 2016
(Unaudited)
The Term Loan Facility is secured by substantially all assets of Headwaters, except that the obligations have a second priority position with respect to the assets that secure Headwaters’ ABL Revolver, primarily consisting of certain trade receivables and inventories of Headwaters’ building products and construction materials segments. The Term Loan Facility contains customary covenants restricting the ability of Headwaters to incur additional debt and liens on assets, prepay future new subordinated debt, merge or consolidate with another company, sell all or substantially all assets, make investments and pay dividends or distributions, among other things. The Term Loan Facility contains customary events of default, including with respect to a change in control of Headwaters. Headwaters was in compliance with all covenants as of June 30, 2016.
The net proceeds from the initial borrowing under the Term Loan Facility were approximately $414.7 million, after giving effect to original issue discount of approximately $2.1 million and transaction costs of approximately $8.2 million. The net proceeds from the original borrowing under the Term Loan Facility were primarily used to pay the redemption price for all of the outstanding 7-5/8% senior secured notes.
7¼% Senior Notes – In December 2013, Headwaters issued $150.0 million of 7¼% senior notes for net proceeds of approximately $146.7 million. The 7¼% notes are unsecured, mature in January 2019 and bear interest at a rate of 7.25%, payable semiannually. The notes are subordinate in priority to the senior secured Term Loan Facility described above and the ABL Revolver described below, to the extent of the value of the assets securing such debt, and are senior to all other future subordinated debt. Pursuant to open market transactions during the March 2016 quarter, Headwaters repurchased and cancelled approximately $3.8 million of the 7¼% senior notes. Subsequent to June 30, 2016, Headwaters redeemed $47.25 million of these notes at a redemption price equal to 103.625% of the principal amount. The associated premiums and accelerated debt issue costs for both transactions were charged to interest expense.
Headwaters can redeem the 7¼% notes, in whole or in part, at redemption prices that decline over time from 103.625% to 100.0%, depending on the redemption date. If there is a change in control, Headwaters will be required to offer to purchase the notes from holders at a purchase price equal to 101% of the principal amount. The 7¼% notes limit Headwaters in the incurrence of additional debt and liens on assets, prepayment of subordinated debt, merging or consolidating with another company, selling all or substantially all assets, making investments and the payment of dividends or distributions, among other things. Headwaters was in compliance with all covenants as of June 30, 2016.
ABL Revolver – Since entering into the ABL Revolver, Headwaters has not borrowed any funds under the arrangement and has no borrowings outstanding as of June 30, 2016. Availability under the ABL Revolver cannot exceed $70.0 million, which includes a $35.0 million sub-line for letters of credit and a $10.5 million swingline facility. Availability under the ABL Revolver is further limited by the borrowing base valuations of the assets of Headwaters’ building products and construction materials segments which secure the borrowings, currently consisting of certain trade receivables and inventories. In addition to the first lien position on these assets, the ABL Revolver lenders have a second priority position on substantially all other assets of Headwaters.
As of June 30, 2016, Headwaters had secured letters of credit under the ABL Revolver of approximately $8.3 million for various purposes and had availability under the ABL Revolver of approximately $59.7 million. The ABL Revolver terminates in March 2020. There is a contingent provision for early termination at any time within three months prior to the earliest maturity date of the senior secured Term Loan Facility or the 7¼% senior notes, at which time any amounts borrowed must be repaid.
Outstanding borrowings under the ABL Revolver accrue interest at Headwaters’ option, at either i) the London Interbank Offered Rate (LIBOR) plus 1.5%, 1.75% or 2.0%, depending on Headwaters’ average net excess availability under the ABL; or ii) the “Base Rate” plus 0.25%, 0.5% or 0.75%, again depending on average net excess availability. The base rate is subject to a floor equal to the highest of i) the prime rate, ii) the federal funds rate plus 0.5%, and iii) the 30-day LIBO rate plus 1.0%. Fees on the unused portion of the ABL Revolver range from 0.25% to 0.375%, depending on the amount of the credit facility which is utilized. If there would have been borrowings outstanding under the ABL Revolver as of June 30, 2016, the interest rate on those borrowings would have been approximately 2.2%.
16
HEADWATERS INCORPORATED
NOTES TO CONDENSED CONSOLIDATED FINANCIAL STATEMENTS
June 30, 2016
(Unaudited)
The ABL Revolver contains restrictions and covenants common to such agreements, including limitations on the incurrence of additional debt and liens on assets, prepayment of subordinated debt, merging or consolidating with another company, selling assets, making acquisitions and investments and the payment of dividends or distributions, among other things. In addition, if availability under the ABL Revolver is less than 12.5%, Headwaters is required to maintain a monthly fixed charge coverage ratio of at least 1.0x for the preceding twelve-month period. Headwaters was in compliance with all covenants as of June 30, 2016.
7-5/8% Senior Secured Notes – In 2011, Headwaters issued $400.0 million of 7-5/8% senior secured notes. In March 2015, Headwaters irrevocably deposited with the trustee of the notes an amount sufficient to pay and discharge all obligations under the notes and the related indenture, which discharge the trustee acknowledged. This discharge resulted in a loss on extinguishment of debt of approximately $21.3 million, comprised of the early repayment premium of approximately $15.3 million, interest to the April 2015 redemption date totaling approximately $2.5 million, and accelerated amortization of unamortized debt issue costs of approximately $3.5 million. The loss on debt extinguishment is reflected as interest expense in Headwaters’ Statements of Income for 2015.
Convertible Senior Subordinated Notes – Pursuant to open market transactions in February 2015, Headwaters repurchased and canceled substantially all of the outstanding 8.75% convertible senior subordinated notes, aggregating approximately $49.0 million. Premiums and accelerated amortization of debt discount and debt issue costs aggregating approximately $3.5 million were paid and charged to interest expense.
Headwaters’ Chairman and CEO was a holder of $1.16 million of the 8.75% notes, which holding was purchased in the open market. Due to immateriality, the remaining balance of these convertible notes was included with other accrued liabilities in the consolidated balance sheet as of September 30, 2015. The notes matured in the March 2016 quarter in normal course and were repaid.
Interest and Debt Maturities – During the June 2015 and 2016 quarters, Headwaters incurred total interest costs of approximately $8.2 million and $9.4 million, respectively, including approximately $0.6 million of non-cash interest expense in both quarters. During the nine months ended June 30, 2015 and 2016, Headwaters incurred total interest costs of approximately $56.5 million and $26.2 million, respectively, including approximately $5.6 million and $1.7 million, respectively, of non-cash interest expense. As described above, approximately $21.3 million of interest expense incurred in the 2015 periods resulted from the early repayment of the 7-5/8% senior secured notes. Neither capitalized interest nor interest income was material for any period presented.
The weighted-average interest rate on the face amount of outstanding long-term debt, excluding amortization of debt discount and debt issue costs, was approximately 5.2% at September 30, 2015 and 4.8% at June 30, 2016. The decrease in the weighted-average interest rate as of June 30, 2016 was due to a repricing of the secured term loan debt in June 2016 which resulted in a decrease in the annual interest rate on this debt of 0.5%. Except for the required repayments of the Term Loan Facility of approximately $1.1 million per quarter, Headwaters has no debt maturities until January 2019.
8.Fair Value of Financial Instruments
Headwaters’ material financial instruments consist primarily of cash and cash equivalents, trade receivables, accounts payable and long-term debt. All of these financial instruments except some long-term debt are either carried at fair value in the consolidated balance sheets or are short-term in nature. Accordingly, the carrying values for those financial instruments as reflected in the consolidated balance sheets closely approximate their fair values.
As of September 30, 2015 and June 30, 2016, only the 7¼% senior notes have a fixed rate and the aggregate fair value of this debt as of September 30, 2015 would have been approximately $156.4 million, compared to a carrying value of $147.8 million. As of June 30, 2016, the aggregate fair value of this debt would have been approximately $151.0 million, compared to a carrying value of $144.6 million.
Fair value “Level 2” estimates for long-term debt were based primarily on price estimates from broker-dealers.
17
HEADWATERS INCORPORATED
NOTES TO CONDENSED CONSOLIDATED FINANCIAL STATEMENTS
June 30, 2016
(Unaudited)
9.Income Taxes
Headwaters’ estimated effective income tax rate for continuing operations for the fiscal year ending September 30, 2016, exclusive of discrete items, is currently expected to be approximately 39%. This estimated rate was used to record income taxes for the nine months ended June 30, 2016. For the nine months ended June 30, 2015, Headwaters used an estimated effective income tax rate for continuing operations of 12%. Headwaters also recognized tax benefit for discrete items of $1.3 million in 2015 and $4.2 million in 2016 which did not affect the calculation of the estimated effective income tax rates for the respective fiscal years. The discrete items were due primarily to unrecognized state income tax benefits that were reversed due to audit periods that closed and changes to prior year estimated amounts for research and development tax credits.
Beginning in 2011 and until September 2015, Headwaters recorded a full valuation allowance on its net amortizable deferred tax assets and accordingly, did not recognize benefit for tax credit carryforwards, net operating loss (NOL) carryforwards or other deferred tax assets for 2015. The estimated income tax rate of 12% for fiscal 2015 resulted primarily from the combination of recognizing benefit for deferred tax assets only to the extent of projected fiscal year earnings, plus current state income taxes in certain state jurisdictions where taxable income was expected to be generated.
As of June 30, 2016, Headwaters’ U.S. and state NOL and capital loss carryforwards totaled approximately $51.4 million (tax effected). The NOLs expire from 2016 to 2035. In addition, there are approximately $28.0 million of tax credit carryforwards as of June 30, 2016, which expire from 2028 to 2035.
The calculation of tax liabilities involves uncertainties in the application of complex tax regulations in multiple tax jurisdictions. Headwaters currently has open tax years subject to examination by the IRS and state tax authorities for the years 2012 through 2015. Headwaters recognizes potential liabilities for anticipated tax audit issues in the U.S. and state tax jurisdictions based on estimates of whether, and the extent to which, additional taxes and interest will be due. If events occur (or do not occur) as expected and the payment of these amounts ultimately proves to be unnecessary, the reversal of the liabilities would result in tax benefits being recognized in the period when it is determined the liabilities are no longer required to be recorded in the consolidated financial statements. If the estimate of tax liabilities proves to be less than the ultimate assessment, a further charge to expense would result. It is reasonably possible that the amount of Headwaters’ unrecognized income tax benefits could change significantly within the next 12 months. These changes could be the result of Headwaters’ ongoing tax audits, the settlement of outstanding audit issues or the lapse of tax statutes of limitation. However, due to the issues being examined, at the current time, an estimate of the range of reasonably possible outcomes cannot be made, beyond amounts currently accrued.
10.Equity Securities and Stock-Based Compensation
Treasury Shares Held for Deferred Compensation Obligation – In accordance with the terms of the Directors’ Deferred Compensation Plan (DDCP), non-employee directors can elect to defer certain compensation and choose from various options how the deferred compensation will be invested. One of the investment options is Headwaters common stock. When a director chooses Headwaters stock as an investment option, Headwaters purchases the common stock in accordance with the director’s request and holds the shares until such time as the deferred compensation obligation becomes payable, normally when the director retires from the Board. At such time, the shares held by Headwaters are distributed to the director in satisfaction of the obligation. Headwaters accounts for the purchase of common stock as treasury stock, at cost. The corresponding deferred compensation obligation is reflected in capital in excess of par value. Changes in the fair value of the treasury stock are not recognized. As of June 30, 2016, the treasury stock and related deferred compensation obligation had fair values of approximately $1.8 million, which was $0.5 million higher than the carrying values at cost.
Stock-Based Compensation – In the December 2015 quarter, the Compensation Committee of Headwaters’ Board of Directors (the Committee) approved the grant of approximately 0.3 million stock-based awards to officers and employees. The awards were granted under the stockholder-approved 2010 Incentive Compensation Plan, and vest over an approximate three-year period. Vesting is also subject to achievement of a 12-month Adjusted EBITDA
18
HEADWATERS INCORPORATED
NOTES TO CONDENSED CONSOLIDATED FINANCIAL STATEMENTS
June 30, 2016
(Unaudited)
target equal to the sum of capital expenditures plus 1.5 times cash interest expense, measured at each quarter end beginning September 30, 2016 through the final vest date of September 30, 2018.
Stock-based compensation expense was approximately $0.7 million and $0.8 million for the June 2015 and 2016 quarters, respectively, and $2.1 million and $2.3 million for the nine months ended June 30, 2015 and 2016, respectively. As of June 30, 2016, there was approximately $3.3 million of total compensation cost related to unvested awards not yet recognized, which will be recognized in future periods in accordance with applicable vesting terms.
Shelf Registration – In August 2015, Headwaters filed a universal shelf registration statement with the SEC. A prospectus supplement describing the terms of any future securities to be issued is required to be filed before any offering can commence under the registration statement.
11.Earnings Per Share
The following table sets forth the computations of basic and diluted EPS for the years indicated, reflecting the amounts attributable to Headwaters and excluding the amounts attributable to the non-controlling interest in Entegra. In accordance with ASC 260, income from continuing operations for each period is used as the control number in determining whether potentially dilutive common shares should be included in the diluted earnings per share computations for those periods, even when the effect of doing so is anti-dilutive to the other per-share amounts.
|
|
|
Three Months Ended |
|
Nine Months Ended |
|
||||||||
|
|
|
June 30, |
|
June 30, |
|
||||||||
|
(in thousands, except per-share amounts) |
|
2015 |
|
2016 |
|
2015 |
|
2016 |
|
||||
|
Numerator: |
|
|
|
|
|
|
|
|
|
|
|
|
|
|
Income from continuing operations |
|
$ |
23,118 |
|
$ |
17,527 |
|
$ |
5,281 |
|
$ |
33,076 |
|
|
Income from continuing operations attributable to non-controlling interest |
|
|
(191) |
|
|
(269) |
|
|
(695) |
|
|
(848) |
|
|
Numerator for basic and diluted earnings per share from continuing operations — income from continuing operations attributable to Headwaters Incorporated |
|
|
22,927 |
|
|
17,258 |
|
|
4,586 |
|
|
32,228 |
|
|
Numerator for basic and diluted earnings per share from discontinued operations — income (loss) from discontinued operations, net of income taxes |
|
|
(110) |
|
|
258 |
|
|
(387) |
|
|
(186) |
|
|
Numerator for basic and diluted earnings per share — net income attributable to Headwaters Incorporated |
|
$ |
22,817 |
|
$ |
17,516 |
|
$ |
4,199 |
|
$ |
32,042 |
|
|
|
|
|
|
|
|
|
|
|
|
|
|
|
|
|
Denominator: |
|
|
|
|
|
|
|
|
|
|
|
|
|
|
Denominator for basic earnings per share — weighted-average shares outstanding |
|
|
73,658 |
|
|
73,848 |
|
|
73,553 |
|
|
73,819 |
|
|
Effect of dilutive securities — shares issuable upon exercise of options and SARs and vesting of restricted stock |
|
|
2,386 |
|
|
1,609 |
|
|
2,146 |
|
|
1,569 |
|
|
Denominator for diluted earnings per share — weighted-average shares outstanding after assumed exercises and vesting |
|
|
76,044 |
|
|
75,457 |
|
|
75,699 |
|
|
75,388 |
|
|
|
|
|
|
|
|
|
|
|
|
|
|
|
|
|
Basic income per share attributable to Headwaters Incorporated: |
|
|
|
|
|
|
|
|
|
|
|
|
|
|
From continuing operations |
|
$ |
0.31 |
|
$ |
0.23 |
|
$ |
0.06 |
|
$ |
0.43 |
|
|
From discontinued operations |
|
|
0.00 |
|
|
0.00 |
|
|
0.00 |
|
|
0.00 |
|
|
|
|
$ |
0.31 |
|
$ |
0.23 |
|
$ |
0.06 |
|
$ |
0.43 |
|
|
Diluted income per share attributable to Headwaters Incorporated: |
|
|
|
|
|
|
|
|
|
|
|
|
|
|
From continuing operations |
|
$ |
0.30 |
|
$ |
0.23 |
|
$ |
0.06 |
|
$ |
0.43 |
|
|
From discontinued operations |
|
|
0.00 |
|
|
0.00 |
|
|
0.00 |
|
|
0.00 |
|
|
|
|
$ |
0.30 |
|
$ |
0.23 |
|
$ |
0.06 |
|
$ |
0.43 |
|
|
|
|
|
|
|
|
|
|
|
|
|
|
|
|
|
|
|
|
|
|
|
|
|
|
|
|
|
|
|
|
Anti-dilutive securities not considered in diluted EPS calculation: |
|
|
|
|
|
|
|
|
|
|
|
|
|
|
Stock-settled SARs |
|
|
160 |
|
|
255 |
|
|
1,625 |
|
|
280 |
|
|
Stock options |
|
|
72 |
|
|
0 |
|
|
94 |
|
|
24 |
|
|
Restricted stock |
|
|
0 |
|
|
0 |
|
|
88 |
|
|
0 |
|
19
HEADWATERS INCORPORATED
NOTES TO CONDENSED CONSOLIDATED FINANCIAL STATEMENTS
June 30, 2016
(Unaudited)
12.Commitments and Contingencies
Significant new commitments, material changes in commitments and ongoing contingencies as of June 30, 2016, not disclosed elsewhere, are as follows:
Compensation Arrangements – Cash Performance Unit Awards. The Compensation Committee has approved various grants of performance unit awards to certain officers and employees, to be settled in cash, based on the achievement of certain stipulated goals, all of which are described in detail in the Form 10-K, including fiscal 2016 grants made in the December 2015 quarter. Headwaters currently expects that amounts will be earned in fiscal 2016 under the terms of the fiscal 2016 awards. Also, as explained in the Form 10-K, the amounts accrued under the fiscal 2014 awards are subject to adjustment for cash flows generated in fiscal 2016 and the amounts accrued under the fiscal 2015 awards are subject to adjustment for cash flows generated in fiscal 2016 and 2017.
Cash-Settled SAR Grants. In 2012, the Committee approved grants to certain officers and employees of approximately 1.0 million cash-settled SARs, approximately 0.1 million of which remain outstanding as of June 30, 2016. These SARs, which are considered liability awards, vested in annual installments through September 30, 2014 and are settled in cash upon exercise by the employee. The SARs must be exercised on or before September 30, 2016, at which time they expire. As of June 30, 2016, approximately $1.4 million has been accrued for outstanding awards because the stock price at that date was above the grant-date stock price of $1.85. Changes in Headwaters’ stock price (whether positive or negative) through the dates employees exercise the SARs will result in adjustments to compensation expense and will be reflected in Headwaters’ Statement of Income in the September 2016 quarter. Compensation expense (credit) for all cash-settled SARs was approximately $2.9 million and $(0.1) million for the nine months ended June 30, 2015 and 2016, respectively.
Property, Plant and Equipment – As of June 30, 2016, Headwaters was committed to spend approximately $4.6 million on capital projects that were in various stages of completion.
Legal Matters – Headwaters has ongoing litigation and asserted claims which have been incurred during the normal course of business, including the specific matters discussed below. Headwaters intends to vigorously defend or resolve these matters by settlement, as appropriate. Management does not currently believe that the outcome of these matters will have a material adverse effect on Headwaters’ operations, cash flow or financial position.
Headwaters incurred approximately $1.7 million and $(1.8) million of expense (credit) for legal matters during the nine months ended June 30, 2015 and 2016, respectively. The 2016 amount includes the effect of settlement of certain litigation. Costs for outside legal counsel comprised a majority of all other Headwaters’ litigation-related costs in the periods presented. Headwaters currently believes the range of potential loss for all unresolved legal matters, excluding costs for outside counsel, is from $0 up to the amounts sought by claimants and therefore has recorded a liability of $0 as of June 30, 2016. The substantial claims and damages sought by claimants are not currently deemed to be probable. Headwaters’ outside counsel and management currently believe that unfavorable outcomes of outstanding litigation beyond the amount accrued are neither probable nor remote. Accordingly, management cannot express an opinion as to the ultimate amount, if any, of Headwaters’ liability, nor is it possible to estimate what litigation-related costs will be in future periods.
The specific matters discussed below raise difficult and complex legal and factual issues, and the resolution of these issues is subject to many uncertainties, including the facts and circumstances of each case, the jurisdiction in which each case is brought, and the future decisions of juries, judges, and arbitrators. Therefore, although management believes that the claims asserted against Headwaters in the named cases lack merit, there is a possibility of material losses in excess of the amount accrued if one or more of the cases were to be determined adversely against Headwaters for a substantial amount of the damages asserted. It is possible that a change in the estimate of probable liability could occur, and the changes could be material. Additionally, as with any litigation, these proceedings require that Headwaters incur substantial costs, including attorneys’ fees, managerial time and other personnel resources, in pursuing resolution.
Fentress Families Trust. VFL Technology Corporation (VFL), acquired by HRI in 2004, provides services related to fly ash management to Virginia Electric and Power Company (VEPCO). In February 2012, 383 plaintiffs, most of
20
HEADWATERS INCORPORATED
NOTES TO CONDENSED CONSOLIDATED FINANCIAL STATEMENTS
June 30, 2016
(Unaudited)
whom are residents living in the City of Chesapeake, Virginia, filed a complaint in the State of Virginia Chesapeake Circuit Court against 15 defendants, including VEPCO and related companies, and certain other persons associated with the Battlefield Golf Course, including owners, developers, contractors, and others, including VFL and Headwaters, alleging causes of action for nuisance and negligence. The complaint alleges that fly ash used to construct the golf course was carried in the air and contaminated surface water exposing plaintiffs to dangerous chemicals and causing personal injury and property damage. Plaintiffs’ complaint seeks injunctive relief and damages of approximately $850.0 million for removal and remediation of the fly ash and the water supply, $1.9 billion for vexation, $8.0 million and other unspecified amounts for personal injuries, and $55.0 million as damages to properties, plus prejudgment interest, attorney fees, and costs. In a related case, other plaintiffs have filed a separate lawsuit asserting the same claims against the same defendants claiming additional damages totaling approximately $307.2 million. In August 2013 the court ruled on VEPCO’s demurrer ordering that claims for personal injury or property damage based upon allegations of groundwater contamination were dismissed but that claims of nuisance and negligence based upon allegations of air-borne ash and contaminated surface water would not be dismissed. In March 2016, the court responded to VFL’s motion, ruling that (i) the statute of limitations barred nuisance claims of all plaintiffs who are not minors and who are not making personal injury claims, and (ii) emotional distress damages are not cognizable. In response, plaintiffs have moved to amend their complaints. All but seven Plaintiffs have asserted in discovery that they were not seeking personal injury damages except emotional distress. These cases are based on substantially the same alleged circumstances asserted in complaints filed by the plaintiffs in 2009 and voluntarily dismissed in 2010. Discovery is underway. HRI has filed claims for defense and indemnity with several of its insurers. In 2010, HRI filed suit in the United States District Court for the District of Utah against two insurers that denied coverage based on allegations in the 2009 Fentress complaints. The District Court ruled in the insurers’ favor, which ruling was affirmed in October 2014 by the United States Court of Appeals for the Tenth Circuit. Another insurer continues to pay for the defense of the underlying cases under a reservation of rights. The relatively novel fly ash claims of the plaintiffs together with multiple insurance policies and policy periods make insurance coverage issues complex and uncertain. Moreover, plaintiffs’ total claims exceed the potential limits of insurance available to HRI. Because resolution of the litigation is uncertain, legal counsel and management cannot express an opinion as to the ultimate amount, if any, of HRI’s liability, or the insurers’ obligation to indemnify HRI against loss, if any.
CPM. In August 2015, CPM Virginia, LLC (CPM) the Battlefield Golf Course developer, filed a complaint in the State of Virginia Richmond Circuit Court against VEPCO, VFL, and Headwaters related to construction of the golf course described in the Fentress Families Trust case. The complaint alleges breach of contract, fraud, misrepresentation, estoppel, nuisance, breach of warranties, negligence, and interference with prospective business advantage. CPM’s complaint seeks $840 million in compensatory damages plus attorney fees and costs.
In September 2015, CPM filed a separate complaint in the State of Virginia Chesapeake Circuit Court against VFL and Headwaters also related to construction of the golf course described in the Fentress Families Trust case, alleging breach of contract and seeking declaratory judgment and compensatory damages in the amount of $0.5 million plus attorney fees and costs. CPM alleges that HRI should indemnify CPM for past and future expenses incurred in defending against the Fentress complaints. Because resolution of the CPM litigation is uncertain, legal counsel and management cannot express an opinion as to the ultimate amount, if any, of VFL or Headwaters’ liability, or the insurers’ obligation to indemnify VFL and Headwaters against loss, if any.
Clary. In August 2014, 77 plaintiffs filed suit in the State of West Virginia Circuit Court of Mason County against four defendants, including American Electric Power Co., Inc., Ohio Power Company and an individual. Plaintiffs claim injury resulting from exposure to coal combustion waste from the Gavin Power Plant in Cheshire, Ohio while working as employees of contractors in the Gavin landfill. Plaintiffs claim wrongful death, failure to warn and protect, negligence per se, negligence, negligent infliction of emotional distress, heightened duty, strict liability, battery, fraud, fraudulent concealment, misrepresentation and related causes of action, seeking unspecified damages for medical monitoring and other costs, loss of consortium, lost wages, personal injuries, and punitive damages. In September 2015, the Ohio Power Company filed a third-party complaint against Headwaters and two other entities who were contractors to Ohio Power Company. Ohio Power Company claims that the third-party defendant contractors operated the Gavin landfill and that plaintiffs are former employees or family members of the third-party defendants. Ohio Power Company denies the plaintiffs’ allegations, but states that Headwaters and the other third-party defendants are required to indemnify Ohio Power and provide contribution to the extent that Ohio Power is
21
HEADWATERS INCORPORATED
NOTES TO CONDENSED CONSOLIDATED FINANCIAL STATEMENTS
June 30, 2016
(Unaudited)
found liable to plaintiffs, including interest, attorney fees, and costs. In April 2016, the case was reassigned to the State of West Virginia Circuit Court of Raleigh County Mass Litigation Panel. The court’s scheduling order has set trial to begin in September 2017. Because resolution of the litigation is uncertain, legal counsel and management cannot express an opinion as to the ultimate amount, if any, of Headwaters’ liability, or whether insurers have an obligation to indemnify Headwaters against loss, if any.
Building Products Matters. There are litigation and pending and threatened claims made against certain subsidiaries within Headwaters’ building products segment, with respect to several types of exterior finish systems manufactured and sold by its subsidiaries for application by contractors on residential and commercial buildings. The plaintiffs or claimants in these matters typically allege that the structures have suffered damage from water penetration due to some alleged failure of the roofing product or wall system. The claims most often involve alleged liabilities associated with certain roofing, stucco, and architectural stone products which are produced and sold by certain subsidiaries of Headwaters.
Building products litigation and claims typically cite damages for alleged personal injuries, property damage, economic loss, unfair business practices and punitive damages. Claims made against Headwaters and its subsidiaries generally have been paid by their insurers, subject to Headwaters’ payment of deductibles or self-insured retentions, although such insurance carriers typically have issued “reservation of rights” letters. There is no guarantee of insurance coverage or continuing coverage. These and future proceedings may result in substantial costs to Headwaters and its subsidiaries, including attorney fees, managerial time and other personnel resources and costs. Adverse resolution of these proceedings could have a materially negative effect on Headwaters’ businesses, financial condition, and results of operation, and its ability to meet its financial obligations. Although Headwaters carries general and product liability insurance, subject to exclusions and self-insured retentions, Headwaters cannot assure that such insurance coverage will remain available, that Headwaters’ insurance carriers will remain viable, will accept claims or that the insured amounts will cover all claims in excess of self-insured retentions. Future rate increases may also make such insurance uneconomical for Headwaters to maintain. Because resolution of the litigation, claims, and insurance coverage is uncertain, legal counsel and management cannot express an opinion as to the ultimate amount, if any, of Headwaters’ or its subsidiaries’ liability.
Construction Materials Matters. In addition, there are litigation and pending and threatened claims made against HRI within Headwaters’ construction materials segment, with respect to coal combustion products. The plaintiffs or claimants in these matters have alleged that inhalation or other exposure to fly ash is unsafe, and that HRI has failed to warn about the alleged dangers of fly ash exposure and the use of adequate protection, resulting in personal injury, contamination of land and water, and diminution in property value. The Fentress Family Trust and Clary cases summarized above are examples of these types of claims. The application of relatively novel fly ash claims to insurance policies is complex and uncertain and HRI has had limited success in tendering defense of such claims to insurers, which is dependent upon the alleged facts and specific policy terms. Adverse resolution of these claims and insurance coverage disputes could have a materially negative effect on Headwaters’ businesses, financial condition, and results of operation, and its ability to meet its financial obligations. Because resolution of the litigation, claims, and insurance coverage disputes is uncertain, legal counsel and management cannot express an opinion as to the ultimate amount, if any, of HRI’s liability.
Discontinued Coal Cleaning Operations. The following litigation relates to the discontinued coal cleaning business:
RLF Chinook Properties. In September 2015, RLF Chinook Properties, LLC filed suit in the State of Indiana Circuit Court of Clay against Covol Fuels No. 2, LLC, Headwaters Energy Services Corp., other Covol companies (collectively, “Covol”), as well as BRC Chinook, LLC and other BRC affiliates (collectively, “BRC”). Covol entered into a coal recovery agreement with plaintiff in 2007 with respect to coal at the RLF Chinook site. Covol assigned the coal recovery agreement to BRC in 2013. Plaintiff alleges that BRC has failed to fulfill certain obligations under the coal recovery agreement, including failure to submit reclamation plans to State of Indiana for approval and to restore and reclaim the site per the approved plan. Plaintiff alleges that Covol is liable for the claimed breaches under the coal recovery agreement, and seeks unspecified damages, together with attorney fees and costs. Covol has answered the complaint denying the allegations. Because resolution of the litigation is uncertain, legal counsel and management cannot express an opinion as to the ultimate amount, if any, of Covol’s liability.
22
HEADWATERS INCORPORATED
NOTES TO CONDENSED CONSOLIDATED FINANCIAL STATEMENTS
June 30, 2016
(Unaudited)
Other. Headwaters and its subsidiaries are also involved in other legal proceedings that have arisen in the normal course of business. Because resolution of these proceedings is uncertain, legal counsel and management cannot express an opinion as to the ultimate amount, if any, of Headwaters’ liability.
13.Related Party Transaction
During the June 2016 quarter, the non-controlling owners in one of Headwaters’ subsidiaries loaned $1.6 million to the subsidiary. The loan bore interest at 1.5% and was repaid subsequent to June 30, 2016.
14.Condensed Consolidating Financial Information
Headwaters’ borrowings under the Term Loan Facility and the 7¼% senior notes are jointly and severally, fully and unconditionally guaranteed by Headwaters Incorporated and by substantially all of Headwaters’ 100%-owned domestic subsidiaries. Separate stand-alone financial statements and disclosures for Headwaters Incorporated and each of the guarantor subsidiaries are not presented because the guarantees are full and unconditional and the guarantor subsidiaries have joint and several liability.
There are no significant restrictions on the ability of Headwaters Incorporated to obtain funds from the guarantor subsidiaries nor on the ability of the guarantor subsidiaries to obtain funds from Headwaters Incorporated or other guarantor subsidiaries. Non-guaranteeing entities include subsidiaries that are not 100% owned, foreign subsidiaries and joint ventures in which Headwaters has a non-controlling ownership interest.
23
HEADWATERS INCORPORATED
NOTES TO CONDENSED CONSOLIDATED FINANCIAL STATEMENTS
June 30, 2016
(Unaudited)
CONDENSED CONSOLIDATING BALANCE SHEET — September 30, 2015
|
|
|
|
|
|
Non- |
|
|
|
|
Eliminations |
|
|
|
|
||
|
|
|
Guarantor |
|
guarantor |
|
Parent |
|
and |
|
Headwaters |
|
|||||
|
(in thousands) |
|
Subsidiaries |
|
Subsidiaries |
|
Company |
|
Reclassifications |
|
Consolidated |
|
|||||
|
ASSETS |
|
|
|
|
|
|
|
|
|
|
|
|
|
|
|
|
|
Current assets: |
|
|
|
|
|
|
|
|
|
|
|
|
|
|
|
|
|
Cash and cash equivalents |
|
$ |
25,819 |
|
$ |
3,577 |
|
$ |
113,201 |
|
$ |
— |
|
$ |
142,597 |
|
|
Trade receivables, net |
|
|
129,095 |
|
|
5,289 |
|
|
— |
|
|
— |
|
|
134,384 |
|
|
Inventories |
|
|
52,699 |
|
|
2,375 |
|
|
— |
|
|
— |
|
|
55,074 |
|
|
Current income taxes |
|
|
— |
|
|
— |
|
|
143,305 |
|
|
(142,976) |
|
|
329 |
|
|
Other |
|
|
10,666 |
|
|
144 |
|
|
1,017 |
|
|
— |
|
|
11,827 |
|
|
Total current assets |
|
|
218,279 |
|
|
11,385 |
|
|
257,523 |
|
|
(142,976) |
|
|
344,211 |
|
|
Property, plant and equipment, net |
|
|
164,413 |
|
|
9,978 |
|
|
11,327 |
|
|
— |
|
|
185,718 |
|
|
Other assets: |
|
|
|
|
|
|
|
|
|
|
|
|
|
|
|
|
|
Goodwill |
|
|
147,330 |
|
|
30,869 |
|
|
— |
|
|
— |
|
|
178,199 |
|
|
Intangible assets, net |
|
|
116,479 |
|
|
27,239 |
|
|
— |
|
|
— |
|
|
143,718 |
|
|
Investments in subsidiaries |
|
|
55,844 |
|
|
— |
|
|
372,864 |
|
|
(428,708) |
|
|
— |
|
|
Intercompany accounts and notes |
|
|
57,793 |
|
|
— |
|
|
637,046 |
|
|
(694,839) |
|
|
— |
|
|
Deferred income taxes |
|
|
— |
|
|
25,204 |
|
|
79,763 |
|
|
(12,115) |
|
|
92,852 |
|
|
Other |
|
|
11,243 |
|
|
2,291 |
|
|
20,787 |
|
|
— |
|
|
34,321 |
|
|
Total other assets |
|
|
388,689 |
|
|
85,603 |
|
|
1,110,460 |
|
|
(1,135,662) |
|
|
449,090 |
|
|
Total assets |
|
$ |
771,381 |
|
$ |
106,966 |
|
$ |
1,379,310 |
|
$ |
(1,278,638) |
|
$ |
979,019 |
|
|
|
|
|
|
|
|
|
|
|
|
|
|
|
|
|
|
|
|
LIABILITIES AND STOCKHOLDERS’ EQUITY |
|
|
|
|
|
|
|
|
|
|
|
|
|
|
|
|
|
Current liabilities: |
|
|
|
|
|
|
|
|
|
|
|
|
|
|
|
|
|
Accounts payable |
|
$ |
23,619 |
|
$ |
1,114 |
|
$ |
573 |
|
$ |
— |
|
$ |
25,306 |
|
|
Accrued personnel costs |
|
|
14,542 |
|
|
501 |
|
|
37,501 |
|
|
— |
|
|
52,544 |
|
|
Accrued interest |
|
|
— |
|
|
— |
|
|
2,295 |
|
|
— |
|
|
2,295 |
|
|
Current income taxes |
|
|
137,502 |
|
|
5,474 |
|
|
— |
|
|
(142,976) |
|
|
— |
|
|
Other accrued liabilities |
|
|
39,604 |
|
|
6,380 |
|
|
3,502 |
|
|
— |
|
|
49,486 |
|
|
Current portion of long-term debt |
|
|
— |
|
|
— |
|
|
4,250 |
|
|
— |
|
|
4,250 |
|
|
Total current liabilities |
|
|
215,267 |
|
|
13,469 |
|
|
48,121 |
|
|
(142,976) |
|
|
133,881 |
|
|
Long-term liabilities: |
|
|
|
|
|
|
|
|
|
|
|
|
|
|
|
|
|
Long-term debt, net |
|
|
— |
|
|
— |
|
|
558,080 |
|
|
— |
|
|
558,080 |
|
|
Income taxes |
|
|
15,091 |
|
|
— |
|
|
3,614 |
|
|
(12,115) |
|
|
6,590 |
|
|
Intercompany accounts and notes |
|
|
— |
|
|
178,179 |
|
|
516,660 |
|
|
(694,839) |
|
|
— |
|
|
Other |
|
|
1,481 |
|
|
13,897 |
|
|
14,808 |
|
|
— |
|
|
30,186 |
|
|
Total long-term liabilities |
|
|
16,572 |
|
|
192,076 |
|
|
1,093,162 |
|
|
(706,954) |
|
|
594,856 |
|
|
Total liabilities |
|
|
231,839 |
|
|
205,545 |
|
|
1,141,283 |
|
|
(849,930) |
|
|
728,737 |
|
|
Redeemable non-controlling interest in consolidated subsidiary |
|
|
— |
|
|
12,431 |
|
|
— |
|
|
— |
|
|
12,431 |
|
|
Stockholders’ equity: |
|
|
|
|
|
|
|
|
|
|
|
|
|
|
|
|
|
Common stock |
|
|
— |
|
|
— |
|
|
74 |
|
|
— |
|
|
74 |
|
|
Capital in excess of par value |
|
|
486,069 |
|
|
54,470 |
|
|
728,843 |
|
|
(540,715) |
|
|
728,667 |
|
|
Retained earnings (accumulated deficit) |
|
|
53,473 |
|
|
(165,480) |
|
|
(489,889) |
|
|
112,007 |
|
|
(489,889) |
|
|
Treasury stock |
|
|
— |
|
|
— |
|
|
(1,001) |
|
|
— |
|
|
(1,001) |
|
|
Total stockholders’ equity |
|
|
539,542 |
|
|
(111,010) |
|
|
238,027 |
|
|
(428,708) |
|
|
237,851 |
|
|
Total liabilities and stockholders’ equity |
|
$ |
771,381 |
|
$ |
106,966 |
|
$ |
1,379,310 |
|
$ |
(1,278,638) |
|
$ |
979,019 |
|
24
HEADWATERS INCORPORATED
NOTES TO CONDENSED CONSOLIDATED FINANCIAL STATEMENTS
June 30, 2016
(Unaudited)
CONDENSED CONSOLIDATING BALANCE SHEET — June 30, 2016
|
|
|
|
|
|
Non- |
|
|
|
|
Eliminations |
|
|
|
|
||
|
|
|
Guarantor |
|
guarantor |
|
Parent |
|
and |
|
Headwaters |
|
|||||
|
(in thousands) |
|
Subsidiaries |
|
Subsidiaries |
|
Company |
|
Reclassifications |
|
Consolidated |
|
|||||
|
ASSETS |
|
|
|
|
|
|
|
|
|
|
|
|
|
|
|
|
|
Current assets: |
|
|
|
|
|
|
|
|
|
|
|
|
|
|
|
|
|
Cash and cash equivalents |
|
$ |
24,624 |
|
$ |
9,821 |
|
$ |
53,058 |
|
$ |
— |
|
$ |
87,503 |
|
|
Trade receivables, net |
|
|
128,161 |
|
|
7,976 |
|
|
— |
|
|
— |
|
|
136,137 |
|
|
Inventories |
|
|
60,854 |
|
|
4,830 |
|
|
— |
|
|
— |
|
|
65,684 |
|
|
Current income taxes |
|
|
— |
|
|
— |
|
|
40,637 |
|
|
(36,962) |
|
|
3,675 |
|
|
Other |
|
|
8,142 |
|
|
1,280 |
|
|
7,087 |
|
|
(6,400) |
|
|
10,109 |
|
|
Total current assets |
|
|
221,781 |
|
|
23,907 |
|
|
100,782 |
|
|
(43,362) |
|
|
303,108 |
|
|
Property, plant and equipment, net |
|
|
166,897 |
|
|
9,753 |
|
|
13,439 |
|
|
— |
|
|
190,089 |
|
|
Other assets: |
|
|
|
|
|
|
|
|
|
|
|
|
|
|
|
|
|
Goodwill |
|
|
176,856 |
|
|
41,866 |
|
|
— |
|
|
— |
|
|
218,722 |
|
|
Intangible assets, net |
|
|
145,643 |
|
|
36,990 |
|
|
— |
|
|
— |
|
|
182,633 |
|
|
Investments in subsidiaries |
|
|
— |
|
|
— |
|
|
468,952 |
|
|
(468,952) |
|
|
— |
|
|
Intercompany accounts and notes |
|
|
— |
|
|
— |
|
|
726,738 |
|
|
(726,738) |
|
|
— |
|
|
Deferred income taxes |
|
|
— |
|
|
25,488 |
|
|
65,529 |
|
|
(16,193) |
|
|
74,824 |
|
|
Other |
|
|
12,069 |
|
|
4,527 |
|
|
26,844 |
|
|
— |
|
|
43,440 |
|
|
Total other assets |
|
|
334,568 |
|
|
108,871 |
|
|
1,288,063 |
|
|
(1,211,883) |
|
|
519,619 |
|
|
Total assets |
|
$ |
723,246 |
|
$ |
142,531 |
|
$ |
1,402,284 |
|
$ |
(1,255,245) |
|
$ |
1,012,816 |
|
|
|
|
|
|
|
|
|
|
|
|
|
|
|
|
|
|
|
|
LIABILITIES AND STOCKHOLDERS’ EQUITY |
|
|
|
|
|
|
|
|
|
|
|
|
|
|
|
|
|
Current liabilities: |
|
|
|
|
|
|
|
|
|
|
|
|
|
|
|
|
|
Accounts payable |
|
$ |
21,942 |
|
$ |
1,584 |
|
$ |
234 |
|
$ |
— |
|
$ |
23,760 |
|
|
Accrued personnel costs |
|
|
12,642 |
|
|
430 |
|
|
29,229 |
|
|
— |
|
|
42,301 |
|
|
Accrued interest |
|
|
— |
|
|
28 |
|
|
4,890 |
|
|
— |
|
|
4,918 |
|
|
Current income taxes |
|
|
34,782 |
|
|
2,180 |
|
|
— |
|
|
(36,962) |
|
|
— |
|
|
Other accrued liabilities |
|
|
52,118 |
|
|
12,396 |
|
|
2,657 |
|
|
(6,400) |
|
|
60,771 |
|
|
Current portion of long-term debt |
|
|
— |
|
|
— |
|
|
4,250 |
|
|
— |
|
|
4,250 |
|
|
Total current liabilities |
|
|
121,484 |
|
|
16,618 |
|
|
41,260 |
|
|
(43,362) |
|
|
136,000 |
|
|
Long-term liabilities: |
|
|
|
|
|
|
|
|
|
|
|
|
|
|
|
|
|
Long-term debt, net |
|
|
— |
|
|
— |
|
|
552,798 |
|
|
— |
|
|
552,798 |
|
|
Income taxes |
|
|
19,208 |
|
|
— |
|
|
— |
|
|
(16,193) |
|
|
3,015 |
|
|
Intercompany accounts and notes |
|
|
1,878 |
|
|
208,200 |
|
|
516,660 |
|
|
(726,738) |
|
|
— |
|
|
Other |
|
|
750 |
|
|
16,319 |
|
|
18,841 |
|
|
— |
|
|
35,910 |
|
|
Total long-term liabilities |
|
|
21,836 |
|
|
224,519 |
|
|
1,088,299 |
|
|
(742,931) |
|
|
591,723 |
|
|
Total liabilities |
|
|
143,320 |
|
|
241,137 |
|
|
1,129,559 |
|
|
(786,293) |
|
|
727,723 |
|
|
Redeemable non-controlling interest in consolidated subsidiary |
|
|
— |
|
|
12,544 |
|
|
— |
|
|
— |
|
|
12,544 |
|
|
Stockholders’ equity: |
|
|
|
|
|
|
|
|
|
|
|
|
|
|
|
|
|
Common stock |
|
|
— |
|
|
— |
|
|
74 |
|
|
— |
|
|
74 |
|
|
Capital in excess of par value |
|
|
471,794 |
|
|
52,229 |
|
|
731,806 |
|
|
(524,199) |
|
|
731,630 |
|
|
Retained earnings (accumulated deficit) |
|
|
108,132 |
|
|
(163,379) |
|
|
(457,847) |
|
|
55,247 |
|
|
(457,847) |
|
|
Treasury stock |
|
|
— |
|
|
— |
|
|
(1,308) |
|
|
— |
|
|
(1,308) |
|
|
Total stockholders’ equity |
|
|
579,926 |
|
|
(111,150) |
|
|
272,725 |
|
|
(468,952) |
|
|
272,549 |
|
|
Total liabilities and stockholders’ equity |
|
$ |
723,246 |
|
$ |
142,531 |
|
$ |
1,402,284 |
|
$ |
(1,255,245) |
|
$ |
1,012,816 |
|
25
HEADWATERS INCORPORATED
NOTES TO CONDENSED CONSOLIDATED FINANCIAL STATEMENTS
June 30, 2016
(Unaudited)
CONDENSED CONSOLIDATING STATEMENT OF INCOME
Three Months Ended June 30, 2015
|
|
|
|
|
Non- |
|
|
|
|
|
|
|
|
||||
|
|
|
Guarantor |
|
guarantor |
|
Parent |
|
|
|
|
Headwaters |
|
||||
|
(in thousands) |
|
Subsidiaries |
|
Subsidiaries |
|
Company |
|
Eliminations |
|
Consolidated |
|
|||||
|
Revenue: |
|
|
|
|
|
|
|
|
|
|
|
|
|
|
|
|
|
Building products |
|
$ |
136,117 |
|
$ |
11,713 |
|
$ |
— |
|
$ |
— |
|
$ |
147,830 |
|
|
Construction materials |
|
|
91,900 |
|
|
— |
|
|
— |
|
|
— |
|
|
91,900 |
|
|
Energy technology |
|
|
3,564 |
|
|
— |
|
|
— |
|
|
— |
|
|
3,564 |
|
|
Total revenue |
|
|
231,581 |
|
|
11,713 |
|
|
— |
|
|
— |
|
|
243,294 |
|
|
Cost of revenue: |
|
|
|
|
|
|
|
|
|
|
|
|
|
|
|
|
|
Building products |
|
|
92,288 |
|
|
8,513 |
|
|
— |
|
|
— |
|
|
100,801 |
|
|
Construction materials |
|
|
63,850 |
|
|
— |
|
|
— |
|
|
— |
|
|
63,850 |
|
|
Energy technology |
|
|
1,881 |
|
|
— |
|
|
— |
|
|
— |
|
|
1,881 |
|
|
Total cost of revenue |
|
|
158,019 |
|
|
8,513 |
|
|
— |
|
|
— |
|
|
166,532 |
|
|
Gross profit |
|
|
73,562 |
|
|
3,200 |
|
|
— |
|
|
— |
|
|
76,762 |
|
|
Operating expenses: |
|
|
|
|
|
|
|
|
|
|
|
|
|
|
|
|
|
Selling, general and administrative |
|
|
30,296 |
|
|
1,637 |
|
|
6,973 |
|
|
— |
|
|
38,906 |
|
|
Amortization |
|
|
4,189 |
|
|
368 |
|
|
— |
|
|
— |
|
|
4,557 |
|
|
Total operating expenses |
|
|
34,485 |
|
|
2,005 |
|
|
6,973 |
|
|
— |
|
|
43,463 |
|
|
Operating income (loss) |
|
|
39,077 |
|
|
1,195 |
|
|
(6,973) |
|
|
— |
|
|
33,299 |
|
|
Other income (expense): |
|
|
|
|
|
|
|
|
|
|
|
|
|
|
|
|
|
Net interest expense |
|
|
(25) |
|
|
— |
|
|
(8,058) |
|
|
— |
|
|
(8,083) |
|
|
Equity in earnings of subsidiaries |
|
|
— |
|
|
— |
|
|
34,508 |
|
|
(34,508) |
|
|
— |
|
|
Other, net |
|
|
130 |
|
|
(8) |
|
|
— |
|
|
— |
|
|
122 |
|
|
Total other income (expense), net |
|
|
105 |
|
|
(8) |
|
|
26,450 |
|
|
(34,508) |
|
|
(7,961) |
|
|
Income from continuing operations before income taxes |
|
|
39,182 |
|
|
1,187 |
|
|
19,477 |
|
|
(34,508) |
|
|
25,338 |
|
|
Income tax benefit (provision) |
|
|
(5,430) |
|
|
(130) |
|
|
3,340 |
|
|
— |
|
|
(2,220) |
|
|
Income from continuing operations |
|
|
33,752 |
|
|
1,057 |
|
|
22,817 |
|
|
(34,508) |
|
|
23,118 |
|
|
Loss from discontinued operations, net of income taxes |
|
|
— |
|
|
(110) |
|
|
— |
|
|
— |
|
|
(110) |
|
|
Net income |
|
|
33,752 |
|
|
947 |
|
|
22,817 |
|
|
(34,508) |
|
|
23,008 |
|
|
Net income attributable to noncontrolling interest |
|
|
— |
|
|
(191) |
|
|
— |
|
|
— |
|
|
(191) |
|
|
Net income attributable to Headwaters Incorporated |
|
$ |
33,752 |
|
$ |
756 |
|
$ |
22,817 |
|
$ |
(34,508) |
|
$ |
22,817 |
|
26
HEADWATERS INCORPORATED
NOTES TO CONDENSED CONSOLIDATED FINANCIAL STATEMENTS
June 30, 2016
(Unaudited)
CONDENSED CONSOLIDATING STATEMENT OF INCOME
Three Months Ended June 30, 2016
|
|
|
|
|
|
Non- |
|
|
|
|
|
|
|
|
|
|
|
|
|
|
Guarantor |
|
guarantor |
|
Parent |
|
|
|
|
Headwaters |
|
||||
|
(in thousands) |
|
Subsidiaries |
|
Subsidiaries |
|
Company |
|
Eliminations |
|
Consolidated |
|
|||||
|
Revenue: |
|
|
|
|
|
|
|
|
|
|
|
|
|
|
|
|
|
Building products |
|
$ |
145,635 |
|
$ |
17,007 |
|
$ |
— |
|
$ |
— |
|
$ |
162,642 |
|
|
Construction materials |
|
|
97,741 |
|
|
— |
|
|
— |
|
|
— |
|
|
97,741 |
|
|
Energy technology |
|
|
2,083 |
|
|
— |
|
|
— |
|
|
— |
|
|
2,083 |
|
|
Total revenue |
|
|
245,459 |
|
|
17,007 |
|
|
— |
|
|
— |
|
|
262,466 |
|
|
Cost of revenue: |
|
|
|
|
|
|
|
|
|
|
|
|
|
|
|
|
|
Building products |
|
|
99,049 |
|
|
12,360 |
|
|
— |
|
|
— |
|
|
111,409 |
|
|
Construction materials |
|
|
66,577 |
|
|
— |
|
|
— |
|
|
— |
|
|
66,577 |
|
|
Energy technology |
|
|
949 |
|
|
— |
|
|
— |
|
|
— |
|
|
949 |
|
|
Total cost of revenue |
|
|
166,575 |
|
|
12,360 |
|
|
— |
|
|
— |
|
|
178,935 |
|
|
Gross profit |
|
|
78,884 |
|
|
4,647 |
|
|
— |
|
|
— |
|
|
83,531 |
|
|
Operating expenses: |
|
|
|
|
|
|
|
|
|
|
|
|
|
|
|
|
|
Selling, general and administrative |
|
|
31,712 |
|
|
2,348 |
|
|
8,348 |
|
|
— |
|
|
42,408 |
|
|
Amortization |
|
|
4,661 |
|
|
368 |
|
|
— |
|
|
— |
|
|
5,029 |
|
|
Total operating expenses |
|
|
36,373 |
|
|
2,716 |
|
|
8,348 |
|
|
— |
|
|
47,437 |
|
|
Operating income (loss) |
|
|
42,511 |
|
|
1,931 |
|
|
(8,348) |
|
|
— |
|
|
36,094 |
|
|
Other income (expense): |
|
|
|
|
|
|
|
|
|
|
|
|
|
|
|
|
|
Net interest expense |
|
|
(101) |
|
|
(30) |
|
|
(9,139) |
|
|
— |
|
|
(9,270) |
|
|
Equity in earnings of subsidiaries |
|
|
— |
|
|
— |
|
|
27,113 |
|
|
(27,113) |
|
|
— |
|
|
Other, net |
|
|
(220) |
|
|
13 |
|
|
— |
|
|
— |
|
|
(207) |
|
|
Total other income (expense), net |
|
|
(321) |
|
|
(17) |
|
|
17,974 |
|
|
(27,113) |
|
|
(9,477) |
|
|
Income from continuing operations before income taxes |
|
|
42,190 |
|
|
1,914 |
|
|
9,626 |
|
|
(27,113) |
|
|
26,617 |
|
|
Income tax benefit (provision) |
|
|
(16,200) |
|
|
(780) |
|
|
7,890 |
|
|
— |
|
|
(9,090) |
|
|
Income from continuing operations |
|
|
25,990 |
|
|
1,134 |
|
|
17,516 |
|
|
(27,113) |
|
|
17,527 |
|
|
Income from discontinued operations, net of income taxes |
|
|
— |
|
|
258 |
|
|
— |
|
|
— |
|
|
258 |
|
|
Net income |
|
|
25,990 |
|
|
1,392 |
|
|
17,516 |
|
|
(27,113) |
|
|
17,785 |
|
|
Net income attributable to noncontrolling interest |
|
|
— |
|
|
(269) |
|
|
— |
|
|
— |
|
|
(269) |
|
|
Net income attributable to Headwaters Incorporated |
|
$ |
25,990 |
|
$ |
1,123 |
|
$ |
17,516 |
|
$ |
(27,113) |
|
$ |
17,516 |
|
27
HEADWATERS INCORPORATED
NOTES TO CONDENSED CONSOLIDATED FINANCIAL STATEMENTS
June 30, 2016
(Unaudited)
CONDENSED CONSOLIDATING STATEMENT OF INCOME
Nine Months Ended June 30, 2015
|
|
|
|
|
|
Non- |
|
|
|
|
|
|
|
|
|
|
|
|
|
|
Guarantor |
|
guarantor |
|
Parent |
|
|
|
|
Headwaters |
|
||||
|
(in thousands) |
|
Subsidiaries |
|
Subsidiaries |
|
Company |
|
Eliminations |
|
Consolidated |
|
|||||
|
Revenue: |
|
|
|
|
|
|
|
|
|
|
|
|
|
|
|
|
|
Building products |
|
$ |
338,445 |
|
$ |
33,325 |
|
$ |
— |
|
$ |
— |
|
$ |
371,770 |
|
|
Construction materials |
|
|
240,802 |
|
|
— |
|
|
— |
|
|
— |
|
|
240,802 |
|
|
Energy technology |
|
|
10,044 |
|
|
— |
|
|
— |
|
|
— |
|
|
10,044 |
|
|
Total revenue |
|
|
589,291 |
|
|
33,325 |
|
|
— |
|
|
— |
|
|
622,616 |
|
|
Cost of revenue: |
|
|
|
|
|
|
|
|
|
|
|
|
|
|
|
|
|
Building products |
|
|
241,222 |
|
|
23,252 |
|
|
— |
|
|
— |
|
|
264,474 |
|
|
Construction materials |
|
|
174,099 |
|
|
— |
|
|
— |
|
|
— |
|
|
174,099 |
|
|
Energy technology |
|
|
4,453 |
|
|
— |
|
|
— |
|
|
— |
|
|
4,453 |
|
|
Total cost of revenue |
|
|
419,774 |
|
|
23,252 |
|
|
— |
|
|
— |
|
|
443,026 |
|
|
Gross profit |
|
|
169,517 |
|
|
10,073 |
|
|
— |
|
|
— |
|
|
179,590 |
|
|
Operating expenses: |
|
|
|
|
|
|
|
|
|
|
|
|
|
|
|
|
|
Selling, general and administrative |
|
|
82,734 |
|
|
4,829 |
|
|
17,723 |
|
|
— |
|
|
105,286 |
|
|
Amortization |
|
|
12,498 |
|
|
1,105 |
|
|
— |
|
|
— |
|
|
13,603 |
|
|
Total operating expenses |
|
|
95,232 |
|
|
5,934 |
|
|
17,723 |
|
|
— |
|
|
118,889 |
|
|
Operating income (loss) |
|
|
74,285 |
|
|
4,139 |
|
|
(17,723) |
|
|
— |
|
|
60,701 |
|
|
Other income (expense): |
|
|
|
|
|
|
|
|
|
|
|
|
|
|
|
|
|
Net interest expense |
|
|
(129) |
|
|
— |
|
|
(55,871) |
|
|
— |
|
|
(56,000) |
|
|
Equity in earnings of subsidiaries |
|
|
— |
|
|
— |
|
|
68,633 |
|
|
(68,633) |
|
|
— |
|
|
Other, net |
|
|
(12) |
|
|
(168) |
|
|
— |
|
|
— |
|
|
(180) |
|
|
Total other income (expense), net |
|
|
(141) |
|
|
(168) |
|
|
12,762 |
|
|
(68,633) |
|
|
(56,180) |
|
|
Income (loss) from continuing operations before income taxes |
|
|
74,144 |
|
|
3,971 |
|
|
(4,961) |
|
|
(68,633) |
|
|
4,521 |
|
|
Income tax benefit (provision) |
|
|
(8,000) |
|
|
(400) |
|
|
9,160 |
|
|
— |
|
|
760 |
|
|
Income from continuing operations |
|
|
66,144 |
|
|
3,571 |
|
|
4,199 |
|
|
(68,633) |
|
|
5,281 |
|
|
Loss from discontinued operations, net of income taxes |
|
|
(67) |
|
|
(320) |
|
|
— |
|
|
— |
|
|
(387) |
|
|
Net income |
|
|
66,077 |
|
|
3,251 |
|
|
4,199 |
|
|
(68,633) |
|
|
4,894 |
|
|
Net income attributable to noncontrolling interest |
|
|
— |
|
|
(695) |
|
|
— |
|
|
— |
|
|
(695) |
|
|
Net income attributable to Headwaters Incorporated |
|
$ |
66,077 |
|
$ |
2,556 |
|
$ |
4,199 |
|
$ |
(68,633) |
|
$ |
4,199 |
|
28
HEADWATERS INCORPORATED
NOTES TO CONDENSED CONSOLIDATED FINANCIAL STATEMENTS
June 30, 2016
(Unaudited)
CONDENSED CONSOLIDATING STATEMENT OF INCOME
Nine Months Ended June 30, 2016
|
|
|
|
|
Non- |
|
|
|
|
|
|
|
|
||||
|
|
|
Guarantor |
|
guarantor |
|
Parent |
|
|
|
|
Headwaters |
|
||||
|
(in thousands) |
|
Subsidiaries |
|
Subsidiaries |
|
Company |
|
Eliminations |
|
Consolidated |
|
|||||
|
Revenue: |
|
|
|
|
|
|
|
|
|
|
|
|
|
|
|
|
|
Building products |
|
$ |
382,062 |
|
$ |
41,620 |
|
$ |
— |
|
$ |
— |
|
$ |
423,682 |
|
|
Construction materials |
|
|
255,494 |
|
|
— |
|
|
— |
|
|
— |
|
|
255,494 |
|
|
Energy technology |
|
|
4,040 |
|
|
— |
|
|
— |
|
|
— |
|
|
4,040 |
|
|
Total revenue |
|
|
641,596 |
|
|
41,620 |
|
|
— |
|
|
— |
|
|
683,216 |
|
|
Cost of revenue: |
|
|
|
|
|
|
|
|
|
|
|
|
|
|
|
|
|
Building products |
|
|
268,125 |
|
|
29,617 |
|
|
— |
|
|
— |
|
|
297,742 |
|
|
Construction materials |
|
|
181,059 |
|
|
— |
|
|
— |
|
|
— |
|
|
181,059 |
|
|
Energy technology |
|
|
1,736 |
|
|
— |
|
|
— |
|
|
— |
|
|
1,736 |
|
|
Total cost of revenue |
|
|
450,920 |
|
|
29,617 |
|
|
— |
|
|
— |
|
|
480,537 |
|
|
Gross profit |
|
|
190,676 |
|
|
12,003 |
|
|
— |
|
|
— |
|
|
202,679 |
|
|
Operating expenses: |
|
|
|
|
|
|
|
|
|
|
|
|
|
|
|
|
|
Selling, general and administrative |
|
|
88,737 |
|
|
5,901 |
|
|
20,534 |
|
|
— |
|
|
115,172 |
|
|
Amortization |
|
|
13,305 |
|
|
1,105 |
|
|
— |
|
|
— |
|
|
14,410 |
|
|
Total operating expenses |
|
|
102,042 |
|
|
7,006 |
|
|
20,534 |
|
|
— |
|
|
129,582 |
|
|
Operating income (loss) |
|
|
88,634 |
|
|
4,997 |
|
|
(20,534) |
|
|
— |
|
|
73,097 |
|
|
Other income (expense): |
|
|
|
|
|
|
|
|
|
|
|
|
|
|
|
|
|
Net interest expense |
|
|
(196) |
|
|
(33) |
|
|
(25,314) |
|
|
— |
|
|
(25,543) |
|
|
Equity in earnings of subsidiaries |
|
|
— |
|
|
— |
|
|
56,760 |
|
|
(56,760) |
|
|
— |
|
|
Other, net |
|
|
(345) |
|
|
57 |
|
|
— |
|
|
— |
|
|
(288) |
|
|
Total other income (expense), net |
|
|
(541) |
|
|
24 |
|
|
31,446 |
|
|
(56,760) |
|
|
(25,831) |
|
|
Income from continuing operations before income taxes |
|
|
88,093 |
|
|
5,021 |
|
|
10,912 |
|
|
(56,760) |
|
|
47,266 |
|
|
Income tax benefit (provision) |
|
|
(33,330) |
|
|
(1,990) |
|
|
21,130 |
|
|
— |
|
|
(14,190) |
|
|
Income from continuing operations |
|
|
54,763 |
|
|
3,031 |
|
|
32,042 |
|
|
(56,760) |
|
|
33,076 |
|
|
Loss from discontinued operations, net of income taxes |
|
|
— |
|
|
(186) |
|
|
— |
|
|
— |
|
|
(186) |
|
|
Net income |
|
|
54,763 |
|
|
2,845 |
|
|
32,042 |
|
|
(56,760) |
|
|
32,890 |
|
|
Net income attributable to noncontrolling interest |
|
|
— |
|
|
(848) |
|
|
— |
|
|
— |
|
|
(848) |
|
|
Net income attributable to Headwaters Incorporated |
|
$ |
54,763 |
|
$ |
1,997 |
|
$ |
32,042 |
|
$ |
(56,760) |
|
$ |
32,042 |
|
29
HEADWATERS INCORPORATED
NOTES TO CONDENSED CONSOLIDATED FINANCIAL STATEMENTS
June 30, 2016
(Unaudited)
CONDENSED CONSOLIDATING STATEMENT OF CASH FLOWS
Nine Months Ended June 30, 2015
|
|
|
|
|
|
Non- |
|
|
|
|
|
|
|
|
|
|
|
|
|
|
Guarantor |
|
guarantor |
|
Parent |
|
|
|
|
Headwaters |
|
||||
|
(in thousands) |
|
Subsidiaries |
|
Subsidiaries |
|
Company |
|
Eliminations |
|
Consolidated |
|
|||||
|
Cash flows from operating activities: |
|
|
|
|
|
|
|
|
|
|
|
|
|
|
|
|
|
Net income |
|
$ |
66,077 |
|
$ |
3,251 |
|
$ |
4,199 |
|
$ |
(68,633) |
|
$ |
4,894 |
|
|
Adjustments to reconcile net income to net cash provided by (used in) operating activities: |
|
|
|
|
|
|
|
|
|
|
|
|
|
|
— |
|
|
Depreciation and amortization |
|
|
37,270 |
|
|
2,153 |
|
|
370 |
|
|
— |
|
|
39,793 |
|
|
Interest expense related to amortization of debt issue costs and debt discount |
|
|
— |
|
|
— |
|
|
5,611 |
|
|
— |
|
|
5,611 |
|
|
Stock-based compensation |
|
|
759 |
|
|
— |
|
|
1,310 |
|
|
— |
|
|
2,069 |
|
|
Deferred income taxes |
|
|
591 |
|
|
363 |
|
|
— |
|
|
— |
|
|
954 |
|
|
Net loss on disposition of property, plant and equipment |
|
|
94 |
|
|
1 |
|
|
— |
|
|
— |
|
|
95 |
|
|
Loss on sale of discontinued operations, net of income taxes |
|
|
45 |
|
|
174 |
|
|
— |
|
|
— |
|
|
219 |
|
|
Net loss of unconsolidated joint ventures |
|
|
— |
|
|
247 |
|
|
— |
|
|
— |
|
|
247 |
|
|
Equity in earnings of subsidiaries |
|
|
— |
|
|
— |
|
|
(68,633) |
|
|
68,633 |
|
|
0 |
|
|
Decrease in trade receivables |
|
|
397 |
|
|
109 |
|
|
— |
|
|
— |
|
|
506 |
|
|
Increase in inventories |
|
|
(8,513) |
|
|
(414) |
|
|
— |
|
|
— |
|
|
(8,927) |
|
|
Increase (decrease) in accounts payable and accrued liabilities |
|
|
(10,650) |
|
|
3,231 |
|
|
(22,060) |
|
|
— |
|
|
(29,479) |
|
|
Other changes in operating assets and liabilities, net |
|
|
(339) |
|
|
(8,519) |
|
|
(1,930) |
|
|
— |
|
|
(10,788) |
|
|
Net cash provided by (used in) operating activities |
|
|
85,731 |
|
|
596 |
|
|
(81,133) |
|
|
— |
|
|
5,194 |
|
|
Cash flows from investing activities: |
|
|
|
|
|
|
|
|
|
|
|
|
|
|
|
|
|
Business acquisition |
|
|
(1,200) |
|
|
— |
|
|
— |
|
|
— |
|
|
(1,200) |
|
|
Investments in unconsolidated joint venture |
|
|
(125) |
|
|
— |
|
|
— |
|
|
— |
|
|
(125) |
|
|
Purchase of property, plant and equipment |
|
|
(21,768) |
|
|
(614) |
|
|
(4,142) |
|
|
— |
|
|
(26,524) |
|
|
Proceeds from disposition of property, plant and equipment |
|
|
716 |
|
|
— |
|
|
— |
|
|
— |
|
|
716 |
|
|
Net decrease in long-term receivables and deposits |
|
|
2,781 |
|
|
— |
|
|
1,066 |
|
|
— |
|
|
3,847 |
|
|
Net change in other assets |
|
|
(587) |
|
|
— |
|
|
164 |
|
|
— |
|
|
(423) |
|
|
Net cash used in investing activities |
|
|
(20,183) |
|
|
(614) |
|
|
(2,912) |
|
|
— |
|
|
(23,709) |
|
|
Cash flows from financing activities: |
|
|
|
|
|
|
|
|
|
|
|
|
|
|
|
|
|
Net proceeds from issuance of long-term debt |
|
|
— |
|
|
— |
|
|
414,675 |
|
|
— |
|
|
414,675 |
|
|
Payments on long-term debt |
|
|
— |
|
|
— |
|
|
(448,736) |
|
|
— |
|
|
(448,736) |
|
|
Dividends paid to non-controlling interest in consolidated subsidiary |
|
|
— |
|
|
(1,184) |
|
|
— |
|
|
— |
|
|
(1,184) |
|
|
Employee stock purchases |
|
|
464 |
|
|
28 |
|
|
141 |
|
|
— |
|
|
633 |
|
|
Intercompany transfers |
|
|
(41,029) |
|
|
(271) |
|
|
41,300 |
|
|
— |
|
|
0 |
|
|
Net cash provided by (used in) financing activities |
|
|
(40,565) |
|
|
(1,427) |
|
|
7,380 |
|
|
— |
|
|
(34,612) |
|
|
Net increase (decrease) in cash and cash equivalents |
|
|
24,983 |
|
|
(1,445) |
|
|
(76,665) |
|
|
— |
|
|
(53,127) |
|
|
Cash and cash equivalents, beginning of period |
|
|
33,552 |
|
|
5,764 |
|
|
113,226 |
|
|
— |
|
|
152,542 |
|
|
Cash and cash equivalents, end of period |
|
$ |
58,535 |
|
$ |
4,319 |
|
$ |
36,561 |
|
$ |
— |
|
$ |
99,415 |
|
30
HEADWATERS INCORPORATED
NOTES TO CONDENSED CONSOLIDATED FINANCIAL STATEMENTS
June 30, 2016
(Unaudited)
CONDENSED CONSOLIDATING STATEMENT OF CASH FLOWS
Nine Months Ended June 30, 2016
|
|
|
|
|
|
Non- |
|
|
|
|
|
|
|
|
|
|
|
|
|
|
Guarantor |
|
guarantor |
|
Parent |
|
|
|
|
Headwaters |
|
||||
|
(in thousands) |
|
Subsidiaries |
|
Subsidiaries |
|
Company |
|
Eliminations |
|
Consolidated |
|
|||||
|
Cash flows from operating activities: |
|
|
|
|
|
|
|
|
|
|
|
|
|
|
|
|
|
Net income |
|
$ |
54,763 |
|
$ |
2,845 |
|
$ |
32,042 |
|
$ |
(56,760) |
|
$ |
32,890 |
|
|
Adjustments to reconcile net income to net cash provided by operating activities: |
|
|
|
|
|
|
|
|
|
|
|
|
|
|
|
|
|
Depreciation and amortization |
|
|
40,297 |
|
|
2,269 |
|
|
487 |
|
|
— |
|
|
43,053 |
|
|
Interest expense related to amortization of debt issue costs and debt discount |
|
|
— |
|
|
— |
|
|
1,745 |
|
|
— |
|
|
1,745 |
|
|
Stock-based compensation |
|
|
817 |
|
|
— |
|
|
1,520 |
|
|
— |
|
|
2,337 |
|
|
Deferred income taxes |
|
|
4,927 |
|
|
(284) |
|
|
12,986 |
|
|
— |
|
|
17,629 |
|
|
Tax benefit from exercise of stock appreciation rights and vesting of restricted stock |
|
|
(106) |
|
|
— |
|
|
(226) |
|
|
— |
|
|
(332) |
|
|
Net loss (gain) on disposition of property, plant and equipment |
|
|
(1,680) |
|
|
49 |
|
|
— |
|
|
— |
|
|
(1,631) |
|
|
Loss on sale of discontinued operations, net of income taxes |
|
|
— |
|
|
3,072 |
|
|
— |
|
|
— |
|
|
3,072 |
|
|
Net loss of unconsolidated joint ventures |
|
|
— |
|
|
36 |
|
|
— |
|
|
— |
|
|
36 |
|
|
Equity in earnings of subsidiaries |
|
|
— |
|
|
— |
|
|
(56,760) |
|
|
56,760 |
|
|
0 |
|
|
Decrease (increase) in trade receivables |
|
|
5,948 |
|
|
(1,369) |
|
|
— |
|
|
— |
|
|
4,579 |
|
|
Increase in inventories |
|
|
(1,709) |
|
|
(170) |
|
|
— |
|
|
— |
|
|
(1,879) |
|
|
Increase (decrease) in accounts payable and accrued liabilities |
|
|
(16,370) |
|
|
5,183 |
|
|
(6,875) |
|
|
— |
|
|
(18,062) |
|
|
Other changes in operating assets and liabilities, net |
|
|
(29,513) |
|
|
(5,128) |
|
|
30,611 |
|
|
— |
|
|
(4,030) |
|
|
Net cash provided by operating activities |
|
|
57,374 |
|
|
6,503 |
|
|
15,530 |
|
|
— |
|
|
79,407 |
|
|
Cash flows from investing activities: |
|
|
|
|
|
|
|
|
|
|
|
|
|
|
|
|
|
Business acquisitions |
|
|
(73,841) |
|
|
(33,083) |
|
|
— |
|
|
— |
|
|
(106,924) |
|
|
Purchase of property, plant and equipment |
|
|
(28,596) |
|
|
(355) |
|
|
(2,468) |
|
|
— |
|
|
(31,419) |
|
|
Proceeds from disposition of property, plant and equipment |
|
|
8,795 |
|
|
— |
|
|
— |
|
|
— |
|
|
8,795 |
|
|
Net decrease (increase) in long-term receivables and deposits |
|
|
2 |
|
|
(55) |
|
|
(147) |
|
|
— |
|
|
(200) |
|
|
Net change in other assets |
|
|
(1,526) |
|
|
6,085 |
|
|
(2,690) |
|
|
— |
|
|
1,869 |
|
|
Net cash used in investing activities |
|
|
(95,166) |
|
|
(27,408) |
|
|
(5,305) |
|
|
— |
|
|
(127,879) |
|
|
Cash flows from financing activities: |
|
|
|
|
|
|
|
|
|
|
|
|
|
|
|
|
|
Payments on long-term debt |
|
|
— |
|
|
— |
|
|
(6,937) |
|
|
— |
|
|
(6,937) |
|
|
Dividends paid to non-controlling interest in consolidated subsidiary |
|
|
— |
|
|
(735) |
|
|
— |
|
|
— |
|
|
(735) |
|
|
Employee stock purchases |
|
|
509 |
|
|
31 |
|
|
178 |
|
|
— |
|
|
718 |
|
|
Tax benefit from exercise of stock appreciation rights and vesting of restricted stock |
|
|
106 |
|
|
— |
|
|
226 |
|
|
— |
|
|
332 |
|
|
Intercompany transfers |
|
|
35,982 |
|
|
27,853 |
|
|
(63,835) |
|
|
— |
|
|
0 |
|
|
Net cash provided by (used in) financing activities |
|
|
36,597 |
|
|
27,149 |
|
|
(70,368) |
|
|
— |
|
|
(6,622) |
|
|
Net increase (decrease) in cash and cash equivalents |
|
|
(1,195) |
|
|
6,244 |
|
|
(60,143) |
|
|
— |
|
|
(55,094) |
|
|
Cash and cash equivalents, beginning of period |
|
|
25,819 |
|
|
3,577 |
|
|
113,201 |
|
|
— |
|
|
142,597 |
|
|
Cash and cash equivalents, end of period |
|
$ |
24,624 |
|
$ |
9,821 |
|
$ |
53,058 |
|
$ |
— |
|
$ |
87,503 |
|
31
ITEM 2. MANAGEMENT’S DISCUSSION AND ANALYSIS OF FINANCIAL CONDITION AND RESULTS OF OPERATIONS
The following discussion and analysis should be read in conjunction with the interim condensed consolidated financial statements and related notes included in this Form 10-Q. Our fiscal year ends on September 30 and unless otherwise noted, references to years refer to our fiscal year rather than a calendar year.
Overview
Consolidation and Segments. The consolidated financial statements include the accounts of Headwaters, all of our subsidiaries, and other entities in which we have a controlling interest. All significant intercompany transactions and accounts are eliminated in consolidation. We currently operate primarily in two building materials-oriented business segments: building products and construction materials, and have several product lines within those segments. The end uses for our products and materials include new housing construction, residential repair and remodeling, and commercial, institutional and infrastructure construction. Our third non-core operating segment is energy technology.
Operations and Products. In the building products segment, we design, manufacture, and sell manufactured architectural stone, exterior siding accessories (such as shutters, mounting blocks, and vents), roofing materials, concrete block and other building products. We manufacture our building products in approximately 20 locations. Revenues consist of product sales to wholesale and retail distributors, contractors and other users of building products.
Over the last several years, we have closed several acquisitions within our building products segment, as follows:
|
· |
In December 2012, we acquired the assets of Kleer Lumber, Inc., a manufacturer of PVC trim board and moulding products; |
|
· |
In December 2013, we acquired 80% of the equity interests in the business of Roof Tile, Inc., a manufacturer of high quality concrete roof tiles and accessories sold primarily under the Entegra brand; |
|
· |
In May 2014, we acquired the stone coated metal roofing business of Metals USA Building Products, L.P., the products of which are sold under the Gerard and Allmet brands; |
|
· |
In fiscal 2015, we acquired two small businesses in the building products industry; |
|
· |
In November 2015, we acquired 100% of the equity interests in several related companies, together which comprise a stone-coated metal roofing business known as Metro Roof Products; |
|
· |
In December 2015, we acquired certain assets and assumed certain liabilities of Enviroshake Inc., a company that manufactures and sells composite roofing products; and |
|
· |
In January 2016, we completed the acquisition of a small decking and railing company; and |
|
· |
In April 2016, we completed the acquisition of a small concrete roof tile business. |
Our construction materials business acquires fly ash from coal-fueled electric generating utilities. Using a nationwide storage and distribution network, we sell fly ash directly to concrete manufacturers who use it as a mineral admixture for the partial replacement of portland cement in concrete. In addition to fly ash and other coal combustion products (CCP) sales, revenues also include CCP disposal services provided to utilities. In 2014, we acquired two small businesses in the CCP industry, and in March 2016 we completed the acquisition of a synthetic gypsum processing and marketing business known as Synthetic Materials, LLC.
The non-core energy technology segment has been focused on reducing waste and increasing the value of energy-related feedstocks, primarily in the area of low-value oil. Revenues for the energy technology segment consist primarily of catalyst sales to oil refineries. In September 2011, we committed to a plan to sell our coal cleaning business
32
and since then the coal cleaning business has been presented as a discontinued operation. In January 2013, we sold all of our remaining coal cleaning facilities.
Building Products Segment. Our strategy in the building products segment is to obtain growth with leadership economics, which includes four elements: (1) increase the number of products we are selling to core customers through internal development and bolt-on acquisitions; (2) focus on a total customer solution to value creation for our customers, rather than solely on price and product; (3) leverage our sales and marketing spend to core customers; and (4) standardize non-customer interfacing infrastructure. We believe we have successfully executed our strategy over the past several years, adding new trim, moulding, block, and roofing products to our portfolio, while improving margins.
Construction Materials Segment. The four elements noted above for our building products segment are also operative for the construction materials segment. In addition, our strategy in this segment includes the negotiation of long-term contracts with suppliers, supported by investment in transportation and storage infrastructure for the marketing and sale of CCPs. Demand for CCPs is somewhat dependent on federal and state funding of infrastructure projects, and is associated with demand for portland cement. We are continuing our efforts to expand the demand for high-quality CCPs, develop more uses for lower-quality CCPs, and expand our CCP disposal services and site service revenue generated from CCP management.
Seasonality and Weather. Both our building products and construction materials segments are greatly impacted by seasonality. Accordingly, revenues and profitability are generally highest in the June and September quarters.
Capitalization and Liquidity. In December 2013, we issued $150.0 million of 7¼% senior notes for net proceeds of approximately $146.7 million. Most of those net proceeds were used to acquire some of the businesses described above.
In connection with several transactions during the March 2015 quarter, we significantly restructured our long-term debt, including repayment of our outstanding convertible senior subordinated notes. We entered into a new Term Loan Facility, under which a senior secured loan for $425.0 million was obtained. This variable-rate loan currently carries an interest rate of 4.0% and matures in March 2022, subject to certain early termination provisions. The net proceeds of approximately $414.7 million were used to pay the redemption price in connection with the redemption of all of the outstanding 7-5/8% senior secured notes which carried a maturity date of April 2019. Finally, our ABL Revolver was amended to extend its maturity to March 2020, subject to certain early termination provisions, with more favorable interest rates.
Currently, except for the required repayments of the Term Loan Facility of approximately $1.1 million per quarter, we have no expected debt maturities until January 2019. As of June 30, 2016, we had approximately $87.5 million of cash on hand, total liquidity of approximately $147.2 million, and additional cash flow is expected to be generated from operations over the next 12 months.
Capital expenditures for each of the fiscal years 2013 through 2015 ranged from approximately $29.0 million to $37.0 million, but are currently expected to be higher during 2016, especially to the extent we pursue certain growth opportunities.
In summary, our strategy for the rest of fiscal 2016 and subsequent years is to continue activities to improve operational efficiencies and reduce operating costs. We also plan to pursue growth opportunities through targeted capital expenditures and strategic acquisitions of niche products or entities that expand our current operating platform when opportunities arise.
Three Months Ended June 30, 2016 Compared to Three Months Ended June 30, 2015
The information set forth below compares our operating results for the three months ended June 30, 2016, the third quarter of our 2016 fiscal year (2016), with operating results for the three months ended June 30, 2015, the third quarter of our 2015 fiscal year (2015). Except as noted, the references to captions in the Statements of Income refer to continuing operations only.
Summary. Third quarter 2016 consolidated revenue increased by 8% to $262.5 million from $243.3 million for the third quarter of 2015, and gross profit increased by 9% to $83.5 million, compared to $76.8 million in 2015. Operating income improved from $33.3 million in 2015 to $36.1 million in 2016. Income from continuing operations was $17.5 million, or $0.23 per diluted share, for the third quarter of 2016, compared to $23.1 million, or $0.30 per
33
diluted share, for the third quarter of 2015, with the decrease primarily due to an increase in income tax expense following the release of deferred tax asset valuation allowances in the September 2015 quarter. Discontinued operations were immaterial in both 2015 and 2016.
Revenue and Gross Margins. The major components of segment revenue, along with gross margins, are discussed in the sections below.
Building Products Segment. Building products revenue increased 10%, from $147.8 million in the third quarter of 2015 to $162.6 million in the third quarter of 2016. In 2016, gross profit increased 9% to $51.2 million from $47.0 million in 2015, and operating income increased 8% to $24.6 million from $22.8 million.
All major product groups experienced sales growth despite adverse weather conditions in the third quarter and the likely pull forward of sales into the second quarter due to unseasonably mild winter temperatures. Heavy rain in Texas negatively impacted revenue in our block group. Siding products, which predominantly sells into the repair and remodel market, experienced solid revenue growth, led by our trim product where we have experienced double digit top line growth.
Margins for the quarter improved, reflecting effective cost controls and the continued benefit from lower raw material, transportation, and energy costs. We anticipate completing the consolidation of our stone-coated metal roofing manufacturing plants in the September quarter, but additional integration activities will continue well into 2017.
Underlying fundamentals of our end-markets continue to strengthen as single family housing starts are growing modestly. Builders have experienced shortages in skilled labor and construction labor, which have contributed to a more gradual recovery, but demand remains strong for our building products used in new residential construction. Many repair and remodel markets across the country are also gradually improving, although roofing demand is somewhat dependent upon storm generated activity.
New housing construction and residential repair and remodeling, which experienced significant declines in activity several years ago, have seen some recovery in recent years, although the recovery has been uneven. There have been and continue to be significant regional differences in the strength of the improvement that has occurred. For example, the recovery has been more robust in some sections of the West and South, including Texas, as compared to parts of the Northeast, Southeast and Midwest regions, where growth has not been as strong. Continued low oil prices may impact growth in certain areas of Texas, such as Houston, but the Dallas market continues to have a strong new residential construction market. Regional differences in the health of housing construction impact the sales of our various product groups differently. It is not possible to know whether improved selling conditions and the housing recovery will be sustainable over the long-term.
According to the National Association of Home Builders (NAHB), new housing construction starts as of June 2016 were at a seasonally-adjusted annualized level of approximately 1.2 million units, compared to 1.0 million units and 1.1 million units in calendar 2014 and 2015, respectively. The most current 10- and 50-year averages for new housing starts were 1.0 million and 1.4 million units, respectively. During the last 57 years, the seven years with the lowest number of housing starts were the seven consecutive calendar years 2008 through 2014. According to a 2016 report by The Joint Center for Housing Studies of Harvard University, the U.S. homeownership rate has tumbled to its lowest level in nearly a half-century, but household growth is projected to average over 1.3 million units a year over the coming decade.
The National Association of Realtors reported that annual existing-home sales were at a seasonally adjusted rate of 5.6 million units in June 2016. For all of calendar 2015, there were 5.3 million units sold, compared to 4.9 million units sold in calendar 2014. Total housing inventory as of June 30, 2016 was 2.1 million existing homes for sale, representing a 4.6-month supply. This compares to a 5.0-month supply as of June 30, 2015 and a 4.3-month supply in May 2005, near the peak of the housing boom. The median sales price for existing homes of all types in June 2016 was 5% higher than in June 2015.
In recent years, some of our product offerings have been impacted by the continuing weakness in some sectors of repair and remodeling, including resin-based siding, which continues to be weaker than new housing construction. However, as noted above, some improvement has been observed in repair and remodeling activity recently. Key trends, such as rising home sales and values, indicate potential for further growth in repair and remodeling, which represents the
34
largest end use for our products. As noted above, roofing repair and remodel markets can be negatively impacted by a lack of storm activity.
Construction Materials Segment. Construction materials revenue increased by 6% to $97.7 million, compared to $91.9 million in 2015. The increase in revenue is primarily attributable to positive pricing for high-value CCPs and the acquisition of SynMat in March 2016. Net price increases for the June 2016 quarter averaged approximately 6%, as compared to the June 2015 quarter. The continued favorable pricing environment is the result of demand for high value CCPs, as well as increases in demand for portland cement. Service revenue represented approximately 23% of total segment revenue for 2016 compared to 18% for 2015, with SynMat contributing to the higher service revenue percentage year over year. Service revenue was 21% for all of fiscal 2015. Gross profit increased by 11% to $31.2 million in 2016, compared to $28.1 million in 2015, and gross margin increased by 140 basis points to 31.9%. Operating income increased $2.5 million, or 14%, from $18.4 million in 2015 to $20.9 million in 2016, with a 140 basis point increase in operating margin.
We believe that our fly ash supply in 2016 compared to 2015 was lower because of a temporary seasonal decline in fly ash production due primarily to lower electricity demand and unusually low natural gas prices, both impacted by unseasonably mild temperatures. Sales volumes were also impacted by rain. Based on demand for high quality CCPs, improvements to weather, and increasing natural gas prices, we currently expect sales volumes for CCPs to normalize in the September quarter.
According to the Portland Cement Association’s (PCA) most recent forecast, U.S. cement consumption is projected to increase approximately 3.4% in calendar 2016 and approximately 4.3% in calendar 2017. It is not possible to accurately predict the future trends of cement consumption, nor the precise correlation between cement usage and fly ash sales. Nevertheless, because fly ash is sold as an admixture for the partial replacement of portland cement in a wide variety of concrete uses—including infrastructure, commercial, and residential construction—statistics and trends for portland and blended cement sales can be an indicator for fly ash sales. In April 2015, the PCA’s Chief Economist indicated that in 2013 a trough point was reached for road construction, which accounts for the largest amount of public cement consumption.
An important aspect of our strategy is to continue to increase our supply of high-value CCPs for marketing during the construction season. Low natural gas prices, EPA regulations, and reduced power demand, have combined to force the long-term shutdown, temporary idling, or lower utilization of multiple coal combustion power plant units, negatively impacting the supply of CCPs for beneficial use in certain areas. This trend has impacted somewhat our CCP supplies in certain regions of the country; however, we have multiple sources of supply and a broad distribution system, which allow us to move CCPs to locations where power plant units have closed. Reallocating CCP supplies can increase our transportation costs, some but not all of which we have historically been able to pass on to customers.
Weather, plant outages, limits on storage capacity and other factors can create short-term supply interruptions that sometimes result in CCP shortages in certain geographic areas. We are constantly seeking opportunities to increase the supply of high-value CCPs through incremental storage, conversion, blending, treatment, and new contracts. We are also working to develop fly ash sources which are not dependent upon current electricity generation. We have been actively involved in creative strategies to secure additional supplies for some time, and believe that several of these strategies will be operational in 2017. For example, we believe that we can reclaim high quality fly ash previously disposed by utilities, and are currently working on this initiative at multiple sites. The American Coal Ash Association (ACAA) estimates that there are hundreds of millions of tons of potentially available CCPs, much of which we believe could be reclaimed for use as fly ash.
The ACAA released recent findings on the U.S. production and utilization of CCPs, particularly fly ash. The ACAA report, which is based on an in-depth analysis by the American Road and Transportation Builders Association, takes into account the economic and political factors that have influenced production and utilization of CCPs over the last 40 years, and predicts the availability and demand for CCPs for the next 20 years. The forward looking projections take into account historic CCP data, projected electric generation from coal-fueled utilities, and the U.S. economy.
CCPs are used as a supplementary cementitious material, and are widely used along with cement in concrete mixtures to enhance the strength and durability of concrete structures. Data shows that using fly ash as a partial replacement for portland cement can almost double the life of a highway system. Demand for ready mixed concrete is a primary driver for fly ash utilization. The ACAA report stated, “The utilization rate of fly ash has grown from 8.4
35
percent of production in 1974 to 43.7 percent in 2013, when 23.3 million tons were beneficially used.” The ACAA report continues, “Based on ready mixed concrete market projections, fly ash utilization is forecast to increase to 35.7 million tons in 2033 — a 53 percent cumulative increase over the next two decades.” Beneficial uses of fly ash include grout, mining applications, structural fill, stabilization of soils and wastes, cement raw feed, and the partial replacement of portland cement in concrete.
The report also predicts a steady supply of CCPs will be available due to anticipated growth in electricity demand. “Coal will continue to account for a significant percentage of U.S. electric generation during the next two decades. As a result, CCP production is expected to remain steady, increasing by 5 percent through 2033. Fly ash production is forecast to reach 54.6 million tons in 2033.”
The following chart from the U.S. Energy Information Administration shows the potential significance of the major sources of electricity generation under several different scenarios, all of which show that coal will continue to be a major fuel source for many years to come.
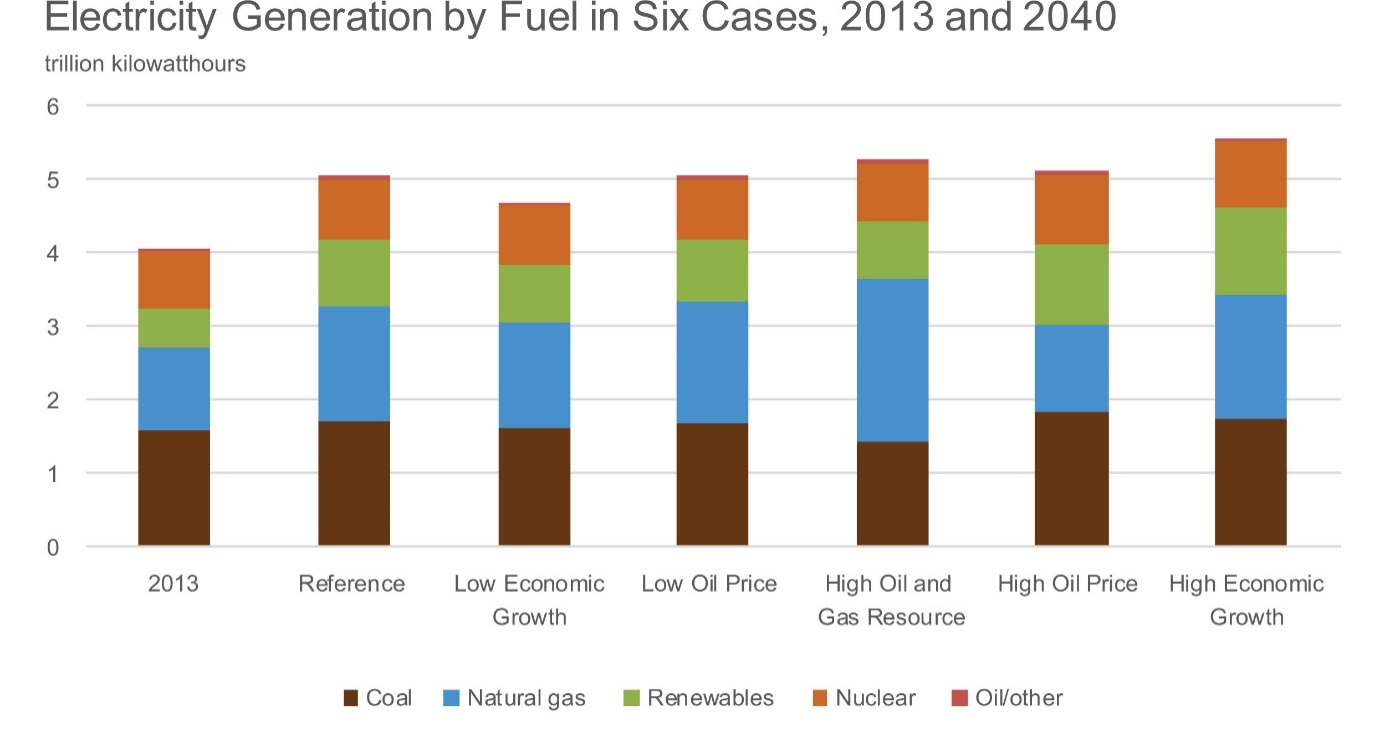
36
Also, as shown in the graph below from the American Road and Transportation Builders Association, CCP supply is expected to grow in the future even as electric generation remains relatively stable.
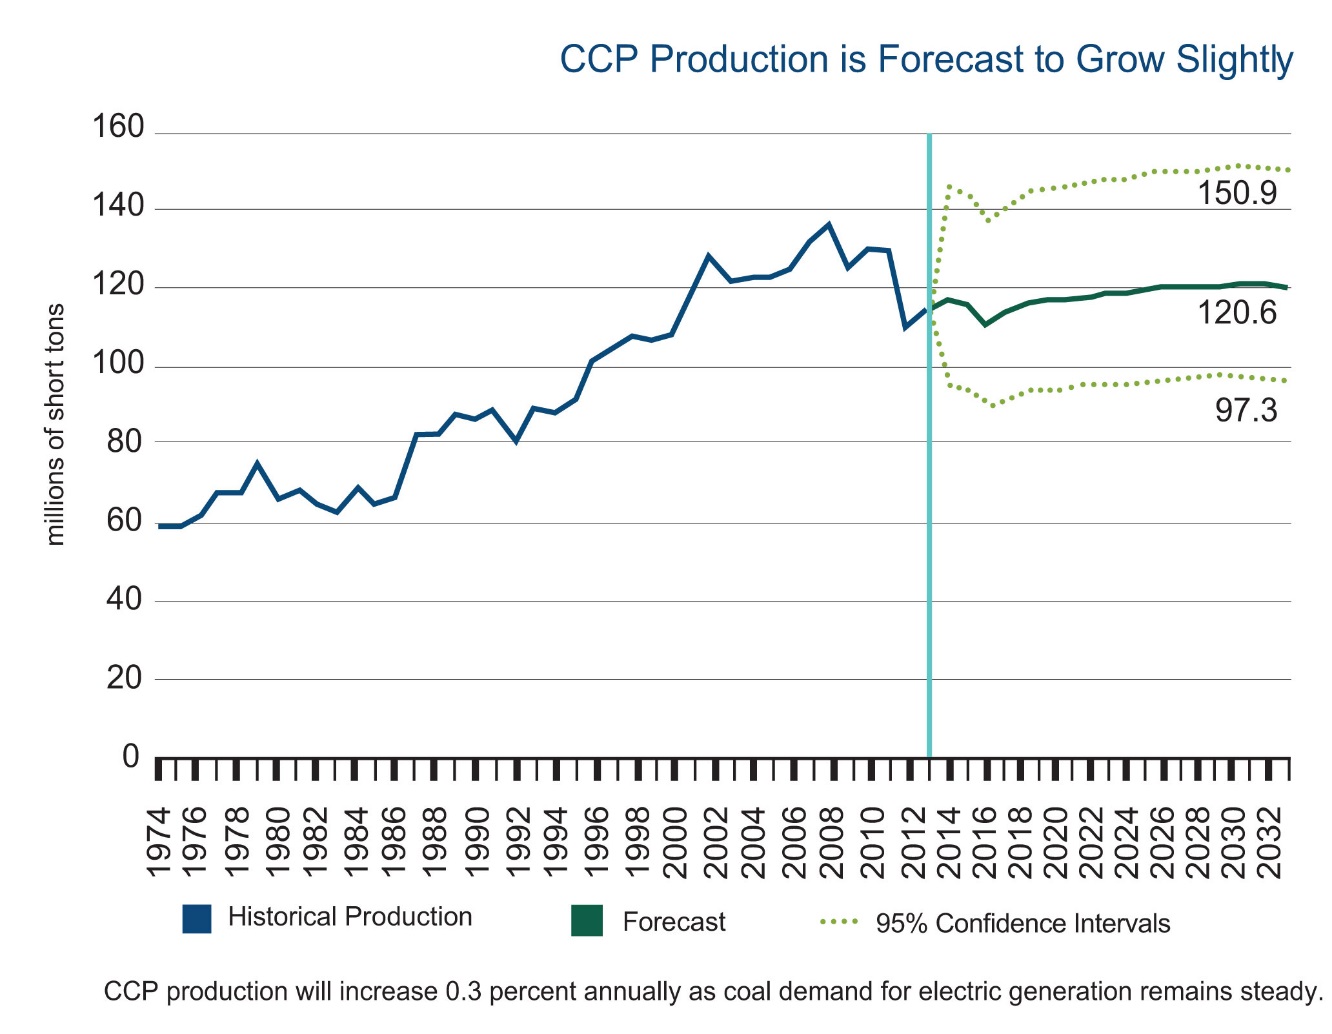
Energy Technology Segment. Energy technology segment revenue was not material for either 2016 or 2015. Revenue is primarily impacted by the timing of shipments to the three refineries which use our HCAT heavy oil upgrading catalyst. Shipments depend upon the timing of orders and customer onsite inventory levels.
Operating Expenses. Selling, general and administrative expenses increased 9% from 2015 to 2016 due to approximately $3.5 million of non-recurring and recurring expenses for the businesses acquired in fiscal 2015 and 2016. The change in amortization of intangible assets was due primarily to the amortizable intangible assets acquired in the 2015 and 2016 business acquisitions.
Net Interest Expense. In 2016, net interest expense increased approximately $1.2 million from 2015, due to one-time costs associated with the repricing of our secured term loan debt which occurred in June 2016. The repricing resulted in a decrease in our annual interest rate on this debt of 0.5%.
Income Tax Provision. Reference is made to Note 9 to the condensed consolidated financial statements for details about the estimated effective income tax rate of 39% for fiscal 2016 and the 12% effective tax rate for 2015, along with the discrete items that have been recognized year to date for both periods.
Discontinued Operations. We recorded $0.3 million of income from discontinued operations in 2016 and $(0.1) million of loss in 2015. The results for both periods include activity related to certain litigation which commenced prior to disposal of the business. Certain of this litigation was favorably settled during the March 2016 quarter, resulting in a gain which was recognized in that period. In accordance with terms of the settlement agreement, we received additional consideration in the June 2016 quarter and could receive additional cash receipts in the future, dependent primarily upon future coal sales by the buyer. Potential future cash receipts are being recognized in the periods when
37
received. Results for both periods also include adjustments of the previously recognized estimated gains related to the coal cleaning facilities sold.
For all sales transactions, a majority of the consideration was in the form of potential production royalties and deferred purchase price, which amounts are dependent upon future plant production levels. Potential future production royalties and deferred purchase price on the sales transactions were not considered as being probable in the original gain calculations and are being accounted for in the periods if and when any such amounts are received. Coal markets in the U.S. have deteriorated since the coal cleaning facilities were sold. We currently expect that additional adjustments to the recognized gains and losses from sale of the facilities may be recorded in the future as certain contingencies are resolved.
In accordance with the terms of the asset purchase agreement for one of the sales transactions, the buyer of the coal cleaning facilities agreed to assume the lease and reclamation obligations related to certain of the facilities. Subsequent to the date of sale, our subsidiaries which sold the facilities amended the purchase agreement to provide the buyer with additional time to make payments, as well as fulfill contractual requirements related to the assumed reclamation obligations. One of our subsidiaries is currently performing permit reclamation responsibilities at one site. As of September 30, 2015 and June 30, 2016, approximately $7.4 million and $9.6 million, respectively, was accrued for this reclamation liability. Certain receivables due from the buyer have also been reserved until such time as collection is more certain.
Nine Months Ended June 30, 2016 Compared to Nine Months Ended June 30, 2015
The information set forth below compares our operating results for the nine months ended June 30, 2016 (2016), with operating results for the nine months ended June 30, 2015 (2015). Except as noted, the references to captions in the Statements of Income refer to continuing operations only.
Summary. Our total revenue for the nine months ended June 30, 2016 was $683.2 million, up 10% from $622.6 million for 2015. Gross profit increased 13%, from $179.6 million in 2015 to $202.7 million in 2016. Operating income of $60.7 million in 2015 improved by 20%, to $73.1 million in 2016. Income from continuing operations in 2015 of $5.3 million, or diluted income per share of $0.06, improved to $33.1 million, or $0.43 per diluted share, in 2016. The 2015 results include $24.8 million of incremental interest expense related to early debt repayments. The 2016 results include additional non-cash tax expense resulting from the release of deferred tax asset valuation allowances in the September 2015 quarter. Discontinued operations were immaterial in both 2015 and 2016.
Revenue and Gross Margins. The major components of segment revenue, along with gross margins, are discussed in the sections below.
Building Products Segment. Building products revenue increased 14%, from $371.8 million in 2015 to $423.7 million in 2016. Gross profit increased 17% to $125.9 million in 2016 from $107.3 million in 2015, and operating income increased 28% to $50.5 million from $39.5 million.
Revenue growth in 2016 was due to higher sales in all of our major product groups as a result of demand driven volume increases and acquisitions completed in fiscal 2015 and 2016. Led by our trim product, our siding products contributed significantly to overall segment revenue growth and margin expansion. Demand has also been strong in our non-residential Texas markets, offsetting any impact from low oil prices on residential construction. Continuous improvement efforts in our stone and block categories also contributed to margin improvement. Several of our product groups continued to benefit from lower raw material, transportation and energy costs, which more than offset increased costs in other areas.
Construction Materials Segment. Construction materials revenue increased by 6% to $255.5 million, compared to $240.8 million in 2015. The increase in revenue is primarily attributable to positive pricing for high-value CCPs and the acquisition of SynMat in March 2016. Gross profit increased by 12% to $74.4 million in 2016, compared to $66.7 million in 2015, and gross margin increased by 140 basis points to 29.1%. Operating income increased $7.0 million, or 17%, from $40.1 million in 2015 to $47.1 million in 2016, with a 180 basis point increase in operating margin. Improvements in gross profit and operating income and in the respective margins were primarily due to the continued favorable pricing environment as well as to cost management initiatives. The favorable pricing environment is the result
38
of solid demand for high quality CCPs used to replace portland cement as well as the continued improvement in portland cement demand and pricing.
Energy Technology Segment. Energy technology segment revenue was not material for either 2016 or 2015. Revenue is primarily impacted by the timing of shipments to the three refineries which use our HCAT heavy oil upgrading catalyst. Shipments depend upon the timing of orders and customer onsite inventory levels.
Operating Expenses. Selling, general and administrative expenses increased 9% from 2015 to 2016 due primarily to approximately $7.8 million of non-recurring and recurring expenses for the businesses acquired in fiscal 2015 and 2016, and to a lesser extent, organic growth in our operations. The change in amortization of intangible assets was due primarily to the amortizable intangible assets acquired in the 2015 and 2016 business acquisitions.
Net Interest Expense. In 2016, net interest expense decreased approximately $30.5 million from 2015, due primarily to the debt restructuring that occurred in the March 2015 quarter. The restructuring transactions resulted in approximately $24.8 million of incremental interest expense related to loss on extinguishment of senior secured debt and early repayments of convertible senior subordinated notes, which transactions are described in detail in Note 7 to the condensed consolidated financial statements. As a result of the 2015 debt restructuring, our ongoing interest costs also decreased by approximately $4.0 million per quarter.
Income Tax Provision. Reference is made to Note 9 to the condensed consolidated financial statements for details about the estimated effective income tax rate of 39% for fiscal 2016 and the 12% effective tax rate for 2015, along with the discrete items recognized in both periods.
Discontinued Operations. We recorded $(0.2) million of loss from discontinued operations in 2016 and ($0.4) million of loss in 2015. The results for both periods include activity related to certain litigation which commenced prior to disposal of the business. Certain of this litigation was favorably settled during the March 2016 quarter, resulting in a gain. Results for both periods also include adjustments of the previously recognized estimated gains related to the coal cleaning facilities sold.
Impact of Inflation and Related Matters
In certain periods, some of our operations in the building products segment have been negatively impacted by increased raw materials costs for commodities such as polypropylene, poly-vinyl chloride, cement and aggregates. Currently, cement and aggregate costs are increasing, while resin costs are stable. In prior periods, we have experienced increases in our transportation costs in many parts of our business. We currently believe it is likely that raw materials and commodities such as fuels, along with the prices of other goods and services, could increase in future periods. We have passed certain increased costs to customers, but it is not possible to accurately predict the future trends of these costs, nor our ability to pass on future cost increases.
There has been a dramatic reduction in oil prices since the summer of 2014, which has had a positive effect on fuel and transportation costs during 2015 and 2016. If oil prices were to remain near their current low level for the long-term, the positive impact on costs may continue for some time, but manufacturers of resins are anticipating increased sales prices as they modify manufacturing capacity. Further, revenues in certain of our operations could be negatively affected by lower oil prices. For example, if oil prices remained low for an extended period of time, the Texas economy could be impacted, which in turn could impact some of our Texas-based revenues. Currently, we do not believe low oil prices will significantly affect 2016 revenues.
Liquidity and Capital Resources
Summary of Cash Flow Activities. Net cash provided by operating activities in 2016 was approximately $79.4 million, compared to net cash provided by operating activities of approximately $5.2 million in 2015, a change of $74.2 million. The primary differences in the components of operating cash flows between the two periods were: 1) the $28.0 million increase in net income in 2016, augmented by a $16.7 million change in deferred tax assets following release of the valuation allowance in September 2015; 2) a $4.1 million increase related to collection of accounts receivable, primarily in the energy technology segment; 3) a $7.0 million increase stemming from reduced inventory build in 2016 as compared to 2015; and 4) an $11.4 million increase related to current payables, due primarily to changes in the
39
amount and timing of interest payments on long-term debt, as a result of the debt restructuring that occurred in the March 2015 quarter.
In 2016, our primary investing activities consisted of business acquisitions and capital expenditures, and in 2015 our primary investing activity consisted of capital expenditures. There were significant financing activities in 2015 related to the restructuring of our long-term debt, with small payments on long-term debt in 2016. More details about our investing and financing activities are provided in the following paragraphs.
Investing Activities. In 2016, we acquired four businesses in the building products industry and one business in the construction materials industry. Combined consideration paid for all of the 2016 acquisitions, net of cash acquired, was approximately $106.9 million, subject to adjustment for the final calculations of acquisition-date working capital, which calculations are currently expected to be finalized in the September 2016 quarter. Direct acquisition costs were not material.
In building products, we acquired 100% of the equity interests in several related companies, together which comprise a stone-coated metal roofing business located in California known as Metro Roof Products, and acquired certain assets and assumed certain liabilities of Enviroshake Inc., a Canadian company that manufactures and sells composite roofing products, primarily in the U.S. and Canada. We also acquired certain decking manufacturing assets which are being relocated to one of our current manufacturing sites. This acquisition provides an opportunity to expand distribution to existing customers, develop additional decking related products, and increase our product and manufacturing expertise. Finally, our minority-owned subsidiary acquired all of the equity interests in several related companies, together which comprise a concrete roof tile business which we will continue to operate in Florida. This acquisition is expected to expand our presence in that niche roofing sector. In construction materials, we acquired 100% of the equity interests in a synthetic gypsum processing and marketing business known as Synthetic Materials, LLC, with operations in several locations in the Eastern U.S. This acquisition is expected to expand our presence in the CCP industry.
In 2015, a majority of capital expenditures for property, plant and equipment was for maintenance of operating capacity in our building products segment, with a smaller amount related to the construction materials segment and more discretionary expenditures for new product lines or projects. In 2016, capital expenditures were more evenly split between maintenance and growth. In both periods, a substantial majority of capital expenditures were made in the building products segment. Capital expenditures for all of fiscal 2016 are currently expected to be approximately $50.0 million, with funding coming from working capital. As of June 30, 2016, we were committed to spend approximately $4.6 million on capital projects that were in various stages of completion.
We intend to continue to expand our business through growth of existing operations in our core building materials segments. Acquisitions have historically been an important part of our long-term business strategy and we continue to look for bolt-on niche acquisitions that meet our criteria and enhance product offerings to our core customer base. Current debt agreements limit potential acquisitions and investments in joint ventures. The ABL Revolver limits potential acquisitions and investments in joint ventures if pro forma net excess availability is 20% or less of total potential availability under the facility. Subsequent to June 30, 2016, we entered into a definitive agreement, subject to certain closing conditions, to acquire substantially all the assets and certain liabilities of Krestmark Industries, L.P. and its affiliates for $240.0 million, subject to adjustments. Krestmark is a manufacturer of high quality vinyl windows, selling to a diverse customer base of homebuilders, lumber yards and distributors in the South Central region of the U.S. We believe Krestmark fits well into our strategy of increasing sales to core customers, with a strong focus on customer service and niche positioning. We intend to finance the acquisition by borrowing.
Following the sale of all remaining coal cleaning facilities in 2013, there are no remaining assets held for sale from our discontinued operations. For all sales transactions, a majority of the consideration was in the form of potential production royalties and deferred purchase price, which amounts are dependent upon plant production levels. Potential future production royalties and deferred purchase price on the sales transactions were not considered as being probable in the original gain calculations and are being accounted for in the periods if and when any such amounts are received.
One of our subsidiaries is currently performing permit reclamation responsibilities at one former coal cleaning site. As of June 30, 2016, approximately $9.6 million was accrued for this reclamation liability. Certain receivables due from the buyer have also been reserved until such time as collection is more certain. It is not possible to accurately predict the timing or amounts of any future cash receipts or payments related to our discontinued coal cleaning business.
40
Financing Activities. In March 2015, we entered into a Term Loan Facility, under which a senior secured loan for $425.0 million was obtained. Features and restrictions relating to the Term Loan Facility are described in Note 7 to the condensed consolidated financial statements.
The Term Loan Facility requires scheduled quarterly repayments in an aggregate annual amount equal to 1.0% of the original principal amount (subject to reduction for certain permitted prepayments), with the balance due at maturity in March 2022, subject to early termination in October 2018 if more than $50.0 million of the 7¼% senior notes remains outstanding at that time. We currently expect to reduce the outstanding amount of the 7¼% senior notes to less than $50.0 million prior to October 2018, either though repayment or refinancing. Except for the required repayments of the senior secured term loan of approximately $1.1 million per quarter, we have no expected debt maturities until January 2019. Pursuant to open market transactions during the March 2016 quarter, we repurchased and cancelled approximately $3.8 million of the 7¼% senior notes. Subsequent to June 30, 2016, we redeemed $47.25 million of these notes at a redemption price equal to 103.625% of the principal amount. The associated premiums and accelerated debt issue costs for both transactions were charged to interest expense. Following the $47.25 million note redemption and a repricing of the secured term loan debt in June 2016, which resulted in a decrease in our annual interest rate on this debt of 0.5%, our annual cash interest expense is expected to decrease by approximately $5.5 million.
We may voluntarily repay outstanding loans under the Term Loan Facility at any time without premium or penalty, other than customary breakage costs with respect to LIBO rate loans, which shall be subject to a prepayment premium of 1.0%. The Term Loan Facility requires us to prepay outstanding term loans, subject to certain exceptions, with (i) up to 50% of our annual excess cash flow, as defined, to the extent such excess cash flow exceeds $1.0 million, commencing with fiscal year 2016, with such required prepayment to be reduced by the amount of voluntary prepayments of term loans and certain other types of senior secured debt; (ii) 100% of the net cash proceeds of certain non-ordinary course asset sales; and (iii) 100% of the net cash proceeds of certain issuances of debt. We were not required to make any prepayments under these requirements during the nine months ended June 30, 2016.
The Term Loan Facility allows us to request one or more incremental term loans and certain other types of incremental debt in an aggregate amount not to exceed $150.0 million plus an additional amount which is dependent on our pro forma net leverage ratio, as defined. Any additional borrowings are contingent upon the receipt of commitments by existing or additional lenders.
Headwaters is a holding company and repayment of our senior secured Term Loan Facility and 7¼% senior unsecured notes is dependent upon cash flow generated by our subsidiaries and their ability to make such cash available to us, by dividend, debt repayment or otherwise. In the event of a default, the ABL Revolver limits the ability of the ABL borrowers, all of which are our subsidiaries, to make distributions to enable us to make payments in respect of our senior secured Term Loan Facility and senior unsecured notes. There are no other significant contractual or governmental restrictions on our ability to obtain funds from our guarantor subsidiaries.
We were in compliance with all debt covenants as of June 30, 2016. The senior secured Term Loan Facility, senior notes and ABL Revolver limit the incurrence of additional debt and liens on assets, prepayment of future new subordinated debt, merging or consolidating with another company, selling all or substantially all assets, making acquisitions and investments and the payment of dividends or distributions, among other things. In addition, if availability under the ABL Revolver is less than 12.5% of the total $70.0 million commitment, or $8.75 million currently, we are required to maintain a monthly fixed charge coverage ratio of at least 1.0x for the preceding twelve-month period.
There have been no borrowings under the ABL Revolver since it was put in place. The ABL Revolver has a termination date of March 2020, with a contingent provision for early termination at any time within three months prior to the earliest maturity date of the Term Loan Facility or the 7¼% senior notes, at which time any amounts borrowed must be repaid. Availability under the ABL Revolver cannot exceed $70.0 million, which includes a $35.0 million sub-line for letters of credit and a $10.5 million swingline facility. Availability under the ABL Revolver is further limited by the borrowing base valuations of the assets of our building products and construction materials segments which secure the borrowings, currently consisting of certain trade receivables and inventories. In addition to the first lien position on these assets, the ABL Revolver lenders have a second priority position on substantially all other assets.
41
As of June 30, 2016, availability under the ABL Revolver was approximately $59.7 million. However, due primarily to the seasonality of our operations, the amount of availability varies from period to period and, while not currently expected, it is possible that the availability under the ABL Revolver could fall below the 12.5% threshold, or $8.75 million, in a future period. As of June 30, 2016, our fixed charge coverage ratio, as defined in the ABL Revolver agreement, is approximately 2.1. The fixed charge coverage ratio is calculated by dividing EBITDAR minus capital expenditures and cash payments for income taxes by fixed charges, as defined. EBITDAR consists of net income i) plus net interest expense, income taxes (as defined), depreciation and amortization, non-cash charges such as goodwill and other impairments, and rent expense; ii) plus or minus other specified adjustments such as equity earnings or loss in joint ventures. Fixed charges consist of cash payments for interest plus certain principal payments and rent expense.
If availability under the ABL Revolver were to decline below $8.75 million at some future date and in addition the fixed charge coverage ratio was below 1.0, the ABL Revolver lender could issue a notice of default. If a notice of default were to become imminent, we would seek an amendment to the ABL Revolver, or alternatively, a waiver of the availability requirement and/or fixed charge coverage ratio for a period of time. We do not currently believe it is likely we will reach the lower limits of both our ABL Revolver and the fixed charge coverage ratio. See Note 7 to the condensed consolidated financial statements for more detailed descriptions of the terms of our long-term debt and our ABL Revolver.
In August 2015, we filed a universal shelf registration statement with the SEC. A prospectus supplement describing the terms of any future securities to be issued is required to be filed before any offering can commence under the registration statement.
Working Capital. As of June 30, 2016, our working capital was $167.1 million (including $87.5 million of cash and cash equivalents) compared to $210.3 million as of September 30, 2015. We currently expect operations to produce positive cash flow during fiscal 2016 and in future years. We also currently believe working capital will be sufficient for our operating needs for the next 12 months, and that it will not be necessary to utilize borrowing capacity under the ABL Revolver for our seasonal operational cash needs in the foreseeable future.
Income Taxes. Cash outlays for income taxes were approximately $3.0 million for both 2016 and 2015. As of June 30, 2016, our U.S. and state NOL and capital loss carryforwards totaled approximately $51.4 million (tax effected). The NOLs expire from 2016 to 2035. In addition, there are approximately $28.0 million of tax credit carryforwards as of June 30, 2016, which expire from 2028 to 2035.
We do not currently expect cash outlays for income taxes during the next 12 months to be significant. Even though we are now recording income tax expense at a normalized rate of approximately 39%, until our NOL and tax credit carryforwards are exhausted, cash payments for income taxes will be minimal. For example, in fiscal 2016, we currently expect cash payments for income taxes to be approximately $5.0 million, representing primarily state income taxes in certain state jurisdictions.
Summary of Future Cash Requirements. Significant cash requirements for the next 12 months, beyond seasonal operational working capital requirements, consist primarily of capital expenditures and interest payments on long-term debt. In subsequent periods, significant cash requirements will include the repayment of debt. See Note 12 to the condensed consolidated financial statements where the potential risks of litigation are described. Adverse conclusions to those legal matters could involve material amounts of cash outlays in future periods.
Legal Matters
We have ongoing litigation and asserted claims which have been incurred during the normal course of business. Reference is made to Note 12 to the condensed consolidated financial statements for a description of our accounting for legal costs and for other information about legal matters.
Recent Accounting Pronouncements
See Note 1 to the condensed consolidated financial statements for a discussion of accounting pronouncements that have been issued which we have not yet adopted.
42
ITEM 3. QUANTITATIVE AND QUALITATIVE DISCLOSURES ABOUT MARKET RISK
We are exposed to financial market risks, primarily related to our stock price and variable-rate debt. We do not use derivative financial instruments for speculative or trading purposes.
Cash Performance Unit Awards. As described in the Form 10-K and in Note 12 to the condensed consolidated financial statements, in fiscal 2014 and 2015 the Compensation Committee approved grants of performance unit awards to certain officers and employees for cash flow generated during those years, including a provision for adjustment for changes in our average stock price during the respective fiscal years. The terms of these awards also included an added feature that provides for potential further adjustment based on cash flows generated in the two years subsequent to the year of grant, or the base performance year. Therefore, adjustments to the estimated liability for the 2014 awards may occur in fiscal 2016 and adjustments to the estimated liability for the 2015 awards may occur in fiscal 2016 and fiscal 2017, depending on cash flows generated in those years.
In the December 2015 quarter, the Committee approved grants of performance unit awards to certain officers and employees for cash flow generated during fiscal 2016, with terms similar to those described above for 2014 and 2015. Expense for these awards, including adjustments for changes in our average stock price during 2016, is being recognized during 2016, subject to potential further adjustment in 2017 and 2018, depending on cash flows generated in those years.
Cash-Settled SAR Grants. As described in Note 12 to the condensed consolidated financial statements, in fiscal 2012 the Committee approved grants to certain officers and employees of approximately 1.0 million cash-settled SARs, approximately 0.1 million of which remain outstanding as of June 30, 2016. These SARs, which are considered liability awards, vested in annual installments through September 30, 2014 and are settled in cash upon exercise by the employee. The SARs must be exercised on or before September 30, 2016, at which time they expire. As of June 30, 2016, approximately $1.4 million has been accrued for outstanding awards because the stock price at that date was above the grant-date stock price of $1.85. Changes in our stock price (whether positive or negative) through the dates employees exercise the SARs will result in adjustments to compensation expense and will be reflected in our Statement of Income in the September 2016 quarter.
Compensation expense (credit) for all cash-settled SARs was approximately $2.9 million and $(0.1) million for the nine months ended June 30, 2015 and 2016, respectively. A change in our stock price of $1.00 would result in an increase or decrease of approximately $0.1 million in the ultimate payout liability for all remaining cash-settled SARs.
Variable-Rate Debt. As described in Note 7 to the condensed consolidated financial statements, we have outstanding a variable-rate Term Loan Facility which currently bears interest at 4.0%. The interest rate cannot decrease below the current level but will increase if the eurocurrency (LIBO) rate exceeds the 1% floor. Assuming there were no change in the amount of debt outstanding and the LIBO rate did increase beyond the floor, a change in the interest rate of 1% could change our interest expense by up to approximately $4.2 million per year. Also as described in Note 7, any future borrowings under our ABL Revolver will bear interest at a variable rate.
ITEM 4. CONTROLS AND PROCEDURES
Disclosure Controls and Procedures — We maintain disclosure controls and procedures that are designed to ensure that information we are required to disclose in the reports that we file or submit under the Securities Exchange Act of 1934 (the Exchange Act), such as this Quarterly Report on Form 10-Q, is recorded, processed, summarized and reported within the time periods specified by SEC rules and forms. Disclosure controls and procedures include, without limitation, controls and procedures designed to ensure that information we are required to disclose in the reports that we file or submit under the Exchange Act is accumulated and communicated to our management, including the Chief Executive Officer (CEO) and the Chief Financial Officer (CFO), to allow timely decisions regarding required disclosure.
Our management evaluated, with the participation of our CEO and CFO, the effectiveness of our disclosure controls and procedures as of June 30, 2016, pursuant to paragraph (b) of Rules 13a-15 and 15d-15 under the Exchange Act. This evaluation included a review of the controls’ objectives and design, the operation of the controls, and the effect of the controls on the information presented in this Quarterly Report. Our management, including the CEO and CFO, do not expect that disclosure controls can or will prevent or detect all errors and all fraud, if any. A control system, no matter how well designed and operated, can provide only reasonable, not absolute, assurance that the objectives of the
43
control system are met. Our disclosure controls and procedures are designed to provide such reasonable assurance of achieving their objectives. Also, the projection of any evaluation of the disclosure controls and procedures to future periods is subject to the risk that the disclosure controls and procedures may become inadequate because of changes in conditions, or that the degree of compliance with the policies or procedures may deteriorate.
Based on their review and evaluation, and subject to the inherent limitations described above, our CEO and CFO have concluded that our disclosure controls and procedures (as defined in Rules 13a-15(e) and 15d-15(e) under the Exchange Act) were effective as of June 30, 2016 at the above-described reasonable assurance level.
Internal Control over Financial Reporting — Management is responsible for establishing and maintaining adequate internal control over financial reporting, as defined in Rules 13a-15(f) and 15d-15(f) under the Exchange Act. Our internal control over financial reporting is designed to provide reasonable assurance regarding the reliability of financial reporting and the preparation of financial statements for external purposes in accordance with accounting principles generally accepted in the United States of America.
Because of inherent limitations, internal control over financial reporting may not prevent or detect misstatements. Therefore, even internal controls determined to be effective can provide only reasonable assurance with respect to financial statement preparation and presentation. The effectiveness of our internal control over financial reporting is subject to various inherent limitations, including cost limitations, judgments used in decision making, assumptions about the likelihood of future events, the possibility of human error, and the risk of fraud. The projection of any evaluation of effectiveness to future periods is subject to the risk that controls may become inadequate because of changes in conditions, or that the degree of compliance with policies may deteriorate. Because of these limitations, there can be no assurance that any system of internal control over financial reporting will be successful in preventing all errors or fraud or in making all material information known in a timely manner to the appropriate levels of management.
There has been no change in our internal control over financial reporting during the quarter ended June 30, 2016 that has materially affected, or is reasonably likely to materially affect, our internal control over financial reporting.
44
See “Legal Matters” in Note 12 to the condensed consolidated financial statements for a description of current legal proceedings.
Risks relating to our business, our common stock and indebtedness are described in Item 1A of our Form 10-K.
ITEM 2. UNREGISTERED SALES OF EQUITY SECURITIES AND USE OF PROCEEDS
We did not have any sales of unregistered equity securities during the quarter ended June 30, 2016, but did purchase treasury stock. As described in Note 10 to the condensed consolidated financial statements, we have a Directors’ Deferred Compensation Plan (DDCP) under which non-employee directors can elect to defer certain compensation and choose from various options how the deferred compensation will be invested. One of the investment options is Headwaters common stock. When an eligible director chooses our common stock as an investment option, we purchase the common stock in open-market transactions in accordance with the director’s request and hold the shares until such time as the deferred compensation obligation becomes payable. At such time, the treasury shares will be distributed to the director in satisfaction of the obligation.
The following table provides details about the treasury stock purchased in connection with the DDCP during the quarter ended June 30, 2016.
|
|
|
|
|
|
|
|
Total Number of |
|
Approximate Dollar |
|
|
|
|
Total |
|
Average |
|
Shares Purchased |
|
Value of Shares that |
|
|
|
|
|
Number of |
|
Price |
|
as Part of Publicly |
|
May Yet Be |
|
|
|
|
|
Shares |
|
Paid per |
|
Announced Plans |
|
Purchased Under the |
|
|
|
Period |
|
Purchased |
|
Share(1) |
|
or Programs |
|
Plans or Programs |
|
|
|
April 1, 2016 – April 30, 2016 |
|
0 |
|
|
n/a |
|
n/a |
|
n/a |
|
|
May 1, 2016– May 31, 2016 |
|
5,406 |
|
$ |
18.96 |
|
n/a |
|
n/a |
|
|
June 1, 2016 – June 30, 2016 |
|
0 |
|
|
n/a |
|
n/a |
|
n/a |
|
|
Total |
|
5,406 |
|
$ |
18.96 |
|
n/a |
|
n/a |
|
|
(1) |
Includes broker commissions. |
ITEM 3. DEFAULTS UPON SENIOR SECURITIES
None.
ITEM 4. MINE SAFETY DISCLOSURES
Our discontinued coal cleaning operations were subject to regulation by the federal Mine Safety and Health Administration under the Federal Mine Safety and Health Act of 1977. Because one of Headwaters’ subsidiaries is currently performing permit reclamation responsibilities at one site, information concerning mine safety violations or other regulatory matters required by section 1503(a) of the Dodd-Frank Wall Street Reform and Consumer Protection Act and Item 106 of Regulation S-K (17 CFR 229.106) has been included in Exhibit 95 to this quarterly report.
None.
45
The following exhibits are included herein:
|
10.60 |
|
Amended and Restated Employment Agreement with Kirk A. Benson dated as of August 1, 2016 |
|
* |
|
|
12 |
|
Computation of ratio of earnings to combined fixed charges and preferred stock dividends |
|
* |
|
|
31.1 |
|
Rule 13a-14(a)/15d-14(a) Certification of Chief Executive Officer |
|
* |
|
|
31.2 |
|
Rule 13a-14(a)/15d-14(a) Certification of Chief Financial Officer |
|
* |
|
|
32 |
|
Section 1350 Certifications of Chief Executive Officer and Chief Financial Officer |
|
* |
|
|
95 |
|
Mine Safety Disclosure |
|
* |
|
|
101.INS |
|
XBRL Instance document |
|
* |
|
|
101.SCH |
|
XBRL Taxonomy extension schema |
|
* |
|
|
101.CAL |
|
XBRL Taxonomy extension calculation linkbase |
|
* |
|
|
101.DEF |
|
XBRL Taxonomy extension definition linkbase |
|
* |
|
|
101.LAB |
|
XBRL Taxonomy extension label linkbase |
|
* |
|
|
101.PRE |
|
XBRL Taxonomy extension presentation linkbase |
|
* |
|
*Filed herewith.
46
Pursuant to the requirements of the Securities Exchange Act of 1934, the registrant has duly caused this report to be signed on its behalf by the undersigned thereunto duly authorized.
|
|
HEADWATERS INCORPORATED |
|
|
|
|
|
|
Date: August 3, 2016 |
By: |
/s/ Kirk A. Benson |
|
|
|
Kirk A. Benson, Chief Executive Officer |
|
|
|
(Principal Executive Officer) |
|
|
|
|
|
Date: August 3, 2016 |
By: |
/s/ Donald P. Newman |
|
|
|
Donald P. Newman, Chief Financial Officer |
|
|
|
(Principal Financial Officer) |
47