Attached files
| file | filename |
|---|---|
| EX-32.1 - CERTIFICATIONS OF CEO AND CFO PURSUANT TO SECTION 906 - DreamWorks Animation, LLC | dwaex32163016.htm |
| EX-31.2 - CERTIFICATION OF CFO PURSUANT TO SECTION 302 - DreamWorks Animation, LLC | dwaex31263016.htm |
| EX-31.1 - CERTIFICATION OF CEO PURSUANT TO SECTION 302 - DreamWorks Animation, LLC | dwaex31163016.htm |
UNITED STATES
SECURITIES AND EXCHANGE COMMISSION
WASHINGTON, D.C. 20549
___________________________
FORM 10-Q
___________________________
QUARTERLY REPORT PURSUANT TO SECTION 13 OR 15(d) OF
THE SECURITIES EXCHANGE ACT OF 1934
For the quarterly period ended June 30, 2016
Commission File Number 001-32337
DREAMWORKS ANIMATION SKG, INC.
(Exact name of registrant as specified in its charter)
Delaware | 68-0589190 |
(State or other jurisdiction of incorporation or organization) | (I.R.S. Employer Identification No.) |
1000 Flower Street
Glendale, California 91201
(Address of principal executive offices) (Zip code)
(818) 695-5000
(Registrant's telephone number, including area code)
Indicate by check mark whether the registrant (1) has filed all reports required to be filed by Section 13 or 15(d) of the Securities Exchange Act of 1934 during the preceding 12 months (or for such shorter period that the registrant was required to file such reports), and (2) has been subject to such filing requirements for the past 90 days. Yes x No o.
Indicate by check mark whether the registrant has submitted electronically and posted on its corporate Web site, if any, every Interactive Data File required to be submitted and posted pursuant to Rule 405 of Regulation S-T (§232.405 of this chapter) during the preceding 12 months (or for such shorter period that the registrant was required to submit and post such files). Yes x No o
Indicate by check mark whether the registrant is a large accelerated filer, an accelerated filer, a non-accelerated filer, or a smaller reporting company. See the definition of "large accelerated filer," "accelerated filer" and "smaller reporting company" in Rule 12b-2 of the Exchange Act. (Check one):
Large accelerated filer | T | Accelerated filer | o |
Non-accelerated filer | o (Do not check if a smaller reporting company) | Smaller reporting company | o |
Indicate by check mark whether the registrant is a shell company (as defined in Rule 12b-2 of the Exchange Act). Yes o No x.
Indicate the number of shares outstanding of each of the registrant's classes of common stock: As of July 22, 2016, there were 78,865,251 shares of Class A common stock and 7,838,731 shares of Class B common stock of the registrant outstanding.
TABLE OF CONTENTS
Page | ||
PART I. | ||
Item 1. | ||
Item 2. | ||
Item 3. | ||
Item 4. | ||
PART II. | ||
Item 1. | ||
Item 1A. | ||
Item 2. | ||
Item 5. | ||
Item 6. | ||
Unless the context otherwise requires, the terms "DreamWorks Animation," the "Company," "we," "us" and "our" refer to DreamWorks Animation SKG, Inc., its consolidated subsidiaries, predecessors in interest and the subsidiaries and assets and liabilities contributed to it by the entity then known as DreamWorks L.L.C. ("Old DreamWorks Studios") on October 27, 2004 (the "Separation Date") in connection with our separation from Old DreamWorks Studios (the "Separation").
1
PART I—FINANCIAL INFORMATION
ITEM 1. | FINANCIAL STATEMENTS |
DREAMWORKS ANIMATION SKG, INC.
CONSOLIDATED BALANCE SHEETS
(Unaudited)
June 30, 2016 | December 31, 2015 | ||||||
(in thousands, except par value and share amounts) | |||||||
Assets | |||||||
Cash and cash equivalents | $ | 75,145 | $ | 110,814 | |||
Trade accounts receivable, net of allowance for doubtful accounts (see Note 6 for related party amounts) | 249,790 | 271,466 | |||||
Receivables from distributors, net of allowance for doubtful accounts (see Note 6 for related party amounts) | 254,918 | 230,569 | |||||
Film and other inventory costs, net | 853,324 | 820,454 | |||||
Prepaid expenses | 30,074 | 29,133 | |||||
Other assets | 68,266 | 69,098 | |||||
Investments in unconsolidated entities | 39,829 | 32,814 | |||||
Property, plant and equipment, net of accumulated depreciation and amortization | 47,834 | 37,765 | |||||
Intangible assets, net of accumulated amortization | 164,637 | 172,328 | |||||
Goodwill | 190,668 | 190,668 | |||||
Total assets | $ | 1,974,485 | $ | 1,965,109 | |||
Liabilities and Equity | |||||||
Liabilities: | |||||||
Accounts payable | $ | 14,602 | $ | 10,847 | |||
Accrued liabilities | 172,939 | 199,665 | |||||
Payable to former stockholder | 4,392 | 20,776 | |||||
Deferred revenue and other advances | 54,571 | 74,659 | |||||
Deferred gain on sale-leaseback transaction | 85,129 | 87,410 | |||||
Revolving credit facility | 108,000 | 60,000 | |||||
Senior unsecured notes, net of deferred financing costs | 295,665 | 295,134 | |||||
Deferred taxes, net | 18,483 | 17,778 | |||||
Total liabilities | 753,781 | 766,269 | |||||
Commitments and contingencies (Note 16) | |||||||
Equity: | |||||||
DreamWorks Animation SKG, Inc. Stockholders' Equity: | |||||||
Class A common stock, par value $0.01 per share, 350,000,000 shares authorized, 107,439,137 and 106,907,772 shares issued, as of June 30, 2016 and December 31, 2015, respectively | 1,075 | 1,069 | |||||
Class B common stock, par value $0.01 per share, 150,000,000 shares authorized, 7,838,731 shares issued and outstanding, as of June 30, 2016 and December 31, 2015 | 78 | 78 | |||||
Additional paid-in capital | 1,244,317 | 1,227,220 | |||||
Accumulated other comprehensive loss | (7,436 | ) | (3,642 | ) | |||
Retained earnings | 724,148 | 707,978 | |||||
Less: Class A Treasury common stock, at cost, 28,580,112 and 28,401,898 shares, as of June 30, 2016 and December 31, 2015, respectively | (793,947 | ) | (789,186 | ) | |||
Total DreamWorks Animation SKG, Inc. stockholders' equity | 1,168,235 | 1,143,517 | |||||
Non-controlling interests | 52,469 | 55,323 | |||||
Total equity | 1,220,704 | 1,198,840 | |||||
Total liabilities and equity | $ | 1,974,485 | $ | 1,965,109 | |||
See accompanying notes.
2
DREAMWORKS ANIMATION SKG, INC.
CONSOLIDATED STATEMENTS OF OPERATIONS
(Unaudited)
Three Months Ended | Six Months Ended | ||||||||||||||
June 30, | June 30, | ||||||||||||||
2016 | 2015 | 2016 | 2015 | ||||||||||||
(in thousands, except per share amounts) | |||||||||||||||
Revenues (see Note 6 for related party amounts) | $ | 220,926 | $ | 170,782 | $ | 411,368 | $ | 337,312 | |||||||
Operating expenses (income): | |||||||||||||||
Costs of revenues | 121,903 | 99,939 | 236,527 | 206,104 | |||||||||||
Selling and marketing | 7,476 | 12,077 | 13,616 | 20,552 | |||||||||||
General and administrative | 87,612 | 80,736 | 147,862 | 169,878 | |||||||||||
Product development | 595 | 1,592 | 1,140 | 1,924 | |||||||||||
Other operating income (see Note 6 for related party amounts) | (6,077 | ) | (1,719 | ) | (11,018 | ) | (4,000 | ) | |||||||
Operating income (loss) | 9,417 | (21,843 | ) | 23,241 | (57,146 | ) | |||||||||
Non-operating income (expense): | |||||||||||||||
Interest expense, net | (3,593 | ) | (7,564 | ) | (8,580 | ) | (13,898 | ) | |||||||
Other income (expense), net | 475 | 2,001 | 2,367 | (3,465 | ) | ||||||||||
Increase in income tax benefit payable to former stockholder | — | (7,096 | ) | — | (7,121 | ) | |||||||||
Income (loss) before loss from equity method investees and income taxes | 6,299 | (34,502 | ) | 17,028 | (81,630 | ) | |||||||||
Loss from equity method investees | (3,572 | ) | (2,775 | ) | (1,030 | ) | (9,137 | ) | |||||||
Income (loss) before income taxes | 2,727 | (37,277 | ) | 15,998 | (90,767 | ) | |||||||||
Provision for income taxes | 1,327 | 1,762 | 2,457 | 4,162 | |||||||||||
Net income (loss) | 1,400 | (39,039 | ) | 13,541 | (94,929 | ) | |||||||||
Less: Net loss attributable to non-controlling interests | (934 | ) | (456 | ) | (2,629 | ) | (1,569 | ) | |||||||
Net income (loss) attributable to DreamWorks Animation SKG, Inc. | $ | 2,334 | $ | (38,583 | ) | $ | 16,170 | $ | (93,360 | ) | |||||
Net income (loss) per share of common stock attributable to DreamWorks Animation SKG, Inc. | |||||||||||||||
Basic net income (loss) per share | $ | 0.03 | $ | (0.45 | ) | $ | 0.19 | $ | (1.09 | ) | |||||
Diluted net income (loss) per share | $ | 0.03 | $ | (0.45 | ) | $ | 0.18 | $ | (1.09 | ) | |||||
Shares used in computing net income (loss) per share | |||||||||||||||
Basic | 86,627 | 85,732 | 86,513 | 85,674 | |||||||||||
Diluted | 89,445 | 85,732 | 88,903 | 85,674 | |||||||||||
See accompanying notes.
3
DREAMWORKS ANIMATION SKG, INC.
CONSOLIDATED STATEMENTS OF COMPREHENSIVE (LOSS) INCOME
(Unaudited)
Three Months Ended | Six Months Ended | |||||||||||||||
June 30, | June 30, | |||||||||||||||
2016 | 2015 | 2016 | 2015 | |||||||||||||
(in thousands) | ||||||||||||||||
Net income (loss) | $ | 1,400 | $ | (39,039 | ) | $ | 13,541 | $ | (94,929 | ) | ||||||
Other comprehensive (loss) income, net of tax: | ||||||||||||||||
Foreign currency translation (losses) gains | (2,971 | ) | 852 | (3,794 | ) | 42 | ||||||||||
Comprehensive (loss) income | (1,571 | ) | (38,187 | ) | 9,747 | (94,887 | ) | |||||||||
Less: Comprehensive loss attributable to non-controlling interests | (934 | ) | (456 | ) | (2,629 | ) | (1,569 | ) | ||||||||
Comprehensive (loss) income attributable to DreamWorks Animation SKG, Inc. | $ | (637 | ) | $ | (37,731 | ) | $ | 12,376 | $ | (93,318 | ) | |||||
See accompanying notes.
4
DREAMWORKS ANIMATION SKG, INC. CONSOLIDATED STATEMENTS OF CASH FLOWS (Unaudited) | |||||||
Six Months Ended | |||||||
June 30, | |||||||
2016 | 2015 | ||||||
(in thousands) | |||||||
Operating activities | |||||||
Net income (loss) | $ | 13,541 | $ | (94,929 | ) | ||
Adjustments to reconcile net income (loss) to net cash (used in) provided by operating activities: | |||||||
Amortization and write-off of film and other inventory costs | 197,073 | 182,239 | |||||
Other impairments and write-offs | — | 5,064 | |||||
Amortization of intangible and other assets | 9,527 | 10,250 | |||||
Depreciation and amortization | 3,126 | 17,756 | |||||
Amortization of deferred financing costs | 1,215 | 1,200 | |||||
Amortization of deferred gain on sale-leaseback transaction | (2,281 | ) | — | ||||
Stock-based compensation expense | 12,097 | 10,727 | |||||
Revenue earned against deferred revenue and other advances | (73,951 | ) | (35,608 | ) | |||
Income related to investment contributions | (6,545 | ) | (4,000 | ) | |||
Loss from equity method investees | 1,030 | 9,137 | |||||
Deferred taxes, net | 702 | 1,267 | |||||
Changes in operating assets and liabilities: | |||||||
Restricted cash | — | 17,252 | |||||
Trade accounts receivable | 19,281 | (18,989 | ) | ||||
Receivables from distributors | (25,813 | ) | 53,169 | ||||
Film and other inventory costs | (221,883 | ) | (179,791 | ) | |||
Prepaid expenses and other assets | (11,463 | ) | (37,656 | ) | |||
Accounts payable and accrued liabilities | (22,176 | ) | (23,440 | ) | |||
Payable to former stockholder | (16,384 | ) | (231 | ) | |||
Deferred revenue and other advances | 65,944 | 93,924 | |||||
Net cash (used in) provided by operating activities | (56,960 | ) | 7,341 | ||||
Investing activities | |||||||
Investments in unconsolidated entities | — | (2,298 | ) | ||||
Purchases of property, plant and equipment | (21,792 | ) | (4,595 | ) | |||
Net cash used in investing activities | (21,792 | ) | (6,893 | ) | |||
Financing activities | |||||||
Deferred financing costs | — | (6,286 | ) | ||||
Purchase of treasury stock | (4,761 | ) | (3,066 | ) | |||
Contingent consideration payment | — | (335 | ) | ||||
Borrowings from revolving credit facility | 99,000 | 385,405 | |||||
Repayments of borrowings from revolving credit facility | (51,000 | ) | (485,405 | ) | |||
Proceeds from lease financing obligation | — | 185,000 | |||||
Repayments of lease financing obligation | — | (1,399 | ) | ||||
Capital contribution from non-controlling interest holder | — | 15,000 | |||||
Distributions to non-controlling interest holder | (225 | ) | (813 | ) | |||
Net cash provided by financing activities | 43,014 | 88,101 | |||||
Effect of exchange rate changes on cash and cash equivalents | 69 | (574 | ) | ||||
(Decrease) increase in cash and cash equivalents | (35,669 | ) | 87,975 | ||||
Cash and cash equivalents at beginning of period | 110,814 | 34,227 | |||||
Cash and cash equivalents at end of period | $ | 75,145 | $ | 122,202 | |||
Non-cash investing activities: | |||||||
Intellectual property and technology licenses granted in exchange for equity interest | $ | 7,792 | $ | 3,945 | |||
Services provided in exchange for equity interest | 253 | 55 | |||||
Total non-cash investing activities | $ | 8,045 | $ | 4,000 | |||
Supplemental disclosure of cash flow information: | |||||||
Cash paid during the period for income taxes, net of amounts refunded | $ | 1,452 | $ | 2,897 | |||
Cash paid during the period for interest, net of amounts capitalized | $ | 10,321 | $ | 14,675 | |||
See accompanying notes.
5
DREAMWORKS ANIMATION SKG, INC.
NOTES TO UNAUDITED CONSOLIDATED FINANCIAL STATEMENTS
1. | Business and Basis of Presentation |
Business
The business of DreamWorks Animation SKG, Inc. ("DreamWorks Animation" or the "Company") is primarily devoted to the development, production and exploitation of animated films (and other audiovisual programs) and their associated characters in the worldwide theatrical, home entertainment, digital, television, merchandising, licensing and other markets. The Company continues to expand its library and increase the value of its intellectual property assets by developing and producing new episodic series and other non-theatrical content based on characters from its feature films. In addition, the Company has an extensive library of other intellectual property rights, which can be exploited in various markets. The Company's activities also include technology initiatives as it explores opportunities to exploit its internally developed software.
The Company's business also includes AwesomenessTV ("ATV"), a multi-media platform company that generates revenues primarily from the production and distribution of content across a variety of channels, including short-form online video, theatrical, home entertainment, television and online video-on-demand, and sponsorship arrangements. On December 11, 2014, the Company entered into a Unit Purchase Agreement (the "Unit Purchase Agreement") with an affiliate of Hearst Corporation ("Hearst"). Pursuant to the Unit Purchase Agreement, Hearst acquired a 25% equity interest in a newly formed joint venture ("ATV Joint Venture") conducting the ATV business. The Company is consolidating the results of this joint venture because the Company continues to retain control over the operations of ATV. Subsequent to June 30, 2016, additional interests in the ATV Joint Venture were sold to an additional third party investor, which reduced the Company's ownership percentage in the joint venture. Refer to Note 19 for further information.
Pending Acquisition by Comcast Corporation
On April 28, 2016, the Company, Comcast Corporation ("Comcast") and Comcast Paris Newco, Inc., a wholly-owned subsidiary of Comcast ("Merger Sub"), entered into an Agreement and Plan of Merger (the "Merger Agreement"). Upon the terms and subject to the conditions set forth in the Merger Agreement, Merger Sub will merge with and into DreamWorks Animation, with DreamWorks Animation continuing as the surviving corporation and a wholly-owned subsidiary of Comcast (the "Merger").
Pursuant to the Merger Agreement, upon the closing of the Merger, each share of the Company's Class A common stock and Class B common stock (collectively, "Company common stock"), issued and outstanding immediately prior to the effective time of the Merger (other than shares owned by the Company, Comcast, Merger Sub or any other subsidiary of Comcast or shares with respect to which appraisal rights have been properly exercised in accordance with the General Corporation Law of the State of Delaware) will be converted into the right to receive $41.00 in cash, without interest and less any applicable withholding taxes (the "Merger Consideration"). Each Company option and each Company stock appreciation right outstanding immediately prior to the effective time of the Merger, whether or not then vested and exercisable, will be cancelled and converted into the right to receive, for each share of Company common stock subject to such stock option or stock appreciation right, an amount in cash, without interest, equal to the excess, if any, of the Merger Consideration over the per share exercise price of such option or stock appreciation right. Each Company restricted stock unit and each Company performance restricted stock unit outstanding immediately prior to the effective time of the Merger will be cancelled and converted into the right to receive an amount in cash, without interest, equal to the Merger Consideration multiplied by the number of shares of Company common stock subject to such restricted stock unit or performance restricted stock unit (assuming in the case of performance restricted stock units, that applicable performance conditions are deemed to be achieved at the greater of target and actual performance). Each Company restricted share outstanding immediately prior to the effective time of the Merger will be cancelled and converted into the right to receive an amount in cash, without interest, equal to the Merger Consideration.
The consummation of the Merger is subject to customary closing conditions, including (i) receiving the approval of holders of a majority of the voting power of the outstanding Company common stock, which approval was effected after execution of the Merger Agreement, by written consent of the Company's controlling stockholder, Jeffrey Katzenberg, (ii) the absence of legal restraints preventing the consummation of the Merger and (iii) the expiration or termination of the applicable waiting period under the Hart-Scott-Rodino Antitrust Improvements Act of 1976, as amended (the termination of such waiting period was effective on June 20, 2016), and receipt of specified other regulatory consents and approvals.
6
Table of Contents
DREAMWORKS ANIMATION SKG, INC.
NOTES TO UNAUDITED CONSOLIDATED FINANCIAL STATEMENTS—(Continued)
The Merger Agreement contains certain customary covenants, including covenants providing (i) for each of the parties to use reasonable best efforts to cause the transaction to be consummated and (ii) for DreamWorks Animation to carry on its business in the ordinary course during the interim period between the execution of the Merger Agreement and completion of the Merger. The Merger is expected to close in 2016, subject to receipt of certain international regulatory approvals and the satisfaction of other customary closing conditions.
The Merger Agreement contains specified termination rights for the parties. In connection with the termination of the Merger Agreement under certain circumstances, the Company will be required to pay to Comcast a "termination fee" equal to $152.0 million. Additionally, in connection with the termination of the Merger Agreement under specified antitrust-related circumstances, Comcast will be required to pay to DreamWorks Animation a "reverse termination fee" equal to $200.0 million.
The foregoing description of the Merger Agreement does not purport to be complete and is subject to, and qualified in its entirety by, the full text of the Merger Agreement, a copy of which is attached as Exhibit 2.1 to the Current Report on Form 8-K filed by the Company on April 28, 2016.
Distribution and Servicing Arrangements
The Company derives revenue from Twentieth Century Fox Film Corporation's worldwide (excluding China and South Korea) exploitation of its films in the theatrical and post-theatrical markets. Pursuant to a binding term sheet (the "Fox Distribution Agreement") entered into with Twentieth Century Fox and Twentieth Century Fox Home Entertainment, LLC (collectively, "Fox"), the Company has agreed to license Fox certain exclusive distribution rights and exclusively engage Fox to render fulfillment services with respect to certain of the Company's animated feature films and other audiovisual programs theatrically released during the five-year period beginning on January 1, 2013. As of July 1, 2014, Fox has also been licensed and engaged to render fulfillment services for the Company's feature films theatrically released prior to January 1, 2013 in theatrical, non-theatrical, home entertainment and digital media. The rights licensed to, and serviced by, Fox will terminate on the date that is one year after the initial home video release date in the United States ("U.S.") of the last film theatrically released by Fox during such five-year period, subject to licenses approved by the Company during such period that extend beyond such period.
Also beginning in 2013, the Company's films are distributed in China and South Korea territories by separate distributors in each of these territories. The key terms of the Company's distribution arrangements with its Chinese and South Korean distributors are largely similar to those with Fox and Paramount such that the Company also recognizes revenues earned under these arrangements on a net basis. The Company's distribution partner in China is a subsidiary of Oriental DreamWorks Holding Limited ("ODW"), which is a related party (See Note 6).
In addition, the Company continues to derive revenues from the distribution by Paramount Pictures Corporation, a subsidiary of Viacom Inc., and its affiliates (collectively, "Paramount") of its feature films released prior to January 1, 2013 pursuant to a distribution agreement and a fulfillment services agreement (collectively, the "Paramount Agreements"). As of July 1, 2014, the Company reacquired certain distribution rights to its feature films from Paramount, which rights have been licensed to Fox (as noted above). The amount paid to reacquire these rights was recorded as a definite-lived intangible asset. Paramount will continue to exploit and render fulfillment services in television and related media for feature films released prior to January 1, 2013 until the date that is 16 years after such film's theatrical release, and will continue to exploit and service certain other agreements with Paramount's sublicensees that remain in place after July 1, 2014.
The Company generally retains all other rights to exploit its films, including commercial tie-in and promotional rights with respect to each film, as well as merchandising, interactive, literary publishing, music publishing and soundtrack rights. The Company's activities associated with its episodic series and ATV business are generally not subject to the Company's distribution agreements with its theatrical distributors.
Basis of Presentation
The accompanying unaudited financial data as of June 30, 2016 and for the three and six months ended June 30, 2016 and 2015 has been prepared by the Company pursuant to the rules and regulations of the Securities and Exchange Commission (the "SEC") and in accordance with U.S. generally accepted accounting principles ("U.S. GAAP") for interim financial information. Accordingly, certain information and footnote disclosures normally included in comprehensive financial statements have been condensed or omitted pursuant to such rules and regulations. The consolidated balance sheet as of
7
Table of Contents
DREAMWORKS ANIMATION SKG, INC.
NOTES TO UNAUDITED CONSOLIDATED FINANCIAL STATEMENTS—(Continued)
December 31, 2015 was derived from the audited financial statements at that date, but does not include all the information and footnotes required by U.S. GAAP. These financial statements should be read in conjunction with the consolidated financial statements and related notes included in the Company's Annual Report on Form 10-K for the year ended December 31, 2015 (the "2015 Form 10-K").
The accompanying unaudited consolidated financial statements reflect all adjustments, consisting of only normal recurring items, which in the opinion of management, are necessary for a fair statement for the periods shown. The results of operations for such periods are not necessarily indicative of the results expected for the full year, or for any future period, as fluctuations can occur based upon the timing of the Company's films' theatrical and home entertainment releases, and deliveries of episodic content.
Reclassifications
Certain amounts in the prior period consolidated financial statements have been reclassified to conform to the Company's 2016 presentation.
Consolidation
The consolidated financial statements of the Company present the financial position, results of operations and cash flows of DreamWorks Animation and its wholly-owned and majority-owned subsidiaries. The Company also consolidates less-than-wholly owned entities if the Company has a controlling financial interest in that entity. The Company uses the equity method of accounting for investments in companies in which it has a 50% or less ownership interest and has the ability to exercise significant influence. Such investments are presented as investments in unconsolidated entities on the Company's consolidated balance sheets (refer to Note 6 for further information of such investments). Prior to recording its share of net income or losses from equity method investees, investee financial statements are converted to U.S. GAAP. All significant intercompany accounts and transactions have been eliminated. Intra-entity profit related to transactions with equity method investees is eliminated until the amounts are ultimately realized.
In addition, the Company reviews its relationships with other entities to identify whether they are variable interest entities ("VIE") as defined by the Financial Accounting Standards Board ("FASB"), and to assess whether the Company is the primary beneficiary of such entity. If the determination is made that the Company is the primary beneficiary, then the entity is consolidated. As of June 30, 2016, the Company determined that it continued to have a variable interest in ODW as ODW does not have sufficient equity at risk (i.e., cash on hand to fund its operations) as a result of the timing of capital contributions to the entity in accordance with the Transaction and Contribution Agreement (see Note 6). However, the Company concluded that it is not the primary beneficiary of ODW as it does not have deemed control of ODW. As a result, it does not consolidate ODW into its financial statements. Refer to Note 6 for further discussion of how the Company accounts for its investment in ODW, including the remaining contributions (which represent the maximum exposure to the Company).
Use of Estimates
The preparation of financial statements in conformity with U.S. GAAP requires management to make estimates and assumptions that affect the amounts reported in the financial statements and accompanying notes. The most significant estimates made by management in the preparation of the financial statements relate to the following:
• | ultimate revenues and ultimate costs of film and television product; |
• | relative selling price of the Company's products for purposes of revenue allocation in multi-property licenses and other multiple deliverable arrangements; |
• | determination of the fair value of reporting units for purposes of testing goodwill for impairment; |
• | determination of fair value of non-cash contributions to investments in unconsolidated entities; |
• | useful lives of intangible assets; |
• | product sales that will be returned and the amount of receivables that ultimately will be collected; |
• | the potential outcome of future tax consequences of events that have been recognized in the Company's financial statements; |
• | loss contingencies; and |
• | assumptions used in the determination of the fair value of equity-based awards for stock-based compensation or their probability of vesting. |
8
Table of Contents
DREAMWORKS ANIMATION SKG, INC.
NOTES TO UNAUDITED CONSOLIDATED FINANCIAL STATEMENTS—(Continued)
Actual results could differ from those estimates. To the extent that there are material differences between these estimates and actual results, the Company's financial condition or results of operations will be affected. Estimates are based on past experience and other assumptions that management believes are reasonable under the circumstances, and management evaluates these estimates on an ongoing basis.
2. | Recent Accounting Pronouncements |
In March 2016, the FASB issued an accounting standards update to simplify certain provisions related to the accounting for stock-based compensation. First, the guidance requires the income tax effects of stock-based compensation awards to be recognized in the income statement when the awards vest or are settled and is to be applied on a prospective basis. The guidance also requires the presentation of excess tax benefits as an operating activity on the statements of cash flows rather than as a financing activity, and this presentation can be applied retrospectively or prospectively. The guidance also increases the amount companies can withhold to cover income taxes on awards without triggering liability classification for shares used to satisfy statutory income tax withholding obligations and requires application of a modified retrospective transition method for this provision. Lastly, the new guidance allows the Company to make an entity-wide election to either continue estimating the number of awards that are expected to vest or account for forfeitures as they occur. The guidance is effective for the Company's fiscal years beginning January 1, 2017, including interim periods within that fiscal year, with early adoption permitted. However, all provisions would need to be adopted in the same period. The Company is in the process of evaluating the impact that the new standard will have on its consolidated financial statements.
In February 2016, the FASB issued an accounting standards update to increase transparency and comparability among companies by recognizing lease assets and lease liabilities on the balance sheet and disclosing key information about leasing arrangements. Once it becomes effective, the new guidance will replace existing lease accounting guidance in U.S. GAAP. Under the new standard, lessees will recognize in its balance sheets a liability to make lease payments (the lease liability) and a right-of-use asset representing its right to use the underlying asset for the lease term. For leases with a term of 12 months or less, a lessee is permitted to make an accounting policy election by class of underlying asset not to recognize lease assets and lease liabilities. The guidance is effective for the Company's fiscal year beginning January 1, 2019, including interim periods within that fiscal year, with early adoption permitted. Companies are required to apply the guidance in the year of adoption with the cumulative effect recognized at the date of initial application (referred to as the modified retrospective approach). The Company is in the process of evaluating the impact that the new standard will have on its consolidated financial statements.
In April 2015, the FASB issued an accounting standards update relating to the presentation of debt issuance costs. The accounting update requires companies to present debt issuance costs related to a recognized debt liability presented in the balance sheet as a direct deduction from the carrying amount of that debt liability, consistent with debt discounts. In addition, in August 2015, the FASB issued an accounting standards update to incorporate an SEC staff announcement that the SEC staff will not object to an entity presenting debt issuance costs related to line-of-credit arrangements as an asset regardless of whether there are any outstanding borrowings on the line-of-credit arrangement. The guidance is effective for the Company's fiscal year beginning January 1, 2016. The Company adopted the new guidance effective January 1, 2016. As a result, the Company now presents deferred financing costs associated with its senior unsecured notes as a deduction to the debt liability. In addition, as the Company was required to adopt the guidance on a retrospective basis, the Company reclassified amounts in its December 31, 2015 balance sheet to conform to the current period presentation. See Note 9 for further information related to the amounts presented as a deduction to the liability. As it relates to the Company's revolving credit facility, the associated deferred financing costs will continue to be presented within other assets.
In February 2015, the FASB issued an accounting standards update to amend existing guidance relating to the evaluation of certain legal entities for potential consolidation. The amendments modify the evaluation of whether limited partnerships and similar legal entities are VIEs or voting interest entities. In addition, the amendments modify the guidance on evaluating whether a fee paid to a decision maker or a service provider represents a variable interest and whether it should be included in the evaluation of the economics criterion in determining which party is the primary beneficiary of a VIE. In accordance with the accounting standards update, companies are required to reevaluate all legal entities that are considered VIEs to determine whether there is a change in the conclusion as to whether the VIE should be consolidated. The guidance is effective for the Company's fiscal year beginning January 1, 2016, with early adoption permitted. The Company adopted the new guidance effective January 1, 2016. The adoption of this guidance did not change the Company's existing conclusions related to its VIEs and voting interest entities and, as a result, the adoption did not have an impact to the Company's consolidated financial statements.
9
Table of Contents
DREAMWORKS ANIMATION SKG, INC.
NOTES TO UNAUDITED CONSOLIDATED FINANCIAL STATEMENTS—(Continued)
In May 2014, the FASB issued an accounting standards update to provide companies with a single model for use in accounting for revenue from contracts with customers. Once it becomes effective, the new guidance will replace most existing revenue recognition guidance in U.S. GAAP, including industry-specific guidance. The core principle of the model is to recognize revenue when control of goods or services transfers to the customer and in an amount that reflects the consideration that the Company expects to be entitled to in exchange for those goods or services that have transferred. Under current U.S. GAAP, the Company recognizes revenue when the risks and rewards of ownership transfer to the customer. In addition, the new guidance requires improved disclosures to help users of financial statements better understand the nature, amount, timing and uncertainty of revenue that is recognized and the related cash flows. The guidance is effective for the Company's fiscal year beginning January 1, 2018, including interim periods within that fiscal year. Early adoption is permitted but no earlier than the Company's fiscal year beginning January 1, 2017. Companies are permitted to either apply the guidance retrospectively to all prior periods presented or, alternatively, apply the guidance in the year of adoption with the cumulative effect recognized at the date of initial application (referred to as the modified retrospective approach). The Company does not expect that it will early adopt this standard. The Company is in the process of concluding on the method of adoption, as well as evaluating the impact that the new standard will have on its consolidated financial statements. However, the Company currently expects that it will adopt the new guidance under the full retrospective approach.
3. | Financial Instruments |
The fair value of cash and cash equivalents, accounts payable, advances and amounts outstanding under the revolving credit facility approximates carrying value due to the short-term maturity of such instruments and floating interest rates. As of June 30, 2016, the fair value of trade accounts receivable approximated the carrying value due to the similarities in the initial and current discount rates. In addition, as of June 30, 2016, the fair value and the carrying value of the principal amount of the senior unsecured notes was $316.4 million and $300.0 million, respectively. The fair value of trade accounts receivable and the senior unsecured notes was determined (for purposes of these disclosures) using significant unobservable inputs by performing a discounted cash flow analysis and using current discount rates as appropriate for each type of instrument.
The Company has short-term money market investments which are classified as cash and cash equivalents on the consolidated balance sheets. The fair value of these investments at June 30, 2016 and December 31, 2015 was measured based on quoted prices in active markets.
4. | Film and Other Inventory Costs |
Film, television and other inventory costs consist of the following (in thousands):
June 30, 2016 | December 31, 2015 | ||||||
In release, net of amortization: | |||||||
Feature films | $ | 284,368 | $ | 227,372 | |||
Television series and specials | 141,520 | 124,911 | |||||
In production: | |||||||
Feature films | 274,079 | 308,114 | |||||
Television series and specials | 48,974 | 50,810 | |||||
In development: | |||||||
Feature films | 94,986 | 99,541 | |||||
Television series and specials | 1,220 | 846 | |||||
Product inventory and other(1) | 8,177 | 8,860 | |||||
Total film, television and other inventory costs, net | $ | 853,324 | $ | 820,454 | |||
_____________________
(1) | As of June 30, 2016 and December 31, 2015, this category included $5.6 million and $6.7 million, respectively, of physical inventory primarily related to certain titles for distribution in the home entertainment market. |
The Company anticipates that approximately 56% and 89% of the above "in release" film and other inventory costs as of June 30, 2016 will be amortized over the next 12 months and three years, respectively.
10
Table of Contents
DREAMWORKS ANIMATION SKG, INC.
NOTES TO UNAUDITED CONSOLIDATED FINANCIAL STATEMENTS—(Continued)
No impairment charges were recorded on film and other inventory costs during the six months ended June 30, 2016. During the six months ended June 30, 2015, impairment charges recorded on film and other inventory costs were immaterial.
5. | Intangible Assets |
As of June 30, 2016 and December 31, 2015, intangible assets included $69.4 million of indefinite-lived intangible assets comprised of character rights. In addition, intangible assets included definite-lived intangible assets as follows (in thousands, unless otherwise noted):
Weighted Average Estimated Useful Life (in years) | Gross | Accumulated Amortization | Impact of Foreign Currency Translation | Net | |||||||||||||
As of June 30, 2016: | |||||||||||||||||
Character rights | 13.9 | $ | 99,000 | $ | (24,902 | ) | $ | (4,867 | ) | $ | 69,231 | ||||||
Distribution rights | 11.2 | 30,000 | (6,187 | ) | — | 23,813 | |||||||||||
Trademarks and trade names | 10.0 | 1,410 | (426 | ) | — | 984 | |||||||||||
Other intangibles | 4.4 | 2,700 | (1,491 | ) | — | 1,209 | |||||||||||
Total | $ | 133,110 | $ | (33,006 | ) | $ | (4,867 | ) | $ | 95,237 | |||||||
As of December 31, 2015: | |||||||||||||||||
Character rights | 13.9 | $ | 99,000 | $ | (21,150 | ) | $ | (2,734 | ) | $ | 75,116 | ||||||
Distribution rights | 11.2 | 30,000 | (4,671 | ) | — | 25,329 | |||||||||||
Trademarks and trade names | 10.0 | 1,410 | (356 | ) | — | 1,054 | |||||||||||
Other intangibles | 4.4 | 2,700 | (1,271 | ) | — | 1,429 | |||||||||||
Total | $ | 133,110 | $ | (27,448 | ) | $ | (2,734 | ) | $ | 102,928 | |||||||
6. | Investments in Unconsolidated Entities |
The Company has made investments in entities which are accounted for under either the cost or equity method of accounting. These investments are classified as investments in unconsolidated entities in the consolidated balance sheets and consist of the following (in thousands, unless otherwise indicated):
Ownership | |||||||||
Percentage at | June 30, | December 31, | |||||||
June 30, 2016 | 2016 | 2015 | |||||||
Oriental DreamWorks Holding Limited | 45.45% | $ | 22,329 | $ | 16,814 | ||||
Total equity method investments | 22,329 | 16,814 | |||||||
Total cost method investments | 17,500 | 16,000 | |||||||
Total investments in unconsolidated entities | $ | 39,829 | $ | 32,814 | |||||
As of March 31, 2015, the Company determined that one of its equity method investments was impaired and that the carrying value would not be recoverable, primarily due to the Company's concerns related to the investee's financial condition. As a result, the six-month period ended June 30, 2015 includes an impairment charge in the amount of $5.1 million related to such investment, which was classified as other income/expense, net, on the Company's consolidated statement of operations.
Under the equity method of accounting, the carrying value of an investment is adjusted for the Company's proportionate share of the investees' earnings and losses (adjusted for the amortization of any differences in the Company's basis, with respect to the Company's investment in ODW, compared to the Company's share of venture-level equity), as well as contributions to
11
Table of Contents
DREAMWORKS ANIMATION SKG, INC.
NOTES TO UNAUDITED CONSOLIDATED FINANCIAL STATEMENTS—(Continued)
and distributions from the investee. The Company classifies its share of income or loss from investments accounted for under the equity method as income/loss from equity method investees in its consolidated statements of operations.
Loss from equity method investees consist of the following (in thousands):
Three Months Ended | Six Months Ended | ||||||||||||||
June 30, | June 30, | ||||||||||||||
2016 | 2015 | 2016 | 2015 | ||||||||||||
Oriental DreamWorks Holding Limited(1) | $ | (3,572 | ) | $ | (2,775 | ) | $ | (1,030 | ) | $ | (8,173 | ) | |||
All Other | — | — | — | (964 | ) | ||||||||||
Loss from equity method investees | $ | (3,572 | ) | $ | (2,775 | ) | $ | (1,030 | ) | $ | (9,137 | ) | |||
____________________
(1) | The Company currently records its share of ODW results on a one-month lag. Accordingly, the Company's consolidated financial statements include its share of income earned or losses incurred by ODW from the period beginning and ending one month prior to the period shown in the table. |
The following table presents summarized financial information for ODW (in thousands):
June 30, | December 31, | ||||||
2016 | 2015 | ||||||
Current assets | $ | 82,563 | $ | 49,427 | |||
Noncurrent assets | $ | 72,132 | $ | 73,340 | |||
Current liabilities | $ | 54,852 | $ | 28,114 | |||
Noncurrent liabilities | $ | 155 | $ | 233 | |||
Three Months Ended | Six Months Ended | ||||||||||||||
June 30, | June 30, | ||||||||||||||
2016 | 2015 | 2016 | 2015 | ||||||||||||
Revenues | $ | 15,412 | $ | 8,529 | $ | 75,661 | $ | 11,147 | |||||||
Costs of revenues | $ | 12,837 | $ | 7,104 | $ | 63,037 | $ | 9,811 | |||||||
Net loss | $ | 8,291 | $ | 6,749 | $ | 3,191 | $ | 19,325 | |||||||
Oriental DreamWorks Holding Limited
On April 3, 2013 ("ODW Closing Date"), the Company formed a Chinese Joint Venture, ODW (or the "Chinese Joint Venture"), through the execution of a Transaction and Contribution Agreement, as amended, with its Chinese partners, China Media Capital (Shanghai) Center L.P. ("CMC"), Shanghai Media Group ("SMG") and Shanghai Alliance Investment Co., Ltd. ("SAIL", and together with CMC and SMG, the "CPE Holders"). In exchange for 45.45% of the equity of ODW, the Company has committed to making a total cash capital contribution to ODW of $50.0 million (of which $17.0 million had been funded as of June 30, 2016, with the balance to be funded over time) and non-cash contributions valued at approximately $100.0 million (of which approximately $52.7 million had been satisfied as of June 30, 2016). Such non-cash contributions include licenses of technology and certain other intellectual property of the Company, rights in certain trademarks of the Company, two in-development feature film projects developed by the Company and consulting and training services. During the six months ended June 30, 2016, the Company's consolidated statements of operations included $2.5 million of revenues recognized in connection with non-cash contributions made to ODW. In addition, the Company's consolidated statements of operations included other operating income recognized in connection with non-cash contributions made to ODW of $2.5 million and $1.7 million during the three months ended June 30, 2016 and 2015, respectively, and $4.0 million during each of the six-month periods ended June 30, 2016 and 2015.
As of June 30, 2016, the Company's remaining contributions consisted of the following: (i) $33.0 million in cash (which is expected to be funded over the next two years), (ii) two of the Company's in-development film projects, (iii) remaining delivery requirements under the license of technology and (iv) approximately $6.3 million in consulting and training services.
12
Table of Contents
DREAMWORKS ANIMATION SKG, INC.
NOTES TO UNAUDITED CONSOLIDATED FINANCIAL STATEMENTS—(Continued)
Some of these remaining contribution commitments will require future cash outflows for which the Company is not currently able to estimate the timing of contributions as this will depend on, among other things, ODW's operations.
Basis Differences. The Company's investment in ODW does not equal the venture-level equity (the amount recorded on the balance sheet of ODW) due to various basis differences. Basis differences related to definite-lived assets are being amortized based on the useful lives of the related assets. Basis differences related to indefinite-lived assets are not being amortized. The following are the differences between the Company's venture-level equity and the balance of its investment in ODW (in thousands):
June 30, | December 31, | ||||||
2016 | 2015 | ||||||
Company's venture-level equity | $ | 45,309 | $ | 42,914 | |||
Technology and intellectual property licenses(1) | (542 | ) | (6,833 | ) | |||
Other(2) | (22,438 | ) | (19,267 | ) | |||
Total ODW investment recorded | $ | 22,329 | $ | 16,814 | |||
____________________
(1) | Represents differences between the Company's historical cost basis and the equity basis reflected at the venture-level (the amount recorded on the balance sheet of ODW) related to the Company's contributions of technology and intellectual property licenses. These basis differences arise because the contributed assets are recorded at fair value by ODW. |
(2) | Represents the Company's net contribution commitment due to ODW. |
Other Transactions with ODW. The Company has various other transactions with ODW, a related party. The Company has entered into a distribution agreement with ODW for the distribution of the Company's feature films in China. In addition, from time to time, the Company may provide consulting and training services to ODW, the charges of which are based on the Company's actual cost of providing such services. The Company's consolidated statements of operations included revenues earned primarily through ODW's distribution of its feature films of $3.1 million and $24.6 million during the three- and six-month periods ended June 30, 2016, respectively, and $4.4 million and $4.8 million during the three- and six-month periods ended June 30, 2015, respectively. As of June 30, 2016 and December 31, 2015, the Company's consolidated balance sheets included receivables from ODW of $4.1 million and $4.7 million, respectively, which were classified as a component of trade accounts receivable, and $23.4 million and $1.1 million, respectively, which were classified as a component of receivables from distributors.
During the six months ended June 30, 2016, the Company released Kung Fu Panda 3, a feature film that is the subject of a collaborative production and distribution arrangement among the Company, ODW and certain other parties. Under this arrangement, each party is responsible for certain production costs and the Company only records the portion of the production costs that it incurred. The other parties only have rights to exploit the title for its initial theatrical release in China. The Company records revenues earned from the exploitation of the title in China net of permissible marketing and distribution expenses, similar to its other titles that are distributed by ODW.
7. | Accrued Liabilities |
Accrued liabilities consist of the following (in thousands):
June 30, | December 31, | ||||||
2016 | 2015 | ||||||
Employee compensation | $ | 55,451 | $ | 85,616 | |||
Participations and residuals | 43,955 | 46,562 | |||||
Interest payable | 8,037 | 8,069 | |||||
Deferred rent | 10,778 | 10,446 | |||||
Other accrued liabilities | 54,718 | 48,972 | |||||
Total accrued liabilities | $ | 172,939 | $ | 199,665 | |||
As of June 30, 2016, the Company estimates that over the next 12 months it will pay approximately $21.0 million of its
13
Table of Contents
DREAMWORKS ANIMATION SKG, INC.
NOTES TO UNAUDITED CONSOLIDATED FINANCIAL STATEMENTS—(Continued)
accrued participation and residual costs.
8. | Deferred Revenue and Other Advances |
The following is a summary of deferred revenue and other advances included in the consolidated balance sheets as of June 30, 2016 and December 31, 2015 and the related amounts earned and recorded either as revenue in the consolidated statements of operations or recorded as an offset to other costs (as described below) for the three- and six-month periods ended June 30, 2016 and 2015 (in thousands):
Amounts Earned | |||||||||||||||||||||||
Three Months Ended | Six Months Ended | ||||||||||||||||||||||
June 30, | December 31, | June 30, | June 30, | ||||||||||||||||||||
2016 | 2015 | 2016 | 2015 | 2016 | 2015 | ||||||||||||||||||
Deferred Revenue(1) | $ | 5,900 | $ | 25,035 | $ | 14,641 | $ | 3,994 | $ | 27,715 | $ | 4,112 | |||||||||||
Strategic Alliance/Development Advances(2) | 2,103 | 1,826 | 8,485 | 5,793 | 11,099 | 13,477 | |||||||||||||||||
Other(3) | 46,568 | 47,798 | 19,573 | 13,525 | 38,408 | 28,072 | |||||||||||||||||
Total deferred revenue and other advances | $ | 54,571 | $ | 74,659 | |||||||||||||||||||
______________________
(1) | "Deferred revenue" consists of those arrangements related to the licensing of content for distribution in the home entertainment, television and new media markets. |
(2) | Of the total amounts earned against the "Strategic Alliance/Development Advances," for the three months ended June 30, 2016 and 2015, $4.3 million and $1.7 million, respectively, and $4.7 million and $5.7 million for the six months ended June 30, 2016 and 2015, respectively, were capitalized as an offset to property, plant and equipment. Additionally, during the three months ended June 30, 2016 and 2015, of the total amounts earned, $2.8 million and $1.4 million, respectively, and for the six months ended June 30, 2016 and 2015, $2.8 million and $1.9 million, respectively, were recorded as a reduction to other assets. During the six months ended June 30, 2016 and 2015, $0.7 million and $1.5 million, respectively, were recorded as a reduction to prepaid expenses. Lastly, during the three months ended June 30, 2016 and 2015, of the total amounts earned, $0.3 million and $0.5 million, respectively, and for the six months ended June 30, 2016 and 2015, $0.7 million and $1.1 million, respectively, were recorded as a reduction to operating expenses. |
(3) | "Other" consists of all remaining arrangements that result in deferred revenue or other advances and are related to a variety of activities that result in amounts being earned to either revenues or other income. |
9. | Financing Arrangements |
Senior Unsecured Notes. On August 14, 2013, the Company issued $300.0 million in aggregate principal amount of 6.875% Senior Notes due 2020 (the "Notes"). In connection with the issuance of the Notes, the Company entered into an indenture (the "Indenture") with The Bank of New York Mellon Trust Company, N.A., as trustee, specifying the terms of the Notes. The Notes were sold at a price to investors of 100% of their principal amount and were issued in a private placement pursuant to the exemptions under Rule 144A and Regulation S under the Securities Act of 1933, as amended. The net proceeds from the Notes amounted to $294.0 million and a portion was used to repay the outstanding borrowings under the Company's revolving credit facility. The Notes are effectively subordinated to indebtedness under the revolving credit facility. The Company is required to pay interest on the Notes semi-annually in arrears on February 15 and August 15 of each year. The principal amount is due upon maturity. The Notes are guaranteed by all of the Company's domestic subsidiaries that also guarantee its revolving credit facility.
The Indenture contains certain restrictions and covenants that, subject to certain exceptions, limit the Company's ability to incur additional indebtedness, pay dividends or repurchase the Company's common shares, make certain loans or investments, and sell or otherwise dispose of certain assets, among other limitations. The Indenture also contains customary events of default, which, if triggered, may accelerate payment of principal, premium, if any, and accrued but unpaid interest on the Notes. Such events of default include non-payment of principal and interest, non-performance of covenants and obligations, default on other material debt, failure to satisfy material judgments and bankruptcy or insolvency. If a change of control as described in the Indenture occurs, the Company may be required to offer to purchase the Notes from the holders thereof at a repurchase price equal to 101% of their principal amount, plus accrued and unpaid interest, if any, to, but not including, the date of repurchase.
14
Table of Contents
DREAMWORKS ANIMATION SKG, INC.
NOTES TO UNAUDITED CONSOLIDATED FINANCIAL STATEMENTS—(Continued)
At any time prior to August 15, 2016, the Company may redeem all or part of the Notes at a redemption price equal to the sum of (i) 100% of the principal amount thereof, plus (ii) a specified premium as of the date of redemption, plus (iii) accrued and unpaid interest to, but not including, the date of redemption, subject to the rights of holders of Notes on the relevant record date to receive interest due on the relevant interest payment date. On or after August 15, 2016, the Company may redeem all or a part of the Notes, at specified redemption prices plus accrued and unpaid interest thereon, to, but not including, the applicable redemption date, subject to the rights of holders of Notes on the relevant record date to receive interest due on the relevant interest payment date. In addition, at any time prior to August 15, 2016, the Company may redeem up to 35% of the Notes with the net proceeds of certain equity offerings at a redemption price equal to 106.875% of the principal amount thereof, in each case plus accrued and unpaid interest and additional interest, if any, thereon to, but not including, the redemption date.
The Company presents deferred financing costs associated with its senior unsecured notes as a direct deduction from the carrying amount of the liability (refer to Note 2 for further information). Senior unsecured notes, net of deferred financing costs, as presented on the Company's consolidated balance sheets consist of the following (in thousands):
June 30, | December 31, | ||||||
2016 | 2015 | ||||||
Senior unsecured notes, principal balance | $ | 300,000 | $ | 300,000 | |||
Less: unamortized deferred financing costs | (4,335 | ) | (4,866 | ) | |||
Senior unsecured notes, net of deferred financing costs | $ | 295,665 | $ | 295,134 | |||
Revolving Credit Facility. Prior to February 20, 2015, the Company had a revolving credit facility with a number of banks which allowed the Company to borrow up to a maximum of $400.0 million ("Prior Credit Agreement"). On February 20, 2015, the Company and the facility banks amended and restated the Prior Credit Agreement by entering into an Amended and Restated Credit Agreement (the "Restated Credit Agreement"). The Restated Credit Agreement allows the Company to have outstanding borrowings of up to $450.0 million at any one time, on a revolving basis. The Company and one or more of the lenders may from time to time, so long as no default or event of default has occurred under the Restated Credit Agreement, agree to increase the commitments under the Restated Credit Agreement by up to $50.0 million. As of June 30, 2016, the Company had $342.0 million of availability under its revolving credit facility.
Under the Restated Credit Agreement, the Company is required to pay a commitment fee on undrawn amounts at an annual rate of 0.375%. Interest on borrowed amounts (per draw) is determined by reference to either (i) the lending banks' base rate plus 1.50% per annum or (ii) the London Interbank Offered Rate ("LIBOR") plus 2.50% per annum. The Restated Credit Agreement also contains a sublimit for letters of credit. The Company is required to pay to the lenders under the Restated Credit Agreement a letter of credit participation fee equal to the applicable margin for LIBOR-based borrowings on the average daily undrawn amount of outstanding letters of credit and pay to each issuer of letters of credit a letter of credit fronting fee equal to 0.125% per annum on the average daily undrawn amount of outstanding letters of credit issued by such letter of credit issuer. The Restated Credit Agreement requires the Company to maintain a specified ratio of total debt to total capitalization, and limits the outstanding credit exposure under the Restated Credit Agreement to a specified ratio of net remaining ultimates to the outstanding credit exposure under the Restated Credit Agreement, plus an additional amount based on the valuation of the Company's film library. Subject to specified exceptions, the Restated Credit Agreement also restricts the Company and substantially all of its subsidiaries from taking certain actions, such as granting liens, entering into any merger or other significant transactions, making distributions (including dividends), entering into transactions with affiliates, agreeing to negative pledge clauses and restrictions on subsidiary distributions, and modifying organizational documents. The obligations of the Company under the Restated Credit Agreement are guaranteed by substantially all the subsidiaries of the Company organized under the laws of the United States of America, and substantially all the tangible and intangible assets of the Company and such subsidiaries are pledged as collateral against borrowings under the Restated Credit Agreement.
Lease Financing Obligation. On February 23, 2015, the Company, as seller, entered into a purchase agreement (the "Glendale Purchase Agreement") with a third party buyer ("Landlord") involving the Company's headquarters facility located in Glendale, California (the "Property"). In addition, the Company entered into a sharing agreement (the "Sharing Agreement") with the Landlord whereby the Company will either pay or receive 50% of the net appreciation or depreciation in the sale price of the Property if the Landlord sells the property to a third-party prior to February 23, 2016. Concurrently with the sale of the
15
Table of Contents
DREAMWORKS ANIMATION SKG, INC.
NOTES TO UNAUDITED CONSOLIDATED FINANCIAL STATEMENTS—(Continued)
Property, the Company and Landlord entered into a lease agreement (the "Lease"), pursuant to which Landlord leased the Property to the Company commencing immediately following the consummation of the sale.
The Company initially accounted for the sale and lease arrangement (as described above) as a financing transaction as it did not qualify for sale-leaseback accounting treatment because of the Company's continuing involvement through the Sharing Agreement. Under the financing accounting method, the Property assets remain on the Company's consolidated balance sheets and proceeds received by the Company are recorded as a financing liability. Payments under the Lease are applied as payments of deemed principal and imputed interest on the underlying financing obligation.
On July 21, 2015, the Company's Landlord sold the Property to an unaffiliated third party for a total sale price of $215.0 million. Pursuant to the Sharing Agreement, the Company received approximately $14.2 million from the Landlord following such sale and these additional proceeds were recorded as an increase to the lease financing obligation. Upon receipt of these proceeds, the Company concluded that it no longer had continuing involvement beyond a normal leaseback of the Property. As a result, the Company further concluded that the transaction may be accounted for as a sale and operating leaseback on a prospective basis. Accordingly, the Company's lease financing obligation balance was reduced to zero, its property, plant and equipment balance was reduced by $109.4 million, representing the net book value (as of July 21, 2015) of the assets sold, and the Company recorded a deferred gain on the sale-leaseback transaction in the amount of $88.5 million. The deferred gain is being amortized on a straight-line basis over the remaining initial lease term and recorded as a component of other operating income.
Additional Financing Information
Interest Capitalized to Film Costs. Interest on borrowed funds that are invested in major projects with substantial development or construction phases is capitalized as part of the asset cost until the projects are released or construction projects are put into service. Thus, capitalized interest is amortized over future periods on a basis consistent with that of the asset to which it relates. During the three months ended June 30, 2016 and 2015, the Company incurred interest costs totaling $6.9 million and $10.0 million, respectively, of which $1.3 million and $1.4 million, respectively, were capitalized to film costs. During the six months ended June 30, 2016 and 2015, the Company incurred interest costs totaling $13.6 million and $18.5 million, respectively, of which $2.1 million and $2.4 million, respectively, were capitalized to film costs.
As of June 30, 2016, the Company was in compliance with all applicable financial debt covenants.
10. | Income Taxes |
The Company typically determines its interim income tax provision by using the estimated annual effective tax rate and applying that rate to income/loss on a current year-to-date basis, adjusted for the tax effects of items that relate discretely to the interim period, if any. However, if minor changes to forecasted annual pre-tax earnings have a significant effect on the estimated annual effective tax rate, or if a reliable estimate of the annual effective tax rate cannot otherwise be made, the Company may determine that this method would not be appropriate and that a different method should be applied. Furthermore, as a result of a partial increase in the tax basis of the Company's tangible and intangible assets attributable to transactions entered into by affiliates controlled by a former stockholder at the time of the Company's 2004 initial public offering ("Tax Basis Increase"), the Company may pay reduced tax amounts to the extent it generates sufficient taxable income in the future (refer to the Company's 2015 Form 10-K for a more detailed description). The Company is obligated to remit to the affiliate of the former stockholder 85% of any realized cash savings in U.S. Federal income tax, California franchise tax and certain other related tax benefits. Due to the effect of this arrangement on the Company's provision for income taxes, the Company also combines the effect of the increase/decrease in income tax benefit payable to former stockholder (referred to as the combined effective tax rate).
For the three and six months ended June 30, 2016, the Company determined that the annual effective tax rate method would not represent a reliable estimate of the interim income tax provision. As a result, the Company utilized a discrete period method to calculate taxes for the three and six months ended June 30, 2016. Under the discrete period method, the Company determined the income tax provision based upon actual results as if the interim period were an annual period. For the three and six months ended June 30, 2015, the Company utilized the annual effective tax rate method (as described above) to calculate the income tax provision.
16
Table of Contents
DREAMWORKS ANIMATION SKG, INC.
NOTES TO UNAUDITED CONSOLIDATED FINANCIAL STATEMENTS—(Continued)
For the three and six months ended June 30, 2016, the Company recorded a provision for income taxes of $1.3 million and $2.5 million, respectively, or an effective tax rate of 48.6% and 15.4%, respectively. The Company's combined effective tax rate for the three and six months ended June 30, 2016 was also 48.6% and 15.4%, respectively, as the Company did not record an increase nor a decrease to the Payable to Former Stockholder in its statements of operations. For the three and six months ended June 30, 2015, the Company recorded a provision for income taxes of $1.8 million and $4.2 million, respectively, or an effective tax rate of (5.8)% and (5.0)%, respectively. For the three and six months ended June 30, 2015, the Company's combined effective tax rate was (29.3)% and (13.5)%, respectively. The Company's effective tax rate and combined effective tax rate for the three and six months ended June 30, 2015 were negative due to a loss before income taxes. The Company's effective tax rates and combined effective tax rates for the three and six months ended June 30, 2016 and 2015 were primarily attributable to foreign taxes, as well as the effect of a valuation allowance. In addition, as it relates to the three- and six-month periods ended June 30, 2015, the combined effective tax rates were also attributable to an increase in the Company's income tax benefit payable to former stockholder.
The Company's federal income tax returns for the tax years ended December 31, 2007 through 2009 and for the years ended December 31, 2012 through 2013 are currently under examination by the Internal Revenue Service, and tax years subsequent to 2013 remain open to audit. The Company's California state tax returns for all years subsequent to 2010 remain open to audit. The Company's India subsidiary's income tax returns are currently under examination for the tax years ended March 31, 2013 through 2014.
11. | Stockholders' Equity and Non-Controlling Interests |
Class A Common Stock
Stock Repurchase Program. In July 2010, the Company's Board of Directors authorized a stock repurchase program pursuant to which the Company may repurchase up to an aggregate of $150.0 million of its outstanding stock. During the three and six months ended June 30, 2016 and 2015, the Company did not repurchase any shares of its Class A Common Stock. As of June 30, 2016, the Company's remaining authorization under the current stock repurchase program was $100.0 million.
Non-Controlling Interests
The Company's consolidated balance sheets include non-controlling interests, which are presented as a separate component of equity. A non-controlling interest represents the other equity holder's interest in a joint venture that the Company consolidates. The net income or loss attributable to the non-controlling interests is presented in the Company's consolidated statements of operations. There is no other comprehensive income or loss attributable to the non-controlling interests.
Additional Equity Information
The following table presents the changes in equity for the six-month periods ended June 30, 2016 and 2015 (in thousands):
DreamWorks Animation SKG, Inc. Stockholders' Equity | Non-Controlling Interests | Total Equity | |||||||||
Balance as of December 31, 2015 | $ | 1,143,517 | $ | 55,323 | $ | 1,198,840 | |||||
Stock-based compensation | 17,103 | — | 17,103 | ||||||||
Purchase of treasury shares(1) | (4,761 | ) | — | (4,761 | ) | ||||||
Foreign currency translation adjustments | (3,794 | ) | — | (3,794 | ) | ||||||
Distributions to non-controlling interest holder | — | (225 | ) | (225 | ) | ||||||
Net income (loss) | 16,170 | (2,629 | ) | 13,541 | |||||||
Balance as of June 30, 2016 | $ | 1,168,235 | $ | 52,469 | $ | 1,220,704 | |||||
Balance as of December 31, 2014 | $ | 1,156,357 | $ | 38,041 | $ | 1,194,398 | |||||
Stock-based compensation | 15,729 | — | 15,729 | ||||||||
Purchase of treasury shares(1) | (3,066 | ) | — | (3,066 | ) | ||||||
17
Table of Contents
DREAMWORKS ANIMATION SKG, INC.
NOTES TO UNAUDITED CONSOLIDATED FINANCIAL STATEMENTS—(Continued)
DreamWorks Animation SKG, Inc. Stockholders' Equity | Non-Controlling Interests | Total Equity | |||||||||
Foreign currency translation adjustments | 42 | — | 42 | ||||||||
Capital contribution from non-controlling interest holder | — | 15,000 | 15,000 | ||||||||
Distributions to non-controlling interest holder | — | (813 | ) | (813 | ) | ||||||
Net loss | (93,360 | ) | (1,569 | ) | (94,929 | ) | |||||
Balance as of June 30, 2015 | $ | 1,075,702 | $ | 50,659 | $ | 1,126,361 | |||||
____________________
(1) | Represents repurchases in order to satisfy tax obligations resulting from the vesting of restricted stock awards. |
12. | Stock-Based Compensation |
The Company recognizes compensation costs for equity awards granted to its employees based on each award's grant-date fair value. Most of the Company's equity awards contain vesting conditions dependent upon the completion of specified service periods or achievement of established sets of performance criteria. Compensation cost for service-based equity awards is recognized ratably over the requisite service period. Compensation cost for certain performance-based awards is recognized using a graded expense-attribution method and is adjusted to reflect the estimated probability of vesting. The Company has granted performance-based awards where the value of the award upon vesting will vary depending on the level of performance ultimately achieved. The Company recognizes compensation cost for these awards based on the level of performance expected to be achieved. The Company will recognize the impact of any change in estimate in the period of the change.
Generally, equity awards are forfeited by employees who terminate prior to vesting. However, employment contracts for certain executive officers and other employees provide for the acceleration of vesting in the event of a change in control or specified termination events. The Company currently satisfies exercises of stock options and stock appreciation rights, the vesting of restricted stock and the delivery of shares upon the vesting of restricted stock units with the issuance of new shares.
The impact of stock-based compensation awards on net income (excluding amounts capitalized) for the three- and six-month periods ended June 30, 2016 and 2015 were as follows (in thousands):
Three Months Ended | Six Months Ended | ||||||||||||||
June 30, | June 30, | ||||||||||||||
2016 | 2015 | 2016 | 2015 | ||||||||||||
Total stock-based compensation | $ | 7,236 | $ | 6,328 | $ | 12,097 | $ | 10,727 | |||||||
Tax impact(1) | (3,517 | ) | 1,854 | (1,863 | ) | 1,448 | |||||||||
Reduction in net income, net of tax | $ | 3,719 | $ | 8,182 | $ | 10,234 | $ | 12,175 | |||||||
____________________
(1) | Tax impact is determined at the Company's combined effective tax rate, which includes the statements of operations line item "Increase in income tax benefit payable to former stockholder" (see Note 10). |
Stock-based compensation cost capitalized as a part of film costs was $2.4 million and $2.5 million for the three-month periods ended June 30, 2016 and 2015, respectively, and $4.8 million and $4.8 million for the six-month periods ended June 30, 2016 and 2015, respectively.
18
Table of Contents
DREAMWORKS ANIMATION SKG, INC.
NOTES TO UNAUDITED CONSOLIDATED FINANCIAL STATEMENTS—(Continued)
The following table sets forth the number and weighted average grant-date fair value of equity awards granted during the three- and six-month periods ended June 30, 2016 and 2015:
Three Months Ended | Six Months Ended | ||||||||||||
June 30, | June 30, | ||||||||||||
Number Granted | Weighted Average Grant-Date Fair Value | Number Granted | Weighted Average Grant-Date Fair Value | ||||||||||
(in thousands) | (in thousands) | ||||||||||||
2016 | |||||||||||||
Restricted stock units | 183 | $ | 40.07 | 488 | $ | 30.60 | |||||||
2015 | |||||||||||||
Restricted stock units | 132 | $ | 25.76 | 909 | $ | 22.04 | |||||||
As of June 30, 2016, the total compensation cost related to unvested equity awards granted to employees (excluding equity awards with performance objectives not probable of achievement) but not yet recognized was approximately $60.8 million and will be amortized on a straight-line basis, or using a graded-attribution method for certain performance-based awards, over a weighted average period of 1.7 years. As previously described in Note 1, there is a pending acquisition of the Company by Comcast. The Company expects that, upon closing of the Merger, any unamortized stock-based compensation expense (including the expense for equity awards with performance objectives that are outstanding at the time of the closing) will be accelerated and recorded as a general and administrative expense at that time.
13. | Reportable Segments |
The Company's current reportable segments are the following: Feature Films, Television Series and Specials, Consumer Products and New Media. Feature Films consists of the development, production and exploitation of feature films in the theatrical, television, home entertainment and digital markets. Television Series and Specials consists of the development, production and exploitation of television, direct-to-video and other non-theatrical content in the television, home entertainment and digital markets. Consumer Products consists of the Company's merchandising and licensing activities related to the exploitation of its intellectual property rights. New Media consists of the Company's ATV and related businesses. This segment primarily generates revenues from the production and distribution of content across a variety of channels, including theatrical, home entertainment, television and online video-on-demand, and sponsorship arrangements. Operating segments that are not separately reportable are categorized in "All Other."
Segment performance is evaluated based on revenues and segment gross profit. The Company does not allocate assets to each of its operating segments, nor do the Company's chief operating decision makers evaluate operating segments using discrete asset information.
The Company's Ultimate Revenues for each film or television series/specials title include revenues attributable to the consumer products market. Prior to January 1, 2016, the Company allocated a portion of the amortization of capitalized film and television series/specials cost to the Consumer Products segment based on the proportion of revenues generated in the consumer products market in relation to total revenues for that title for any given period. Beginning January 1, 2016, the Company changed the method in which intellectual property costs are charged to the Consumer Products segment. As a result, effective January 1, 2016, amortization of capitalized production costs are no longer shared and allocated with the Consumer Products segment from the originating segment (Feature Films or Television Series and Specials). Instead, the Consumer Products segment is charged a royalty fee for use of intellectual property developed by other segments. The royalty fee is based on an established percentage applied against consumer products revenues earned by a particular property and is reflected as intersegment revenues in each of the impacted segments. Ultimate Revenues and the amortization of capitalized production costs remain unchanged as this change only relates to the method by which costs are allocated to the Consumer Products segment.
19
Table of Contents
DREAMWORKS ANIMATION SKG, INC.
NOTES TO UNAUDITED CONSOLIDATED FINANCIAL STATEMENTS—(Continued)
Information on the reportable segments and a reconciliation of total segment revenues and segment gross profit to consolidated financial statements are presented below (in thousands):
Three Months Ended | Six Months Ended | |||||||||||||||
June 30, | June 30, | |||||||||||||||
2016 | 2015 (1) | 2016 | 2015 (1) | |||||||||||||
Revenues | ||||||||||||||||
Feature Films | ||||||||||||||||
Third parties | $ | 96,637 | $ | 87,810 | $ | 190,695 | $ | 215,830 | ||||||||
Intersegment | 1,160 | 447 | 1,415 | 1,116 | ||||||||||||
Total Feature Films segment revenues | 97,797 | 88,257 | 192,110 | 216,946 | ||||||||||||
Television Series and Specials | ||||||||||||||||
Third parties | 70,896 | 54,529 | 127,776 | 72,542 | ||||||||||||
Intersegment | 888 | 236 | 998 | 346 | ||||||||||||
Total Television Series and Specials segment revenues | 71,784 | 54,765 | 128,774 | 72,888 | ||||||||||||
Consumer Products | ||||||||||||||||
Third parties | 25,464 | 12,670 | 47,207 | 27,786 | ||||||||||||
Intersegment | (2,048 | ) | (683 | ) | (2,413 | ) | (1,462 | ) | ||||||||
Total Consumer Products segment revenues | 23,416 | 11,987 | 44,794 | 26,324 | ||||||||||||
New Media | 27,578 | 14,550 | 42,806 | 19,133 | ||||||||||||
All Other | 351 | 1,223 | 2,884 | 2,021 | ||||||||||||
Total consolidated revenues | $ | 220,926 | $ | 170,782 | $ | 411,368 | $ | 337,312 | ||||||||
Segment gross profit(2) | ||||||||||||||||
Feature Films | $ | 40,108 | $ | 29,298 | $ | 66,220 | $ | 67,390 | ||||||||
Television Series and Specials | 22,056 | 19,195 | 43,122 | 22,656 | ||||||||||||
Consumer Products | 13,216 | 4,212 | 28,208 | 13,625 | ||||||||||||
New Media | 17,560 | 7,472 | 24,073 | 9,587 | ||||||||||||
All Other | (141 | ) | 416 | 1,344 | 911 | |||||||||||
Total segment gross profit | $ | 92,799 | $ | 60,593 | $ | 162,967 | $ | 114,169 | ||||||||
Reconciliation to consolidated income (loss) before income taxes: | ||||||||||||||||
Selling and marketing expenses(3) | 1,252 | 1,827 | 1,742 | 3,513 | ||||||||||||
General and administrative expenses | 87,612 | 80,736 | 147,862 | 169,878 | ||||||||||||
Product development expenses | 595 | 1,592 | 1,140 | 1,924 | ||||||||||||
Other operating income | (6,077 | ) | (1,719 | ) | (11,018 | ) | (4,000 | ) | ||||||||
Non-operating expenses, net | 3,118 | 12,659 | 6,213 | 24,484 | ||||||||||||
Loss from equity method investees | 3,572 | 2,775 | 1,030 | 9,137 | ||||||||||||
Total consolidated income (loss) before income taxes | $ | 2,727 | $ | (37,277 | ) | $ | 15,998 | $ | (90,767 | ) | ||||||
____________________
(1) | Reflects reclassifications between segments to conform to the current period methodology in allocating costs to the Consumer Products segment as previously discussed. |
20
Table of Contents
DREAMWORKS ANIMATION SKG, INC.
NOTES TO UNAUDITED CONSOLIDATED FINANCIAL STATEMENTS—(Continued)
(2) | The Company defines segment gross profit as segment revenues less segment costs of revenues (which is comprised of costs of revenues and certain costs classified as a component of "selling and marketing" in its statements of operations). |
(3) | Represents certain selling and marketing expenses that are not included as a component of segment gross profit due to the general nature of such expenses. |
14. | Related Party Transactions |
Transactions with ODW. During the three and six months ended June 30, 2016 and 2015, the Company had various transactions with a related party, ODW. See Note 6 for further discussion related to these transactions.
Transactions with Universal Music Group. One of the Company's directors, Lucian Grainge, is the chief executive officer of Universal Music Group ("UMG"). From time to time, the Company and UMG (including its subsidiaries) make payments to each other in connection with the licensing of music that is owned by the other company. In addition, UMG serves as the Company's music publisher. Finally, UMG and ATV have formed joint ventures related to the music business. For the three and six months ended June 30, 2016, revenues from UMG were $0.4 million and $2.0 million, respectively, and expenses incurred were not material. As it relates to these arrangements, for the three and six months ended June 30, 2015, revenues recognized and expenses incurred were not material. As of June 30, 2016 and December 31, 2015, the Company's deferred revenue and other advances (see Note 8) included the balance of a cash advance received in the amount of $3.3 million and $4.3 million, respectively, related to music licensing revenues.
Transactions with Vessel. One of the Company's directors, Jason Kilar, is the chief executive officer and a significant stockholder in Vessel, a start-up subscription Internet video service company. Vessel has entered into (and is expected to continue to enter into) content and referral agreements with clients of ATV. The agreements in effect provide for certain minimum payments to ATV clients, with additional payments depending on applicable advertising and subscription revenues. Although ATV is not a party to these agreements, it will receive a percentage of the amounts paid to its clients under the terms of its arrangements with its individual clients. During the three and six months ended June 30, 2016 and 2015, amounts received under these arrangements were immaterial.
15. | Concentrations of Credit Risk |
A substantial portion of the Company's revenue is derived directly from the Company's primary third-party distributors, Fox and Paramount. Fox represented approximately 23% and 41% of total revenues for the three-month periods ended June 30, 2016 and 2015, respectively, and 23% and 34% for the six-month periods ended June 30, 2016 and 2015, respectively. As it relates to the three- and six-month periods ended June 30, 2016, Paramount represented approximately 17% and 14%, respectively, of total revenues. In addition, revenues earned through license arrangements with Netflix, Inc. ("Netflix") represented approximately 30% of total revenues for each of the three-month periods ended June 30, 2016 and 2015, and 28% and 37% during the six-month periods ended June 30, 2016 and 2015, respectively.
As of each of June 30, 2016 and December 31, 2015, approximately 66% of the Company's trade accounts receivable balance consisted of long-term receivables related to licensing arrangements with Netflix.
16. | Commitments and Contingencies |
Legal Proceedings
Shareholder Class Action Lawsuit. In August 2014, two putative shareholder class action lawsuits alleging violations of federal securities laws were filed against the Company and several of its officers and directors in the U.S. District Court for the Central District of California. These lawsuits have been consolidated and generally assert that, between October 29, 2013 and July 29, 2014, the Company and certain of its officers and directors made alleged material misstatements and omissions regarding the financial performance of Turbo. The consolidated lawsuit seeks to recover damages on behalf of shareholders as well as other equitable and unspecified monetary relief. On April 1, 2015, the court granted the Company's motion to dismiss the consolidated securities class action lawsuit and the case was dismissed with prejudice on May 19, 2015. The plaintiffs filed a notice of appeal on June 18, 2015, and the matter currently is pending before the United States Court of Appeals for the Ninth Circuit. The Company intends to vigorously defend against this consolidated lawsuit. At this time the Company is unable to reasonably predict the ultimate outcome of this consolidated lawsuit, nor can it reasonably estimate a range of possible loss.
21
Table of Contents
DREAMWORKS ANIMATION SKG, INC.
NOTES TO UNAUDITED CONSOLIDATED FINANCIAL STATEMENTS—(Continued)
Antitrust Class Action. In September and October 2014, three putative class action lawsuits alleging violations of federal and state antitrust laws were filed against the Company and various other companies in the U.S. District Court for the Northern District of California. These lawsuits have been consolidated and generally assert that the defendants agreed to restrict competition through non-solicitation agreements and agreements to fix wage and salary ranges. The lawsuits seek to recover damages on behalf of all animation and visual effect workers employed by the defendants during various periods between 2004 and 2010. On May 25, 2016, the Court granted-in-part plaintiffs' motion for class certification. The Company intends to vigorously defend against these lawsuits. At this time the Company is unable to reasonably predict the ultimate outcome of these lawsuits, nor can it reasonably estimate a range of possible loss.
Merger-Related Litigation. On June 27, 2016, Ann Arbor City Employees Retirement System, a purported stockholder of the Company ("AACERS"), filed a putative class action complaint against Jeffrey Katzenberg, the Company's Chief Executive Officer and controlling stockholder and a director in the Court of Chancery of the State of Delaware. The complaint alleges that (1) Mr. Katzenberg, as the Company's controlling stockholder, breached his fiduciary duties to the Company's other stockholders by, among other things, entering into a consulting agreement with Comcast pursuant to which he will receive certain profits interests in two of the Company's majority-owned subsidiaries, (2) Mr. Katzenberg violated the Company's Restated Certificate of Incorporation and thus breached a contract with the Company and the Company's other stockholders by entering into the consulting agreement, and (3) Mr. Katzenberg violated an implied covenant of good faith and fair dealing by entering into the consulting agreement. AACERS has asked the Court to, among other things, (i) order Mr. Katzenberg to share the profit interests resulting from the consulting agreement, pro rata, with the Company's other stockholders, and (ii) award AACERS's attorney's fees and other costs associated with the action.
On July 29, 2016, Kenneth Bumba, a purported stockholder of the Company, filed a putative class action complaint against the Company, Mr. Katzenberg, each of the Company's other directors and Comcast in the Court of Chancery of the State of Delaware. The complaint alleges that (1) Mr. Katzenberg breached his fiduciary duty to the Company's stockholders by, among other things, entering into the consulting agreement with Comcast pursuant to which he will receive the profits interests and that the other directors violated their fiduciary duties to the Company's stockholders by, among other things, allowing Mr. Katzenberg to enter into that agreement, (2) the directors violated the Company's Restated Certificate of Incorporation and thus breached a contract with the Company and the Company's stockholders by allowing Mr. Katzenberg to enter into the consulting agreement, and (3) the directors violated an implied covenant of good faith and fair dealing by allowing Mr. Katzenberg to enter into the consulting agreement. The complaint also alleges that the information statement distributed to stockholders was materially deficient, that the Company violated its obligation under Delaware law to provide prompt written notice to other stockholders regarding the transaction and that Comcast aided and abetted the breaches of fiduciary duty by the directors. The plaintiff in the action has asked for relief similar to that requested in the AACERS lawsuit.
Because the complaints have only recently been filed, the Company is unable to reasonably predict the ultimate outcome of these lawsuits, nor can it reasonably estimate a range of possible loss, at this time. Pursuant to Mr. Katzenberg's employment agreement, the Company has agreed to indemnify him to the fullest extent permitted by law against any claims or losses arising in connection with his service to the Company or any affiliate.
Other Legal Matters. From time to time, the Company is involved in legal proceedings arising in the ordinary course of its business, typically intellectual property litigation and infringement claims related to the Company's feature films and other commercial activities, which could cause the Company to incur significant expenses or prevent the Company from releasing a film or other properties. The Company also has been the subject of patent and copyright claims relating to technology and ideas that it may use or feature in connection with the production, marketing or exploitation of the Company's feature films and other properties, which may affect the Company's ability to continue to do so. Furthermore, from time to time the Company may introduce new products or services, including in areas where it currently does not operate, which could increase its exposure to litigation and claims by competitors, consumers or other intellectual property owners. Defending intellectual property litigation is costly and can impose a significant burden on management and employees, and there can be no assurances that favorable final outcomes will be obtained in all cases. While the resolution of these matters cannot be predicted with certainty, the Company does not believe, based on current knowledge, that any existing legal proceedings or claims (other than those previously described) are likely to have a material effect on its financial position, results of operations or cash flows.
Other Commitments and Contingencies
Contributions to ODW. The Company has committed to making certain contributions in connection with the formation of ODW. Refer to Note 6 for further discussion related to these commitments.
22
Table of Contents
DREAMWORKS ANIMATION SKG, INC.
NOTES TO UNAUDITED CONSOLIDATED FINANCIAL STATEMENTS—(Continued)
Merger-Related. In connection with the pending acquisition of the Company by Comcast (see Note 1 for further detail), the Company implemented a retention bonus plan to retain employees during the pendancy of the transaction and a post-closing transitional period. As a result, the Company has committed to bonus payouts in the aggregate of approximately $17.3 million, of which $1.2 million was recorded as an expense during the three months ended June 30, 2016. The Company expects that approximately half of the aggregate commitment will be paid upon closing of the merger and the remainder will be paid no later than six months thereafter. However, in the event that there is a termination of the merger, only half of the aggregate commitment will be paid.
Purchase Obligations. During the year ended December 31, 2015, the Company entered into an agreement with one of its suppliers which committed the Company to minimum purchase obligations of certain capital assets intended to be resold in connection with one of the Company's Consumer Products segment activities. As of June 30, 2016, remaining minimum purchase obligations totaled $11.7 million and are contractually due in 2016. Prior to resale, in the Company's consolidated balance sheets, these assets are included in prepaid expenses to the extent that advance deposits have been made for such assets (as of June 30, 2016, this amount was $6.3 million), or in other assets to the extent that the Company has received the asset from its supplier (as of June 30, 2016, this amount was $12.0 million). Thus far, the Company's sales with respect to these assets have been less than the Company's initial projections. Similar to other asset balances, the Company evaluates these assets for impairment on an annual basis, or sooner, if indicators of impairment exist. In the event that the Company determines that the assets' fair value is less than the carrying value, the Company would be required to record an impairment charge with respect to some or all of the amounts currently included in its balance sheet for these assets.
17. | Earnings Per Share Data |
The following table sets forth the computation of basic and diluted net income (loss) per share (in thousands, except per share amounts):
Three Months Ended | Six Months Ended | ||||||||||||||
June 30, | June 30, | ||||||||||||||
2016 | 2015 | 2016 | 2015 | ||||||||||||
Numerator: | |||||||||||||||
Net income (loss) attributable to DreamWorks Animation SKG, Inc. | $ | 2,334 | $ | (38,583 | ) | $ | 16,170 | $ | (93,360 | ) | |||||
Denominator: | |||||||||||||||
Weighted average common shares and denominator for basic calculation: | |||||||||||||||
Weighted average common shares outstanding | 86,627 | 85,777 | 86,513 | 85,793 | |||||||||||
Less: Unvested restricted stock | — | (45 | ) | — | (119 | ) | |||||||||
Denominator for basic calculation | 86,627 | 85,732 | 86,513 | 85,674 | |||||||||||
Weighted average effects of dilutive stock-based compensation awards: | |||||||||||||||
Restricted stock awards | 2,818 | — | 2,390 | — | |||||||||||
Denominator for diluted calculation | 89,445 | 85,732 | 88,903 | 85,674 | |||||||||||
Net income (loss) per share—basic | $ | 0.03 | $ | (0.45 | ) | $ | 0.19 | $ | (1.09 | ) | |||||
Net income (loss) per share—diluted | $ | 0.03 | $ | (0.45 | ) | $ | 0.18 | $ | (1.09 | ) | |||||
The following table sets forth (in thousands) the weighted average number of options to purchase shares of common stock, stock appreciation rights, restricted stock awards and equity awards subject to performance conditions which were not included in the calculation of diluted per share amounts because the effects would be anti-dilutive:
Three Months Ended | Six Months Ended | ||||||||||
June 30, | June 30, | ||||||||||
2016 | 2015(1) | 2016 | 2015(1) | ||||||||
Restricted stock awards | 64 | 393 | 59 | 555 | |||||||
23
Table of Contents
DREAMWORKS ANIMATION SKG, INC.
NOTES TO UNAUDITED CONSOLIDATED FINANCIAL STATEMENTS—(Continued)
____________________
(1) | Due to the Company's loss for the three- and six-month periods ended June 30, 2015, all potential common stock equivalents are anti-dilutive. |
The following table sets forth (in thousands) the number of equity awards that are contingently issuable (assuming the required performance conditions had been satisfied as of the dates shown in the table) and that could potentially dilute earnings per share in future periods provided that the Company has net income:
Three Months Ended | Six Months Ended | ||||||||||
June 30, | June 30, | ||||||||||
2016 | 2015 | 2016 | 2015 | ||||||||
Restricted stock awards | 686 | 1,372 | 686 | 1,372 | |||||||
18. | Restructuring and Related Charges |
2015 Restructuring Plan
On January 22, 2015, the Company announced its restructuring initiatives (the "2015 Restructuring Plan") that are intended to refocus the Company's core feature animation business. In connection with the 2015 Restructuring Plan, the Company made changes in its senior leadership team and also made changes based on its reevaluation of the Company's feature film slate. The 2015 Restructuring Plan activities resulted, or will result, in charges related to employee-related costs resulting from headcount reductions, lease obligations and other costs associated with the closure of one of the Company's facilities, accelerated depreciation and amortization charges, write-offs related to the recoverability of capitalized costs for certain unreleased productions and other contractual obligations. Certain of these costs were incurred during the three months ended December 31, 2014 and the remainder of the costs were primarily incurred during the year ended December 31, 2015. As of June 30, 2016, the Company expected that it would incur aggregate costs of $241.3 million in connection with the 2015 Restructuring Plan (excluding additional labor and other excess costs), of which $240.3 million had been incurred through June 30, 2016. The actions associated with the restructuring plan primarily impacted the Feature Films segment and were substantially completed during 2015.
Impact to Financial Results
For the three and six months ended June 30, 2016 and 2015, the Company incurred charges for the Company's 2015 Restructuring Plan as follows (in thousands):
Three Months Ended | Six Months Ended | |||||||||||||||
June 30, | June 30, | |||||||||||||||
2016 | 2015 | 2016 | 2015 | |||||||||||||
Employee termination costs | $ | 26 | $ | 560 | $ | (644 | ) | $ | 5,147 | |||||||
Relocation and other employee-related costs | 283 | 1,885 | 539 | 3,381 | ||||||||||||
Accelerated depreciation and amortization charges | — | 10,853 | — | 20,132 | ||||||||||||
Total restructuring charges | $ | 309 | $ | 13,298 | $ | (105 | ) | $ | 28,660 | |||||||
Employee termination costs consist of severance and benefits (including stock-based compensation) which are accounted for based on the type of employment arrangement between the Company and the employee. Certain of these arrangements include obligations that are accounted for as non-retirement postemployment benefits. The Company also employs individuals under employment contracts. Charges related to non-retirement postemployment benefits and amounts due under employment contracts for employees who will no longer provide services are accrued when probable and estimable. Severance and benefit costs related to all other employees are accounted for in accordance with accounting guidance on costs associated with exit or disposal activities. Such costs were recorded during the year ended December 31, 2015 as this was the period in which the terms of the restructuring plan had been established, management with the appropriate authority committed to the plan and communication to employees had occurred. Such costs are classified in general and administrative expenses in the Company's consolidated statements of operations. Cumulative employee termination costs related to the 2015 Restructuring Plan were attributable to approximately 500 employees.
24
Table of Contents
DREAMWORKS ANIMATION SKG, INC.
NOTES TO UNAUDITED CONSOLIDATED FINANCIAL STATEMENTS—(Continued)
Relocation and other employee-related costs primarily consist of costs to relocate employees from the Company's Northern California facility to its Southern California facility. Such costs are expensed as incurred and are classified within general and administrative expenses.
Accelerated depreciation and amortization charges for the 2015 Restructuring Plan were determined in accordance with FASB guidance on accounting for the impairment or disposal of long-lived assets. The estimated useful lives of certain property, plant and equipment changed as a result of the Company's decision to exit its Northern California facility. Such costs are classified within general and administrative expenses.
Liability Rollforward
The following table represents a rollforward of the liability incurred for employee termination benefits (excluding stock-based compensation) in connection with the 2015 Restructuring Plan for the six-month periods ended June 30, 2016 and 2015 (in thousands):
Balance at Beginning of Year | Costs Incurred | Changes in Estimate(1) | Payments and Other | Balance at June 30 | |||||||||||||||
2016 | $ | 11,969 | $ | — | $ | (644 | ) | $ | (6,222 | ) | $ | 5,103 | |||||||
2015 | $ | 36,808 | $ | 10,286 | $ | (4,378 | ) | $ | (16,386 | ) | $ | 26,330 | |||||||
____________________
(1) | During the six months ended June 30, 2016, changes in estimate were primarily a result of the Company's ability to reduce severance payments to former employees who obtain subsequent employment during their respective severance periods. During the six months ended June 30, 2015, changes in estimate were primarily a result of a higher number of employees accepting relocation offers than the Company initially estimated. |
19. | Subsequent Events |
The Company entered into a Unit Purchase Agreement (the "Purchase Agreement") with ATV, Hearst and Verizon, pursuant to which, on July 13, 2016 (the "Closing"), Verizon acquired from the Company and ATV a 24.5% equity interest in ATV for a purchase price of $159.0 million, and Hearst acquired from ATV additional equity interests in ATV to maintain a 24.5% equity interest. As a result, the Company's equity interest in ATV was reduced to 51.0% upon the Closing of the transaction. The Company continues to consolidate the results of ATV as it continues to retain control over the operations of ATV. Upon the Closing of the transaction, the Company received $168.0 million of aggregate gross proceeds from Verizon and Hearst, which has not been reduced for direct transaction costs.
ITEM 2. | MANAGEMENT'S DISCUSSION AND ANALYSIS OF FINANCIAL CONDITION AND RESULTS OF OPERATIONS |
This section and other parts of this Quarterly Report on Form 10-Q (the "Quarterly Report") contain forward-looking statements that involve risks and uncertainties. Our actual results may differ significantly from the results discussed in the forward-looking statements. You should read the following discussion and analysis in conjunction with our unaudited consolidated financial statements and the related notes thereto contained elsewhere in this Quarterly Report, and our audited consolidated financial statements and related notes thereto, "Management's Discussion and Analysis of Financial Condition and Results of Operations" and the "Risk Factors" section included in our Annual Report on Form 10-K for the year ended December 31, 2015 (the "2015 Form 10-K"). We urge you to carefully review and consider the various disclosures made by us in this Quarterly Report and in our other reports filed with the Securities and Exchange Commission (the "SEC"), including our 2015 Form 10-K and Current Reports on Form 8-K, before deciding to purchase, hold or sell our common stock.
Management Overview
The following is a summary of the significant items that affected our financial results for the three and six months ended June 30, 2016:
• | During the three and six months ended June 30, 2016, we earned net income (excluding net loss attributable to non-controlling interests) of $2.3 million, or $0.03 per diluted share, and earned net income of $16.2 million, or $0.18 per |
25
diluted share, respectively. A detailed discussion of our financial results is provided in the section entitled "—Overview of Financial Results."
• | During the six months ended June 30, 2016, we released our feature film Kung Fu Panda 3 (January 2016 release), which contributed revenues to the Feature Films and Consumer Products segments during the three- and six-month periods ended June 30, 2016 totaling $31.5 million and $64.6 million, respectively. A discussion of the revenues generated from this film is provided in the section entitled "—Overview of Financial Results—Revenues and Segment Costs of Revenues—Feature Films Segment—Current year theatrical releases." |
• | During the three and six months ended June 30, 2016, our Television Series and Specials Segment contributed revenues totaling $71.8 million and $128.8 million, respectively. A discussion of the revenues generated from this segment is provided in the section entitled "—Overview of Financial Results—Revenues and Segment Costs of Revenues—Television Series and Specials Segment—Segment Revenues." |
• | On April 28, 2016, we entered into an Agreement and Plan of Merger (the "Merger Agreement") with Comcast Corporation pursuant to which DreamWorks Animation will become a wholly-owned subsidiary of Comcast (the "Merger"). For further details on this transaction, see Note 1 of the unaudited consolidated financial statements contained elsewhere in this Form 10-Q. |
2015 Restructuring Plan
On January 22, 2015, we announced our restructuring initiatives (the "2015 Restructuring Plan") that were intended to refocus the Company's core feature animation business. In connection with the 2015 Restructuring Plan, we made changes in our senior leadership team and also made changes based on our reevaluation of our feature film slate. Our 2015 Restructuring Plan activities resulted in charges related to employee-related costs resulting from headcount reductions of approximately 500 employees, lease obligations and other costs associated with the closure of our Northern California facility, accelerated depreciation and amortization charges, write-offs related to the recoverability of capitalized costs for certain unreleased productions and other contractual obligations. Certain of these costs were incurred during the three months ended December 31, 2014 with the remaining costs being primarily incurred during the year ended December 31, 2015. In aggregate, we expect to make cash payments totaling approximately $97.7 million related to our 2015 Restructuring Plan, comprised primarily of (i) severance, benefits, lease obligations and contractual obligations and (ii) excess labor costs. We expect to make cash payments of approximately $70.2 million, related to severance, benefits, lease obligations and contractual obligations, of which $57.8 million had been paid as of June 30, 2016. We expect that the majority of the remaining payments will be paid prior to December 31, 2016. We also expect to make aggregate cash payments of $27.5 million associated with excess labor costs (further described below), of which $23.8 million had been paid as of June 30, 2016. We expect to pay an additional $3.7 million related to excess labor, which will be paid prior to December 31, 2016. The actions associated with the 2015 Restructuring Plan were substantially completed during the year ended December 31, 2015.
The following table summarizes the costs that we incurred during the six months ended June 30, 2016, the costs incurred through December 31, 2015, as well as the remaining costs we expect to incur in order to execute upon our 2015 Restructuring Plan (in millions):
Six Months Ended | Incurred through | Future | |||||||||||||
June 30, 2016 | December 31, 2015 | Periods | Total | ||||||||||||
Employee termination costs | $ | (0.6 | ) | $ | 45.8 | $ | — | $ | 45.2 | ||||||
Relocation and other employee-related costs | 0.5 | 6.5 | 1.0 | 8.0 | |||||||||||
Lease obligations and related charges | — | 1.3 | — | 1.3 | |||||||||||
Accelerated depreciation and amortization charges | — | 20.1 | — | 20.1 | |||||||||||
Film and other inventory write-offs | — | 155.5 | — | 155.5 | |||||||||||
Other contractual obligations | — | 11.2 | — | 11.2 | |||||||||||
Additional labor and other excess costs | 1.1 | 32.1 | 3.7 | 36.9 | |||||||||||
Total restructuring and related charges | $ | 1.0 | $ | 272.5 | $ | 4.7 | $ | 278.2 | |||||||
Employee Termination Costs. Employee termination costs consist of severance and benefits (including stock-based compensation) which are accounted for based on the type of employment arrangement between the Company and the
26
employee. Certain of these arrangements include obligations that are accounted for as non-retirement postemployment benefits. We also employ individuals under employment contracts. Charges related to non-retirement postemployment benefits and amounts due under employment contracts for employees who will no longer provide services are accrued when probable and estimable. Severance and benefit costs related to all other employees are accounted for in accordance with accounting guidance on costs associated with exit or disposal activities. Such costs were recorded during the year ended December 31, 2015, which is the period in which the terms of the restructuring plan had been established, management with the appropriate authority committed to the plan and communication to employees had occurred. Such costs are classified within general and administrative expenses.
Relocation and Other Employee-Related Costs. Relocation and other employee-related costs primarily consist of costs to relocate employees from our Northern California facility to our Southern California facility. Such costs are expensed as incurred and are classified within general and administrative expenses.
Lease Obligations and Related Charges. Lease obligations and related charges largely consist of remaining rent expense that we continue to incur prior to the commencement of the subleases of our Northern California facility. These charges were primarily incurred during the year ended December 31, 2015 and are classified within general and administrative expenses. We expect that sublease income will be sufficient to recover the remaining lease obligations. Sublease income is classified as other operating income/expense. We began recognizing income from subleases during the three months ended December 31, 2015.
Accelerated Depreciation and Amortization Charges. Accelerated depreciation and amortization charges consist of the incremental charges we incurred as a result of shortened estimated useful lives of certain property, plant and equipment as a result of the decision to exit our Northern California facility. Such costs are classified within general and administrative expenses.
Film and Other Inventory Write-Offs. Film and other inventory write-offs (as presented in the table above) consist of capitalized production costs for unreleased titles that were written-off due to our decision to change our future film slate, change our creative leadership, abandon certain projects and change creative direction on certain titles. Such costs are classified within costs of revenues.
Other Contractual Obligations. Other contractual obligations consist of amounts due to third parties as a result of the changes made to the Company's film slate. Such costs are classified within selling and marketing or general and administrative expenses.
Additional Labor and Other Excess Costs. We have incurred, and we anticipate that we will continue to incur, additional costs primarily related to excess staffing in order to execute the restructuring plans specifically related to changes in the feature film slate. These additional labor costs are incremental to our normal operating charges and are expensed as incurred. In addition, we have incurred, and we anticipate that we will continue to incur excess costs due to the closure of our Northern California facility which primarily relate to those that we incurred to continue to operate the facility until we began earning amounts under sublease arrangements. These costs have historically been included in capitalized overhead but are now expensed as incurred. We expect that remaining additional labor and other excess costs will be incurred prior to December 31, 2016. Such costs are classified within general and administrative expenses.
Our Business
Our business is primarily devoted to the development, production and exploitation of animated feature films (and other audiovisual programs) and their associated characters in the worldwide theatrical, home entertainment, digital, television, merchandising, licensing and other markets. We continue to expand our library and increase the value of our intellectual property assets by developing and producing new episodic series and other non-theatrical content based on characters from our feature films. In addition, we have an extensive library of other intellectual property rights, which can be exploited in various markets. Our activities also include those related to ATV, as well as, technology initiatives as we explore opportunities to exploit our internally developed software.
For further information on our business, refer to Note 1 of our unaudited consolidated financial statements in "Part I—Item 1." For further details of our primary distribution and servicing arrangements, see "Part I—Item 1—Business—Distribution and Servicing Arrangements" of our 2015 Form 10-K.
27
Our Revenues and Costs
Our Revenues
Feature Films
Our feature films are currently the source of a significant portion of our revenues. We derive revenue from our distributors' worldwide exploitation of our feature films in theaters and in post-theatrical markets such as home entertainment, digital, pay and free broadcast television, as well as other ancillary markets. Pursuant to the distribution arrangements with each of our theatrical distributors, prior to reporting any revenue for one of our feature films to us, each of our distributors is entitled to (i) retain a distribution fee, which is based on a percentage of gross revenues (without deduction for distribution and marketing costs and third-party distribution fees and sales agent fees) and (ii) recoup all of its permissible distribution and marketing costs with respect to the exploitation of our films on a film-by-film basis.
As such, under the various distributor agreements, each film's total exploitation expenses and distribution fees are offset against that film's revenues on a worldwide basis across all markets, and our distributors report no revenue to the Company until the first period in which an individual film's cumulative worldwide gross revenues exceed its cumulative worldwide gross distribution fee and exploitation costs, which may be several quarters after a film's initial theatrical release. Additionally, as the cumulative revenues and cumulative costs for each individual film are commingled among all markets and geographical territories and our distributors only report additional revenue to us for a film in those reporting periods in which that film's cumulative worldwide gross revenues continue to exceed its cumulative worldwide gross costs, our reported revenues in any period are often a result of gross revenues with respect to an individual film generated in one or several territories being offset by the gross costs of both related and unrelated territories, as well as markets, for such film.
Our films are distributed in foreign countries and, in recent years, we have derived on average 70% of our worldwide box office receipts and 60% of our feature film revenue from foreign countries. A significant amount of our transactions in foreign countries is conducted in the local currencies and, as a result, fluctuations in foreign currency exchange rates can affect our business, results of operations and cash flow. For a detailed discussion of our foreign currency risk, see "Part II—Item 7A—Quantitative and Qualitative Disclosures About Market Risk—Market and Exchange Rate Risk—Foreign Currency Risk" of our 2015 Form 10-K.
Television Series and Specials
Our business activities also include the development, production and exploitation of episodic series, direct-to-video and other non-theatrical content. We have certain rights in our distribution and servicing arrangements (as described above) to engage our distributors to distribute non-feature film product for us. However, our revenue and cost activities related to our television series/specials and direct-to-video product are generally not subject to our distribution agreements and, accordingly, we receive payment and record revenues directly from third parties. We have entered into long-term agreements with Netflix, the German television network Super RTL and southern European media company Planeta Junior regarding the production and distribution of existing and future episodic series. Each agreement provides for us to deliver a specified number of episodes of newly created series based on our properties, including characters from the Classic Media library. Under each of these agreements, we will receive a per-episode license fee. We will also be entitled to retain all revenues from the exploitation of the series in other countries and derived from all media not expressly licensed to these parties. Additionally, we have entered into agreements for the distribution of our episodic series content with media companies in countries not covered by the Netflix, Super RTL and Planeta Junior arrangements.
As a result of our agreements with various companies, we are currently developing and producing original episodic content in order to fulfill our obligations under the agreements. In cases where a series is based on characters from one of our feature films, a portion of the third-party revenues generated by the new series is allocated to the feature film title from which the series originated. This revenue allocation represents a license fee charged to the series for use of intellectual property derived from the related feature film.
Direct-to-video sales are conducted through distribution agreements with various third parties. Revenues from direct-to-video sales are primarily generated in the U.S. and Canada. Although the majority of direct-to-video sales are conducted through third parties, we bear the inventory risk and cash collection risk, have discretion in supplier selection and are significantly involved in the marketing of the products. Consequently, we are considered the principal in the transactions and recognize direct-to-video revenue and the related distribution, marketing and placement fees on a gross basis. Direct-to-video revenue is recognized when risk of inventory loss has transferred. Direct-to-video revenue is recorded net of estimated returns and rebates.
28
Consumer Products
Our Consumer Products segment includes all merchandising and licensing activities related to our intellectual properties. We earn flat fees or royalty-based revenues from the licensing of our characters, film elements and other intellectual property rights to consumer product companies, retailers, live entertainment companies, music publishers, theme parks, cruise ships and hotels worldwide.
Due to the significant expansion of our merchandising and licensing activities, we have made a strategic shift in our business such that some of our consumer product programs are becoming perennial rather than focused on specific events, such as film or DVD releases. Consumer product revenues derived from our franchise properties (e.g., Shrek and Madagascar) are allocated to individual titles based on the time period surrounding a title's initial release. Consumer product revenues earned in periods significantly after initial release are attributed to the franchise's brand and not an individual title.
Please see Note 16 of the unaudited consolidated financial statements contained elsewhere in this Form 10-Q for discussion of our purchase obligations with respect to one of our Consumer Products segment activities.
New Media
Our New Media segment consists of our AwesomenessTV ("ATV") and related businesses. We acquired ATV in May 2013. ATV generates revenues primarily from the production and distribution of content across a variety of channels, including theatrical, home entertainment, television and online video-on-demand, and sponsorship arrangements.
In December 2014, we entered into an agreement with an affiliate of the Hearst Corporation ("Hearst"), whereby Hearst acquired a 25% equity interest in a newly formed joint venture ("ATV Joint Venture") conducting the ATV business. We consolidate the results of the ATV Joint Venture as we are the controlling party. On July 13, 2016, additional interests in the ATV Joint Venture were sold to an additional third party investor, which reduced the Company's ownership percentage in ATV as of that date. For further details on this transaction, see Note 19 of the unaudited consolidated financial statements contained elsewhere in this Form 10-Q.
All Other
Revenue streams generated by all other segments are related to our live performances, technology initiatives and other ancillary revenues. Subsequent to the final performances of our live shows during their initial engagement, we generally continue to earn revenues through license arrangements of these productions that we enter into directly with third parties.
Our Costs
Costs of Revenues
Our costs of revenues primarily include the amortization of capitalized costs related to feature films and television series/specials (which consist of production, overhead and interest costs), participation and residual costs for our feature films and television series/specials and write-offs of amounts previously capitalized for titles not expected to be released or released titles not expected to recoup their capitalized costs. Below is a description of our costs of revenues by segment.
Feature Films. Costs of revenues related to our Feature Films segment primarily include the amortization of capitalized costs, participation and residual costs and write-offs of amounts previously capitalized for titles not expected to be released or released titles not expected to recoup their capitalized costs. The amortization of capitalized costs is based on the amount of revenues earned from all markets (including consumer products revenue). Prior to January 1, 2016, the amount of amortization reflected in the Feature Films segment was only that attributable to revenues reported in this segment. Beginning January 1, 2016, we no longer attribute a portion of the amortization of capitalized costs to the Consumer Products segment. See "—Additional Information on Segment Revenues and Costs of Revenues" for further details on this change.
Television Series and Specials. Similar to our Feature Films segment, costs of revenues related to our Television Series and Specials segment primarily include the amortization of capitalized costs (see "—Additional Information on Segment Revenues and Costs of Revenues" for further details on the change described above under "—Feature Films"), participation and residual costs and write-offs of amounts previously capitalized. In addition, costs of revenues include amortization of intangible assets (which consists of certain character rights). We also use a third-party to distribute certain home entertainment product in
29
the U.S. and Canada, and as a result of our arrangement with the third-party, costs of revenues also include costs related to physical inventory sales.
Consumer Products. Costs of revenues associated with our Consumer Products segment are primarily related to the amortization of certain intangible and other assets associated with consumer product and licensing revenues. Costs of revenues also include participation costs. In addition, prior to January 1, 2016, costs of revenues associated with our Consumer Products segment included a portion of the amortization of capitalized costs of our film and television series/specials. Beginning January 1, 2016, we no longer attribute a portion of the amortization of capitalized costs related to our feature films and television series/specials to the Consumer Products segment. See "—Additional Information on Segment Revenues and Costs of Revenues" for further details on this change.
New Media. Costs of revenues associated with our New Media segment are those attributable to ATV and related businesses. Such costs are primarily related to the amortization of content production costs.
All Other. All Other costs of revenues include those attributable to our live performance business (excluding consumer product revenues which are included in the Consumer Products segment), technology initiatives and costs related to ancillary revenue streams.
Segment Costs of Revenues
Costs of revenues (as previously described) and selling, marketing and other distribution expenses directly attributable to our segments are the components that comprise our "segment costs of revenues" to arrive at segment profitability ("segment gross profit"). See Note 13 of our unaudited consolidated financial statements contained elsewhere in this Quarterly Report for a reconciliation of segment gross profit to consolidated income/loss before income taxes.
Additional Information on Segment Revenues and Costs of Revenues
The Company's Ultimate Revenues for each film or television series/specials title include revenues attributable to the consumer products market. Prior to January 1, 2016, the Company allocated a portion of the amortization of capitalized film and television series/specials cost to the Consumer Products segment based on the proportion of revenues generated in the consumer products market in relation to total revenues for that title for any given period. Beginning January 1, 2016, we changed the method in which intellectual property costs are charged to the Consumer Products segment to provide better comparability to our peers, to be similar to the method used in our Television Series and Specials segment for non-consumer products royalty charges, to increase segment management control and to minimize the volatility in the Consumer Products segment as we believe that the volatility associated with our releases should be borne by the originating business segment. As a result, effective January 1, 2016, amortization of capitalized production costs are no longer shared and allocated with the Consumer Products segment from the originating segment (Feature Films or Television Series and Specials). Instead, the Consumer Products segment is charged a royalty fee for use of intellectual property developed by other segments. The royalty fee is based on an established percentage applied against consumer products revenues earned by a particular property and is reflected as intersegment revenues in each of the impacted segments. Ultimate Revenues and the amortization of our capitalized production costs remain unchanged as this change only relates to the method by which costs are allocated to the Consumer Products segment.
In order to understand the impact that the change would have had on segment revenues, costs of revenues and gross profit for each of the impacted segments had we applied the same methodology in each of the fiscal quarters for the year ended December 31, 2015, refer to our Quarterly Report on Form 10-Q for the period ended March 31, 2016 filed on May 6, 2016 (see "Part I—Item 2—Management's Discussion and Analysis of Financial Condition and Results of Operations—Additional Information on Segment Revenues and Costs of Revenues" of such Quarterly Report). As it relates to amounts for the three and six months ended June 30, 2015 presented in this Quarterly Report, we have conformed the amounts to present the segment disclosures using the methodology currently being applied.
Capitalized Production Costs
Capitalized production costs represent the costs incurred to develop and produce our animated films, television series/specials and other content, which primarily consist of compensation (including salaries, bonuses, stock-based compensation and fringe benefits) for animators, creative talent and voice talent (which, in the case of sequels, can be significant), equipment and other direct operating costs relating to the production (including production overhead, which includes an allocation of depreciation and amortization expense). In addition, capitalized production costs may include interest expense to the extent that amounts were qualified to be capitalized. As a result, amortization and write-off of film and other inventory costs in any period
30
includes depreciation and amortization, interest expense and stock-based compensation expense that were capitalized as part of film and other inventory costs in the period that those charges were incurred. The total amount of such expenses reflected as a component of amortization and write-off of film and other inventory costs were $17.5 million and $9.7 million during the three months ended June 30, 2016 and 2015, respectively, and $26.5 million and $22.1 million during the six months ended June 30, 2016 and 2015, respectively.
Capitalized production costs are amortized and included in costs of revenues in the proportion that the revenue for each film or television series/special ("Current Revenue") during the period bears to its respective estimated remaining total revenue to be received from all sources ("Ultimate Revenue"). The amount of capitalized production costs that are amortized each period will therefore depend on the ratio of Current Revenue to Ultimate Revenue for each film or television series/special for such period. Because the profitability for each title varies depending upon its individual projection of Ultimate Revenues and its amount of capitalized costs incurred, total amortization may vary from period to period due to several factors, including: (i) changes in the mix of titles earning revenue, (ii) changes in any title's Ultimate Revenue and capitalized costs and (iii) write-downs of capitalized production costs due to changes in the estimated fair value of unamortized capitalized production costs.
Unamortized capitalized production costs are evaluated for impairment each reporting period on a title-by-title basis. If estimated remaining revenue is not sufficient to recover the unamortized capitalized production costs for that title, the unamortized capitalized production costs will be written down to fair value determined using a net present value calculation. For our feature films (which comprise the largest part of our business), the degree of uncertainty around the estimates of net cash flows is substantially reduced after a film's initial theatrical release, and thus, to the extent that we record a material impairment charge, it generally occurs in the quarter of a film's initial theatrical release. For example, in the quarter ended March 31, 2014, we recorded an impairment charge of $57.1 million with respect to our film Mr. Peabody and Sherman, which was released in March 2014. Additional impairments may be subsequently recorded on titles that have been impaired if the uncertain components of our future revenues associated with those titles (e.g., those related to home entertainment sales) do not materialize as currently expected. For example, in October 2014, we released Mr. Peabody and Sherman into the domestic home entertainment market and, as a result of the sales performance, we recorded an additional impairment charge in the amount of $9.4 million during the quarter ended December 31, 2014. We may also from time to time observe indicators of impairment subsequent to a film's initial worldwide theatrical release, such as lower-than-expected performance in home entertainment and other post-theatrical markets, which result in a reduction in our estimate of a film's Ultimate Revenues and may result in an impairment of the film in periods following its initial theatrical release. For example, Turbo was initially released in July 2013 in the domestic theatrical market and we recorded an impairment charge on the film during the quarter ended December 31, 2013.
With regard to our recent release Kung Fu Panda 3 (released into the theatrical market during January 2016), although there were no indicators of impairment at June 30, 2016, there was a minimal margin between the film's estimated remaining Ultimate Revenues and the remaining unamortized production costs (which were approximately $112.6 million as of June 30, 2016). Although we concluded that a write-down was not required at that time, there can be no assurances that a future write-down will not occur. While there are certain future revenue sources that are essentially known to us (e.g., our domestic pay television revenues are typically based on pre-determined rate schedules where the fee we earn is determined based on the level of box office performance achieved), even though they have not been recognized in our financial results as of June 30, 2016, the film's profitability will depend significantly on future revenue sources that are variable (e.g., home entertainment sales). As of the date of this filing, taking into account the various sources of future revenues, a reduction of 20% in our estimates of future variable revenues attributable to Kung Fu Panda 3 would result in an impairment charge of approximately $5.0 million to $10.0 million.
Selling and Marketing Expenses
Selling and marketing expenses primarily consist of advertising and marketing costs, promotion costs, distribution fees and sales commissions to outside third parties. Generally, given the structure of our feature film distribution arrangements, we do not incur distribution and marketing costs or third-party distribution and fulfillment service fees associated with our feature films. Distribution and marketing costs associated with the exploitation of our feature films would be included in selling and marketing expenses to the extent that we caused our distributors to make additional expenditures in excess of mutually agreed amounts. Our television series and specials are typically not subject to the same distribution agreements as our feature films, and accordingly, selling and marketing expenses include distribution and marketing costs directly incurred by us.
General and Administrative Expenses
Our general and administrative expenses consist primarily of employee compensation (including salaries, bonuses, stock-based compensation and employee benefits), rent, insurance and fees for professional services. In addition, as a result of
31
our 2015 Restructuring Plan (as described in "—Management Overview—2015 Restructuring Plan"), our general and administrative expenses also include restructuring and restructuring-related charges.
Product Development Expenses
Product development expenses primarily consist of research and development costs related to our technology initiatives.
Other Operating Income
Operating-related income or gains that are not considered revenues are classified as other operating income in our consolidated statements of operations. Other operating income largely consists of income recognized in connection with our contributions to ODW in the form of consulting and training services and the license of technology. Other operating income also consists of amounts earned under sublease arrangements and amortization of the deferred gain on our sales leaseback transaction.
For a detailed description of our revenues and operating expenses, please see "Management's Discussion and Analysis of Financial Condition and Results of Operations—Our Revenues and Costs" of our 2015 Form 10-K.
Seasonality
The timing of revenue reporting and receipt of cash remittances from our theatrical distributors fluctuates based upon the timing of our films' theatrical and home entertainment releases and, with respect to certain of our distributors, the recoupment position of our distributors on a film-by-film basis, which varies depending upon a film's overall performance. From time-to-time, we may enter into license arrangements directly with third-parties to distribute our titles through digital media formats. The timing of revenues earned under these license arrangements fluctuates depending on when each title is made available. We have also entered into output arrangements related to our episodic content. The timing of revenues earned under these license arrangements fluctuates depending on when episodes are delivered to licensees. The licensing of our character and film elements are influenced by seasonal consumer purchasing behavior and the timing of our animated feature film theatrical releases and television series broadcasts. We expect that revenues generated from our holiday-themed properties will tend to be higher during the fourth quarter of each calendar year due to the content offered through television distribution rights as well as home entertainment products geared towards the holiday season. As a result, our annual or quarterly operating results, as well as our cash on hand, for any period are not necessarily indicative of results to be expected for future periods.
32
Results of Operations
Overview of Financial Results
The following table sets forth, for the periods presented, certain data from our unaudited consolidated statements of operations. This information should be read in conjunction with our unaudited consolidated financial statements and the notes thereto included elsewhere in this Quarterly Report.
Three Months Ended June 30, | Six Months Ended June 30, | ||||||||||||||||||||||||||||
2016 | 2015(1) | $ Change | % Change | 2016 | 2015(1) | $ Change | % Change | ||||||||||||||||||||||
(in millions, except percentages and per share data) | |||||||||||||||||||||||||||||
Revenues | $ | 220.9 | $ | 170.8 | $ | 50.1 | 29.3 | % | $ | 411.4 | $ | 337.3 | $ | 74.1 | 22.0 | % | |||||||||||||
Operating expenses (income): | |||||||||||||||||||||||||||||
Costs of revenues | 121.9 | 99.9 | 22.0 | 22.0 | % | 236.5 | 206.1 | 30.4 | 14.8 | % | |||||||||||||||||||
Selling and marketing | 7.5 | 12.1 | (4.6 | ) | (38.0 | )% | 13.6 | 20.5 | (6.9 | ) | (33.7 | )% | |||||||||||||||||
General and administrative | 87.6 | 80.7 | 6.9 | 8.6 | % | 147.9 | 169.9 | (22.0 | ) | (12.9 | )% | ||||||||||||||||||
Product development | 0.6 | 1.6 | (1.0 | ) | (62.5 | )% | 1.1 | 1.9 | (0.8 | ) | (42.1 | )% | |||||||||||||||||
Other operating income | (6.1 | ) | (1.7 | ) | (4.4 | ) | (258.8 | )% | (11.0 | ) | (4.0 | ) | (7.0 | ) | (175.0 | )% | |||||||||||||
Operating income (loss) | 9.4 | (21.8 | ) | 31.2 | 143.1 | % | 23.2 | (57.1 | ) | 80.3 | 140.6 | % | |||||||||||||||||
Non-operating income (expense): | |||||||||||||||||||||||||||||
Interest expense, net | (3.6 | ) | (7.6 | ) | 4.0 | 52.6 | % | (8.6 | ) | (13.9 | ) | 5.3 | 38.1 | % | |||||||||||||||
Other income (expense), net | 0.5 | 2.0 | (1.5 | ) | (75.0 | )% | 2.4 | (3.5 | ) | 5.9 | 168.6 | % | |||||||||||||||||
Increase in income tax benefit payable to former stockholder | — | (7.1 | ) | 7.1 | 100.0 | % | — | (7.1 | ) | 7.1 | 100.0 | % | |||||||||||||||||
Income (loss) before loss from equity method investees and income taxes | 6.3 | (34.5 | ) | 40.8 | 118.3 | % | 17.0 | (81.6 | ) | 98.6 | 120.8 | % | |||||||||||||||||
Loss from equity method investees | (3.6 | ) | (2.7 | ) | (0.9 | ) | (33.3 | )% | (1.0 | ) | (9.1 | ) | 8.1 | 89.0 | % | ||||||||||||||
Income (loss) before income taxes | 2.7 | (37.2 | ) | 39.9 | 107.3 | % | 16.0 | (90.7 | ) | 106.7 | 117.6 | % | |||||||||||||||||
Provision for income taxes | 1.3 | 1.8 | (0.5 | ) | (27.8 | )% | 2.5 | 4.2 | (1.7 | ) | (40.5 | )% | |||||||||||||||||
Net income (loss) | 1.4 | (39.0 | ) | 40.4 | 103.6 | % | 13.5 | (94.9 | ) | 108.4 | 114.2 | % | |||||||||||||||||
Less: Net loss attributable to non-controlling interests | (0.9 | ) | (0.4 | ) | (0.5 | ) | (125.0 | )% | (2.6 | ) | (1.5 | ) | (1.1 | ) | (73.3 | )% | |||||||||||||
Net income (loss) attributable to DreamWorks Animation SKG, Inc. | $ | 2.3 | $ | (38.6 | ) | $ | 40.9 | 106.0 | % | $ | 16.2 | $ | (93.4 | ) | $ | 109.6 | 117.3 | % | |||||||||||
Diluted net income (loss) per share attributable to DreamWorks Animation SKG, Inc. | $ | 0.03 | $ | (0.45 | ) | $ | 0.48 | 106.7 | % | $ | 0.18 | $ | (1.09 | ) | $ | 1.27 | 116.5 | % | |||||||||||
Shares used in computing diluted net income (loss) per share | 89.4 | 85.7 | 4.3 | % | 88.9 | 85.7 | 3.7 | % | |||||||||||||||||||||
____________________
Note: Amounts may not foot due to rounding.
(1) | Includes restructuring and restructuring-related charges related to our 2015 Restructuring Plan. See "—Management Overview—2015 Restructuring Plan" for further details. |
33
Three Months Ended June 30, 2016 Compared to Three Months Ended June 30, 2015
The following chart sets forth (in millions, except percentages), for the periods presented, our revenues by segment. This information should be read in conjunction with our unaudited consolidated financial statements and the notes thereto included elsewhere in this Quarterly Report.
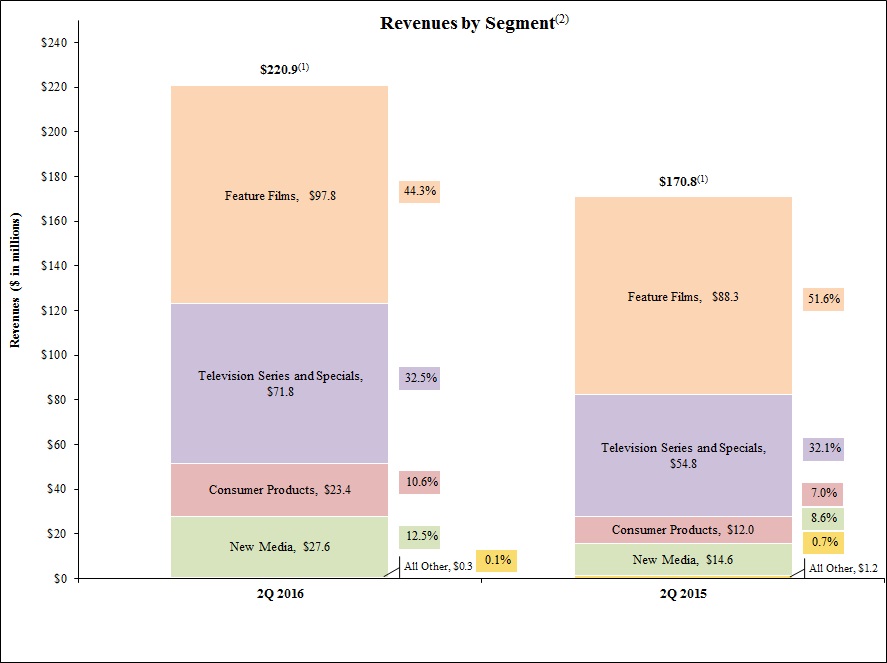
________________
(1) | For each period shown, "Feature Films" consists of revenues attributable to the exploitation of feature films in the theatrical, television, home entertainment and digital markets. "Television Series and Specials" consists of revenues attributable to the exploitation of television, direct-to-video and other non-theatrical content. "Consumer Products" consists of revenues attributable to our merchandising and licensing activities related to the exploitation of our intellectual property rights. "New Media" consists of revenues attributable to ATV and related businesses. "All Other" consists of revenues not attributable to the reportable segments. |
(2) | Amounts may not foot due to rounding. |
Revenues and Segment Costs of Revenues
Feature Films Segment
Operating results for the Feature Films segment were as follows (in millions, except percentages):
Three Months Ended June 30, | Increase (Decrease) | |||||||||||||
2016 | 2015(1) | $ | % | |||||||||||
Segment revenues | ||||||||||||||
Third parties | $ | 96.6 | $ | 87.8 | $ | 8.8 | 10.0 | % | ||||||
Intersegment | 1.2 | 0.4 | 0.8 | 200.0 | % | |||||||||
34
Three Months Ended June 30, | Increase (Decrease) | |||||||||||||
2016 | 2015(1) | $ | % | |||||||||||
Total segment revenues | 97.8 | 88.3 | 9.5 | 10.8 | % | |||||||||
Segment costs of revenues | 57.7 | 59.0 | (1.3 | ) | (2.2 | )% | ||||||||
Segment gross profit | $ | 40.1 | $ | 29.3 | $ | 10.8 | 36.9 | % | ||||||
____________________
Note: Amounts may not foot due to rounding.
(1) | Reflects reclassifications between segments to conform to the current period methodology in allocating costs to the Consumer Products segment as previously discussed in "—Business Overview—Additional Information on Segment Revenues and Costs of Revenues." |
Segment Revenues
The following chart sets forth the revenues generated by our Feature Films segment, by category, for the three months ended June 30, 2016 as compared to the three months ended June 30, 2015 (in millions):
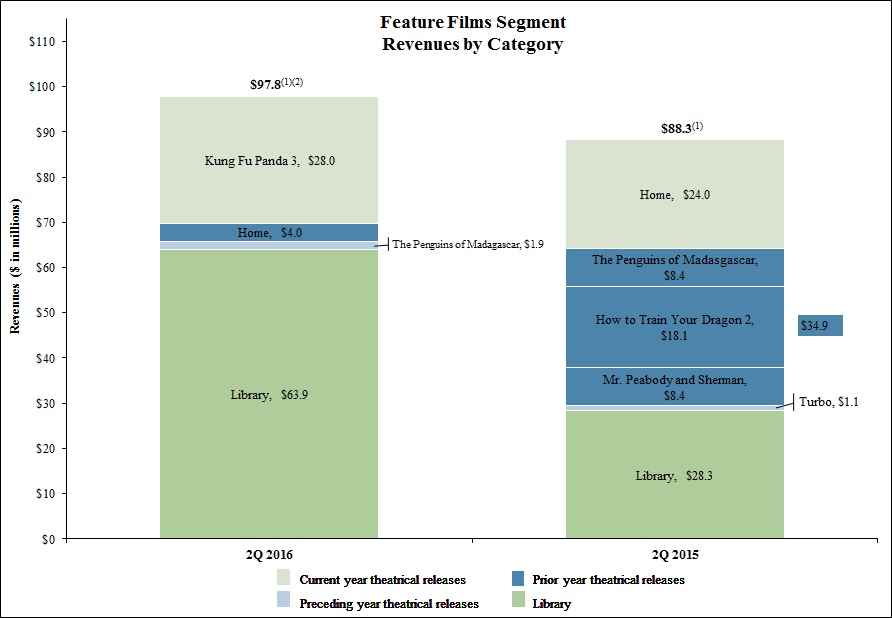
____________________
(1) | For each period shown, "Current year theatrical releases" consists of revenues attributable to films released during the current year, "Prior year theatrical releases" consists of revenues attributable to films released during the immediately prior year, and "Preceding year theatrical releases" consists of revenues attributable to films released during all previous periods that are not yet part of our library. Titles are added to the "Library" category starting with the quarter of a title's second anniversary of the initial domestic theatrical release. |
(2) | Through June 30, 2016, Kung Fu Panda 3, Home and The Penguins of Madagascar (our titles that have not yet entered the library category) reached an estimated 1.6 million, 7.1 million and 4.7 million, respectively, home entertainment units sold worldwide, net of actual and estimated future returns. |
35
Current year theatrical releases. Revenues generated by our "Current year theatrical releases" category increased to $28.0 million during the three months ended June 30, 2016 compared to $24.0 million during the three months ended June 30, 2015, primarily due to the timing of the release of our feature films. Our feature film Kung Fu Panda 3 was released in January 2016 and during the three months ended June 30, 2016, contributed $28.0 million, or 12.7%, of consolidated revenues, primarily earned in the worldwide theatrical and home entertainment markets. During the prior year, our feature film Home was released in March 2015 and during the three months ended June 30, 2015, contributed $24.0 million, or 14.1%, of consolidated revenues primarily earned in the worldwide theatrical markets. Because Kung Fu Panda 3 was initially released theatrically in January 2016, its home entertainment release occurred during the quarter ended June 30, 2016 and contributed to revenues for such quarter. In the prior year, Home was initially released theatrically in March 2015 and its primary home entertainment release did not occur until the quarter ended September 30, 2015.
Prior year theatrical releases. Revenues generated by our "Prior year theatrical releases" category decreased $30.9 million, or 88.5%, to $4.0 million during the three months ended June 30, 2016 when compared to $34.9 million of revenues earned during the three months ended June 30, 2015. The decrease in revenues was primarily due to a decrease in the number of films that comprised this category during the three months ended June 30, 2016 when compared to the same period of the prior year.
For the three months ended June 30, 2016, "Prior year theatrical release" revenues consisted of those generated by Home (March 2015 release) which contributed $4.0 million, or 1.8%, of consolidated revenues primarily earned in the international television and worldwide home entertainment markets.
For the three months ended June 30, 2015, "Prior year theatrical release" revenues consisted of those generated by The Penguins of Madagascar (November 2014 release), How to Train Your Dragon 2 (June 2014 release) and Mr. Peabody and Sherman (March 2014 release). The Penguins of Madagascar contributed $8.4 million, or 4.9% of consolidated revenues, primarily earned in the worldwide home entertainment market. How to Train Your Dragon 2 and Mr. Peabody and Sherman contributed $18.1 million (or 10.6%) and $8.4 million (or 4.9%) of revenues, respectively, primarily earned in the international television market.
Preceding year theatrical releases. Revenues generated by our "Preceding year theatrical releases" category consist of revenues attributable to films released during all previous periods that are not yet part of our library. Revenues generated by our "Preceding year theatrical releases" category remained relatively consistent during the three months ended June 30, 2016 when compared to the three months ended June 30, 2015.
For the three months ended June 30, 2016, "Preceding year theatrical releases" revenues consisted of those related to The Penguins of Madagascar (November 2014 release), which contributed $1.9 million, or 0.9%, of consolidated revenues, primarily earned in the worldwide home entertainment markets. Preceding year theatrical releases revenues during the three months ended June 30, 2015 consisted of those related to Turbo (July 2013 release), which contributed $1.1 million, or 0.6%, of consolidated revenues, primarily earned in the worldwide television markets.
Library. Titles are added to the "Library" category starting with the quarter of a title's second anniversary of the initial domestic theatrical release. Revenues from our "Library" category increased by $35.6 million, or 125.8%, to $63.9 million during the three months ended June 30, 2016 when compared to $28.3 million during the three months ended June 30, 2015. The increase in revenues was attributable to the addition of How to Train Your Dragon 2 (June 2014 release) and Mr. Peabody and Sherman (March 2014 release) to our "Library" category, as well as license revenues earned related to the SVOD distribution of our library titles in international territories.
Segment Costs of Revenues
The primary component of segment costs of revenues for our Feature Films segment is film amortization costs. Segment costs of revenues as a percentage of revenues for our Feature Films segment was 59.0% during the three months ended June 30, 2016 compared to 66.8% for the three months ended June 30, 2015. The decrease in segment costs of revenues as a percentage of revenues was due to recoveries of amounts totaling $3.2 million related to exploitation costs handled by one of our primary theatrical distributors, as well as recoveries totaling $4.9 million related to amounts owed for participations and residuals, which were recorded during the three-month period ended June 30, 2016.
36
Television Series and Specials Segment
Operating results for the Television Series and Specials segment were as follows (in millions, except percentages):
Three Months Ended June 30, | Increase (Decrease) | |||||||||||||
2016 | 2015(1) | $ | % | |||||||||||
Segment revenues | ||||||||||||||
Third parties | $ | 70.9 | $ | 54.5 | $ | 16.4 | 30.1 | % | ||||||
Intersegment | 0.9 | 0.2 | 0.7 | 350.0 | % | |||||||||
Total segment revenues | 71.8 | 54.8 | 17.0 | 31.0 | % | |||||||||
Segment costs of revenues | 49.7 | 35.6 | 14.1 | 39.6 | % | |||||||||
Segment gross profit | $ | 22.1 | $ | 19.2 | $ | 2.9 | 15.1 | % | ||||||
____________________
Note: Amounts may not foot due to rounding.
(1) | Reflects reclassifications between segments to conform to the current period methodology in allocating costs to the Consumer Products segment as previously discussed in "—Business Overview—Additional Information on Segment Revenues and Costs of Revenues." |
Segment Revenues
Revenues generated from our Television Series and Specials segment increased $17.0 million, or 31.0%, to $71.8 million during the three months ended June 30, 2016 when compared to $54.8 million during the three months ended June 30, 2015. The increase in revenues was attributable to a significantly higher number of episodes delivered under our episodic content licensing arrangements. During the three months ended June 30, 2016, the primary driver of revenues was our episodic series, including Dragons Race to the Edge, Dawn of the Croods, The Mr. Peabody and Sherman Show and All Hail King Julien, while during the three months ended June 30, 2015, the primary driver of revenues was our episodic series, including Dragons: Race to the Edge, Turbo F.A.S.T, All Hail King Julien and Adventures of Puss in Boots.
Segment Costs of Revenues
Segment costs of revenues, the primary component of which is inventory amortization costs, as a percentage of revenues for our Television Series and Specials segment were 69.3% for the three months ended June 30, 2016 compared to 65.0% for the three months ended June 30, 2015. The increase in segment costs of revenues as a percentage of revenues was primarily due to a higher amount of amortization recorded for our new episodic series Voltron: Legendary Defender (released in June 2016) as a result of merchandise licensing revenues earned during the three months ended June 30, 2016, the majority of which are included as a component of the Consumer Products segment. Refer to "—Business Overview—Additional Information on Segment Revenues and Costs of Revenues" for further information on our segment costs of revenues.
Consumer Products Segment
Operating results for the Consumer Products segment were as follows (in millions, except percentages):
Three Months Ended June 30, | Increase (Decrease) | |||||||||||||
2016 | 2015(1) | $ | % | |||||||||||
Segment revenues | ||||||||||||||
Third parties | $ | 25.5 | $ | 12.7 | $ | 12.8 | 100.8 | % | ||||||
Intersegment | (2.0 | ) | (0.7 | ) | (1.3 | ) | (185.7 | )% | ||||||
Total segment revenues | 23.4 | 12.0 | 11.4 | 95.0 | % | |||||||||
Segment costs of revenues | 10.2 | 7.8 | 2.4 | 30.8 | % | |||||||||
Segment gross profit | $ | 13.2 | $ | 4.2 | $ | 9.0 | 214.3 | % | ||||||
____________________
Note: Amounts may not foot due to rounding.
37
(1) | Reflects reclassifications between segments to conform to the current period methodology in allocating costs to the Consumer Products segment as previously discussed in "—Business Overview—Additional Information on Segment Revenues and Costs of Revenues." |
Segment Revenues
As illustrated in the table above, revenues generated from our Consumer Products segment increased $11.4 million, or 95.0%, to $23.4 million during the three months ended June 30, 2016 when compared to $12.0 million during the three months ended June 30, 2015. This increase was primarily due to license fees earned during the three months ended June 30, 2016 related to our Kung Fu Panda and Voltron properties, as well as fees earned for creative services provided to third parties.
Segment Costs of Revenues
Segment costs of revenues as a percentage of revenues for our Consumer Products segment decreased to 43.6% for the three months ended June 30, 2016 when compared to 64.9% for the three months ended June 30, 2015. The decrease in costs of revenues as a percentage of revenues is a result of the mix of revenues that comprised each of the periods as the three months ended June 30, 2016 benefited from higher-margin revenue sources, in particular merchandise licensing revenues related to our new episodic series Voltron: Legendary Defender (released in June 2016).
As previously described under "—Business Overview—Additional Information on Segment Revenues and Costs of Revenues," beginning January 1, 2016, we changed the method by which we allocate costs from the Feature Films and Television Series and Specials segments to the Consumer Products segment. Segment costs of revenues as a percentage of revenues for the three months ended June 30, 2015 reflects the segment costs calculated in accordance with the current year methodology.
New Media Segment
Operating results for our New Media segment were as follows (in millions, except percentages):
Three Months Ended June 30, | Increase (Decrease) | |||||||||||||
2016 | 2015 | $ | % | |||||||||||
Segment revenues | $ | 27.6 | $ | 14.6 | $ | 13.0 | 89.0 | % | ||||||
Segment costs of revenues | 10.0 | 7.1 | 2.9 | 40.8 | % | |||||||||
Segment gross profit | $ | 17.6 | $ | 7.5 | $ | 10.1 | 134.7 | % | ||||||
Segment Revenues
Revenues generated by our New Media segment increased $13.0 million, or 89.0%, to $27.6 million during the three months ended June 30, 2016 compared to $14.6 million during the three months ended June 30, 2015. This increase was primarily attributable to revenues generated under licensing arrangements as a result of the delivery of a higher amount of newly-created content.
Segment Costs of Revenues
During the three months ended June 30, 2016 and 2015, costs of revenues related to our New Media segment were $10.0 million (or 36.3% of segment revenues) and $7.1 million (or 48.6% of segment revenues), respectively. Segment costs of revenues as a percentage of segment revenues decreased when compared to the three months ended June 30, 2015 largely due to the mix of revenue sources that contributed to revenues earned during the three months ended June 30, 2016, which had lower associated costs, when compared to the same period of the prior year.
38
All Other Segments
Operating results for all other segments in the aggregate were as follows (in millions, except percentages):
Three Months Ended June 30, | Increase (Decrease) | |||||||||||||
2016 | 2015 | $ | % | |||||||||||
Segment revenues | $ | 0.3 | $ | 1.2 | $ | (0.9 | ) | (75.0 | )% | |||||
Segment costs of revenues | 0.5 | 0.8 | (0.3 | ) | (37.5 | )% | ||||||||
Segment gross (loss) profit | $ | (0.1 | ) | $ | 0.4 | $ | (0.5 | ) | (125.0 | )% | ||||
____________________
Note: Amounts may not foot due to rounding.
Selling and Marketing. Selling and marketing expenses directly attributable to our segments are included as a component of segment profitability, and, thus, are included in each respective segment's revenues and costs of revenues discussion. As illustrated in the table below (in millions, except percentages), for the three-month periods ended June 30, 2016 and 2015, the amount of selling and marketing expenses not allocated to our segments was $1.3 million and $1.8 million, respectively.
Three Months Ended June 30, | Increase (Decrease) | |||||||||||||
2016 | 2015 | $ | % | |||||||||||
Selling and marketing | $ | 7.5 | $ | 12.1 | ||||||||||
Less: allocation to segments | 6.2 | 10.3 | ||||||||||||
Unallocated selling and marketing | $ | 1.3 | $ | 1.8 | $ | (0.5 | ) | (27.8 | )% | |||||
Our unallocated selling and marketing costs decreased when comparing the three months ended June 30, 2016 to the same period of the prior year, which was primarily due to lower corporate marketing expenses incurred during the three months ended June 30, 2016.
General and Administrative. Total general and administrative expenses increased $6.9 million, or 8.6%, to $87.6 million (including stock-based compensation expense of $7.1 million) for the three months ended June 30, 2016 from $80.7 million (including stock-based compensation expense of $6.1 million) for the three months ended June 30, 2015. These amounts include charges related to our 2015 Restructuring Plan, which for the three months ended June 30, 2016, were approximately $3.6 million and primarily related to additional labor and other excess costs. During the three months ended June 30, 2015, charges related to our 2015 Restructuring Plan consisted of $2.4 million related to employee-related (primarily relocation costs) and other costs, $10.8 million related to accelerated depreciation and amortization costs and $7.6 million related to additional labor and other excess costs. Refer to "—Management Overview—2015 Restructuring Plan" for further description of these costs.
Excluding these restructuring and restructuring-related charges, general and administrative expenses for the three months ended June 30, 2016 and 2015 would have been $84.0 million and $59.9 million, respectively, or an increase of $24.1 million, or 40.2%. Approximately $11.9 million of the increase recorded during the current period was attributable to performance-based incentive compensation expense, which varies with changes in forecasts of the related performance metrics that will be achieved. In addition, approximately $5.6 million of the increase was attributable to higher costs incurred for professional fees, primarily as a result of the pending merger transaction (as more fully described in Note 1 of the unaudited consolidated financial statements contained elsewhere in this Quarterly Report on Form 10-Q). We expect to continue to incur a higher amount of professional fees related to the pending merger (largely related to investment banking and legal fees), a portion of which will be contingent on the closing of the merger. The remaining increases related to other general and administrative expenses, none of which were individually material.
Product Development. Product development costs decreased to $0.6 million for the three months ended June 30, 2016 compared to $1.6 million for the three months ended June 30, 2015. Product development costs primarily represent research and development costs related to our technology.
Other Operating Income. During the three months ended June 30, 2016 and 2015, other operating income totaled $6.1 million and $1.7 million, respectively. The increase of $4.4 million was primarily attributable to income recognized under our sublease arrangements and the amortization of the deferred gain on our sale-leaseback transaction. Other operating income
39
during both the three months ended June 30, 2016 and 2015 included income related to certain non-cash contributions to ODW which resulted in the recognition of income associated with these contributions.
Operating Income/Loss. Operating income for the three months ended June 30, 2016 was $9.4 million compared to an operating loss of $21.8 million for the three months ended June 30, 2015. This $31.2 million increase was largely driven by higher-margin revenue sources, as previously described.
Interest Expense, Net. For the three months ended June 30, 2016 and 2015, we recorded net interest expense (net of amounts capitalized and interest income) of $3.6 million and $7.6 million, respectively. This decrease was primarily due to interest expense incurred during the three months ended June 30, 2015 as a result of our sale and leaseback transaction being classified as a lease financing obligation during that period. As discussed in Note 9 to our unaudited consolidated financial statements contained elsewhere in this Form 10-Q, we no longer record interest expense related to this transaction as the arrangement is being accounted for as an operating lease.
Other Income, Net. For the three months ended June 30, 2016, we recorded other income (net) of $0.5 million compared to $2.0 million during the three months ended June 30, 2015. The decrease in other income (net) for the three months ended June 30, 2016 when compared to the same period of the prior year was primarily due to a decline in income from our strategic alliance relationships, as well as fluctuations in foreign currency rates primarily related to intercompany balances that will be settled. During the three months ended June 30, 2016, other income (net) included unrealized losses on foreign currency transactions totaling $0.5 million compared to gains totaling $0.5 million for the same period of the prior year.
Increase in Income Tax Benefit Payable to Former Stockholder. As a result of a partial increase in the tax basis of our tangible and intangible assets attributable to transactions entered into by affiliates controlled by a former stockholder at the time of our 2004 initial public offering ("Tax Basis Increase"), we may pay reduced tax amounts to the extent we generate sufficient taxable income in the future. As a result of the Tax Basis Increase, we are obligated to remit to such affiliates 85% of any cash savings in U.S. Federal income tax, California franchise tax and certain other related tax benefits, subject to repayment if it is determined that these savings should not have been available to us. For the three months ended June 30, 2016, we did not record an increase nor a decrease to our income tax benefit payable to former stockholder in our statements of operations as we are not anticipating a tax benefit from the Tax Basis Increase for the three months ended June 30, 2016. For the three months ended June 30, 2015, we recorded $7.1 million as an increase to our income tax benefit payable to former stockholder in our statements of operations as we were anticipating a tax benefit from the Tax Basis Increase for the year ended December 31, 2015.
Loss from Equity Method Investees. During the three months ended June 30, 2016 and 2015, our portion of the loss incurred by equity method investees was $3.6 million and $2.7 million, respectively, which consisted of our share of losses generated by ODW. Due to the timing of the distribution of our feature films in China, the three-month period ended June 30, 2015 benefited from the theatrical release of Home (April 2016 release in China). During the same period of the current year, there was no theatrical release through ODW in China as Kung Fu Panda 3 had released in China in January of 2016, which benefited the quarter ended March 31, 2016.
Provision for Income Taxes. For the three months ended June 30, 2016 and 2015, we recorded a provision for income taxes of $1.3 million and $1.8 million, respectively, or an effective tax rate of 48.6% and (5.8)%, respectively. When our provision for income taxes is combined with the amounts associated with the Increase in Income Tax Benefit Payable to Former Stockholder (see above), the combined effective tax rates for the three months ended June 30, 2016 and 2015 were 48.6% and (29.3)%, respectively. Our effective tax rates and combined effective tax rates for the three months ended June 30, 2016 and 2015 varied from the 35% statutory federal rate primarily due to the valuation allowance against our deferred tax assets, as well as foreign taxes. Our effective tax rate and combined effective tax rate for the three months ended June 30, 2015 were negative due to our loss before income taxes. In addition, as it relates to the three-month period ended June 30, 2015, our combined effective tax rate was also attributable to an increase in our income tax benefit payable to former stockholder.
For further information on the methodology applied in determining our provision for income taxes for the three months ended June 30, 2016 and 2015, refer to Note 10 of our unaudited consolidated financial statements contained elsewhere in this Quarterly Report.
Net Loss Attributable to Non-Controlling Interests. We consolidate the results of several majority-owned entities because we retain control over the operations of these entities. Net loss attributable to non-controlling interests represents the joint venture partners' share of the loss that is consolidated in our operating results. During the three months ended June 30, 2016 and 2015, net loss attributable to non-controlling interests was $0.9 million and $0.4 million, respectively. The primary component of the loss during the three months ended June 30, 2016 was the operating results of our technology-related joint
40
venture, while the primary component of the loss during the three months ended June 30, 2015 was the operating results of ATV.
Net Income/Loss Attributable to DreamWorks Animation SKG, Inc. Net income (excluding net loss attributable to non-controlling interests) for the three months ended June 30, 2016 was $2.3 million, or $0.03 per diluted share, as compared to a net loss of $38.6 million, or $0.45 per share, for the three months ended June 30, 2015.
Six Months Ended June 30, 2016 Compared to Six Months Ended June 30, 2015
The following chart sets forth (in millions, except percentages), for the periods presented, our revenues by segment. This information should be read in conjunction with our unaudited consolidated financial statements and the notes thereto included elsewhere in this Quarterly Report.
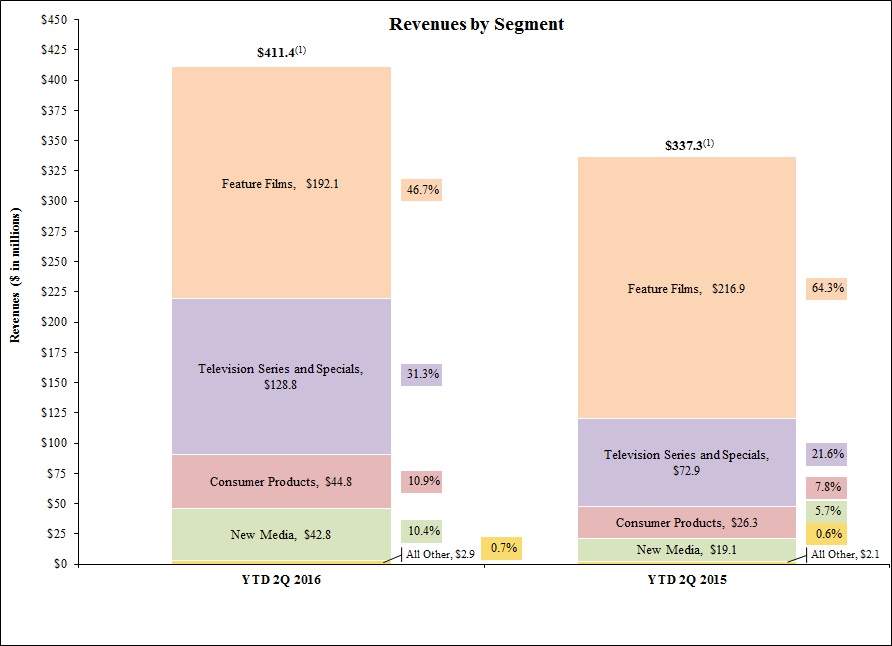
________________
(1) | For each period shown, "Feature Films" consists of revenues attributable to the exploitation of feature films in the theatrical, television, home entertainment and digital markets. "Television Series and Specials" consists of revenues attributable to the exploitation of television, direct-to-video and other non-theatrical content. "Consumer Products" consists of revenues attributable to our merchandising and licensing activities related to the exploitation of our intellectual property rights. "New Media" consists of revenues attributable to ATV and related businesses. "All Other" consists of revenues not attributable to the reportable segments. |
41
Revenues and Segment Costs of Revenues
Feature Films Segment
Operating results for the Feature Films segment were as follows (in millions, except percentages):
Six Months Ended June 30, | Increase (Decrease) | |||||||||||||
2016 | 2015(1) | $ | % | |||||||||||
Segment revenues | ||||||||||||||
Third parties | $ | 190.7 | $ | 215.8 | $ | (25.1 | ) | (11.6 | )% | |||||
Intersegment | 1.4 | 1.1 | 0.3 | 27.3 | % | |||||||||
Total segment revenues | 192.1 | 216.9 | (24.8 | ) | (11.4 | )% | ||||||||
Segment costs of revenues | 125.9 | 149.5 | (23.6 | ) | (15.8 | )% | ||||||||
Segment gross profit | $ | 66.2 | $ | 67.4 | $ | (1.2 | ) | (1.8 | )% | |||||
____________________
(1) | Reflects reclassifications between segments to conform to the current period methodology in allocating costs to the Consumer Products segment as previously discussed in "—Business Overview—Additional Information on Segment Revenues and Costs of Revenues." |
Segment Revenues
The following chart sets forth the revenues generated by our Feature Films segment, by category, for the six months ended June 30, 2016 as compared to the six months ended June 30, 2015 (in millions):
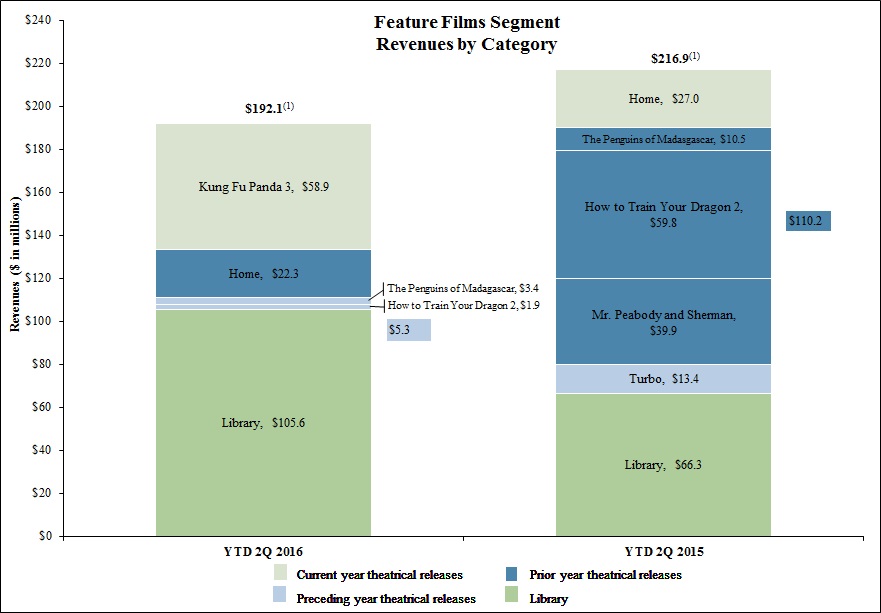
____________________
42
(1) | For each period shown, "Current year theatrical releases" consists of revenues attributable to films released during the current year, "Prior year theatrical releases" consists of revenues attributable to films released during the immediately prior year, and "Preceding year theatrical releases" consists of revenues attributable to films released during all previous periods that are not yet part of our library. Titles are added to the "Library" category starting with the quarter of a title's second anniversary of the initial domestic theatrical release. |
Current year theatrical releases. Revenues generated by our "Current year theatrical releases" category increased $31.9 million to $58.9 million during the six months ended June 30, 2016 compared to $27.0 million during the six months ended June 30, 2015. This increase was primarily due to a higher amount of revenues earned by Kung Fu Panda 3 (January 2016 release), which was a stronger-performing title in the worldwide theatrical market when compared to Home (March 2015 release). During the six months ended June 30, 2016, Kung Fu Panda 3 contributed revenues of $58.9 million, or 14.3%, of consolidated revenues, primarily earned in the worldwide theatrical and home entertainment markets. During the six months ended June 30, 2015, Home contributed $27.0 million, or 8.0%, of consolidated revenues primarily earned in the worldwide theatrical markets.
Prior year theatrical releases. Revenues generated by our "Prior year theatrical releases" category decreased $87.9 million, or 79.8%, to $22.3 million during the six months ended June 30, 2016 when compared to $110.2 million of revenues earned during the six months ended June 30, 2015. The decrease in revenues was primarily due to a decrease in the number of films that comprised this category during the six months ended June 30, 2016 when compared to the same period of the prior year.
For the six months ended June 30, 2016, "Prior year theatrical release" revenues consisted of those generated by Home (March 2015 release) which contributed $22.3 million, or 5.4%, of consolidated revenues primarily earned in the international television and worldwide home entertainment markets.
For the six months ended June 30, 2015, "Prior year theatrical release" revenues consisted of those generated by The Penguins of Madagascar (November 2014 release), How to Train Your Dragon 2 (June 2014 release) and Mr. Peabody and Sherman (March 2014 release). The Penguins of Madagascar contributed $10.5 million, or 3.1%, of consolidated revenues, primarily generated in the worldwide home entertainment markets. How to Train Your Dragon 2 and Mr. Peabody and Sherman contributed $59.8 million (or 17.7%) and $39.9 million (or 11.8%) of consolidated revenues, respectively, primarily related to each title's SVOD distribution.
Preceding year theatrical releases. Revenues generated by our "Preceding year theatrical releases" category consist of revenues attributable to films released during all previous periods that are not yet part of our library. Revenues generated by our "Preceding year theatrical releases" category decreased $8.1 million, or 60.4%, to $5.3 million during the six months ended June 30, 2016 when compared to $13.4 million during the six months ended June 30, 2015 primarily due to a non-routine licensing arrangement attributable to the home entertainment market related to Turbo (July 2013 release), which contributed to revenues earned during the six months ended June 30, 2015.
For the six months ended June 30, 2016, "Preceding year theatrical releases" revenues consisted of those related to The Penguins of Madagascar (November 2014 release) and How to Train Your Dragon 2 (June 2014 release), which contributed an aggregate of $5.3 million, or 1.3%, of consolidated revenues, earned across a variety of markets. "Preceding year theatrical releases" revenues during the six months ended June 30, 2015 consisted of those related to Turbo, which contributed $13.4 million, or 4.0%, of consolidated revenues, primarily earned in the international home entertainment market.
Library. Titles are added to the "Library" category starting with the quarter of a title's second anniversary of the initial domestic theatrical release. Revenues from our "Library" category increased by $39.3 million, or 59.3%, to $105.6 million during the six months ended June 30, 2016 when compared to $66.3 million during the six months ended June 30, 2015. The increase in revenues was attributable to the addition of How to Train Your Dragon 2 (June 2014 release) and Mr. Peabody and Sherman (March 2014 release) to our "Library" category, as well as license revenues earned related to the SVOD distribution of our library titles. As it relates to the six months ended June 30, 2015, Library revenues also included recoveries totaling $7.8 million from previously established home entertainment reserves related to sales through our former primary theatrical distributor.
43
Segment Costs of Revenues
The primary component of segment costs of revenues for our Feature Films segment is film amortization costs. Segment costs of revenues as a percentage of revenues for our Feature Films segment was 65.5% during the six months ended June 30, 2016 compared to 68.9% for the six months ended June 30, 2015. The decrease in segment costs of revenues as a percentage of revenues was due to recoveries of amounts totaling $3.2 million related to exploitation costs handled by one of our primary theatrical distributors, as well as recoveries totaling $4.9 million related to amounts owed for participations and residuals, which were recorded during the six-month period ended June 30, 2016.
Television Series and Specials Segment
Operating results for the Television Series and Specials segment were as follows (in millions, except percentages):
Six Months Ended June 30, | Increase (Decrease) | |||||||||||||
2016 | 2015(1) | $ | % | |||||||||||
Segment revenues | ||||||||||||||
Third parties | $ | 127.8 | $ | 72.5 | $ | 55.3 | 76.3 | % | ||||||
Intersegment | 1.0 | 0.3 | 0.7 | 233.3 | % | |||||||||
Total segment revenues | 128.8 | 72.9 | 55.9 | 76.7 | % | |||||||||
Segment costs of revenues | 85.7 | 50.2 | 35.5 | 70.7 | % | |||||||||
Segment gross profit | $ | 43.1 | $ | 22.7 | $ | 20.4 | 89.9 | % | ||||||
____________________
Note: Amounts may not foot due to rounding.
(1) | Reflects reclassifications between segments to conform to the current period methodology in allocating costs to the Consumer Products segment as previously discussed in "—Business Overview—Additional Information on Segment Revenues and Costs of Revenues." |
Segment Revenues
Revenues generated from our Television Series and Specials segment increased $55.9 million, or 76.7%, to $128.8 million during the six months ended June 30, 2016 when compared to $72.9 million during the six months ended June 30, 2015. The increase in revenues was attributable to a significantly higher number of episodes delivered under our episodic content licensing arrangements. During the six months ended June 30, 2016, the primary driver of revenues was our episodic series, including The Mr. Peabody and Sherman Show, Dragons Race to the Edge, Voltron and Dawn of the Croods, while during the six months ended June 30, 2015, the primary driver of revenues was our episodic series, including Dragons: Race to the Edge, Turbo F.A.S.T, All Hail King Julien and Adventures of Puss in Boots.
Segment Costs of Revenues
Segment costs of revenues, the primary component of which is inventory amortization costs, as a percentage of revenues for our Television Series and Specials segment were 66.5% for the six months ended June 30, 2016 compared to 68.9% for the six months ended June 30, 2015. The decrease in segment costs of revenues as a percentage of revenues was primarily due to a decrease in the amount of advertising and marketing costs we incurred for our episodic series during the six months ended June 30, 2016 compared to the same period of the prior year.
Consumer Products Segment
Operating results for the Consumer Products segment were as follows (in millions, except percentages):
Six Months Ended June 30, | Increase (Decrease) | |||||||||||||
2016 | 2015(1) | $ | % | |||||||||||
Segment revenues | ||||||||||||||
Third parties | $ | 47.2 | $ | 27.8 | $ | 19.4 | 69.8 | % | ||||||
Intersegment | (2.4 | ) | (1.5 | ) | (0.9 | ) | (60.0 | )% | ||||||
Total segment revenues | 44.8 | 26.3 | 18.5 | 70.3 | % | |||||||||
44
Six Months Ended June 30, | Increase (Decrease) | |||||||||||||
2016 | 2015(1) | $ | % | |||||||||||
Segment costs of revenues | 16.6 | 12.7 | 3.9 | 30.7 | % | |||||||||
Segment gross profit | $ | 28.2 | $ | 13.6 | $ | 14.6 | 107.4 | % | ||||||
____________________
(1) | Reflects reclassifications between segments to conform to the current period methodology in allocating costs to the Consumer Products segment as previously discussed in "—Business Overview—Additional Information on Segment Revenues and Costs of Revenues." |
Segment Revenues
As illustrated in the table above, revenues generated from our Consumer Products segment increased $18.5 million, or 70.3%, to $44.8 million during the six months ended June 30, 2016 when compared to $26.3 million during the six months ended June 30, 2015. This increase was primarily due to revenues earned, during the six months ended June 30, 2016, from licensing arrangements related to a variety of our intellectual property rights associated with the characters from our animated content, as well as other revenue-generating arrangements related to our location-based entertainment initiatives.
Segment Costs of Revenues
Segment costs of revenues as a percentage of revenues for our Consumer Products segment decreased to 37.0% for the six months ended June 30, 2016 when compared to 48.2% for the six months ended June 30, 2015. The decrease in costs of revenues as a percentage of revenues is a result of the mix of revenues that comprised each of the periods as the six months ended June 30, 2016 benefited from higher-margin revenue sources.
As previously described under "—Business Overview—Additional Information on Segment Revenues and Costs of Revenues," beginning January 1, 2016, we changed the method by which we allocate costs from the Feature Films and Television Series and Specials segments to the Consumer Products segment. Segment costs of revenues as a percentage of revenues for the six months ended June 30, 2015 reflects the segment costs calculated in accordance with the current year methodology.
New Media Segment
Operating results for our New Media segment were as follows (in millions, except percentages):
Six Months Ended June 30, | Increase (Decrease) | |||||||||||||
2016 | 2015 | $ | % | |||||||||||
Segment revenues | $ | 42.8 | $ | 19.1 | $ | 23.7 | 124.1 | % | ||||||
Segment costs of revenues | 18.7 | 9.5 | 9.2 | 96.8 | % | |||||||||
Segment gross profit | $ | 24.1 | $ | 9.6 | $ | 14.5 | 151.0 | % | ||||||
Segment Revenues
Revenues generated by our New Media segment increased to $42.8 million during the six months ended June 30, 2016 compared to $19.1 million during the six months ended June 30, 2015. This increase was primarily attributable to revenues generated under licensing arrangements as a result of the delivery of a higher amount of newly-created content.
Segment Costs of Revenues
During the six months ended June 30, 2016 and 2015, costs of revenues related to our New Media segment were $18.7 million (or 43.8% of segment revenues) and $9.5 million (or 49.9% of segment revenues), respectively. Segment costs of revenues as a percentage of segment revenues decreased when compared to the six months ended June 30, 2015 largely due to the mix of revenue sources that contributed to revenues earned during the six months ended June 30, 2016, which had lower associated costs, when compared to the same period of the prior year. In addition, costs of revenues are impacted by the straight-line amortization of intangible assets, and as a result, such amortization does not directly correlate with revenues generated during the period.
45
All Other Segments
Operating results for all other segments in the aggregate were as follows (in millions, except percentages):
Six Months Ended June 30, | Increase (Decrease) | |||||||||||||
2016 | 2015 | $ | % | |||||||||||
Segment revenues | $ | 2.9 | $ | 2.1 | $ | 0.8 | 38.1 | % | ||||||
Segment costs of revenues | 1.5 | 1.2 | 0.3 | 25.0 | % | |||||||||
Segment gross profit | $ | 1.3 | $ | 0.9 | $ | 0.4 | 44.4 | % | ||||||
____________________
Note: Amounts may not foot due to rounding.
Selling and Marketing. Selling and marketing expenses directly attributable to our segments are included as a component of segment profitability, and, thus, are included in each respective segment's revenues and costs of revenues discussion. As illustrated in the table below (in millions, except percentages), for the six-month periods ended June 30, 2016 and 2015, the amount of selling and marketing expenses not allocated to our segments was $1.7 million and $3.5 million, respectively.
Six Months Ended June 30, | Increase (Decrease) | |||||||||||||
2016 | 2015 | $ | % | |||||||||||
Selling and marketing | $ | 13.6 | $ | 20.5 | ||||||||||
Less: allocation to segments | 11.9 | 17.0 | ||||||||||||
Unallocated selling and marketing | $ | 1.7 | $ | 3.5 | $ | (1.8 | ) | (51.4 | )% | |||||
Our unallocated selling and marketing costs decreased when comparing the six months ended June 30, 2016 to the same period of the prior year, which was primarily due to lower corporate marketing expenses incurred during the six months ended June 30, 2016.
General and Administrative. Total general and administrative expenses decreased $22.0 million, or 12.9%, to $147.9 million (including stock-based compensation expense of $11.8 million) for the six months ended June 30, 2016 from $169.9 million (including stock-based compensation expense of $10.2 million) for the six months ended June 30, 2015. This decrease was primarily due to charges incurred during the six-month period ended June 30, 2015 related to the 2015 Restructuring Plan that consisted of $8.5 million related to employee-related (primarily relocation costs) and other costs, $20.1 million related to accelerated depreciation and amortization costs and $24.1 million related to additional labor and other excess costs. During the six months ended June 30, 2016, charges associated with the 2015 Restructuring Plan were $5.0 million and primarily related to additional labor and other excess costs. Refer to "—Management Overview—2015 Restructuring Plan" for further description of these costs.
Excluding these restructuring and restructuring-related charges, general and administrative expenses for the six months ended June 30, 2016 and 2015 would have been $142.9 million and $117.2 million, respectively, or an increase of $25.7 million, or 21.9%. Approximately $11.3 million of the increase recorded during the current period was attributable to performance-based incentive compensation expense, which varies with changes in forecasts of the related performance metrics that will be achieved. In addition, approximately $4.9 million of the increase was attributable to higher costs incurred for professional fees, primarily as a result of the pending merger transaction (as more fully described in Note 1 of the unaudited consolidated financial statements contained elsewhere in this Quarterly Report on Form 10-Q). Lastly, our facilities costs increased by approximately $4.0 million as a result of additional leased office space. The remaining increases related to other general and administrative expenses, none of which were individually material.
Product Development. Product development costs decreased to $1.1 million for the six months ended June 30, 2016 compared to $1.9 million for the six months ended June 30, 2015. Product development costs primarily represent research and development costs related to our technology.
Other Operating Income. During the six months ended June 30, 2016 and 2015, other operating income totaled $11.0 million and $4.0 million, respectively. The increase of $7.0 million was primarily attributable to income recognized under our sublease arrangements and the amortization of the deferred gain on our sale-leaseback transaction. Other operating income
46
during both the six months ended June 30, 2016 and 2015 included income related to certain non-cash contributions to ODW which resulted in the recognition of income associated with these contributions.
Operating Income/Loss. Operating income for the six months ended June 30, 2016 was $23.2 million compared to an operating loss of $57.1 million for the six months ended June 30, 2015. This $80.3 million increase was largely driven by higher-margin revenue sources and the decline in general and administrative expenses as, in 2015, we incurred significant costs associated with our 2015 Restructuring Plan.
Interest Expense, Net. For the six months ended June 30, 2016 and 2015, we recorded net interest expense (net of amounts capitalized and interest income) of $8.6 million and $13.9 million, respectively. This decrease was primarily due to interest expense incurred during the six months ended June 30, 2015 as a result of our sale and leaseback transaction being classified as a lease financing obligation during that period. As discussed in Note 9 to our unaudited consolidated financial statements contained elsewhere in this Form 10-Q, we no longer record interest expense related to this transaction as the arrangement is being accounted for as an operating lease.
Other Income/Expense, Net. For the six months ended June 30, 2016, we recorded other income (net) of $2.4 million compared to other expense (net) of $3.5 million recorded during the six months ended June 30, 2015. Other expense (net) for the six months ended June 30, 2015 was primarily due to a write-off in the amount of $5.1 million related to a strategic investment. During the six months ended June 30, 2016, other income (net) largely related to income earned from certain of our strategic alliance relationships.
Increase in Income Tax Benefit Payable to Former Stockholder. As a result of the Tax Basis Increase, we are obligated to remit to such affiliates 85% of any cash savings in U.S. Federal income tax, California franchise tax and certain other related tax benefits, subject to repayment if it is determined that these savings should not have been available to us. For the six months ended June 30, 2016, we did not record an increase nor a decrease to our income tax benefit payable to former stockholder in our statements of operations as we are not anticipating a tax benefit from the Tax Basis Increase for the six months ended June 30, 2016. For the six months ended June 30, 2015, we recorded $7.1 million as an increase to our income tax benefit payable to former stockholder in our statements of operations as we were anticipating a tax benefit from the Tax Basis Increase for the year ended December 31, 2015.
Loss from Equity Method Investees. During the six months ended June 30, 2016 and 2015, our portion of the losses incurred by equity method investees was $1.0 million and $9.1 million, respectively, which were primarily attributable to our shares of losses incurred by ODW. During the six months ended June 30, 2016, ODW recorded revenues related to the theatrical release of Kung Fu Panda 3 in China as a result of our arrangement with them as described in Note 6 to our unaudited financial statements contained elsewhere in this Form 10-Q. This was the primary driver of the decrease in losses we recorded from equity method investees during the six months ended June 30, 2016 compared to the same period of the prior year.
Provision for Income Taxes. For the six months ended June 30, 2016 and 2015, we recorded a provision for income taxes of $2.5 million and $4.2 million, respectively, or an effective tax rate of 15.4% and (5.0)%, respectively. However, when our provision for income taxes is combined with the amounts associated with the Increase in Income Tax Benefit Payable to Former Stockholder (see above), the combined effective tax rates for the six months ended June 30, 2016 and 2015 were 15.4% and (13.5)%, respectively. Our effective tax rates and combined effective tax rates for the six months ended June 30, 2016 and 2015 were lower than the 35% statutory federal rate primarily due to the effect of a valuation allowance against our deferred tax assets, as well as foreign taxes. In addition, as it relates to the six-month period ended June 30, 2015, our combined effective tax rate was also attributable to an increase in our income tax benefit payable to former stockholder.
For further information on the methodology applied in determining our provision for income taxes for the six months ended June 30, 2016 and 2015, refer to Note 10 of our unaudited consolidated financial statements contained elsewhere in this Quarterly Report.
Net Loss Attributable to Non-Controlling Interests. We consolidate the results of several majority-owned entities because we retain control over the operations of these entities. Net loss attributable to non-controlling interests represents the joint venture partners' share of the loss that is consolidated in our operating results. During the six months ended June 30, 2016 and 2015, net loss attributable to non-controlling interests was $2.6 million and $1.5 million, respectively. The primary component of the loss during the six months ended June 30, 2016 was the operating results of our technology-related joint ventures, while the primary component of the loss during the six months ended June 30, 2015 was the operating results of ATV.
47
Net Income/Loss Attributable to DreamWorks Animation SKG, Inc. Net income (excluding net loss attributable to non-controlling interests) for the six months ended June 30, 2016 was $16.2 million, or $0.18 per diluted share, as compared to a net loss of $93.4 million, or $1.09 per share, for the six months ended June 30, 2015.
Financing Arrangements
There were no material changes during the period covered by this Quarterly Report, outside of the ordinary course of business, to the financing arrangements specified in the section "Management's Discussion and Analysis of Financial Condition and Results of Operations" included in our 2015 Form 10-K.
For a more detailed description of our various financing arrangements, please see Note 9 to the unaudited consolidated financial statements contained in Part I, Item 1 of this Quarterly Report and the "Management's Discussion and Analysis of Financial Condition and Results of Operations" section of our 2015 Form 10-K.
As of June 30, 2016, we were in compliance with all applicable financial debt covenants.
Liquidity and Capital Resources
Current Financial Condition
Cash generated from our operating activities, borrowings from our revolving credit facility and cash on hand during the six months ended June 30, 2016 were adequate to meet our operating cash needs. For the next 12 months, we expect that cash on hand, cash from operations, funds available under our revolving credit facility and other capital resources will be sufficient to satisfy our anticipated cash needs for working capital (e.g., general and administrative costs, selling and marketing costs, participation and residual payments, production and development costs related to film and non-film initiatives and new business investments), capital expenditures, debt service payments and our restructuring initiatives.
Depending on prevailing market conditions, our liquidity requirements, bond and revolving facility covenants and other factors, we may repurchase our outstanding debt or equity securities through cash purchases, in open market purchases, privately negotiated transactions, tender offers or otherwise.
As of June 30, 2016, we had cash and cash equivalents totaling $75.1 million. Approximately 51% of this amount was held by two of our consolidated joint ventures. Our cash and cash equivalents consist of cash on deposit and short-term money market investments, primarily comprised of U.S. government securities, that are rated AAA and with maturities of three months or less when purchased. Our cash and cash equivalents balance at June 30, 2016 decreased by $35.7 million from $110.8 million at December 31, 2015. Components of this change in cash for the six months ended June 30, 2016, as well as for the six months ended June 30, 2015, are provided below in more detail.
As previously described, our feature films are being distributed in China by ODW. China imposes cross-border currency regulations that restrict inflows and outflows of cash. As a result, we may experience a delay in receiving cash remittances from ODW for revenues generated in China. Based on the current amounts of revenue generated through our distribution arrangement with ODW, we do not currently believe that a delay in cash remittances from China will affect our liquidity and capital resource needs. As of June 30, 2016, the amount of outstanding receivables from ODW for distribution of our films was $23.4 million.
Operating Activities
Net cash (used in) provided by operating activities for the six months ended June 30, 2016 and 2015 was as follows (in thousands):
2016 | 2015 | ||||||
Net cash (used in) provided by operating activities | $ | (56,960 | ) | $ | 7,341 | ||
During the six months ended June 30, 2016, our main source of cash from operating activities was the collection of revenue from Home's worldwide home entertainment revenues, The Penguins of Madagascar's domestic home entertainment and international television revenues, The Croods' worldwide home entertainment and international television revenues, How to Train Your Dragon 2's worldwide home entertainment and international television revenues, and to a lesser extent, the collection of worldwide television and home entertainment revenues from our other films. In addition, other sources of cash included those related to revenues from licensing of our episodic content.
48
Cash used in operating activities for the six months ended June 30, 2016 included $45.0 million paid related to incentive compensation payments, which increased $36.5 million when compared to the amount paid during the six months ended June 30, 2015 as these cash payments primarily fluctuate based on our financial results. During the six months ended June 30, 2016, we also made payments to an affiliate of a former stockholder related to tax benefits realized in 2015 from the Tax Basis Increase in the amount of $16.4 million. Cash used in operating activities also included production spending for our films and television series, as well as participation and residual payments.
During the six months ended June 30, 2015, our main source of cash from operating activities was the collection of revenue from How to Train Your Dragon 2's worldwide home entertainment and international theatrical revenues, The Croods' worldwide home entertainment revenues, Madagascar 3's international television revenues, and to a lesser extent, the collection of worldwide television and home entertainment revenues from our other films. Cash used in operating activities for the six months ended June 30, 2015 included $8.5 million paid related to incentive compensation payments. During the six months ended June 30, 2015, we also made payments (net of refunds received) to an affiliate of a former stockholder related to tax benefits realized in 2014 from the Tax Basis Increase in the amount of $7.4 million. The cash from operating activities was also partially offset by production spending for our films and television series, as well as participation and residual payments.
Investing Activities
Net cash used in investing activities for the six months ended June 30, 2016 and 2015 was as follows (in thousands):
2016 | 2015 | ||||||
Net cash used in investing activities | $ | (21,792 | ) | $ | (6,893 | ) | |
Net cash used in investing activities for the six months ended June 30, 2016 and 2015 was largely attributable to the investment in property, plant and equipment. The increase in cash used to purchase property, plant and equipment when comparing the six months ended June 30, 2016 to the same period of the prior year was primarily due to a higher amount of purchases by our consolidated joint ventures, as well as higher purchases of computer hardware and equipment. In addition, during the six months ended June 30, 2015, we made cash contributions totaling $2.3 million in connection with investments in various unconsolidated entities. For further information regarding our investments in unconsolidated entities, refer to Note 6 of our unaudited consolidated financial statements contained elsewhere in this Quarterly Report.
Financing Activities
Net cash provided by financing activities for the six months ended June 30, 2016 and 2015 was as follows (in thousands):
2016 | 2015 | ||||||
Net cash provided by financing activities | $ | 43,014 | $ | 88,101 | |||
Net cash provided by financing activities for the six months ended June 30, 2016 primarily consisted of $99.0 million in borrowings under our revolving credit facility, which was partially offset by $51.0 million in repayments of borrowings. Net cash provided by financing activities for the six months ended June 30, 2015 included $385.4 million in borrowings under our revolving credit facility, which was more than offset by $485.4 million in repayments of borrowings.
In addition, net cash provided by financing activities for the six months ended June 30, 2015 was largely comprised of $185.0 million of net proceeds received from our sale of our headquarters facilities (which was initially recorded as a financing arrangement as further described in Note 9 of our unaudited consolidated financial statements contained elsewhere in this Form 10-Q), which was offset by $1.4 million in repayments under the lease financing obligation.
Lastly, during the six months ended June 30, 2015, cash provided by financing activities also included a cash contribution from a non-controlling interest holder in the amount of $15.0 million related to the formation of a new entity to commercialize one of the Company's technology initiatives.
49
Contractual Obligations
Contributions to Oriental DreamWorks
Pursuant to the Transaction and Contribution Agreement with ODW, we have committed to make certain cash and non-cash contributions in connection with the formation of ODW. As of June 30, 2016, our remaining contribution commitments consisted of the following: (i) $33.0 million in cash (which is expected to be funded over the next two years), (ii) two film projects developed by us, (iii) remaining delivery requirements under the license of technology and (iv) approximately $6.3 million in consulting and training services. Some of these remaining commitments will require future cash outflows for which we are not currently able to estimate the timing of contributions as this will depend on, among other things, ODW's operations. For a more detailed description of our contribution commitments, please see Note 6 of the unaudited consolidated financial statements contained in Part I, Item 1 of this Quarterly Report.
Non-Cancelable Talent Commitments
As of June 30, 2016, we had non-cancelable talent commitments totaling approximately $27.7 million that we expect to be payable over the next five years.
There have been no other material changes during the period covered by this Quarterly Report, outside of the ordinary course of business, to the contractual obligations specified in the table of contractual obligations included in the section "Management's Discussion and Analysis of Financial Condition and Results of Operations" included in our 2015 Form 10-K.
Critical Accounting Policies and Estimates
Our significant accounting policies are outlined in Note 2 to the audited consolidated financial statements contained in our 2015 Form 10-K. We prepare our consolidated financial statements in accordance with U.S. generally accepted accounting principles ("U.S. GAAP"). In doing so, we have to make estimates and assumptions that affect our reported amounts of assets, liabilities, revenues and expenses, as well as related disclosure of contingent assets and liabilities including:
• | ultimate revenues and ultimate costs of film and television product; |
• | relative selling price of the Company's products for purposes of revenue allocation in multi-property licenses and other multiple deliverable arrangements; |
• | determination of the fair value of reporting units for purposes of testing goodwill for impairment; |
• | determination of fair value of non-cash contributions to investments in unconsolidated entities; |
• | useful lives of intangible assets; |
• | product sales that will be returned and the amount of receivables that ultimately will be collected; |
• | the potential outcome of future tax consequences of events that have been recognized in the Company's financial statements; |
• | loss contingencies; and |
• | assumptions used in the determination of the fair value of equity-based awards for stock-based compensation or their probability of vesting. |
In some cases, changes in the accounting estimates are reasonably likely to occur from period to period. Accordingly, actual results could differ materially from our estimates. To the extent that there are material differences between these estimates and actual results, our financial condition or results of operations will be affected. We base our estimates on past experience and other assumptions that we believe are reasonable under the circumstances, and we evaluate these estimates on an ongoing basis.
An accounting policy is deemed to be critical if it requires an accounting estimate to be made based on assumptions about matters that are highly uncertain at the time the estimate is made, if different estimates reasonably could have been used, or if changes in the estimate that are reasonably likely to occur could materially impact the financial statements. Management believes there have been no material changes during the period covered by this Quarterly Report to the items that we disclosed as our critical accounting policies and estimates in "Management's Discussion and Analysis of Financial Condition and Results of Operations" in our Annual Report on Form 10-K for the fiscal year ended December 31, 2015.
Recent Accounting Pronouncements
In May 2014, the Financial Accounting Standards Board ("FASB") issued an accounting standards update to provide companies with a single model for use in accounting for revenue from contracts with customers. Once it becomes effective, the
50
new guidance will replace most existing revenue recognition guidance in U.S. GAAP, including industry-specific guidance. We are required to adopt the guidance on January 1, 2018. Early adoption is permitted but not earlier than the fiscal year beginning January 1, 2017. Companies are permitted to either apply the guidance retrospectively to all prior periods presented or, alternatively, apply the guidance in the year of adoption with the cumulative effect recognized at the date of initial application (referred to as the modified retrospective approach). We do not expect that we will adopt this standard prior to January 1, 2018. We are currently in the process of concluding on the method of adoption, as well as evaluating the impact that the new standard will have on our consolidated financial statements. However, we currently believe that we will adopt the new guidance using the full retrospective approach.
For further details, as well as a discussion of other recent accounting pronouncements, please see Note 2 of the unaudited consolidated financial statements contained in Part I, Item 1 of this Quarterly Report.
Non-GAAP Measures
In addition to the financial results reported in accordance with U.S. GAAP, we have provided various Adjusted Income/Loss Measures (collectively, "non-GAAP measures"), which are further described and defined below. Adjusted Income/Loss Measures are not prepared in accordance with U.S. GAAP. Adjusted Income/Loss Measures provide a supplemental presentation of our operating performance and generally reflect adjustments for unusual or non-operational activities. We may not calculate Adjusted Income/Loss Measures in a manner consistent with the methodologies used by other companies. Adjusted Income/Loss Measures (a) do not represent our operating income or cash flows from operating activities as defined by U.S. GAAP; (b) are not necessarily indicative of cash available to fund our cash flow needs; and (c) should not be considered alternatives to net income, operating income, cash provided by operating activities or our other financial information as determined under U.S. GAAP. Our presentation of Adjusted Income/Loss Measures should not be construed as an implication that our future results will be unaffected by unusual items. We believe the use of Adjusted Income/Loss Measures on a consolidated basis assists investors in comparing our ongoing operating performance between periods.
On January 22, 2015, the Company announced its restructuring initiatives (the "2015 Restructuring Plan") that are intended to refocus the Company's core feature animation business. In connection with the 2015 Restructuring Plan, the Company made changes in its senior leadership team and also made changes based on its reevaluation of the Company's feature film slate. The Company evaluates operating performance to exclude the effects of the charges related to the execution of the 2015 Restructuring Plan as it believes the restructuring-related charges do not correlate with the ongoing operating results of the Company's business and were charges that resulted from significant decisions that were made in order to refocus the Company. As a result, the Company believes that presenting the Company's Adjusted Operating Income/Loss, Adjusted Net Income/Loss Attributable to DreamWorks Animation SKG, Inc. and Adjusted Diluted Income/Loss per share (collectively, "Adjusted Income/Loss Measures") will aid investors in evaluating the performance of the Company. The Company defines Adjusted Income/Loss Measures as net earnings (loss) adjusted to exclude the items within its Consolidated Statements of Operations that relate to its 2015 Restructuring Plan (as discussed further in "—Management's Discussion and Analysis of Financial Condition and Results of Operations—Management Overview").
The Company uses these Adjusted Income/Loss Measures to, among other things, evaluate the Company's operating performance. These measures are among the primary measures used by management for planning and forecasting of future periods, and they are important indicators of the Company's operational strength and business performance because they provide a link between profitability and operating cash flow. The Company believes these measures are relevant and useful for investors because they allow investors to view performance in a manner similar to the method used by the Company's management and help improve investors' understanding of the Company's operating performance. In addition, the Company believes that these are among the primary measures used externally by the Company's investors, analysts and industry peers for purposes of valuation and for the comparison of the Company's operating performance to other companies in its industry.
The following is a reconciliation of each of the Company's GAAP measures (operating income/loss, net income/loss attributable to DreamWorks Animation SKG, Inc. and loss (or diluted earnings) per share) to the non-GAAP adjusted amounts (in thousands, except per share amounts) for the three and six months ended June 30, 2015. For the three and six months ended June 30, 2016, the amounts attributable to the 2015 Restructuring Plan were immaterial and, as a result, the Adjusted Income/Loss Measures are not presented for this period. Refer to "—Management's Discussion and Analysis of Financial Condition and Results of Operations—Management Overview—2015 Restructuring Plan" for the amounts related to the six-month period ended June 30, 2016.
51
Three Months Ended | Six Months Ended | ||||||
June 30, 2015 | June 30, 2015 | ||||||
Operating loss — as reported | $ | (21,843 | ) | $ | (57,146 | ) | |
Reverse 2015 Restructuring Plan charges: | |||||||
Employee-related termination costs(1) | 560 | 5,147 | |||||
Relocation and other employee-related costs(2) | 1,885 | 3,381 | |||||
Accelerated depreciation and amortization charges(3) | 10,853 | 20,132 | |||||
Additional labor and other excess costs(4) | 7,591 | 24,100 | |||||
Total restructuring-related charges | 20,889 | 52,760 | |||||
Adjusted operating loss | $ | (954 | ) | $ | (4,386 | ) | |
Net loss attributable to DreamWorks Animation SKG, Inc. — as reported | $ | (38,583 | ) | $ | (93,360 | ) | |
Reverse 2015 Restructuring Plan charges: | |||||||
Employee-related termination costs(1) | 560 | 5,147 | |||||
Relocation and other employee-related costs(2) | 1,885 | 3,381 | |||||
Accelerated depreciation and amortization charges(3) | 10,853 | 20,132 | |||||
Additional labor and other excess costs(4) | 7,591 | 24,100 | |||||
Total restructuring-related charges | 20,889 | 52,760 | |||||
Tax impact(5) | 6,120 | 7,123 | |||||
Adjusted net loss attributable to DreamWorks Animation SKG, Inc. | $ | (11,574 | ) | $ | (33,477 | ) | |
Loss per share — as reported | $ | (0.45 | ) | $ | (1.09 | ) | |
Reverse 2015 Restructuring Plan charges: | |||||||
Employee-related termination costs(1) | 0.01 | 0.06 | |||||
Relocation and other employee-related costs(2) | 0.02 | 0.04 | |||||
Accelerated depreciation and amortization charges(3) | 0.13 | 0.23 | |||||
Additional labor and other excess costs(4) | 0.09 | 0.28 | |||||
Total restructuring-related charges | 0.25 | 0.61 | |||||
Tax impact(5) | 0.07 | 0.08 | |||||
Adjusted loss per share | $ | (0.13 | ) | $ | (0.40 | ) | |
____________________
(1) | Employee-related termination costs. Employee-related termination costs consist of severance and benefits (including stock-based compensation) attributable to employees that were terminated in connection with the 2015 Restructuring Plan. |
(2) | Relocation and other employee-related costs. Relocation and other employee-related costs primarily consist of costs to relocate employees from our Northern California facility to our Southern California facility. |
52
(3) | Accelerated depreciation and amortization charges. Accelerated depreciation and amortization charges consist of the incremental charges we incurred as a result of shortened estimated useful lives of certain property, plant and equipment due to the decision to exit our Northern California facility. |
(4) | Additional labor and other excess costs. Additional labor consists of costs related to excess staffing in order to execute the restructuring plans specifically related to changes in the feature film slate. These additional labor costs are incremental to our normal operating charges and are expensed as incurred. Other excess costs are those due to the closure of our Northern California facility which primarily relate to costs that we incurred to continue to operate the facility until we began earning amounts under sublease arrangements. |
(5) | Tax Impact. The tax impact of non-GAAP adjustments was calculated at the Company's combined effective tax rate of (29.3)% and (13.5)% for the three and six months ended June 30, 2015, respectively. |
ITEM 3. | QUANTITATIVE AND QUALITATIVE DISCLOSURES ABOUT MARKET RISK |
Market and Exchange Rate Risk
For quantitative and qualitative disclosures about our interest rate, foreign currency and credit risks, please see "Part II—Item 7A—Quantitative and Qualitative Disclosures About Market Risk," of our 2015 Form 10-K. Our exposure to interest rate, foreign currency and credit risks has not changed materially since December 31, 2015.
ITEM 4. | CONTROLS AND PROCEDURES |
(a) Evaluation of disclosure controls and procedures.
Our management, with the participation of our chief executive officer and chief financial officer, evaluated the effectiveness of our disclosure controls and procedures pursuant to Rule 13a-15 under the Securities Exchange Act of 1934, as amended, as of the end of the period covered by this Quarterly Report. In designing and evaluating the disclosure controls and procedures, management recognized that any controls and procedures, no matter how well designed and operated, can provide only reasonable assurance of achieving the desired control objectives, and management is required to apply its judgment in evaluating the cost-benefit relationship of possible controls and procedures.
Based on that evaluation, our chief executive officer and chief financial officer concluded that our disclosure controls and procedures were effective as of the end of the period covered by this Quarterly Report to provide reasonable assurance that information we are required to disclose in reports that we file or submit under the Securities Exchange Act of 1934, as amended, is accurately recorded, processed, summarized and reported within the time periods specified in SEC rules and forms, and that such information is accumulated and communicated to our management, including our chief executive officer and chief financial officer, as appropriate, to allow timely decisions regarding required disclosure.
(b) Changes in internal controls over financial reporting.
There were no changes in our internal control over financial reporting that occurred during the period covered by this Quarterly Report that have materially affected, or are reasonably likely to materially affect, our internal control over financial reporting.
PART II—OTHER INFORMATION
ITEM 1. | LEGAL PROCEEDINGS |
See discussion of Legal Proceedings in Note 16 to the unaudited consolidated financial statements contained in Part I, Item 1 of this Quarterly Report.
Investigation by the SEC. In May 2014, the Company learned that the Division of Enforcement of the U.S. Securities and Exchange Commission (the "SEC") was conducting an investigation into the writedown of film inventory relating to the Company's June 2013 feature film release, Turbo, and related matters. In July 2016, the Division of Enforcement notified the Company that it had concluded its investigation and did not intend to recommend an enforcement action by the SEC against the Company.
53
ITEM 1A. | RISK FACTORS |
Information concerning certain risks and uncertainties appears in "Part I—Item 1A—Risk Factors" of the Company's 2015 Form 10-K. Additionally, the risk factors pertaining to the pending acquisition of DreamWorks Animation by Comcast appears in "Part II—Item 1A—Risk Factors" of the Company's Quarterly Report on Form 10-Q for the period ended March 31, 2016 filed on May 6, 2016. For further details related to this pending acquisition, refer to Note 1 of our unaudited consolidated financial statements contained in "Part I—Item 1—Financial Statements" of this Quarterly Report on Form 10-Q. You should carefully consider these risks and uncertainties before making an investment decision with respect to shares of our Class A common stock. Such risks and uncertainties could materially adversely affect our business, financial condition or operating results.
During the period covered by this Quarterly Report, there have been no material changes from the risk factors previously disclosed in the Company's 2015 Form 10-K or filings subsequently made with the SEC.
ITEM 2. | UNREGISTERED SALES OF EQUITY SECURITIES AND USE OF PROCEEDS |
The following table shows Company repurchases of its Class A common stock for the three months ended June 30, 2016.
Total Number of Shares Purchased | Average Price Paid per Share | Total Number of Shares Purchased as Part of Publicly Announced Plan or Program(1) | Maximum Number (or Approximate Dollar Value) of Shares That May Yet Be Purchased Under the Plan or Program(1) | ||||||||||
April 1–April 30, 2016 | — | $ | — | — | $ | 100,000,000 | |||||||
May 1–May 31, 2016 | — | $ | — | — | $ | 100,000,000 | |||||||
June 1–June 30, 2016 | — | $ | — | — | $ | 100,000,000 | |||||||
Total | — | $ | — | — | |||||||||
____________________
(1) | In July 2010, the Company's Board of Directors authorized a stock repurchase program pursuant to which the Company may repurchase up to an aggregate of $150.0 million of its outstanding stock. |
ITEM 5. | OTHER INFORMATION |
None.
ITEM 6. | EXHIBITS |
Exhibit 31.1 | Certification of Chief Executive Officer Pursuant to Exchange Act Rule 13a-14(a) or 15d-14(a), as Adopted Pursuant to Section 302 of the Sarbanes-Oxley Act of 2002 |
Exhibit 31.2 | Certification of Chief Financial Officer Pursuant to Exchange Act Rule 13a-14(a) or 15d-14(a), as Adopted Pursuant to Section 302 of the Sarbanes-Oxley Act of 2002 |
Exhibit 32.1 | Certifications of Chief Executive Officer and Chief Financial Officer Pursuant to 18 U.S.C. Section 1350, as Adopted Pursuant to Section 906 of the Sarbanes-Oxley Act of 2002 |
Exhibit 101 | The following financial information from the Company's Quarterly Report on Form 10-Q for the quarter ended June 30, 2016 formatted in eXtensible Business Reporting Language: (i) Unaudited Consolidated Balance Sheets at June 30, 2016 and December 31, 2015; (ii) Unaudited Consolidated Statements of Operations for the three and six months ended June 30, 2016 and 2015; (iii) Unaudited Consolidated Statements of Comprehensive (Loss) Income for the three and six months ended June 30, 2016 and 2015; (iv) Unaudited Consolidated Statements of Cash Flows for the six months ended June 30, 2016 and 2015; and (v) Notes to the Unaudited Consolidated Financial Statements |
54
SIGNATURES
Pursuant to the requirements of the Securities Exchange Act of 1934, the Registrant has duly caused this report to be signed on its behalf by the undersigned thereunto duly authorized.
DREAMWORKS ANIMATION SKG, INC. | |||
Date: August 3, 2016 | By: | /S/ FAZAL MERCHANT | |
Name: | Fazal Merchant | ||
Title: | Chief Financial Officer | ||
(Principal Financial Officer and Duly Authorized Officer) | |||
55
EXHIBIT INDEX
Exhibit Number | Description |
31.1 | Certification of Chief Executive Officer Pursuant to Exchange Act Rule 13a-14(a) or 15d-14(a), as Adopted Pursuant to Section 302 of the Sarbanes-Oxley Act of 2002 |
31.2 | Certification of Chief Financial Officer Pursuant to Exchange Act Rule 13a-14(a) or 15d-14(a), as Adopted Pursuant to Section 302 of the Sarbanes-Oxley Act of 2002 |
32.1 | Certifications of Chief Executive Officer and Chief Financial Officer Pursuant to 18 U.S.C. Section 1350, as Adopted Pursuant to Section 906 of the Sarbanes-Oxley Act of 2002 |
101 | The following financial information from the Company's Quarterly Report on Form 10-Q for the quarter ended June 30, 2016 formatted in eXtensible Business Reporting Language: (i) Unaudited Consolidated Balance Sheets at June 30, 2016 and December 31, 2015; (ii) Unaudited Consolidated Statements of Operations for the three and six months ended June 30, 2016 and 2015; (iii) Unaudited Consolidated Statements of Comprehensive (Loss) Income for the three and six months ended June 30, 2016 and 2015; (iv) Unaudited Consolidated Statements of Cash Flows for the six months ended June 30, 2016 and 2015; and (v) Notes to the Unaudited Consolidated Financial Statements |
56