Attached files
| file | filename |
|---|---|
| EX-99.3 - EXHIBIT 99.3 - Zendesk, Inc. | a2016q2earningstweetsec1.htm |
| EX-99.1 - EXHIBIT 99.1 - Zendesk, Inc. | zen-ex991_7.htm |
| 8-K - 8-K - Zendesk, Inc. | zen_8-kxq2.htm |
Zendesk
August 02 2016
Second Quarter 2016 Shareholder Letter
Zendesk’s new responsive Help Center theme, “Copenhagen”
Exhibit 99.2
2Zendesk Shareholder Letter - August 02 2016
The strong second quarter results Zendesk reports today reflect solid revenue growth, year-over-year
improvement in operating margins, and neutral cash flow from operating activities—all while growing
a broader customer base of more than 81,000 paid customer accounts. During the quarter, we also
announced several new products, features, and capabilities important to our long-term strategy to have
a bigger impact in business initiatives beyond customer support.
Mikkel Svane
CEO
Elena Gomez
CFO
Marc Cabi
Investor Relations
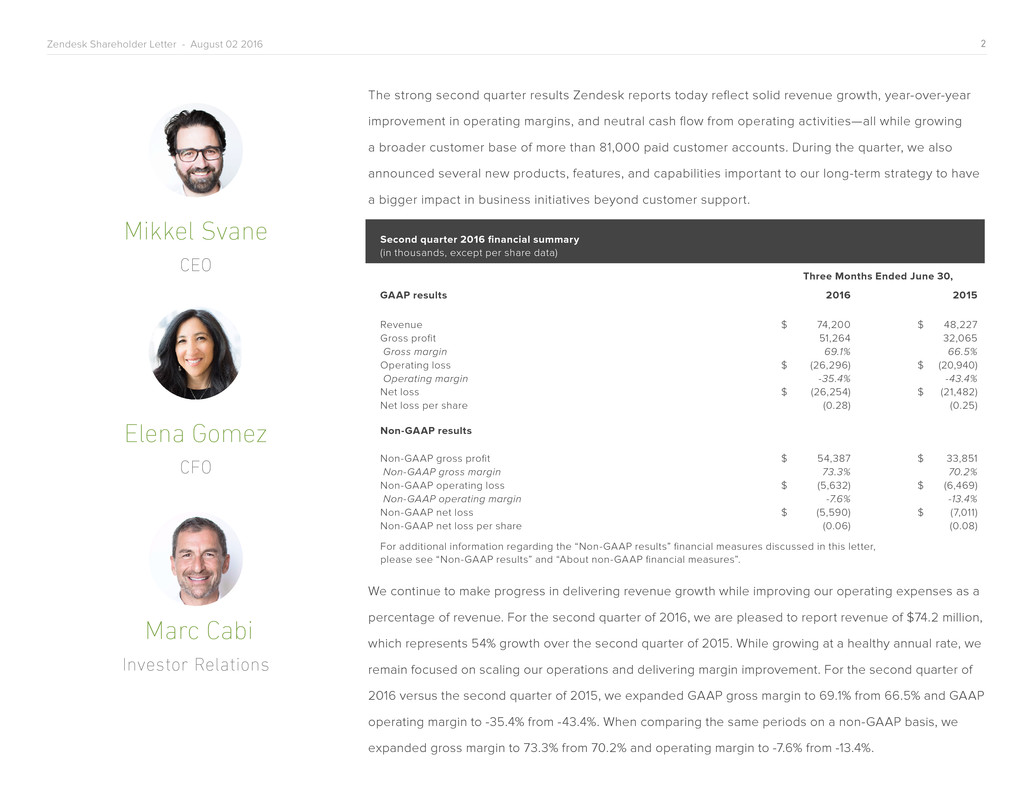
Second quarter 2016 financial summary
(in thousands, except per share data)
Three Months Ended June 30,
GAAP results 2016 2015
Revenue $ 74,200 $ 48,227
Gross profit 51,264 32,065
Gross margin 69.1% 66.5%
Operating loss $ (26,296) $ (20,940)
Operating margin -35.4% -43.4%
Net loss $ (26,254) $ (21,482)
Net loss per share (0.28) (0.25)
Non-GAAP results
Non-GAAP gross profit $ 54,387 $ 33,851
Non-GAAP gross margin 73.3% 70.2%
Non-GAAP operating loss $ (5,632) $ (6,469)
Non-GAAP operating margin -7.6% -13.4%
Non-GAAP net loss $ (5,590) $ (7,011)
Non-GAAP net loss per share (0.06) (0.08)
For additional information regarding the “Non-GAAP results” financial measures discussed in this letter,
please see “Non-GAAP results” and “About non-GAAP financial measures”.
We continue to make progress in delivering revenue growth while improving our operating expenses as a
percentage of revenue. For the second quarter of 2016, we are pleased to report revenue of $74.2 million,
which represents 54% growth over the second quarter of 2015. While growing at a healthy annual rate, we
remain focused on scaling our operations and delivering margin improvement. For the second quarter of
2016 versus the second quarter of 2015, we expanded GAAP gross margin to 69.1% from 66.5% and GAAP
operating margin to -35.4% from -43.4%. When comparing the same periods on a non-GAAP basis, we
expanded gross margin to 73.3% from 70.2% and operating margin to -7.6% from -13.4%.
3Zendesk Shareholder Letter - August 02 2016
Introduction
Almost ten years ago, three friends in Denmark began rethinking customer
service software and started Zendesk against the backdrop of the dramatic
rise in cloud-based software, mobile technologies, and social networking.
The original Zendesk was specifically designed to address the ever-evolving
changes taking place in the marketplace.
Today, the frontiers have shifted yet again, and we are watching as our
customers embrace a new round of innovations such as artificial intelligence
and entirely new messaging and social platforms. As consumers adopt these
new channels and technologies with vigor, their expectations quickly change.
As flexible as ever, Zendesk can easily scale and adapt to meet these
evolving expectations and emerging business needs and growth. We have
helped newly signed customers scale to handle more than a million tickets
in a matter of weeks, while helping businesses move beyond transactional
relationships to develop meaningful, long-term relationships with their customers.
Our strategy for this year reflects the fast pace of change in the relationships
between organizations and their customers. We’re focused on improving
those relationships and moving into the broader space beyond traditional
support. We have developed a brand that is recognized for its ability to
innovate to stay ahead of trends, and recent product additions such as
Satisfaction Prediction, Advanced Voice, SMS, and Zendesk Message give
our customers even more powerful tools to stay competitive in the face of
constant change.
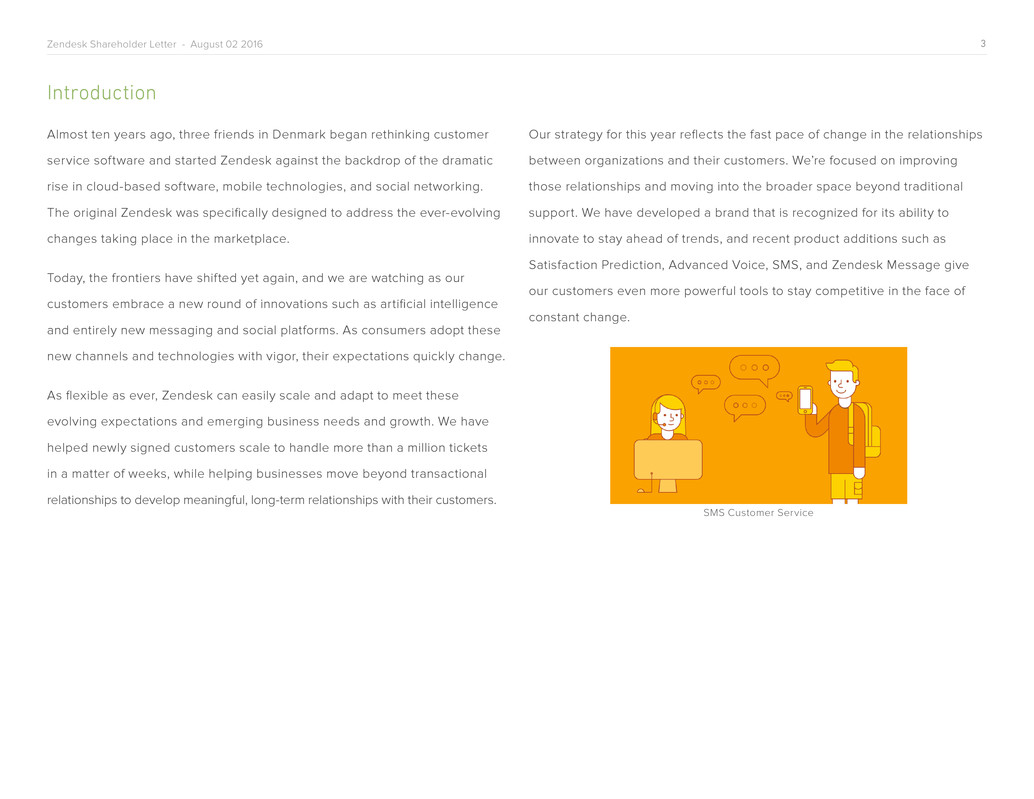
SMS Customer Service
4Zendesk Shareholder Letter - August 02 2016
In the second quarter of 2016 and more recently, we continued strong
progress in our three key strategic areas: elevating our brand, becoming
a multi-product company, and expanding our opportunity in the
mid-market and enterprise.
Elevate our brand
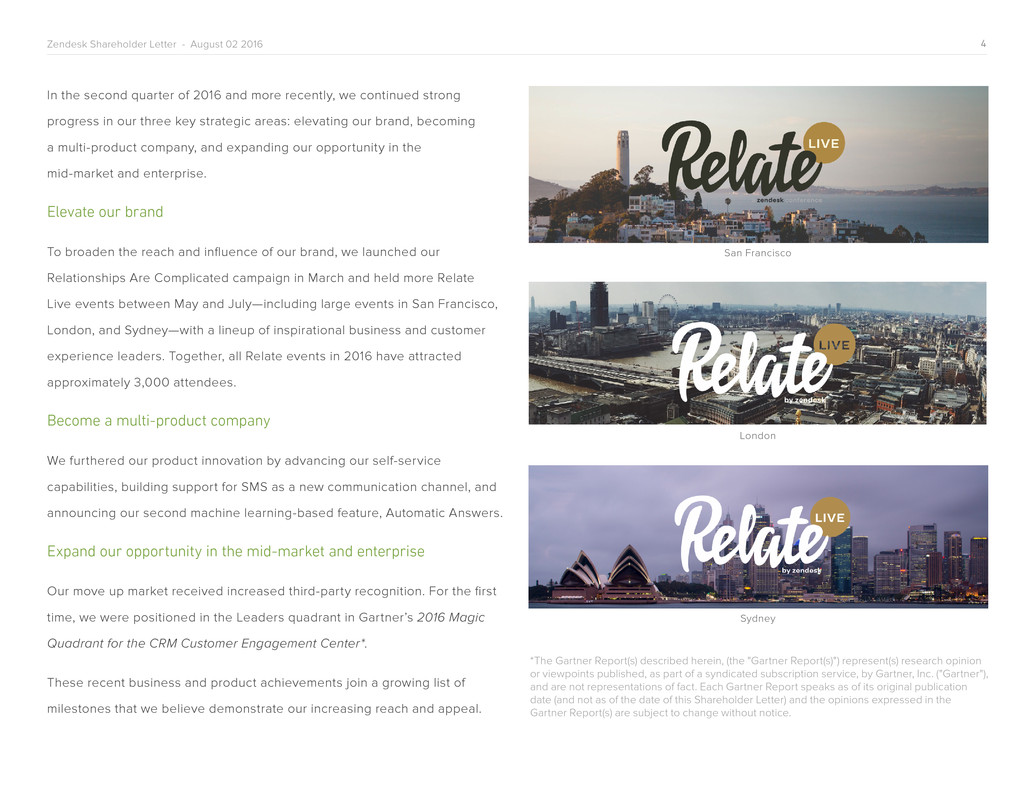
To broaden the reach and influence of our brand, we launched our
Relationships Are Complicated campaign in March and held more Relate
Live events between May and July—including large events in San Francisco,
London, and Sydney—with a lineup of inspirational business and customer
experience leaders. Together, all Relate events in 2016 have attracted
approximately 3,000 attendees.
Become a multi-product company
We furthered our product innovation by advancing our self-service
capabilities, building support for SMS as a new communication channel, and
announcing our second machine learning-based feature, Automatic Answers.
Expand our opportunity in the mid-market and enterprise
Our move up market received increased third-party recognition. For the first
time, we were positioned in the Leaders quadrant in Gartner’s 2016 Magic
Quadrant for the CRM Customer Engagement Center*.
These recent business and product achievements join a growing list of
milestones that we believe demonstrate our increasing reach and appeal.
*The Gartner Report(s) described herein, (the "Gartner Report(s)") represent(s) research opinion
or viewpoints published, as part of a syndicated subscription service, by Gartner, Inc. ("Gartner"),
and are not representations of fact. Each Gartner Report speaks as of its original publication
date (and not as of the date of this Shareholder Letter) and the opinions expressed in the
Gartner Report(s) are subject to change without notice.
San Francisco
London
Sydney
5Zendesk Shareholder Letter - August 02 2016
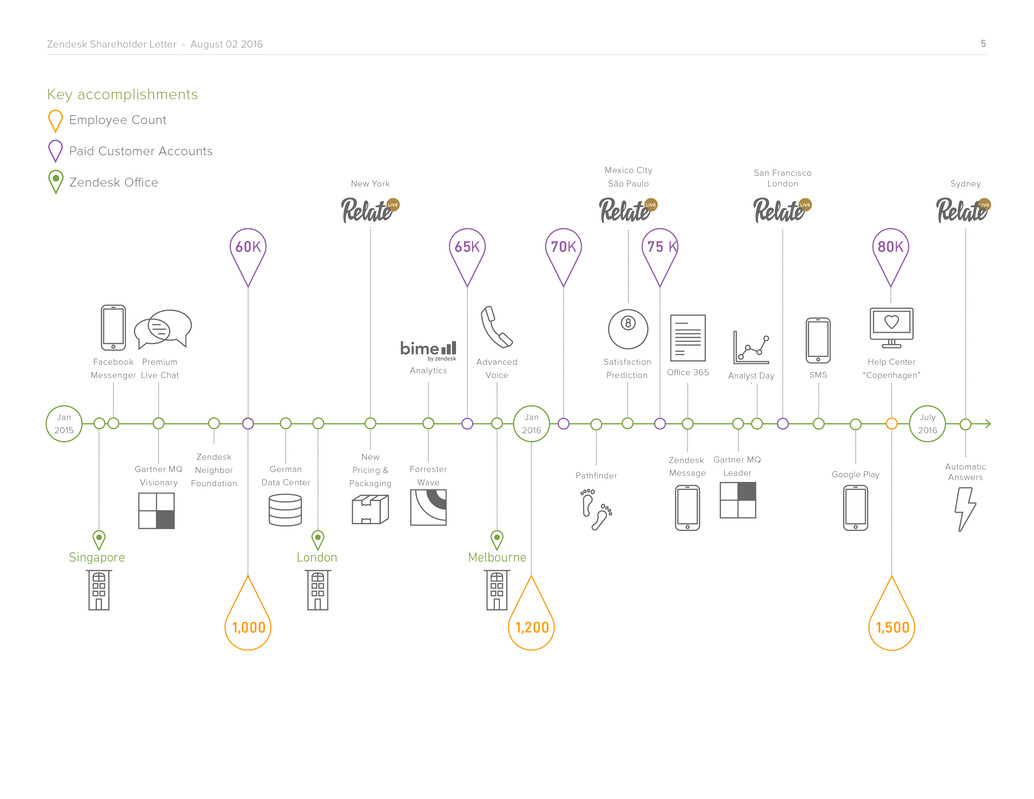
Key accomplishments
Employee Count
Paid Customer Accounts
Zendesk Office
Jan
2015
Zendesk
Neighbor
Foundation
German
Data Center
Facebook
Messenger
Analyst Day
Zendesk
Message
Analytics
Gartner MQ
Visionary
Forrester
Wave
Pathfinder
Gartner MQ
Leader
Automatic
Answers
65K 75 K 80K
New Yo rk
London
Advanc ed
Vo ice
Singapore
1, 000
July
2016
New
Pricin g &
Packaging
1, 500
70K
Mexico City
São Paulo
Satisfaction
Prediction
San Francisco
London Sydney
1, 200
Jan
2016
60K
Melbourne
Premium
Live Chat SMS
Google Play
Help Center
“Copenhagen”Of_f_ice 365
6Zendesk Shareholder Letter - August 02 2016
Brand Investment
Broadening our brand awareness and appeal is a
major focus as we seek to build on our customer
service foundation to more broadly address the
entire customer relationship with our products.
A key initiative in this area is the Relate brand
we launched late last year. Relate serves as an
online publication and event series that inspires
and educates customer service and experience
leaders while exposing them to Zendesk.
We held our latest Relate Live events in San
Francisco, London, and Sydney, and the Relate
website crossed a milestone of 50,000 monthly
unique visitors in June. We also launched Relate
Education, a new content channel on the site
focused on leadership guides, video resources,
and educational material for customer service
and experience managers.
Relate is also a natural platform for sharing our
vision of better customer relationships. The
event content closely tracked to the three big
trends we believe are fundamentally reshaping
customer relationships:
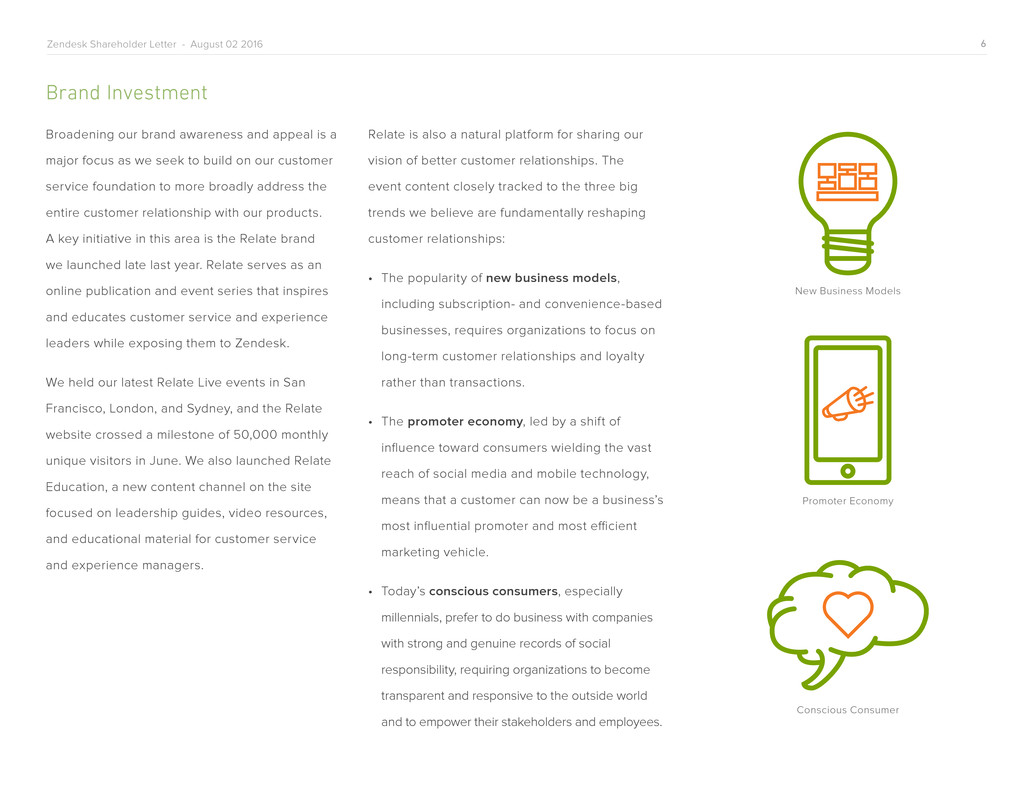
• The popularity of new business models,
including subscription- and convenience-based
businesses, requires organizations to focus on
long-term customer relationships and loyalty
rather than transactions.
• The promoter economy, led by a shift of
influence toward consumers wielding the vast
reach of social media and mobile technology,
means that a customer can now be a business’s
most influential promoter and most efficient
marketing vehicle.
• Today’s conscious consumers, especially
millennials, prefer to do business with companies
with strong and genuine records of social
responsibility, requiring organizations to become
transparent and responsive to the outside world
and to empower their stakeholders and employees.
Conscious Consumer
Promoter Economy
New Business Models
7Zendesk Shareholder Letter - August 02 2016
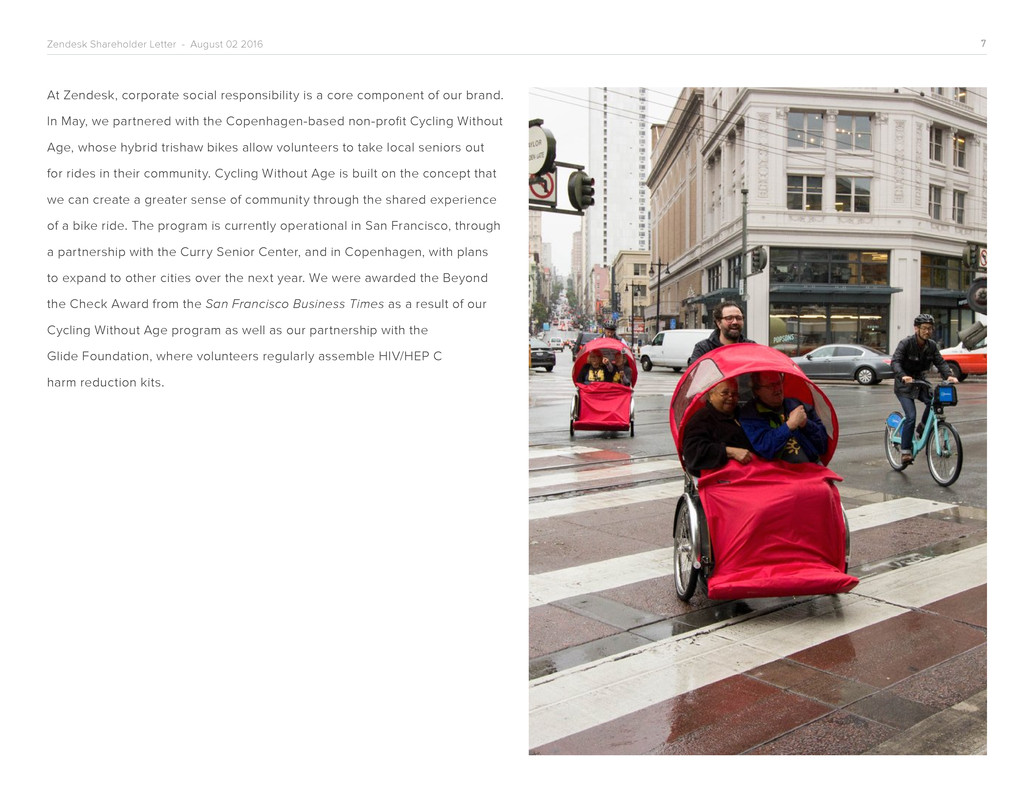
At Zendesk, corporate social responsibility is a core component of our brand.
In May, we partnered with the Copenhagen-based non-profit Cycling Without
Age, whose hybrid trishaw bikes allow volunteers to take local seniors out
for rides in their community. Cycling Without Age is built on the concept that
we can create a greater sense of community through the shared experience
of a bike ride. The program is currently operational in San Francisco, through
a partnership with the Curry Senior Center, and in Copenhagen, with plans
to expand to other cities over the next year. We were awarded the Beyond
the Check Award from the San Francisco Business Times as a result of our
Cycling Without Age program as well as our partnership with the
Glide Foundation, where volunteers regularly assemble HIV/HEP C
harm reduction kits.
8Zendesk Shareholder Letter - August 02 2016
Product Initiatives
As we move to become a multi-product company,
we also continue to invest in product innovations
that apply machine learning and artificial
intelligence to customer relationships, address
emerging consumer communication channels, and
advance self-service.
• We announced our second machine learning-
based feature, Automatic Answers. Available
in an early access program, it automatically
responds to customer inquiries with relevant
knowledge base articles, helping resolve
inquiries before they ever reach an agent.
• We introduced SMS as a native channel for
support (now available in early access) so
businesses globally can receive and respond to
customer text messages within Zendesk.
• Delivering self-service through our Help Center
product is a core customer service strategy
among our customers, and in the second
quarter of 2016 we launched a series of
self-service advancements. We introduced
profiles in Help Center that allow community
members to share relevant information about
themselves and to showcase their recent
activity and contributions. We also launched a
new design theme, named “Copenhagen,” built
from the ground up to be responsive across a
wide range of devices.
• The power of cloud computing is transforming
the infrastructure of business communications,
as evidenced by the success of companies
like Twilio, creating opportunities to disrupt
the market for call center software that has
historically relied on legacy architectures.
Twilio is the technology that powers Zendesk
Voice, which continues to gain traction with
greater penetration of our installed base and
more agents per Advanced Voice customer on
average than in the first quarter of 2016. For
the second quarter of 2016, our quarter-over-
quarter overall Voice subscription revenue
growth rate was the highest of all our products.
AUTOMATIC ANSWERS
The magic of
automatic
Conscious Consumer
9Zendesk Shareholder Letter - August 02 2016
Moving Up Market
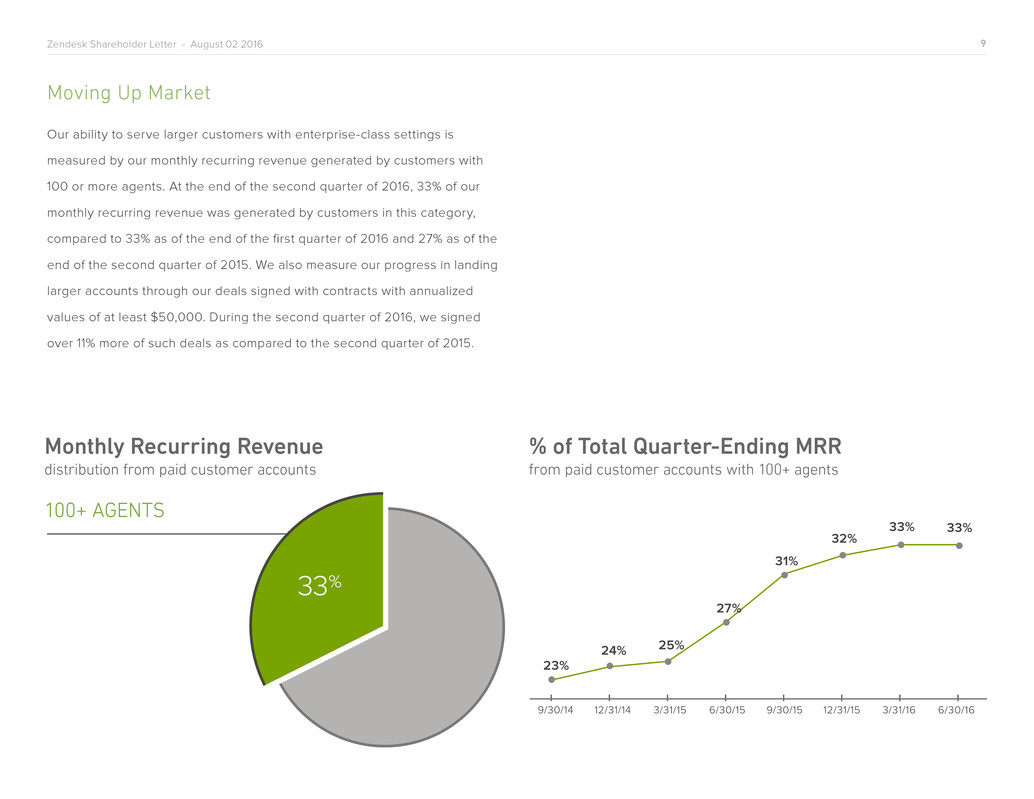
Our ability to serve larger customers with enterprise-class settings is
measured by our monthly recurring revenue generated by customers with
100 or more agents. At the end of the second quarter of 2016, 33% of our
monthly recurring revenue was generated by customers in this category,
compared to 33% as of the end of the first quarter of 2016 and 27% as of the
end of the second quarter of 2015. We also measure our progress in landing
larger accounts through our deals signed with contracts with annualized
values of at least $50,000. During the second quarter of 2016, we signed
over 11% more of such deals as compared to the second quarter of 2015.
% of Total Quarter-Ending MRR
from paid customer accounts with 100+ agents
Monthly Recurring Revenue
distribution from paid customer accounts
100+ AGENTS
33%
10Zendesk Shareholder Letter - August 02 2016
Our movement up market into the mid-market and enterprise space has
garnered increased attention from industry analysts. Zendesk was positioned
in the Leaders quadrant in Gartner's May 2016 Magic Quadrant for the CRM
Customer Engagement Center*. We were also the fastest-growing among
the top 20 CRM vendors, based on Gartner’s 2015 CRM software revenue
worldwide for respective players in its May 2016 Market Share Analysis:
Customer Relationship Management Software, Worldwide, 2015 report.
Customers
Notable success stories from our customers in the second quarter of 2016
include an ROI award for our customer Trustpilot, an international provider
of user-generated reviews of online businesses since 2007. Trustpilot
established an international support desk that was scalable, accommodated
multiple languages, and supported the company’s continued growth. Agents
can now switch easily between live chat, voice, and email. In June, Trustpilot
was selected from more than 200 nominations as a winner of the Nucleus
Research 2016 ROI Awards. The company’s selection was based on its
support team’s implementation of Zendesk and the 1,272% ROI that Trustpilot
realized with the project, as assessed by the Nucleus analyst team.
Other noteworthy customers that recently joined us or expanded with us include:
• Venmo, the popular mobile payment service
• DoorDash, delivering food from your favorite restaurants
• Vimeo, the video-sharing website with more than 170 million worldwide viewers
• WNYC, New York’s flagship public radio station
• Colorado State University - Global Campus, America’s first independent
100% online state university
• Bleacher Report, a popular digital media company covering sports news
• Procura, a provider of innovative healthcare information technology solutions
*Gartner does not endorse any vendor, product or service depicted in its research publications,
and does not advise technology users to select only those vendors with the highest ratings or other
designation. Gartner research publications consist of the opinions of Gartner's research organization
and should not be construed as statements of fact. Gartner disclaims all warranties, expressed or
implied, with respect to this research, including any warranties of merchantability or fitness for a
particular purpose.
11Zendesk Shareholder Letter - August 02 2016
Partnerships
Our efforts to build partnerships with leading Internet and software platforms
are an important part of our strategy for extending Zendesk into new
channels and use cases within companies. Building on previously announced
product integrations, in the second quarter of 2016 we invested in our
relationship with Google across several of their properties, notably Google
for Work and Google Play Store.
In June, Google for Work selected Zendesk as a ‘New & Notable’ app in the
Google Apps Marketplace. The selection was prompted by upgrades that
enable businesses to easily set up a new Zendesk account and quickly add
agents and admins from their Google directory. With more than two million
businesses using Google for Work, our inclusion helped drive new Zendesk
customers and trials for our low-touch, online sales model.
Separately, we announced in May an integration allowing Zendesk customers
to automatically convert Google Play Store reviews into support tickets
when the review contains customer service issues requiring assistance.
Some of our most innovative customers participated in the beta, including
game developer Halfbrick, investment platform Robinhood, and project
management software company Wrike. In the first two months, more than
300 customers integrated their Zendesk platform with Google Play, bringing
a total of more than 440,000 reviews into Zendesk as tickets.
Infrastructure
Cloud infrastructure solutions like Amazon Web Services (AWS) offer Zendesk
solid performance, flexibility, and scale. Earlier this year we launched our first
service on AWS to serve Asia, which proved to be effective and scalable to
suit our needs. Based on our experience in Asia, we accelerated our plans to
use cloud infrastructure solutions in conjunction with our investment in our
colocation data centers. Specifically, during the second half of this year, we
plan to expand our use of cloud infrastructure solutions to serve customers
in the Americas.
Financials
We are pleased to report strong second quarter 2016 results as we deliver
on our mission to achieve solid growth and operating performance versus
our prior year results.
For the second quarter of 2016, we reported revenue of $74.2 million, which
represents growth of 54% over the second quarter of 2015. During the
quarter, we saw good revenue growth across all regions. As is typical during
the first half of the year, we saw strong performance in sales to SMBs and
departments within larger organizations. During the quarter, revenue from our
newer products, namely Voice and Chat, continued to grow at high rates from
a smaller base. Over the year, we will continue to invest in our expanded
multi-product strategy, building a foundation for success. We expect revenue
from these new products to grow and contribute more meaningfully to our
overall results over future quarters.
12Zendesk Shareholder Letter - August 02 2016
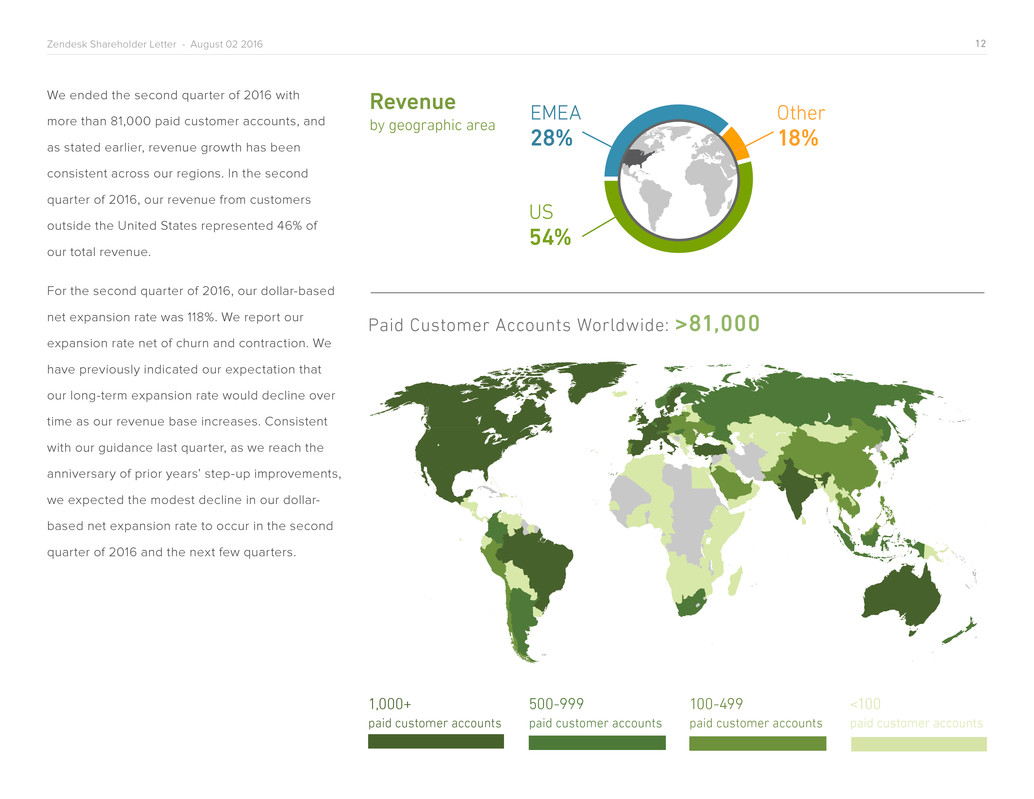
We ended the second quarter of 2016 with
more than 81,000 paid customer accounts, and
as stated earlier, revenue growth has been
consistent across our regions. In the second
quarter of 2016, our revenue from customers
outside the United States represented 46% of
our total revenue.
For the second quarter of 2016, our dollar-based
net expansion rate was 118%. We report our
expansion rate net of churn and contraction. We
have previously indicated our expectation that
our long-term expansion rate would decline over
time as our revenue base increases. Consistent
with our guidance last quarter, as we reach the
anniversary of prior years’ step-up improvements,
we expected the modest decline in our dollar-
based net expansion rate to occur in the second
quarter of 2016 and the next few quarters.
Paid Customer Accounts Worldwide: >81,000
1,000+
paid customer accounts
500-999
paid customer accounts
100-499
paid customer accounts
<100
paid customer accounts
EMEA
28%
Other
18%
US
54%
Revenue
by geographic area
13Zendesk Shareholder Letter - August 02 2016
Financial Measures and Cash Flow
Our mission to demonstrate scale through year-over-year margin
improvement continued during the second quarter of 2016. During this
quarter, we achieved gross margin expansion based primarily on more
efficient use of our data center capacity. GAAP gross margin increased to
69.1% in the second quarter of 2016 compared to 68.6% in the first quarter
of 2016. GAAP gross margin in the second quarter of 2015 was 66.5%.
Non-GAAP gross margin increased to 73.3% in the second quarter of 2016
compared to 73.0% in the first quarter of 2016. Non-GAAP gross margin in
the second quarter of 2015 was 70.2%.
GAAP operating loss for the second quarter of 2016 was $26.3 million
compared to GAAP operating loss for the first quarter of 2016 of $26.7
million. GAAP operating loss for the second quarter of 2015 was $20.9
million. Non-GAAP operating loss for the second quarter of 2016 was $5.6
million, which was better than our outlook for the quarter, and compares to
non-GAAP operating loss for the first quarter of 2016 of $6.8 million. Non-
GAAP operating loss for the second quarter of 2015 was $6.5 million.
Our GAAP operating margin improvement is attributed to overall productivity
gains in sales and marketing and administrative costs, including better
utilization of our office space. GAAP operating margin improved to -35.4%
in the second quarter of 2016 from -39.0% in the first quarter of 2016 and
-43.4% in the second quarter of 2015. Non-GAAP operating margin improved
to -7.6% in the second quarter of 2016 from -9.9% in the first quarter of 2016
and -13.4% in the second quarter of 2015.
Our GAAP net loss was $26.3 million or $0.28 per share for the second
quarter of 2016 compared to GAAP net loss of $27.2 million or $0.30 per
share for the first quarter of 2016. GAAP net loss was $21.5 million and $0.25
per share for the second quarter of 2015.
Our non-GAAP net loss was $5.6 million or $0.06 per share for the second
quarter of 2016 compared to non-GAAP net loss of $7.3 million or $0.08 per
share for the first quarter of 2016. Non-GAAP net loss was $7.0 million or
$0.08 per share for the second quarter of 2015. Weighted average shares
used to compute both GAAP and non-GAAP net loss per share for the
second quarter of 2016 was 92.2 million.
Non-GAAP results for the second quarter of 2016 exclude $19.7 million in
share-based compensation and related expenses (including $0.7 million
of employer tax related to employee stock transactions and $0.4 million of
amortized share-based compensation capitalized in internal-use software)
and $1.0 million of amortization of purchased intangibles. Non-GAAP
results for the first quarter of 2016 exclude $19.0 million in share-based
compensation and related expenses (including $0.8 million of employer tax
related to employee stock transactions and $0.5 million of amortized share-
based compensation capitalized in internal-use software) and $0.9 million
of amortization of purchased intangibles. Non-GAAP results for the second
quarter of 2015 exclude $14.0 million in share-based compensation and
related expenses (including $0.4 million of employer tax related to employee
stock transactions and $0.3 million of amortized share-based compensation
capitalized in internal-use software) and $0.4 million of amortization of
purchased intangibles.
During the second quarter of 2016, net cash from operating activities was
-$0.03 million. We ended the second quarter of 2016 with $118.0 million of
cash and equivalents, and we had an additional $106.1 million of short-term
marketable securities.
14Zendesk Shareholder Letter - August 02 2016
Guidance
Our traditional online, low-touch business continues to grow at a natural
and highly predictable pace. At the same time, we enter the second half of
2016 with a growing pipeline of new and larger prospective customers and
opportunities. The evolution of our core product to meet mid-market and
enterprise customers’ needs, new features and product introductions, and
our brand awareness campaigns have provided us a foundation upon which
we believe we can capitalize on these larger opportunities in the second
half of 2016 and in 2017. We’re also very excited by the immediate impact our
new leaders have had on helping us to understand the different dynamics
of this segment of our business and setting up the company to execute
on this strategy. Our financial guidance for the remainder of 2016 reflects
the fact that many of our nascent go-to-market strategies to capitalize on
these opportunities are gaining ground. We are confident that our long-term
success in this segment will fuel a continued healthy revenue growth rate.
For the third quarter of 2016, we expect revenue to range between $78.0
and $80.0 million, and we expect our GAAP operating loss to range between
$27.4 and $28.4 million. We expect our non-GAAP operating loss for the
third quarter of 2016 to range between $5.5 and $6.5 million. Our GAAP
operating loss for the third quarter of 2016 is estimated to include share-
based compensation and related expenses of approximately $20.9 million
and amortization of purchased intangibles of approximately $1.0 million.
For the full year of 2016, we expect revenue to range between $307.0
and $311.0 million. We expect our GAAP operating loss for the full year of
2016 to range between $108.9 and $110.9 million, and we expect our non-
GAAP operating loss to range between $21.0 and $23.0 million. Our GAAP
operating loss for the full year of 2016 is estimated to include share-based
compensation and related expenses of approximately $84.1 million and
amortization of purchased intangibles of approximately $3.8 million.
The timing of our data center investments and our decision to supplement
our colocated data center investments with the use of cloud infrastructure
solutions may impact the allocation of cash flows between cash flows from
operations and cash used for investing activities. We currently estimate our
net cash from operating activities for the third and fourth quarter of 2016 to
be positive.
We continue to target to be free cash flow positive for the full year 2017.
This target regarding free cash flow includes cash used for purchases of
property and equipment and internal-use software development costs. We
have not reconciled free cash flow guidance to net cash from operating
activities for this future period because we do not provide guidance on the
reconciling items between net cash from operating activities and free cash
flow, as a result of the uncertainty regarding, and the potential variability
of, these items. The actual amount of such reconciling items will have a
significant impact on our free cash flow and, accordingly, a reconciliation
of net cash from operating activities to free cash flow for the period is not
available without unreasonable effort.
Finally, we estimate we will have approximately 93.8 million weighted
average shares outstanding for the third quarter of 2016 and 93.0 million
weighted average shares outstanding for the full year of 2016, each based
only on current shares outstanding and anticipated activity associated with
equity incentive plans.
15Zendesk Shareholder Letter - August 02 2016
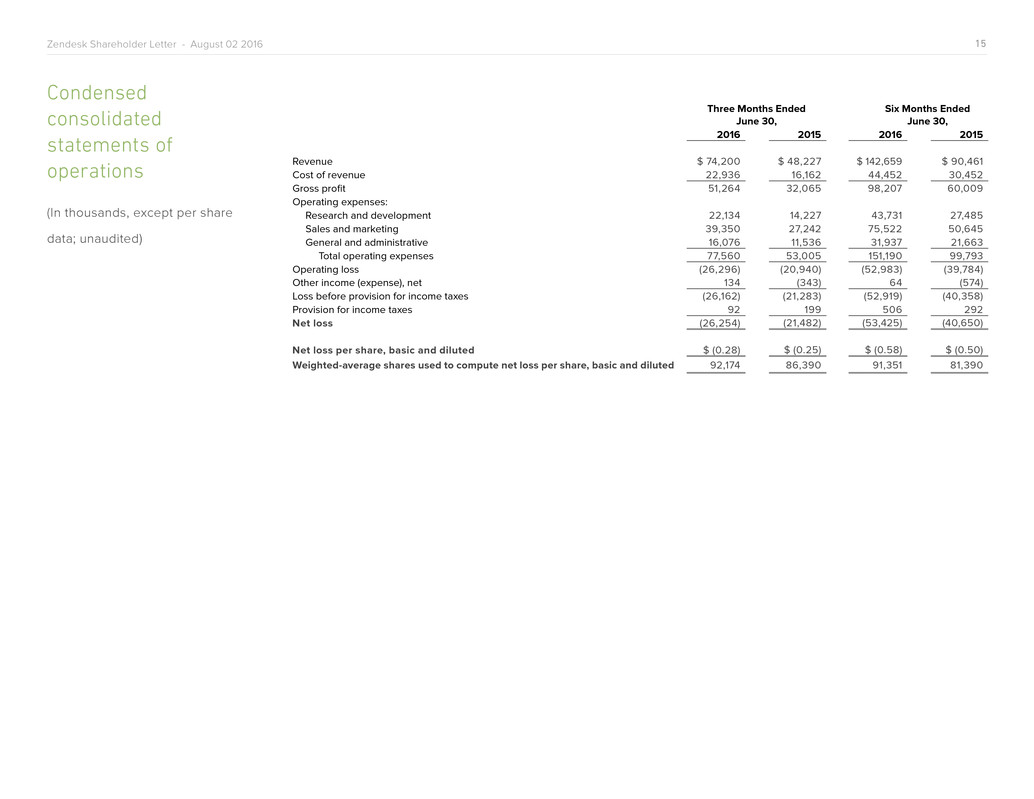
Condensed
consolidated
statements of
operations
(In thousands, except per share
data; unaudited)
Three Months Ended
June 30,
Six Months Ended
June 30,
2016 2015 2016 2015
Revenue $ 74,200 $ 48,227 $ 142,659 $ 90,461
Cost of revenue 22,936 16,162 44,452 30,452
Gross profit 51,264 32,065 98,207 60,009
Operating expenses:
Research and development 22,134 14,227 43,731 27,485
Sales and marketing 39,350 27,242 75,522 50,645
General and administrative 16,076 11,536 31,937 21,663
Total operating expenses 77,560 53,005 151,190 99,793
Operating loss (26,296) (20,940) (52,983) (39,784)
Other income (expense), net 134 (343) 64 (574)
Loss before provision for income taxes (26,162) (21,283) (52,919) (40,358)
Provision for income taxes 92 199 506 292
Net loss (26,254) (21,482) (53,425) (40,650)
Net loss per share, basic and diluted $ (0.28) $ (0.25) $ (0.58) $ (0.50)
Weighted-average shares used to compute net loss per share, basic and diluted 92,174 86,390 91,351 81,390
16Zendesk Shareholder Letter - August 02 2016
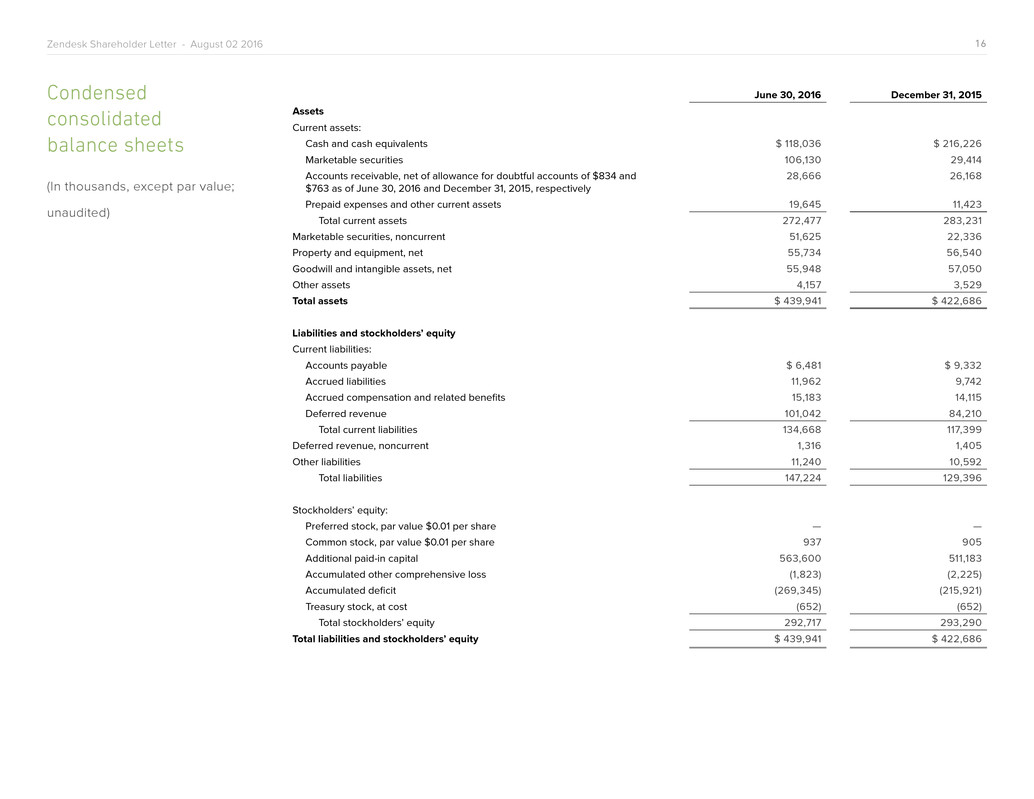
June 30, 2016 December 31, 2015
Assets
Current assets:
Cash and cash equivalents $ 118,036 $ 216,226
Marketable securities 106,130 29,414
Accounts receivable, net of allowance for doubtful accounts of $834 and
$763 as of June 30, 2016 and December 31, 2015, respectively
28,666 26,168
Prepaid expenses and other current assets 19,645 11,423
Total current assets 272,477 283,231
Marketable securities, noncurrent 51,625 22,336
Property and equipment, net 55,734 56,540
Goodwill and intangible assets, net 55,948 57,050
Other assets 4,157 3,529
Total assets $ 439,941 $ 422,686
Liabilities and stockholders’ equity
Current liabilities:
Accounts payable $ 6,481 $ 9,332
Accrued liabilities 11,962 9,742
Accrued compensation and related benefits 15,183 14,115
Deferred revenue 101,042 84,210
Total current liabilities 134,668 117,399
Deferred revenue, noncurrent 1,316 1,405
Other liabilities 11,240 10,592
Total liabilities 147,224 129,396
Stockholders’ equity:
Preferred stock, par value $0.01 per share — —
Common stock, par value $0.01 per share 937 905
Additional paid-in capital 563,600 511,183
Accumulated other comprehensive loss (1,823) (2,225)
Accumulated deficit (269,345) (215,921)
Treasury stock, at cost (652) (652)
Total stockholders’ equity 292,717 293,290
Total liabilities and stockholders’ equity $ 439,941 $ 422,686
Condensed
consolidated
balance sheets
(In thousands, except par value;
unaudited)
17Zendesk Shareholder Letter - August 02 2016
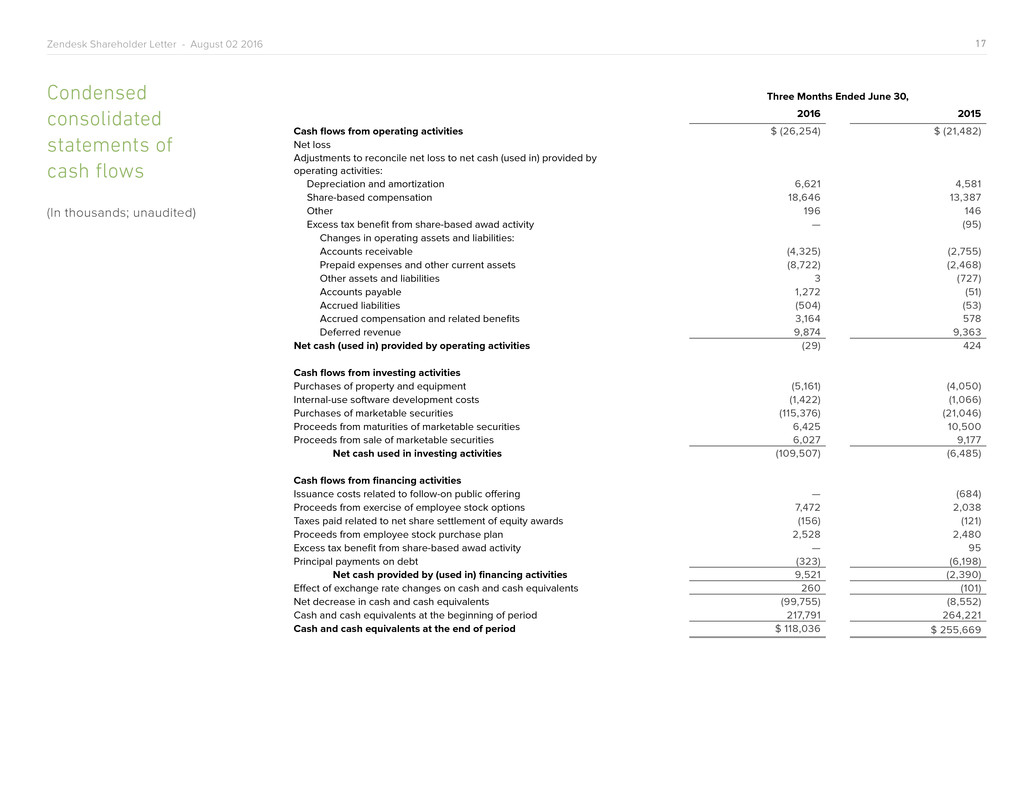
Condensed
consolidated
statements of
cash flows
(In thousands; unaudited)
Three Months Ended June 30,
2016 2015
Cash flows from operating activities $ (26,254) $ (21,482)
Net loss
Adjustments to reconcile net loss to net cash (used in) provided by
operating activities:
Depreciation and amortization 6,621 4,581
Share-based compensation 18,646 13,387
Other 196 146
Excess tax benefit from share-based awad activity — (95)
Changes in operating assets and liabilities:
Accounts receivable (4,325) (2,755)
Prepaid expenses and other current assets (8,722) (2,468)
Other assets and liabilities 3 (727)
Accounts payable 1,272 (51)
Accrued liabilities (504) (53)
Accrued compensation and related benefits 3,164 578
Deferred revenue 9,874 9,363
Net cash (used in) provided by operating activities (29) 424
Cash flows from investing activities
Purchases of property and equipment (5,161) (4,050)
Internal-use software development costs (1,422) (1,066)
Purchases of marketable securities (115,376) (21,046)
Proceeds from maturities of marketable securities 6,425 10,500
Proceeds from sale of marketable securities 6,027 9,177
Net cash used in investing activities (109,507) (6,485)
Cash flows from financing activities
Issuance costs related to follow-on public offering — (684)
Proceeds from exercise of employee stock options 7,472 2,038
Taxes paid related to net share settlement of equity awards (156) (121)
Proceeds from employee stock purchase plan 2,528 2,480
Excess tax benefit from share-based awad activity — 95
Principal payments on debt (323) (6,198)
Net cash provided by (used in) financing activities 9,521 (2,390)
Effect of exchange rate changes on cash and cash equivalents 260 (101)
Net decrease in cash and cash equivalents (99,755) (8,552)
Cash and cash equivalents at the beginning of period 217,791 264,221
Cash and cash equivalents at the end of period $ 118,036 $ 255,669
18Zendesk Shareholder Letter - August 02 2016
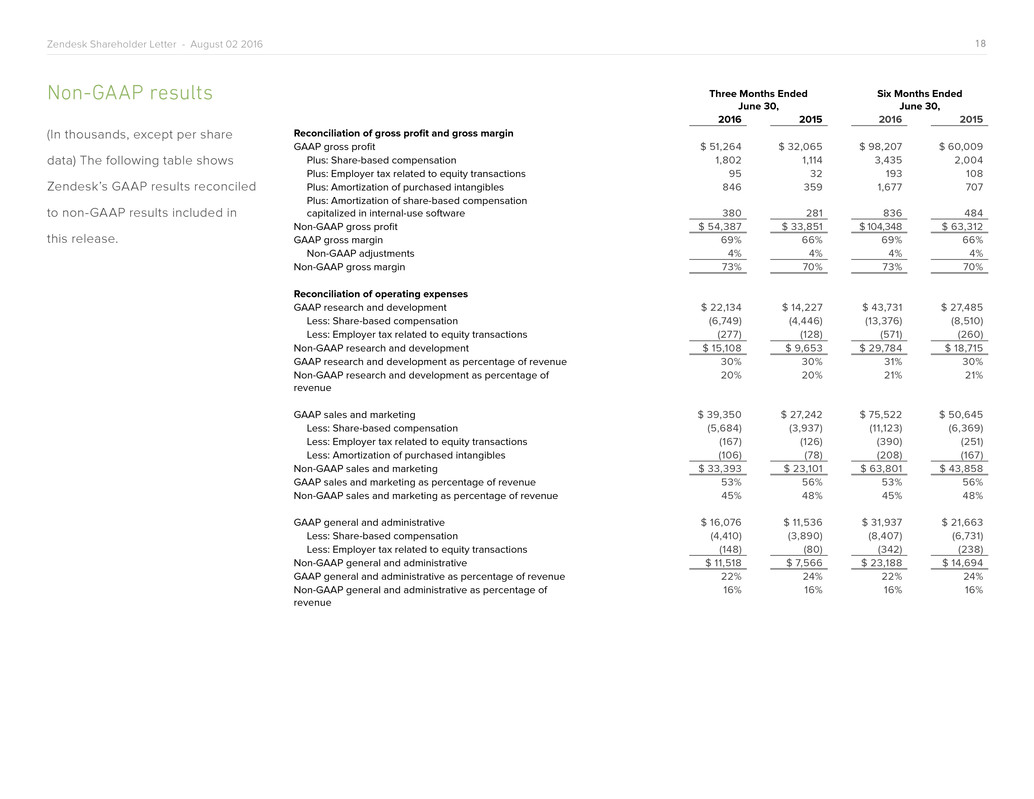
Non-GAAP results
(In thousands, except per share
data) The following table shows
Zendesk’s GAAP results reconciled
to non-GAAP results included in
this release.
Three Months Ended
June 30,
Six Months Ended
June 30,
2016 2015 2016 2015
Reconciliation of gross profit and gross margin
GAAP gross profit $ 51,264 $ 32,065 $ 98,207 $ 60,009
Plus: Share-based compensation 1,802 1,114 3,435 2,004
Plus: Employer tax related to equity transactions 95 32 193 108
Plus: Amortization of purchased intangibles 846 359 1,677 707
Plus: Amortization of share-based compensation
capitalized in internal-use software 380 281 836 484
Non-GAAP gross profit $ 54,387 $ 33,851 $ 104,348 $ 63,312
GAAP gross margin 69% 66% 69% 66%
Non-GAAP adjustments 4% 4% 4% 4%
Non-GAAP gross margin 73% 70% 73% 70%
Reconciliation of operating expenses
GAAP research and development $ 22,134 $ 14,227 $ 43,731 $ 27,485
Less: Share-based compensation (6,749) (4,446) (13,376) (8,510)
Less: Employer tax related to equity transactions (277) (128) (571) (260)
Non-GAAP research and development $ 15,108 $ 9,653 $ 29,784 $ 18,715
GAAP research and development as percentage of revenue 30% 30% 31% 30%
Non-GAAP research and development as percentage of
revenue
20% 20% 21% 21%
GAAP sales and marketing $ 39,350 $ 27,242 $ 75,522 $ 50,645
Less: Share-based compensation (5,684) (3,937) (11,123) (6,369)
Less: Employer tax related to equity transactions (167) (126) (390) (251)
Less: Amortization of purchased intangibles (106) (78) (208) (167)
Non-GAAP sales and marketing $ 33,393 $ 23,101 $ 63,801 $ 43,858
GAAP sales and marketing as percentage of revenue 53% 56% 53% 56%
Non-GAAP sales and marketing as percentage of revenue 45% 48% 45% 48%
GAAP general and administrative $ 16,076 $ 11,536 $ 31,937 $ 21,663
Less: Share-based compensation (4,410) (3,890) (8,407) (6,731)
Less: Employer tax related to equity transactions (148) (80) (342) (238)
Non-GAAP general and administrative $ 11,518 $ 7,566 $ 23,188 $ 14,694
GAAP general and administrative as percentage of revenue 22% 24% 22% 24%
Non-GAAP general and administrative as percentage of
revenue
16% 16% 16% 16%
19Zendesk Shareholder Letter - August 02 2016
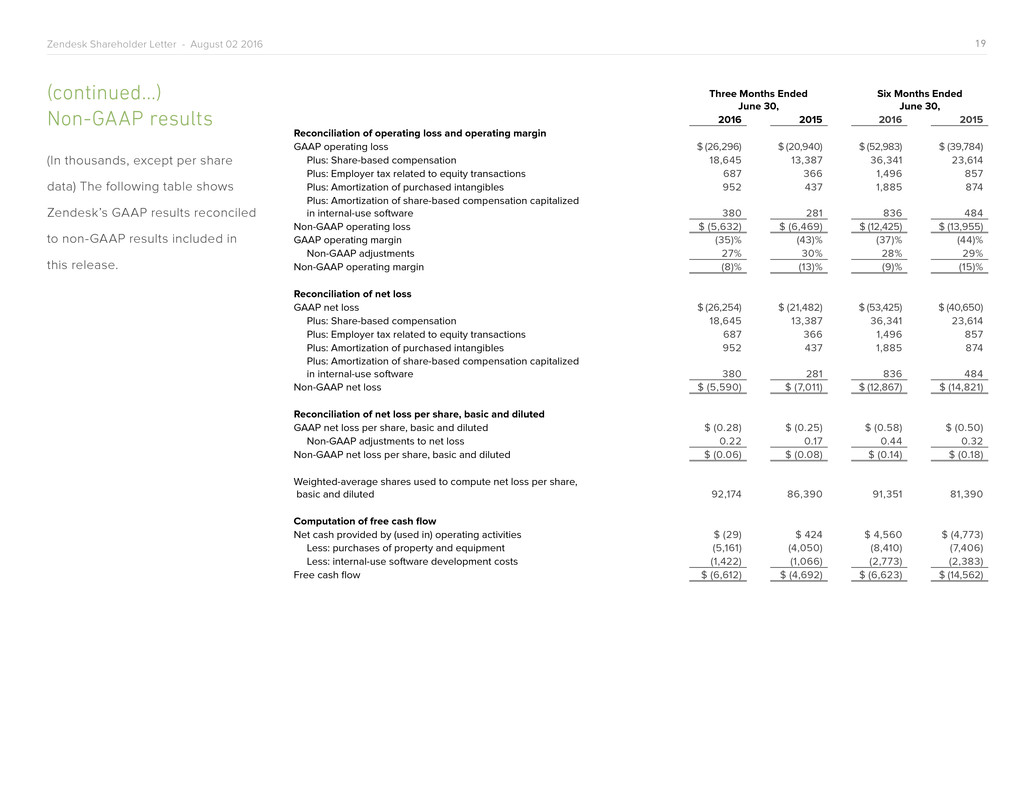
Three Months Ended
June 30,
Six Months Ended
June 30,
2016 2015 2016 2015
Reconciliation of operating loss and operating margin
GAAP operating loss $ (26,296) $ (20,940) $ (52,983) $ (39,784)
Plus: Share-based compensation 18,645 13,387 36,341 23,614
Plus: Employer tax related to equity transactions 687 366 1,496 857
Plus: Amortization of purchased intangibles 952 437 1,885 874
Plus: Amortization of share-based compensation capitalized
in internal-use software 380 281 836 484
Non-GAAP operating loss $ (5,632) $ (6,469) $ (12,425) $ (13,955)
GAAP operating margin (35)% (43)% (37)% (44)%
Non-GAAP adjustments 27% 30% 28% 29%
Non-GAAP operating margin (8)% (13)% (9)% (15)%
Reconciliation of net loss
GAAP net loss $ (26,254) $ (21,482) $ (53,425) $ (40,650)
Plus: Share-based compensation 18,645 13,387 36,341 23,614
Plus: Employer tax related to equity transactions 687 366 1,496 857
Plus: Amortization of purchased intangibles 952 437 1,885 874
Plus: Amortization of share-based compensation capitalized
in internal-use software 380 281 836 484
Non-GAAP net loss $ (5,590) $ (7,011) $ (12,867) $ (14,821)
Reconciliation of net loss per share, basic and diluted
GAAP net loss per share, basic and diluted $ (0.28) $ (0.25) $ (0.58) $ (0.50)
Non-GAAP adjustments to net loss 0.22 0.17 0.44 0.32
Non-GAAP net loss per share, basic and diluted $ (0.06) $ (0.08) $ (0.14) $ (0.18)
Weighted-average shares used to compute net loss per share,
basic and diluted 92,174 86,390 91,351 81,390
Computation of free cash flow
Net cash provided by (used in) operating activities $ (29) $ 424 $ 4,560 $ (4,773)
Less: purchases of property and equipment (5,161) (4,050) (8,410) (7,406)
Less: internal-use software development costs (1,422) (1,066) (2,773) (2,383)
Free cash flow $ (6,612) $ (4,692) $ (6,623) $ (14,562)
(continued...)
Non-GAAP results
(In thousands, except per share
data) The following table shows
Zendesk’s GAAP results reconciled
to non-GAAP results included in
this release.
20Zendesk Shareholder Letter - August 02 2016
About non-GAAP financial measures
To provide investors and others with additional information regarding
Zendesk’s results, the following non-GAAP financial measures were
disclosed: non-GAAP gross profit and gross margin, non-GAAP operating
expenses, non-GAAP operating loss and operating margin, non-GAAP
net loss attributable to common stockholders, non-GAAP net loss per
share attributable to common stockholders, basic and diluted, non-GAAP
weighted-average shares used to compute net loss per share attributable to
common stockholders, basic and diluted, and free cash flow.
Specifically, Zendesk excludes the following from its historical and
prospective non-GAAP financial measures, as applicable:
Share-based Compensation and Amortization of Share-based Compensation
Capitalized in Internal-use Software: Zendesk utilizes share-based
compensation to attract and retain employees. It is principally aimed at
aligning their interests with those of its stockholders and at long-term
retention, rather than to address operational performance for any particular
period. As a result, share-based compensation expenses vary for reasons
that are generally unrelated to financial and operational performance in any
particular period.
Employer Tax Related to Employee Stock Transactions: Zendesk views
the amount of employer taxes related to its employee stock transactions
as an expense that is dependent on its stock price, employee exercise
and other award disposition activity, and other factors that are beyond
Zendesk’s control. As a result, employer taxes related to its employee stock
transactions vary for reasons that are generally unrelated to financial and
operational performance in any particular period.
Amortization of Purchased Intangibles and Acquisition Related Expenses:
Zendesk views amortization of purchased intangible assets, including the
amortization of the cost associated with an acquired entity’s developed
technology, as items arising from pre-acquisition activities determined at
the time of an acquisition. While these intangible assets are evaluated for
impairment regularly, amortization of the cost of purchased intangibles is
an expense that is not typically affected by operations during any particular
period. Zendesk views acquisition related expenses as events that are
not necessarily reflective of operational performance during a period. In
particular, Zendesk believes the consideration of measures that exclude
such expenses can assist in the comparison of operational performance in
different periods which may or may not include such expenses.
Zendesk provides disclosures regarding its free cash flow, which is defined
as net cash from operating activities, less purchases of property and
equipment and internal-use software development costs. Zendesk uses free
cash flow, among other measures, to evaluate the ability of its operations to
generate cash that is available for purposes other than capital expenditures
and capitalized software development costs. Zendesk believes that
information regarding free cash flow provides investors with an important
perspective on the cash available to fund ongoing operations.
Zendesk uses non-GAAP financial information to evaluate its ongoing
operations and for internal planning and forecasting purposes. Zendesk's
management does not itself, nor does it suggest that investors should,
consider such non-GAAP financial measures in isolation from, or as a
substitute for, financial information prepared in accordance with GAAP.
Zendesk presents such non-GAAP financial measures in reporting its
financial results to provide investors with an additional tool to evaluate
Zendesk's operating results. Zendesk believes these non-GAAP financial
measures are useful because they allow for greater transparency with
respect to key metrics used by management in its financial and operational
decision-making. This allows investors and others to better understand
and evaluate Zendesk’s operating results and future prospects in the same
manner as management.
Zendesk's management believes it is useful for itself and investors to review,
as applicable, both GAAP information that may include items such as share-
based compensation expense, amortization of share-based compensation
capitalized in internal-use software, amortization of purchased intangibles,
transaction costs related to acquisitions, and the non-GAAP measures that
exclude such information in order to assess the performance of Zendesk's
business and for planning and forecasting in subsequent periods. When
Zendesk uses such a non-GAAP financial measure with respect to historical
periods, it provides a reconciliation of the non-GAAP financial measure to
the most closely comparable GAAP financial measure. When Zendesk uses
such a non-GAAP financial measure in a forward-looking manner for future
periods and a reconciliation is not determinable without unreasonable effort,
Zendesk provides the reconciling information that is determinable without
unreasonable effort and identifies the information that would need to be
added or subtracted from the non-GAAP measure to arrive at the most
directly comparable GAAP measure. Investors are encouraged to review the
related GAAP financial measures and the reconciliation of these non-GAAP
financial measures to their most directly comparable GAAP financial measure
as detailed above.
21Zendesk Shareholder Letter - August 02 2016
About operating metrics
Zendesk reviews a number of operating metrics to evaluate its business,
measure performance, identify trends, formulate business plans, and make
strategic decisions. These include the number of paid customer accounts
for its customer service platform and live chat software, dollar-based net
expansion rate, monthly recurring revenue represented by its churned
customers, and the percentage of its monthly recurring revenue originating
from customers with more than 100 agents.
Zendesk defines the number of paid customer accounts at the end of any
particular period as the sum of the number of accounts on its customer
service platform, exclusive of its Starter plan, free trials or other free
services, and the number of accounts using its live chat software, exclusive
of free trials or other free services, each as of the end of the period and
as identified by a unique account identifier. Use of Zendesk’s customer
service platform and live chat software requires separate subscriptions and
each of these accounts are treated as a separate paid customer account.
Existing customers may also expand their utilization of our customer
service platform or live chat software by adding new accounts and a single
consolidated organization or customer may have multiple accounts across
each of Zendesk’s customer service platform and live chat software to
service separate subsidiaries, divisions, or work processes. Each of these
accounts is also treated as a separate paid customer account. Zendesk
does not currently incorporate accounts using its analytics software into
the determination of the number of paid customer accounts. Accounts that
subscribe to Zendesk’s Essential plan are included in the determination of
the number of paid customer accounts.
Zendesk’s dollar-based net expansion rate provides a measurement of
its ability to increase revenue across its existing customer base through
expansion of authorized agents associated with a paid customer account,
upgrades in subscription plan, and the purchase of additional features on
Zendesk’s customer service platform, such as voice subscriptions, as offset
by churn, contraction in authorized agents associated with a paid customer
account, and downgrades in subscription plans. Zendesk’s dollar-based
net expansion rate is based upon monthly recurring revenue for a set of
paid customer accounts on its customer service platform and live chat
software. Monthly recurring revenue for a paid customer account is a legal
and contractual determination made by assessing the contractual terms
of each paid customer account, as of the date of determination, as to the
revenue Zendesk expects to generate in the next monthly period for that
paid customer account, assuming no changes to the subscription and without
taking into account any one-time discounts or any platform usage above
the subscription base, if any, that may be applicable to such subscription.
Monthly recurring revenue is not determined by reference to historical
revenue, deferred revenue or any other United States generally accepted
accounting principles, or GAAP, financial measure over any period. It is
forward-looking and contractually derived as of the date of determination.
Zendesk calculates its dollar-based net expansion rate by dividing the
retained revenue net of contraction and churn by Zendesk’s base revenue.
Zendesk defines its base revenue as the aggregate monthly recurring
revenue of the paid customer accounts on Zendesk’s customer service
platform and live chat software as of the date one year prior to the date of
calculation. Zendesk defines the retained revenue net of contraction and
churn as the aggregate monthly recurring revenue of the same customer
base included in the measure of base revenue at the end of the annual
period being measured. The dollar-based net expansion rate is also
adjusted to eliminate the effect of certain activities that we identify involving
the transfer of agents between paid customer accounts, consolidation
of customer accounts, or the split of a single paid customer account into
multiple paid customer accounts. In addition, the dollar-based net expansion
rate is adjusted to include paid customer accounts in the customer base
used to determine retained revenue net of contraction and churn that share
common corporate information with customers in the customer base that
is used to determine the base revenue. Giving effect to this consolidation
results in Zendesk’s dollar-based net expansion rate being calculated
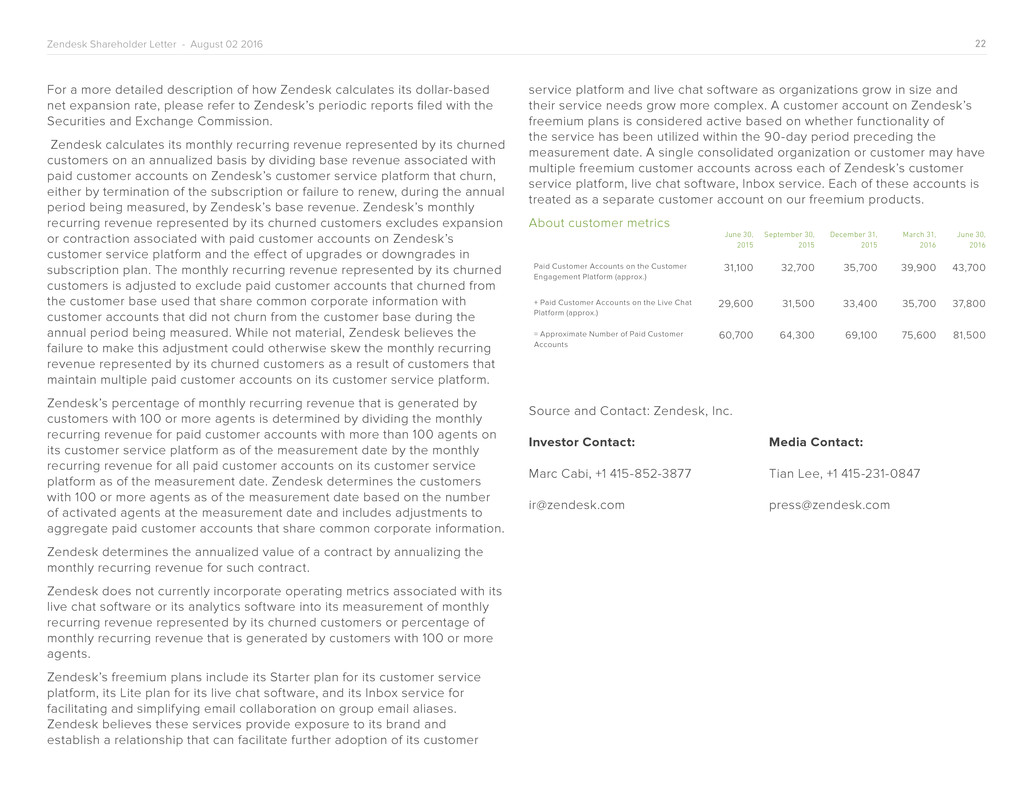
across approximately 70,900 customers, as compared to the approximately
81,500 total paid customer accounts as of June 30, 2016. To the extent
that Zendesk can determine that the underlying customers do not share
common corporate information, Zendesk does not aggregate paid customer
accounts associated with reseller and other similar channel arrangements for
the purposes of determining its dollar-based net expansion rate. While not
material, Zendesk believes the failure to account for these activities would
otherwise skew the dollar-based net expansion metrics associated with
customers that maintain multiple paid customer accounts on its customer
service platform or live chat software and paid customer accounts associated
with reseller and other similar channel arrangements.
Starting in the quarter ended March 31, 2016, Zendesk began incorporating
operating metrics associated with its live chat software into its dollar-based
net expansion rate. Zendesk does not currently incorporate operating
metrics associated with its analytics software into its measurement of dollar-
based net expansion rate.
22Zendesk Shareholder Letter - August 02 2016
For a more detailed description of how Zendesk calculates its dollar-based
net expansion rate, please refer to Zendesk’s periodic reports filed with the
Securities and Exchange Commission.
Zendesk calculates its monthly recurring revenue represented by its churned
customers on an annualized basis by dividing base revenue associated with
paid customer accounts on Zendesk’s customer service platform that churn,
either by termination of the subscription or failure to renew, during the annual
period being measured, by Zendesk’s base revenue. Zendesk’s monthly
recurring revenue represented by its churned customers excludes expansion
or contraction associated with paid customer accounts on Zendesk’s
customer service platform and the effect of upgrades or downgrades in
subscription plan. The monthly recurring revenue represented by its churned
customers is adjusted to exclude paid customer accounts that churned from
the customer base used that share common corporate information with
customer accounts that did not churn from the customer base during the
annual period being measured. While not material, Zendesk believes the
failure to make this adjustment could otherwise skew the monthly recurring
revenue represented by its churned customers as a result of customers that
maintain multiple paid customer accounts on its customer service platform.
Zendesk’s percentage of monthly recurring revenue that is generated by
customers with 100 or more agents is determined by dividing the monthly
recurring revenue for paid customer accounts with more than 100 agents on
its customer service platform as of the measurement date by the monthly
recurring revenue for all paid customer accounts on its customer service
platform as of the measurement date. Zendesk determines the customers
with 100 or more agents as of the measurement date based on the number
of activated agents at the measurement date and includes adjustments to
aggregate paid customer accounts that share common corporate information.
Zendesk determines the annualized value of a contract by annualizing the
monthly recurring revenue for such contract.
Zendesk does not currently incorporate operating metrics associated with its
live chat software or its analytics software into its measurement of monthly
recurring revenue represented by its churned customers or percentage of
monthly recurring revenue that is generated by customers with 100 or more
agents.
Zendesk’s freemium plans include its Starter plan for its customer service
platform, its Lite plan for its live chat software, and its Inbox service for
facilitating and simplifying email collaboration on group email aliases.
Zendesk believes these services provide exposure to its brand and
establish a relationship that can facilitate further adoption of its customer
service platform and live chat software as organizations grow in size and
their service needs grow more complex. A customer account on Zendesk’s
freemium plans is considered active based on whether functionality of
the service has been utilized within the 90-day period preceding the
measurement date. A single consolidated organization or customer may have
multiple freemium customer accounts across each of Zendesk’s customer
service platform, live chat software, Inbox service. Each of these accounts is
treated as a separate customer account on our freemium products.
About customer metrics
Source and Contact: Zendesk, Inc.
Investor Contact:
Marc Cabi, +1 415-852-3877
ir@zendesk.com
June 30,
2015
September 30,
2015
December 31,
2015
March 31,
2016
June 30,
2016
Paid Customer Accounts on the Customer
Engagement Platform (approx.)
31,100 32,700 35,700 39,900 43,700
+ Paid Customer Accounts on the Live Chat
Platform (approx.)
29,600 31,500 33,400 35,700 37,800
= Approximate Number of Paid Customer
Accounts
60,700 64,300 69,100 75,600 81,500
Media Contact:
Tian Lee, +1 415-231-0847
press@zendesk.com
