Attached files
| file | filename |
|---|---|
| 8-K - 8-K CH SALE - TALMER BANCORP, INC. | a8kaugust16investorpresent.htm |
Creating a Preeminent Midwest
Community Bank
August 2, 2016
KBW Community Bank Investor Conference
David B. Ramaker
Chief Executive Officer
Chemical Financial Corporation
Dennis Klaeser
Chief Financial Officer
Talmer Bancorp, Inc.
2
Forward – Looking Statements
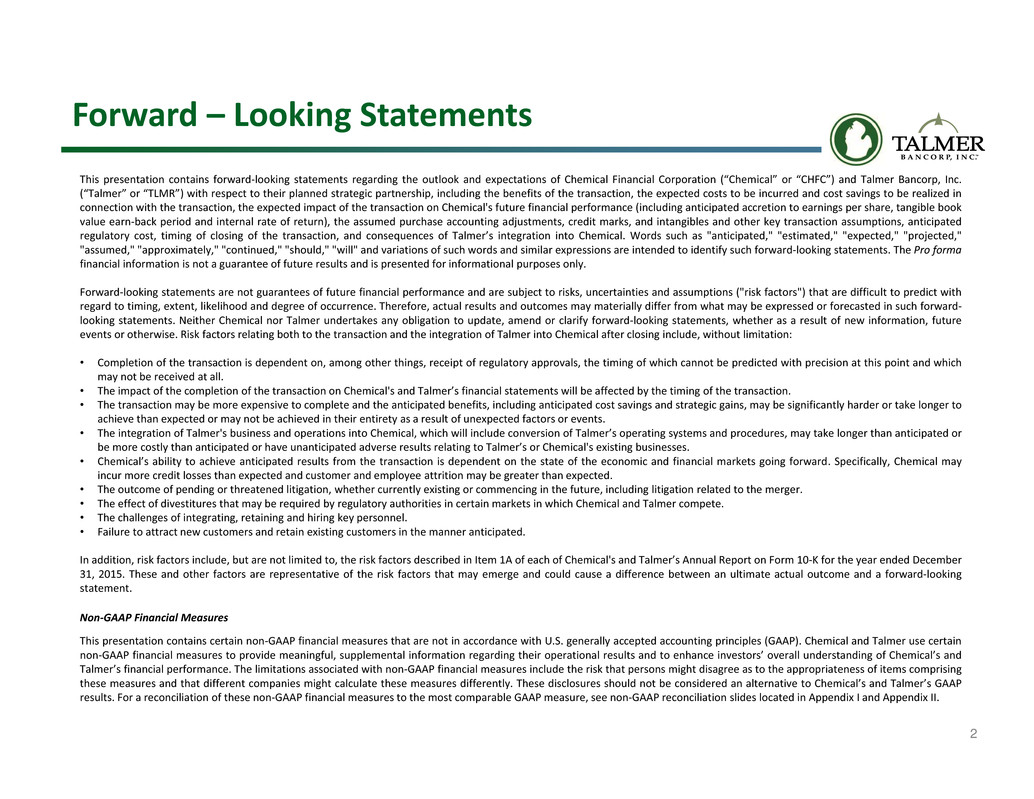
This presentation contains forward‐looking statements regarding the outlook and expectations of Chemical Financial Corporation (“Chemical” or “CHFC”) and Talmer Bancorp, Inc.
(“Talmer” or “TLMR”) with respect to their planned strategic partnership, including the benefits of the transaction, the expected costs to be incurred and cost savings to be realized in
connection with the transaction, the expected impact of the transaction on Chemical's future financial performance (including anticipated accretion to earnings per share, tangible book
value earn‐back period and internal rate of return), the assumed purchase accounting adjustments, credit marks, and intangibles and other key transaction assumptions, anticipated
regulatory cost, timing of closing of the transaction, and consequences of Talmer’s integration into Chemical. Words such as "anticipated," "estimated," "expected," "projected,"
"assumed," "approximately," "continued," "should," "will" and variations of such words and similar expressions are intended to identify such forward‐looking statements. The Pro forma
financial information is not a guarantee of future results and is presented for informational purposes only.
Forward‐looking statements are not guarantees of future financial performance and are subject to risks, uncertainties and assumptions ("risk factors") that are difficult to predict with
regard to timing, extent, likelihood and degree of occurrence. Therefore, actual results and outcomes may materially differ from what may be expressed or forecasted in such forward‐
looking statements. Neither Chemical nor Talmer undertakes any obligation to update, amend or clarify forward‐looking statements, whether as a result of new information, future
events or otherwise. Risk factors relating both to the transaction and the integration of Talmer into Chemical after closing include, without limitation:
• Completion of the transaction is dependent on, among other things, receipt of regulatory approvals, the timing of which cannot be predicted with precision at this point and which
may not be received at all.
• The impact of the completion of the transaction on Chemical's and Talmer’s financial statements will be affected by the timing of the transaction.
• The transaction may be more expensive to complete and the anticipated benefits, including anticipated cost savings and strategic gains, may be significantly harder or take longer to
achieve than expected or may not be achieved in their entirety as a result of unexpected factors or events.
• The integration of Talmer's business and operations into Chemical, which will include conversion of Talmer’s operating systems and procedures, may take longer than anticipated or
be more costly than anticipated or have unanticipated adverse results relating to Talmer’s or Chemical's existing businesses.
• Chemical’s ability to achieve anticipated results from the transaction is dependent on the state of the economic and financial markets going forward. Specifically, Chemical may
incur more credit losses than expected and customer and employee attrition may be greater than expected.
• The outcome of pending or threatened litigation, whether currently existing or commencing in the future, including litigation related to the merger.
• The effect of divestitures that may be required by regulatory authorities in certain markets in which Chemical and Talmer compete.
• The challenges of integrating, retaining and hiring key personnel.
• Failure to attract new customers and retain existing customers in the manner anticipated.
In addition, risk factors include, but are not limited to, the risk factors described in Item 1A of each of Chemical's and Talmer’s Annual Report on Form 10‐K for the year ended December
31, 2015. These and other factors are representative of the risk factors that may emerge and could cause a difference between an ultimate actual outcome and a forward‐looking
statement.
Non‐GAAP Financial Measures
This presentation contains certain non‐GAAP financial measures that are not in accordance with U.S. generally accepted accounting principles (GAAP). Chemical and Talmer use certain
non‐GAAP financial measures to provide meaningful, supplemental information regarding their operational results and to enhance investors’ overall understanding of Chemical’s and
Talmer’s financial performance. The limitations associated with non‐GAAP financial measures include the risk that persons might disagree as to the appropriateness of items comprising
these measures and that different companies might calculate these measures differently. These disclosures should not be considered an alternative to Chemical’s and Talmer’s GAAP
results. For a reconciliation of these non‐GAAP financial measures to the most comparable GAAP measure, see non‐GAAP reconciliation slides located in Appendix I and Appendix II.
3
Overview
Joining Two High Performing Banks
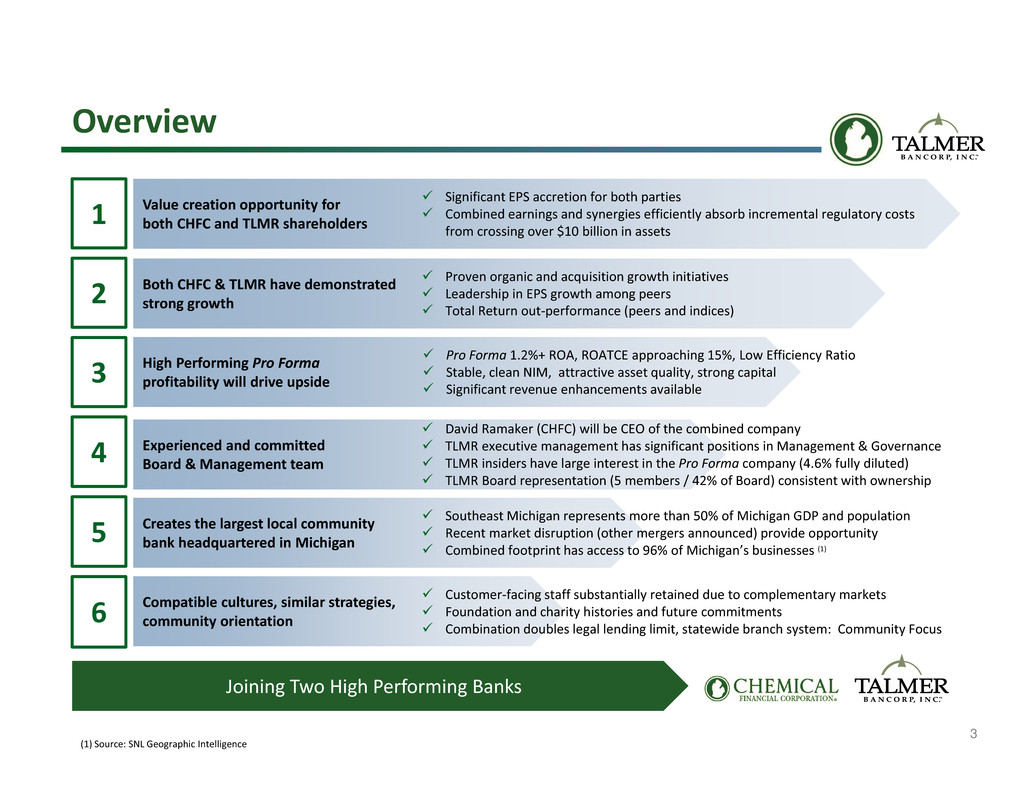
Value creation opportunity for
both CHFC and TLMR shareholders
5
6
4
1
Both CHFC & TLMR have demonstrated
strong growth2
High Performing Pro Forma
profitability will drive upside3
Experienced and committed
Board & Management team
Creates the largest local community
bank headquartered in Michigan
Compatible cultures, similar strategies,
community orientation
Significant EPS accretion for both parties
Combined earnings and synergies efficiently absorb incremental regulatory costs
from crossing over $10 billion in assets
Customer‐facing staff substantially retained due to complementary markets
Foundation and charity histories and future commitments
Combination doubles legal lending limit, statewide branch system: Community Focus
Proven organic and acquisition growth initiatives
Leadership in EPS growth among peers
Total Return out‐performance (peers and indices)
Pro Forma 1.2%+ ROA, ROATCE approaching 15%, Low Efficiency Ratio
Stable, clean NIM, attractive asset quality, strong capital
Significant revenue enhancements available
David Ramaker (CHFC) will be CEO of the combined company
TLMR executive management has significant positions in Management & Governance
TLMR insiders have large interest in the Pro Forma company (4.6% fully diluted)
TLMR Board representation (5 members / 42% of Board) consistent with ownership
Southeast Michigan represents more than 50% of Michigan GDP and population
Recent market disruption (other mergers announced) provide opportunity
Combined footprint has access to 96% of Michigan’s businesses (1)
(1) Source: SNL Geographic Intelligence

4
High Performing, Complementary Banks
Source: SNL Financial and Company documents
(1) Core efficiency ratio for CHFC excludes merger related expenses; core efficiency ratio for TLMR defined as noninterest expense divided by total revenue, adjusted for (expense)/benefit due to change in the fair
value of loan servicing rights, FDIC loss sharing income, transaction and integration related costs and net loss on early termination of FDIC loss share and warrant agreements and bargain purchase gains
(2) Includes impact of Durbin Amendment and other expenses associated with crossing $10 billion asset size threshold
(3) As of June 30, 2016
Creating a Preeminent Midwest Bank
• Largest bank headquartered in Michigan
• $16 billion in total assets
• Largest MI headquartered branch distribution
system
• Significant market share in nearly all markets of
operation
• High Performing Pro Forma ROA, ROE, NIM and
Efficiency (1)(2)
Detroitt ittr itt it
Pittsburghittittitt
Clevelandl ll ll l
Milwaukeeililil
Chicagoiii
IndianapolisI i liI i liI i li Columbuslll
Chemical
Talmer
● $6.9 billion bank holding company
‐ Headquartered in Troy, MI
(Greater Detroit MSA)
● A high performing Midwest Bank
‐ Built through organic growth & successful
acquisitions
● Recapitalized and retooled banking platforms
after the distress of the previous credit crisis
‐ Completed 8 acquisitions since 2010
‐ (~$6.0 billion in assets acquired)
● Strong mortgage banking platform producing
$1.4 billion in originations in 2015
● Strong operating performance
‐ Attractive NIM (ex. Excess Accretable Yield)
‐ Core efficiency ratio of 58.4%(1) in 2Q’16
‐ Low cost deposit funding
● 11.7% YoY net loan growth ($524 million)
● Total return since IPO(3): 48.9%
● $9.5 billion financial holding company
‐ Headquartered in Midland, MI
● Preeminent MI franchise outside of Detroit MSA
‐ Capitalizing on and contributing to Michigan’s
vibrant economy
‐ Recent strategic acquisitions have enhanced
organization’s market presence, lending
capacity and earnings power
● Proven ability to increase market share in core
markets through:
‐ Strong organic loan growth ($1.7 billion) over
prior 3 years
‐ Approximately $3.1 billion in assets acquired
through open bank M&A since 2010
● Significant trust and wealth management
operations (AUM of $5.0 billion)
● Strong operating performance history through
cycles, including
‐ Attractive NIM
‐ Core efficiency ratio of 55.1%(1) in 2Q’16
‐ Low cost deposit funding
‐ Strong asset quality through cycles
● 9% YoY organic loan growth ($613 million)
● 3yr Total Return(3) : 57.5% (vs. KRX: 23.0%)
5
Rationale: Logical Fit
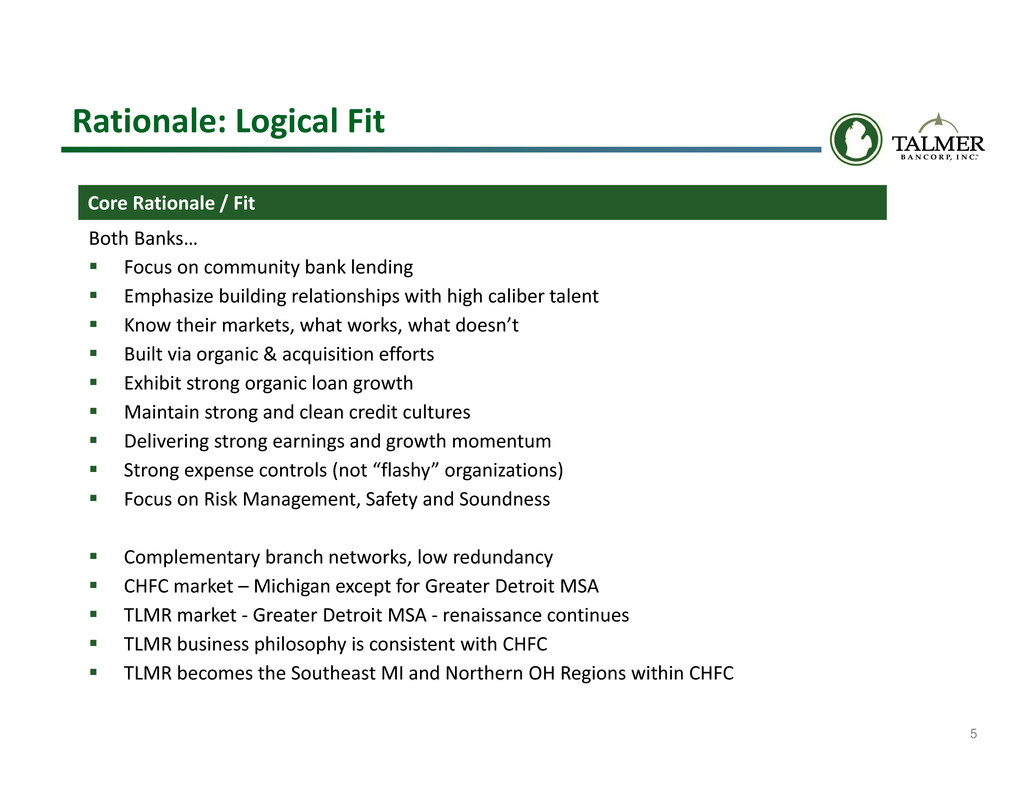
Both Banks…
Focus on community bank lending
Emphasize building relationships with high caliber talent
Know their markets, what works, what doesn’t
Built via organic & acquisition efforts
Exhibit strong organic loan growth
Maintain strong and clean credit cultures
Delivering strong earnings and growth momentum
Strong expense controls (not “flashy” organizations)
Focus on Risk Management, Safety and Soundness
Complementary branch networks, low redundancy
CHFC market – Michigan except for Greater Detroit MSA
TLMR market ‐ Greater Detroit MSA ‐ renaissance continues
TLMR business philosophy is consistent with CHFC
TLMR becomes the Southeast MI and Northern OH Regions within CHFC
Core Rationale / Fit
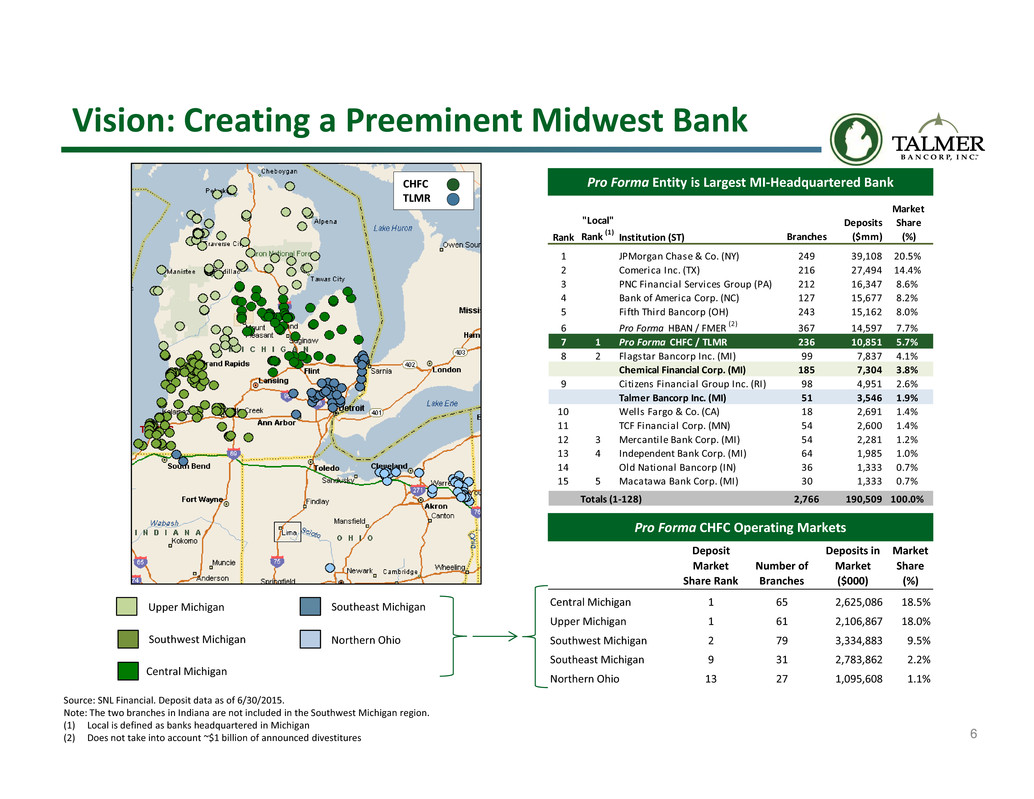
6
Vision: Creating a Preeminent Midwest Bank
Pro Forma Entity is Largest MI‐Headquartered Bank
Pro Forma CHFC Operating Markets
Source: SNL Financial. Deposit data as of 6/30/2015.
Note: The two branches in Indiana are not included in the Southwest Michigan region.
(1) Local is defined as banks headquartered in Michigan
(2) Does not take into account ~$1 billion of announced divestitures
Upper Michigan Southeast Michigan
Southwest Michigan
CHFC
TLMR
Central Michigan
Northern Ohio
Deposit
Market
Share Rank
Number of
Branches
Deposits in
Market
($000)
Market
Share
(%)
Central Michigan 1 65 2,625,086 18.5%
Upper Michigan 1 61 2,106,867 18.0%
Southwest Michigan 2 79 3,334,883 9.5%
Southeast Michigan 9 31 2,783,862 2.2%
Northern Ohio 13 27 1,095,608 1.1%
Rank
"Local"
Rank (1) Institution (ST) Branches
Deposits
($mm)
Market
Share
(%)
1 JPMorgan Chase & Co. (NY) 249 39,108 20.5%
2 Comerica Inc. (TX) 216 27,494 14.4%
3 PNC Financial Services Group (PA) 212 16,347 8.6%
4 Bank of America Corp. (NC) 127 15,677 8.2%
5 Fifth Third Bancorp (OH) 243 15,162 8.0%
6 Pro Forma HBAN / FMER (2) 367 14,597 7.7%
7 1 Pro Forma CHFC / TLMR 236 10,851 5.7%
8 2 Flagstar Bancorp Inc. (MI) 99 7,837 4.1%
Chemical Financial Corp. (MI) 185 7,304 3.8%
9 Citizens Financial Group Inc. (RI) 98 4,951 2.6%
Talmer Bancorp Inc. (MI) 51 3,546 1.9%
10 Wells Fargo & Co. (CA) 18 2,691 1.4%
11 TCF Financial Corp. (MN) 54 2,600 1.4%
12 3 Mercantile Bank Corp. (MI) 54 2,281 1.2%
13 4 Independent Bank Corp. (MI) 64 1,985 1.0%
14 Old National Bancorp (IN) 36 1,333 0.7%
15 5 Macatawa Bank Corp. (MI) 30 1,333 0.7%
Totals (1‐128) 2,766 190,509 100.0%

7
All Major MI Markets & OH Growth Opportunity
96% of businesses / 97% of population is within Pro Forma MI footprint (3)
Overlapping Michigan Markets New Michigan & Ohio MarketsOther Markets
CHFC: Deposits / Rank $3.2 #3
TLMR: Deposits / Rank $0.2 #28
CHFC: Deposits / Rank $2.1 #2
TLMR: Deposits / Rank $0.6 #9
CHFC: Deposits / Rank $0.0
TLMR: Deposits / Rank $2.8 #9
CHFC: Deposits / Rank $0.0
TLMR: Deposits / Rank $1.1 #15
CHFC: Deposits / Rank $2.1 #1
TLMR: Deposits / Rank $0.0 #31
Southwest MI Central MI Southeast MI Northern OHNorthern MI
Southeast Michigan represents more than 50% of Michigan GDP and population – a huge opportunity with recent market disruption
(1) Source: USDOC’s Bureau of Economic Analysis. Considered the largest Metropolitan Statistical Area for each region. The Upper Michigan region does not have a Metropolitan Statistical Area as defined by the
Bureau of Economic Analysis
(2) State Deposits are in billions
(3) Source: SNL Geographic Intelligence
Pro Forma Footprint By State & Regional Market
State Overlapping Markets Other New Markets Market Access
MI OH
Southwest
MI
Central
MI
Upper
MI
Southeast
MI
Northern
OH
Michigan
Penetration
Chemical Presence
Talmer Presence
Combined Franchise
Pro Forma Depos i ts ($B) $10.9 $1.1 $3.3 $2.6 $2.1 $2.8 $1.1
Market Share Rank 7 24 2 1 1 9 13
Depos i t Market Share (%) 5.7% 0.4% 9.5% 18.5% 18.0% 2.2% 1.1%
Market Information (as a % of):
% of State ($B) GDP
(1) 12% 2% ‐ 53% 22%
% of State Depos i ts
(2) 18% 7% 6% 66% 35% 98%
% of State Bus inesses
(3) 25% 13% 11% 46% 38% 96%
% of State Population
(3) 25% 13% 9% 49% 37% 97%
8
Rationale: Clear Opportunities
Complementary Franchises & Enhances Our Respective Strategies
High industrial logic in truly creating a preeminent Midwest Bank
– The leading independent bank in Michigan
– Material scale in communities throughout Michigan
– Meaningful scale in Northern Ohio
Scale Benefits:
– Regional scale to compete for any Michigan clients including increased lending limits
– Platform efficiencies give advantage afforded low cost provider
– Broader customer access and reach
– Broadens product capabilities
– $16b Pro Forma scale will mitigate the costs of crossing $10b
Complementary business lines – transportable into each other’s markets
– Mortgage origination (TLMR platform)
– Wealth management (CHFC platform)
– Consumer lending (CHFC platform)
Wide range of “back‐fill” acquisition opportunities in Michigan
Wide range of “bolt‐on” acquisition opportunities in adjacent markets (Indiana, Ohio)
9
Economic Momentum in Michigan
Michigan ranks 6th in the country for its
creation of nearly 450,000 jobs since late
2010 (1)
Unemployment has dropped from 14.9%
in June 2009 to 4.7% in May 2016 (2)
Michigan GDP growth outpaced the
nation from 2009‐2014 with growth of
13.4% to 9.4% (3)
Ranks as 7th most competitive state for
new business investment by Site Selection
Magazine (4)
New investment from global companies
has grown by $8.4 billion since 2010 (5)
From 2nd worst to 13th best corporate tax
climate as rated by Tax Foundation
10th largest state by population
8th ranked state in number of skilled trade
workers (2)
Top ranked state in the country for
electrical, mechanical and industrial
engineers (2)
A $1.5 billion structural budget deficit has
been eliminated (6)
Extensive recent investment in
infrastructure
Passage of Right‐to‐Work legislation and
other pro‐innovation policies in recent
years
Recent Performance Assets for Future Growth
1) Michigan Economic Development Corporation
2) US Bureau of Labor Statistics
3) Michigan Economic Development Corporation
4) January 2016
5) FDImarkets.com
6) Michigan Department of Technology, Management and Budget
10
Preeminent Midwest Bank for All Constituencies
Shareholders
Local Communities
▲ EPS accretion to all shareholders, leading growth rate
▲ Material dividend accretion to TLMR shareholders
▲ Potential Market Value Creation (P/E lift, new peer group)
▲ Diversification in earnings
▲ Efficiently deploy capital in low premium merger
▲ Improves already strong operating metrics, inclusive of Durbin costs
▲ Upstream buyer field is likely to expand on net basis (coherent franchise)
▲ Potential attractive target bank opportunity field expands
► Temporary hiatus in acquisition plans and share repurchases
▲ CHFC’s & TLMR’s commitment and strength in community banking
▲ In‐state Headquarters (largest bank headquartered in Michigan)
▲ CHFC’s regional organization brings local lending authorities
▲ Pro Forma CHFC+TLMR may de‐emphasize out‐of‐market lending and
reallocate resources (loans/employees) to combined footprint
▲ Foundation and charity histories and future commitments
▲ CHFC local tax‐credit unit offers unique financing options for
challenging projects in TLMR markets
▲ CHFC Cares Days (in‐community works)
Borrowers / Depositors
▲ Primary core funded bank allows sustained lending through cycles
▲ CHFC’s credit quality history offers evidence of lending through cycles
▲ Statewide locations make banking with TLMR+CHFC easier
▲ Greater legal lending limit provides greater lending capacities
▲ Wider product suite (treasury, wealth mgmt., enhanced mortgage)
▲ Ability to offer more products per customer relationship
▲ CHFC brings consumer (auto) lending
Employees / Culture
▲ Up‐tiered size increases public identity and recruiting capacities
▲ CHFC’s community banking model fits with TLMR culture
▲ TLMR employees have significant roles in Pro Forma company
▲ Combined management and governance line‐up provides integration
benefits and guidance
▲ TLMR & CHFC customer‐facing employees substantially retained due to
complementary market presence
► Target cost savings achievement predicated upon elimination of
redundant positions within TLMR+CHFC, creating some employee
displacement
11
Integration Progress
Proceeding on Schedule
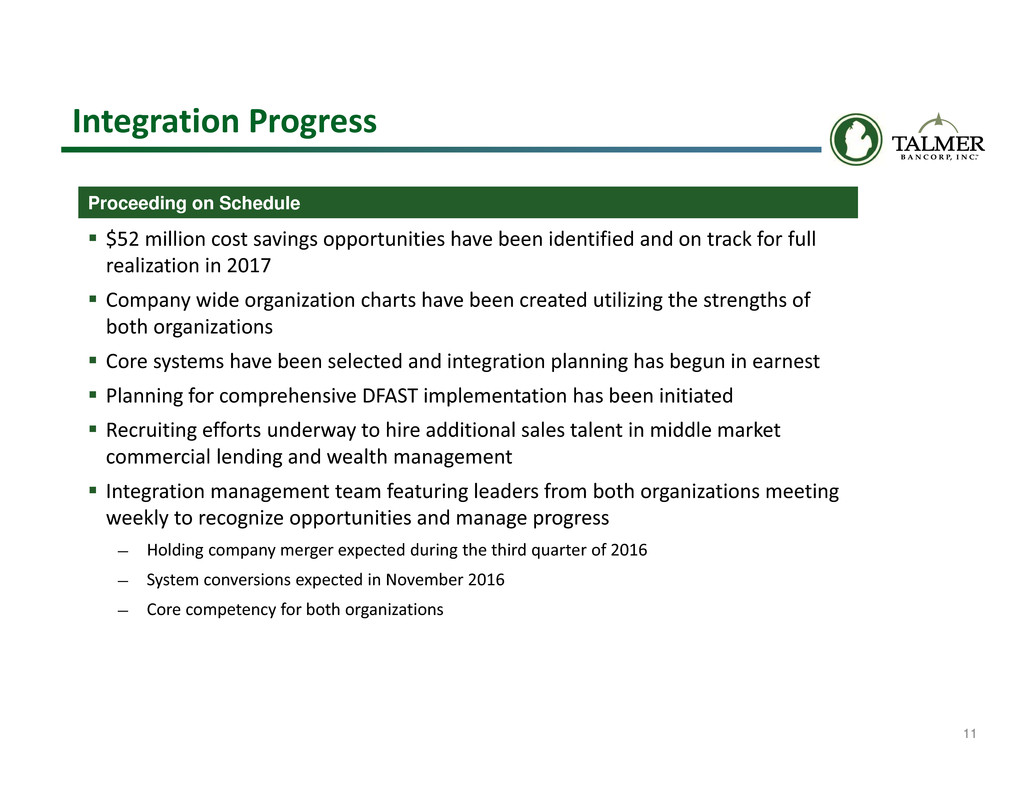
$52 million cost savings opportunities have been identified and on track for full
realization in 2017
Company wide organization charts have been created utilizing the strengths of
both organizations
Core systems have been selected and integration planning has begun in earnest
Planning for comprehensive DFAST implementation has been initiated
Recruiting efforts underway to hire additional sales talent in middle market
commercial lending and wealth management
Integration management team featuring leaders from both organizations meeting
weekly to recognize opportunities and manage progress
— Holding company merger expected during the third quarter of 2016
— System conversions expected in November 2016
— Core competency for both organizations

12
Financial Metrics
Combined Company Positioned for Significant Upside
Note: CHFC and TLMR financial figures based on June 30, 2016 financials; peer figures are for the most recent quarter available and the source is SNL Financial.
(1) The Pro Forma profitability figures are presented for 2017 and balance sheet at June 30, 2016 . Includes purchase accounting; assumes fully phased in transaction adjustments
(2) Peers include mainland public banks and thrifts with total assets between $10 billion and $25 billion and ROATCE greater than 10.00%; peer data as of January 29, 2016
(3) CHFC and TLMR EPS stand alone estimates are FactSet Consensus estimates prior to announcement of the merger
13
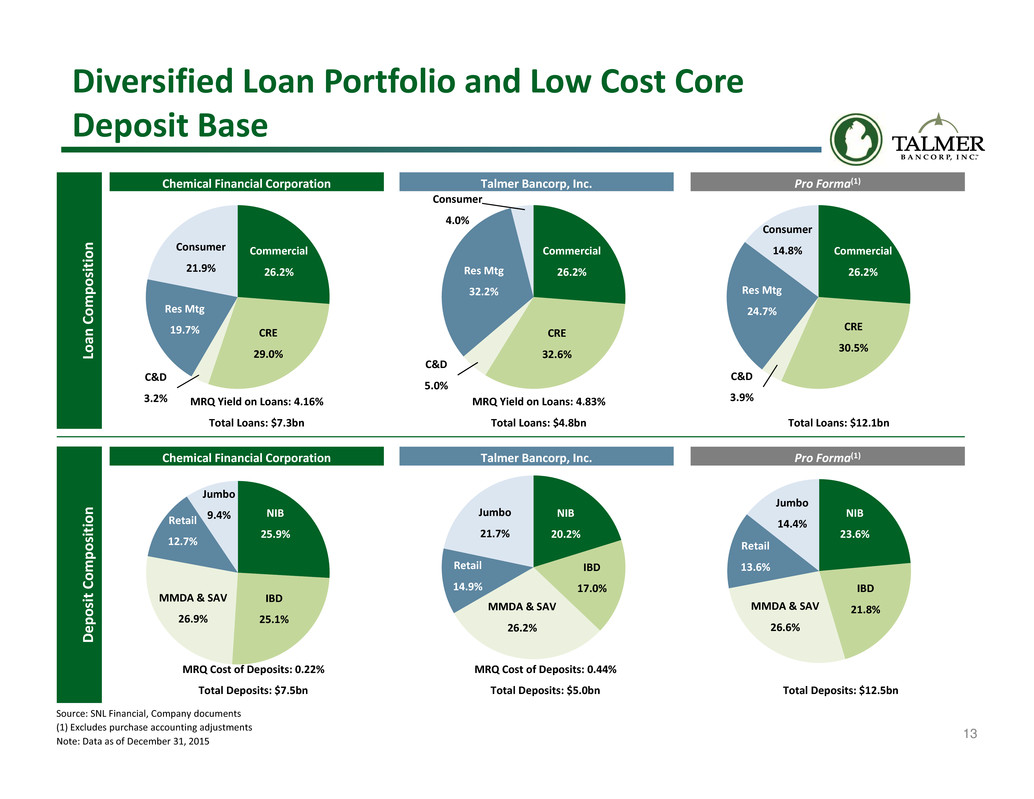
Diversified Loan Portfolio and Low Cost Core
Deposit Base
Source: SNL Financial, Company documents
(1) Excludes purchase accounting adjustments
Note: Data as of December 31, 2015
Commercial
26.2%
CRE
32.6%
C&D
5.0%
Res Mtg
32.2%
Jumbo
9.4% NIB
25.9%
IBD
25.1%
MMDA & SAV
26.9%
Retail
12.7%
Jumbo
21.7%
NIB
20.2%
IBD
17.0%
MMDA & SAV
26.2%
Retail
14.9%
Jumbo
14.4%
NIB
23.6%
IBD
21.8%MMDA & SAV
26.6%
Retail
13.6%
MRQ Yield on Loans: 4.16%
Total Loans: $7.3bn
MRQ Yield on Loans: 4.83%
Total Loans: $4.8bn Total Loans: $12.1bn
MRQ Cost of Deposits: 0.22%
Total Deposits: $7.5bn
MRQ Cost of Deposits: 0.44%
Total Deposits: $5.0bn Total Deposits: $12.5bn
Consumer
4.0%
Commercial
26.2%
CRE
29.0%
C&D
3.2%
Res Mtg
19.7%
Consumer
21.9%
Commercial
26.2%
CRE
30.5%
C&D
3.9%
Res Mtg
24.7%
Consumer
14.8%
L
o
a
n
C
o
m
p
o
s
i
t
i
o
n
Chemical Financial Corporation Talmer Bancorp, Inc. Pro Forma(1)
D
e
p
o
s
i
t
C
o
m
p
o
s
i
t
i
o
n
Chemical Financial Corporation Talmer Bancorp, Inc. Pro Forma(1)
14
0.00
0.10
0.20
0.30
0.40
0.50
0.60
0.70
0.80
0.90
$
P
e
r
S
h
a
r
e
Performance & Expectations
SNL Core EPS Common Dividend
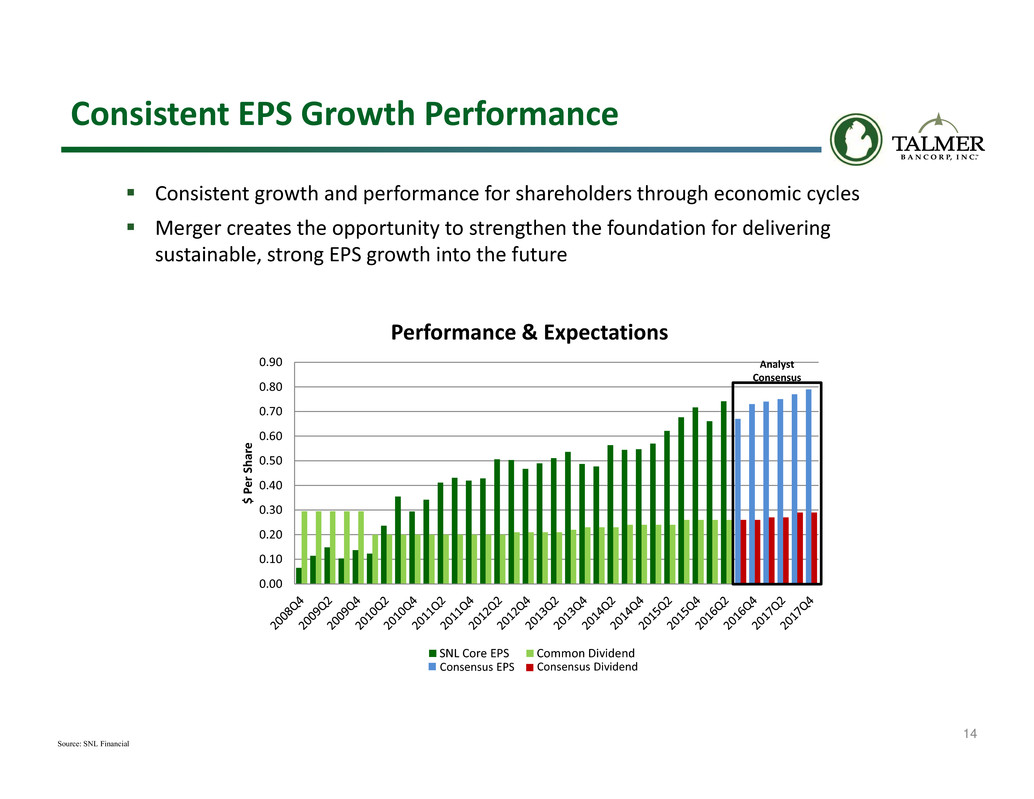
Consistent EPS Growth Performance
Analyst
Consensus
Consistent growth and performance for shareholders through economic cycles
Merger creates the opportunity to strengthen the foundation for delivering
sustainable, strong EPS growth into the future
Source: SNL Financial
Consensus EPS Consensus Dividend
15
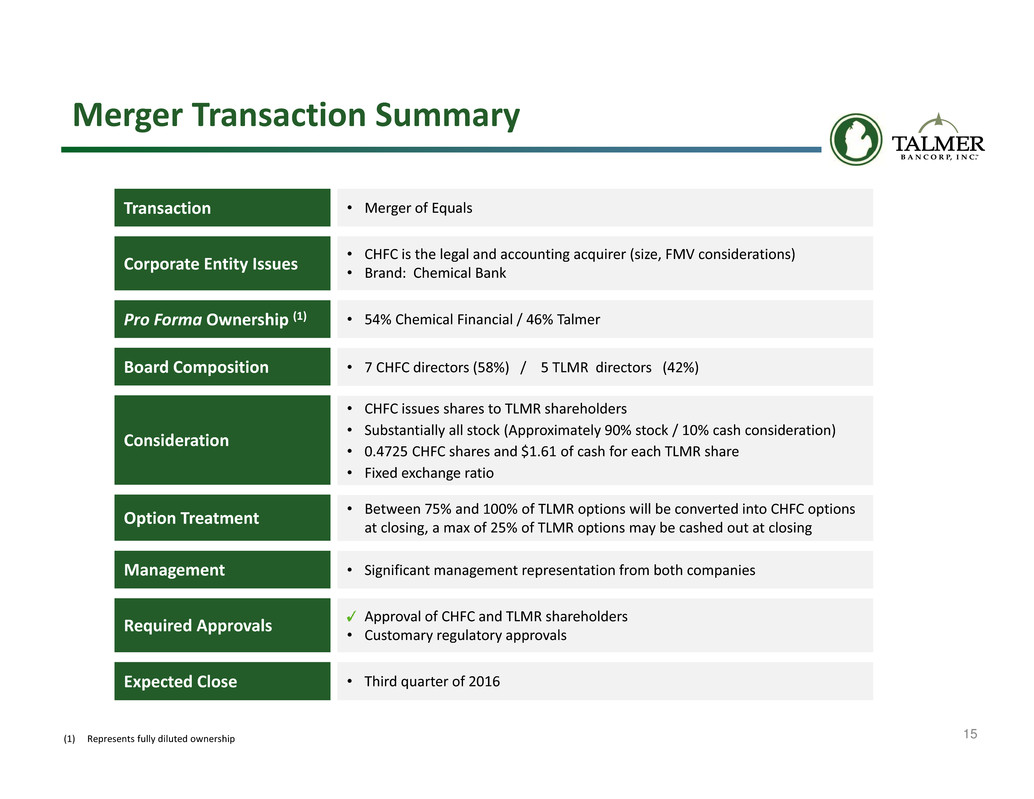
Merger Transaction Summary
Corporate Entity Issues
Consideration
Management
Board Composition
Required Approvals
Expected Close • Third quarter of 2016
Approval of CHFC and TLMR shareholders
• Customary regulatory approvals
• 7 CHFC directors (58%) / 5 TLMR directors (42%)
• Significant management representation from both companies
Option Treatment
• Between 75% and 100% of TLMR options will be converted into CHFC options
at closing, a max of 25% of TLMR options may be cashed out at closing
• CHFC issues shares to TLMR shareholders
• Substantially all stock (Approximately 90% stock / 10% cash consideration)
• 0.4725 CHFC shares and $1.61 of cash for each TLMR share
• Fixed exchange ratio
• CHFC is the legal and accounting acquirer (size, FMV considerations)
• Brand: Chemical Bank
(1) Represents fully diluted ownership
Transaction • Merger of Equals
Pro Forma Ownership (1) • 54% Chemical Financial / 46% Talmer
Closing Remarks and Questions
KBW Community Bank Investor Conference
Appendix I
Chemical Financial Corporation
2016 Second Quarter
Earnings Results
Q2 2016 Highlights
19
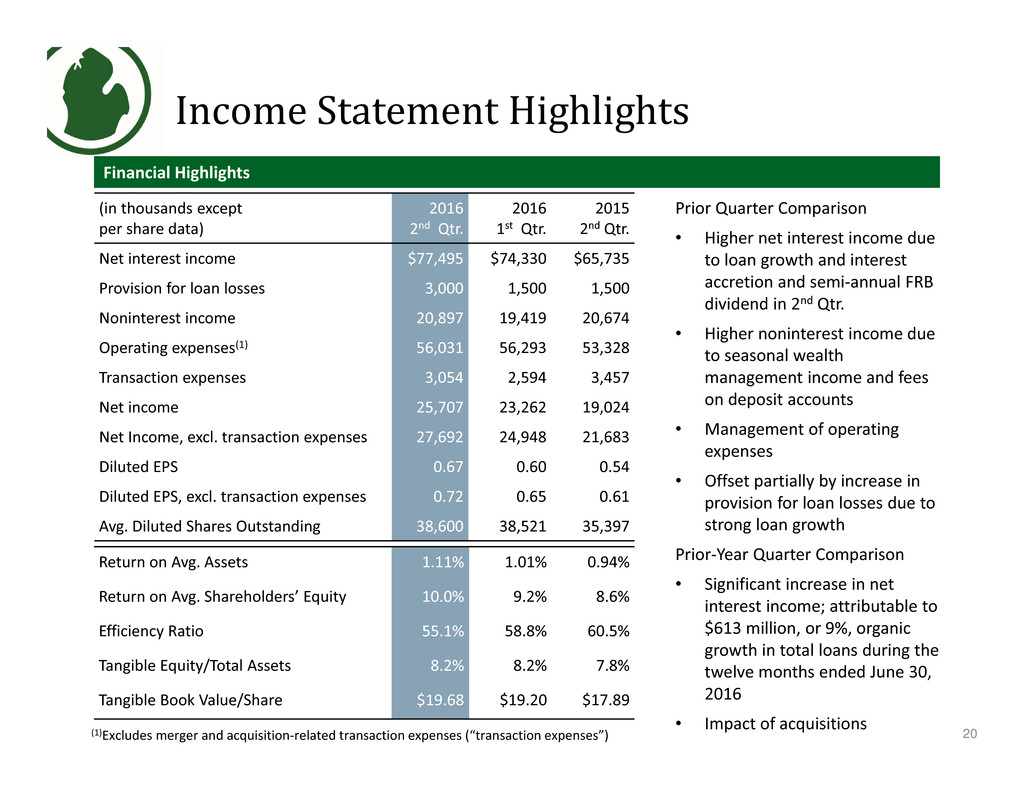
• Diluted earnings per share of $0.67, up 12% from 1st qtr. 2016 and up 24% from 2nd qtr. 2015
• Diluted earnings per share, excluding merger and acquisition‐related transaction expenses
(“transaction expenses”), of $0.72; up 11% from 1st qtr. 2016, while up 18% over 2nd qtr. 2015
─ Higher net interest income resulting from loan growth and an increase in interest accretion
─ Semi‐annual FRB dividend income and seasonal wealth management revenue
─ Operating expense management
• Return on average assets and return on average equity of 1.11% and 10.0%, respectively, in 2nd qtr.
2016 (1.19% and 10.8%, respectively, excluding transaction expenses)
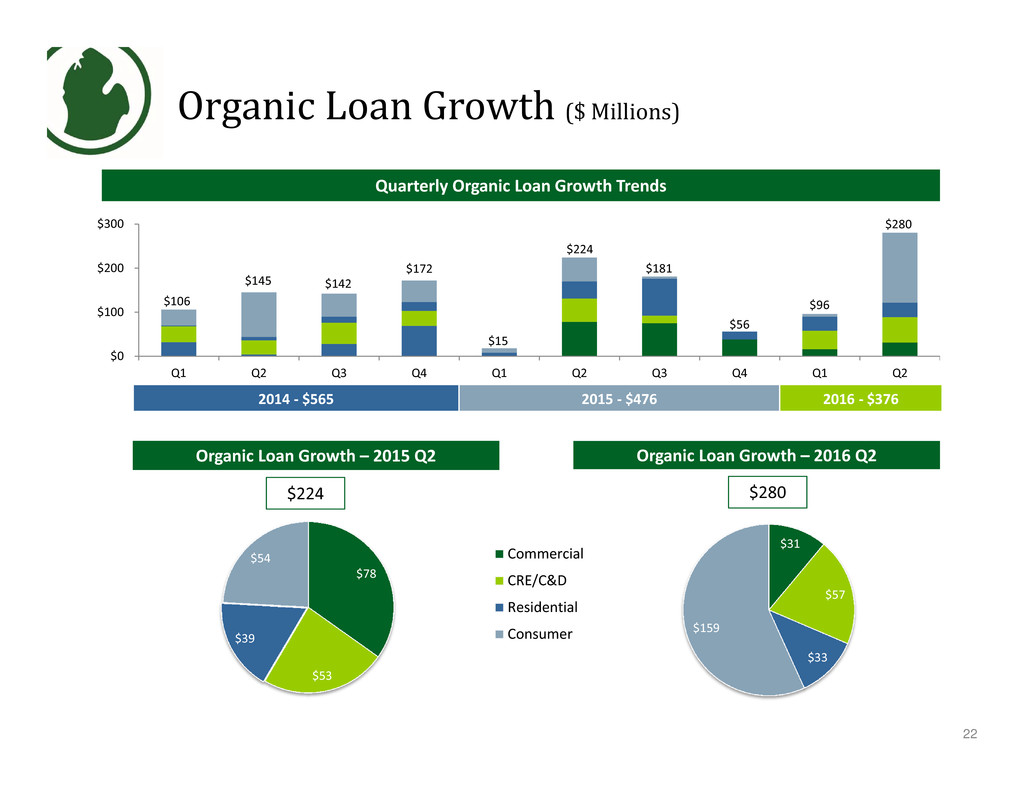
• Loan Growth
─ Organic: $280 million in 2nd qtr. 2016 (11% commercial, 20% commercial real estate,
12% residential mortgage and 57% consumer loans)
• Asset quality ratios
─ Reduction in nonperforming loans of $11 million, or 15%
─ Net loan charge‐offs/total loans of 0.10%
─ Nonperforming loans/total loans of 0.81% at 6/30/2016; down from 0.99% at 3/31/2016
(in thousands except
per share data)
2016
2nd Qtr.
2016
1st Qtr.
2015
2nd Qtr.
Net interest income $77,495 $74,330 $65,735
Provision for loan losses 3,000 1,500 1,500
Noninterest income 20,897 19,419 20,674
Operating expenses(1) 56,031 56,293 53,328
Transaction expenses 3,054 2,594 3,457
Net income 25,707 23,262 19,024
Net Income, excl. transaction expenses 27,692 24,948 21,683
Diluted EPS 0.67 0.60 0.54
Diluted EPS, excl. transaction expenses 0.72 0.65 0.61
Avg. Diluted Shares Outstanding 38,600 38,521 35,397
Return on Avg. Assets 1.11% 1.01% 0.94%
Return on Avg. Shareholders’ Equity 10.0% 9.2% 8.6%
Efficiency Ratio 55.1% 58.8% 60.5%
Tangible Equity/Total Assets 8.2% 8.2% 7.8%
Tangible Book Value/Share $19.68 $19.20 $17.89
Income Statement Highlights
Financial Highlights
20
Prior Quarter Comparison
• Higher net interest income due
to loan growth and interest
accretion and semi‐annual FRB
dividend in 2nd Qtr.
• Higher noninterest income due
to seasonal wealth
management income and fees
on deposit accounts
• Management of operating
expenses
• Offset partially by increase in
provision for loan losses due to
strong loan growth
Prior‐Year Quarter Comparison
• Significant increase in net
interest income; attributable to
$613 million, or 9%, organic
growth in total loans during the
twelve months ended June 30,
2016
• Impact of acquisitions
(1)Excludes merger and acquisition‐related transaction expenses (“transaction expenses”)

$13.8 $16.2
$16.8 $15.3 $17.8
$19.0
$24.5
$25.5
$23.3
$25.7$0.47
$0.72
$0.00
$0.50
$1.00
$0.0
$5.0
$10.0
$15.0
$20.0
$25.0
$30.0
Q1 Q2 Q3 Q4 Q1 Q2 Q3 Q4 Q1 Q2
EP
S
N
e
t
I
n
c
o
m
e
Transaction Expenses (after‐tax)
Net Income
EPS, Excluding Transaction Expenses
Net Income
2014 2015 2016
Net Income Trending Upward ($ Millions, except EPS data)
21
(1)Net Income
(2)Net Income, excluding transaction expenses (Non‐GAAP)
2015 Total: $86.8(1); $92.3(2)2014 Total: $62.1(1); $66.7(2) 2016 YTD: $49.0(1); $52.6(2)
$21.7
$27.7
$24.9
$16.7
$78
$53
$39
$54
$31
$57
$33
$159
Commercial
CRE/C&D
Residential
Consumer
$0
$100
$200
$300
Q1 Q2 Q3 Q4 Q1 Q2 Q3 Q4 Q1 Q2
Organic Loan Growth ($ Millions)
22
Quarterly Organic Loan Growth Trends
Organic Loan Growth – 2016 Q2Organic Loan Growth – 2015 Q2
2014 ‐ $565 2015 ‐ $476 2016 ‐ $376
$106
$145 $142
$15
$172
$224
$181
$280
$56
$280$224
$96
$2.0
$1.8 $2.1
$1.4
$0.2
Noninterest‐bearing Demand Deposits Interest‐bearing Demand Deposits Savings Deposits Time Deposits Brokered Deposits
$6,204
$6,709
$7,453 $7,449 $7,535 $7,528
0.22% 0.22%
0.23% 0.22% 0.22% 0.23%
0.00%
0.25%
0.50%
$3,000
$4,000
$5,000
$6,000
$7,000
$8,000
Q1 Q2 Q3 Q4 Q1 Q2
I
n
t
e
r
e
s
t
R
a
t
e
P
a
i
d
T
o
t
a
l
A
v
e
r
a
g
e
D
e
p
o
s
i
t
s
(
$
M
i
l
l
i
o
n
s
)
Deposits Cost of Deposits(1)
$1.9
$1.6 $2.0
$1.5
$0.3
Deposit Composition
23(1) Cost of deposits based on period averages
Average Deposits ($ Millions) & Cost of Deposits (%)
Total Deposits ($ Billions)
2015 2016
Total Deposits – June 30, 2015
$7.3
Total Deposits – June 30, 2016
$7.5
$0.1
$0.2
$0.1
($0.1) ($0.1)
Organic
$0.2, 2.4%
Funding Breakdown ($ Billions)
24
+11.3%
March 31, 2016 June 30, 2016
Average Cost of Funds Q2 2016 – 0.27%Average Cost of Funds Q1 2016– 0.25%
$8.2 Billion $8.4 Billion
$6.0
$1.4
$0.3
$0.5
$5.9
$1.4
$0.3 $0.8
Deposits:
Time Deposits
Customer Repurchase
Agreements
Wholesale borrowings
(brokered deposits ‐ $0.2,
FHLB advances ‐ $0.6)
Interest and
noninterest-bearing,
demand, savings,
money market Average cost of wholesale
borrowings – 1.11%
Average cost of wholesale
borrowings – 1.28%
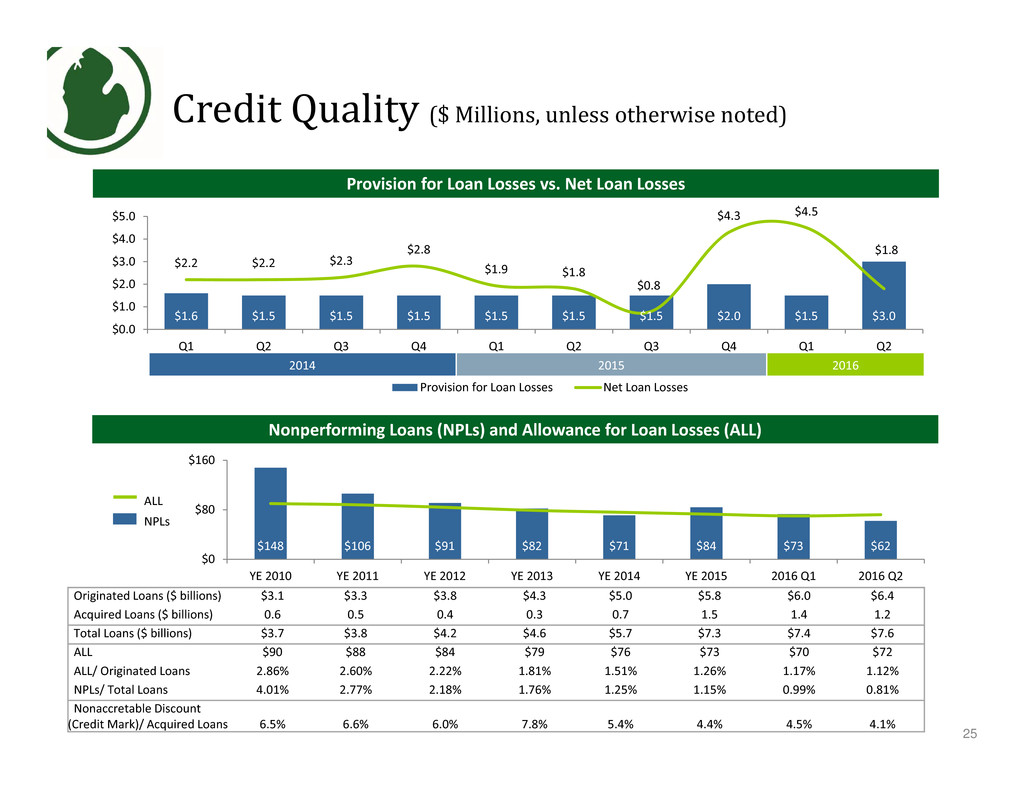
$1.6 $1.5 $1.5 $1.5 $1.5 $1.5 $1.5 $2.0 $1.5 $3.0
$2.2 $2.2 $2.3
$2.8
$1.9 $1.8
$0.8
$4.3 $4.5
$1.8
$0.0
$1.0
$2.0
$3.0
$4.0
$5.0
Q1 Q2 Q3 Q4 Q1 Q2 Q3 Q4 Q1 Q2
Provision for Loan Losses Net Loan Losses
$148 $106 $91 $82 $71 $84 $73 $62
$0
$80
$160
YE 2010 YE 2011 YE 2012 YE 2013 YE 2014 YE 2015 2016 Q1 2016 Q2
Credit Quality ($ Millions, unless otherwise noted)
Provision for Loan Losses vs. Net Loan Losses
25
Nonperforming Loans (NPLs) and Allowance for Loan Losses (ALL)
ALL
NPLs
2014 2015 2016
Originated Loans ($ billions) $3.1 $3.3 $3.8 $4.3 $5.0 $5.8 $6.0 $6.4
Acquired Loans ($ billions) 0.6 0.5 0.4 0.3 0.7 1.5 1.4 1.2
Total Loans ($ billions) $3.7 $3.8 $4.2 $4.6 $5.7 $7.3 $7.4 $7.6
ALL $90 $88 $84 $79 $76 $73 $70 $72
ALL/ Originated Loans 2.86% 2.60% 2.22% 1.81% 1.51% 1.26% 1.17% 1.12%
NPLs/ Total Loans 4.01% 2.77% 2.18% 1.76% 1.25% 1.15% 0.99% 0.81%
Nonaccretable Discount
(Credit Mark)/ Acquired Loans 6.5% 6.6% 6.0% 7.8% 5.4% 4.4% 4.5% 4.1%
Net Interest Income, Net Interest
Margin and Loan Yields (Quarterly Trend)
Net Interest Income
26
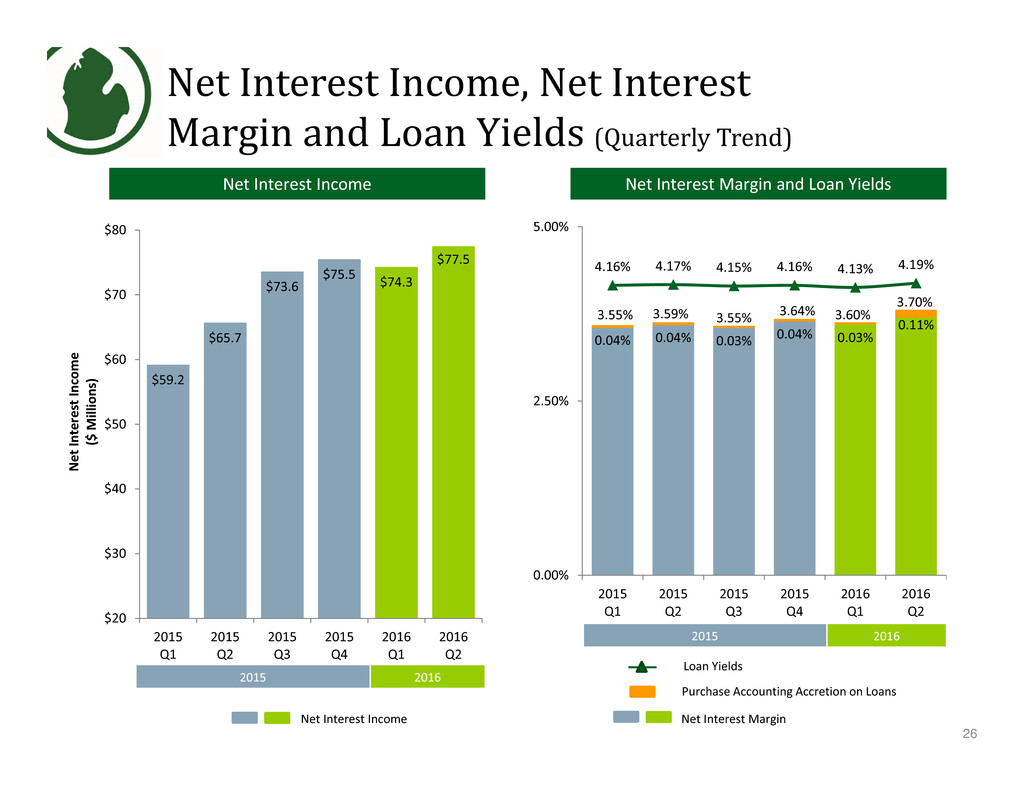
3.55% 3.59% 3.55% 3.64% 3.60%
3.70%
0.04% 0.04% 0.03% 0.04% 0.03%
0.11%
4.16% 4.17% 4.15% 4.16% 4.13% 4.19%
0.00%
2.50%
5.00%
2015
Q1
2015
Q2
2015
Q3
2015
Q4
2016
Q1
2016
Q2
Net Interest Margin and Loan Yields
Net Interest Margin
Purchase Accounting Accretion on Loans
Loan Yields
$59.2
$65.7
$73.6
$75.5 $74.3
$77.5
$20
$30
$40
$50
$60
$70
$80
2015
Q1
2015
Q2
2015
Q3
2015
Q4
2016
Q1
2016
Q2
N
e
t
I
n
t
e
r
e
s
t
I
n
c
o
m
e
(
$
M
i
l
l
i
o
n
s
)
2015 2016
2015 2016
Net Interest Income
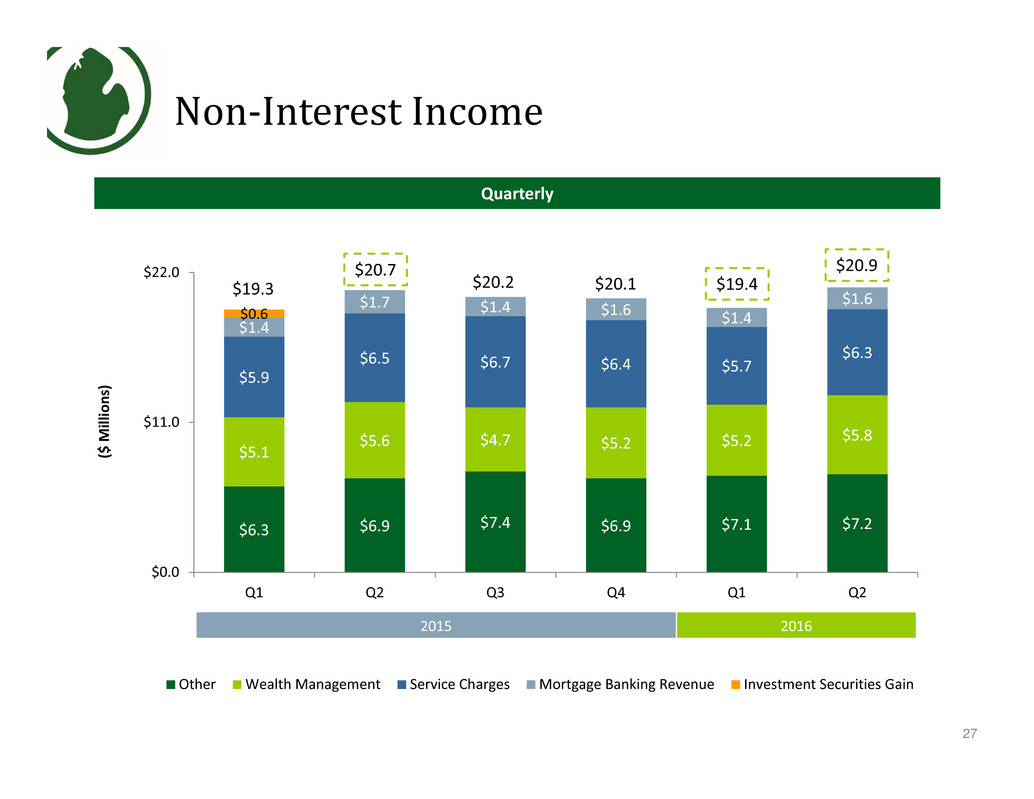
$6.3 $6.9 $7.4 $6.9 $7.1 $7.2
$5.1
$5.6 $4.7 $5.2 $5.2 $5.8
$5.9
$6.5 $6.7 $6.4 $5.7
$6.3
$1.4
$1.7 $1.4 $1.6 $1.4
$1.6
$0.6
$0.0
$11.0
$22.0
Q1 Q2 Q3 Q4 Q1 Q2
Other Wealth Management Service Charges Mortgage Banking Revenue Investment Securities Gain
Non‐Interest Income
2015 2016
Quarterly
(
$
M
i
l
l
i
o
n
s
)
27
$20.7
$19.3 $19.4$20.1$20.2
$20.9
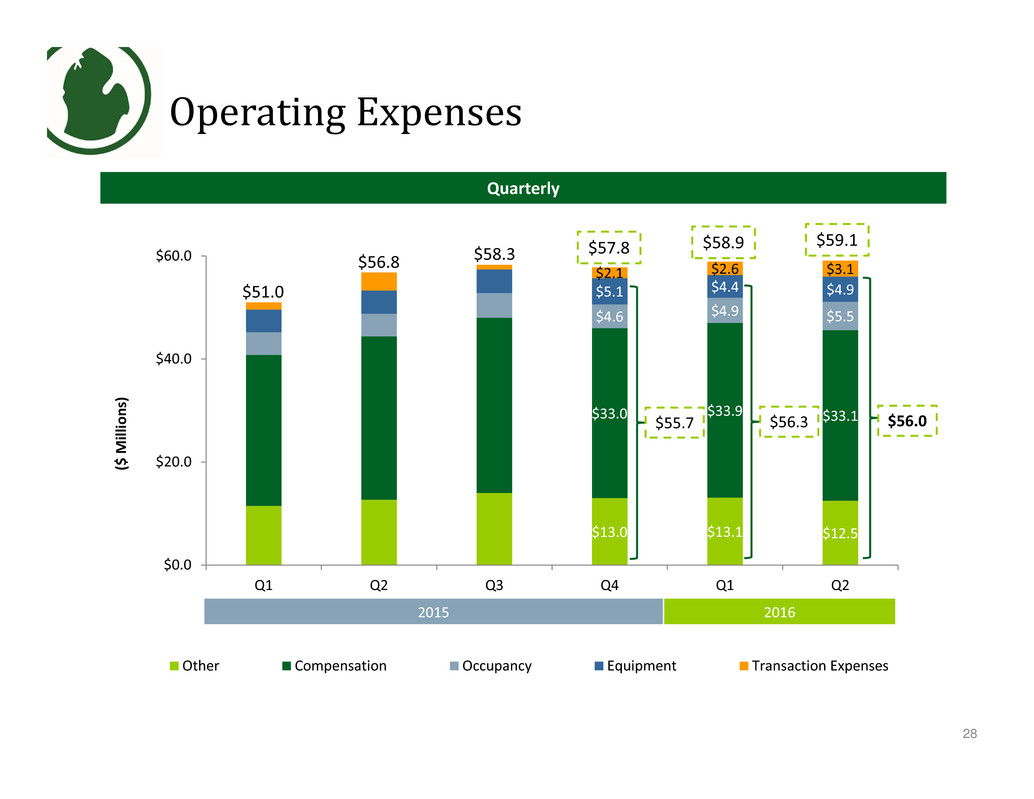
$13.0 $13.1 $12.5
$33.0 $33.9 $33.1
$4.6 $4.9 $5.5
$5.1 $4.4 $4.9
$2.1 $2.6 $3.1
$0.0
$20.0
$40.0
$60.0
Q1 Q2 Q3 Q4 Q1 Q2
Other Compensation Occupancy Equipment Transaction Expenses
Operating Expenses
2015 2016
Quarterly
28
(
$
M
i
l
l
i
o
n
s
)
$56.8
$51.0
$58.3
$56.0
$57.8 $59.1
$56.3
$58.9
$55.7
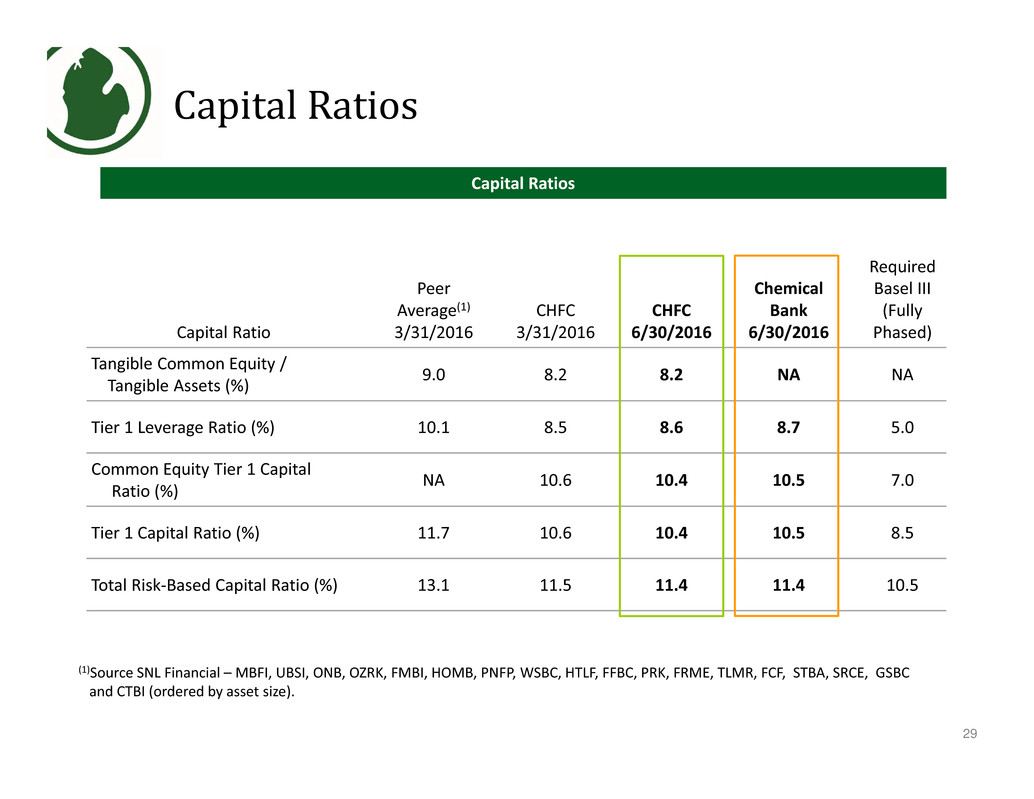
Capital Ratio
Peer
Average(1)
3/31/2016
CHFC
3/31/2016
CHFC
6/30/2016
Chemical
Bank
6/30/2016
Required
Basel III
(Fully
Phased)
Tangible Common Equity /
Tangible Assets (%)
9.0 8.2 8.2 NA NA
Tier 1 Leverage Ratio (%) 10.1 8.5 8.6 8.7 5.0
Common Equity Tier 1 Capital
Ratio (%)
NA 10.6 10.4 10.5 7.0
Tier 1 Capital Ratio (%) 11.7 10.6 10.4 10.5 8.5
Total Risk‐Based Capital Ratio (%) 13.1 11.5 11.4 11.4 10.5
Capital Ratios
29
Capital Ratios
(1)Source SNL Financial – MBFI, UBSI, ONB, OZRK, FMBI, HOMB, PNFP, WSBC, HTLF, FFBC, PRK, FRME, TLMR, FCF, STBA, SRCE, GSBC
and CTBI (ordered by asset size).
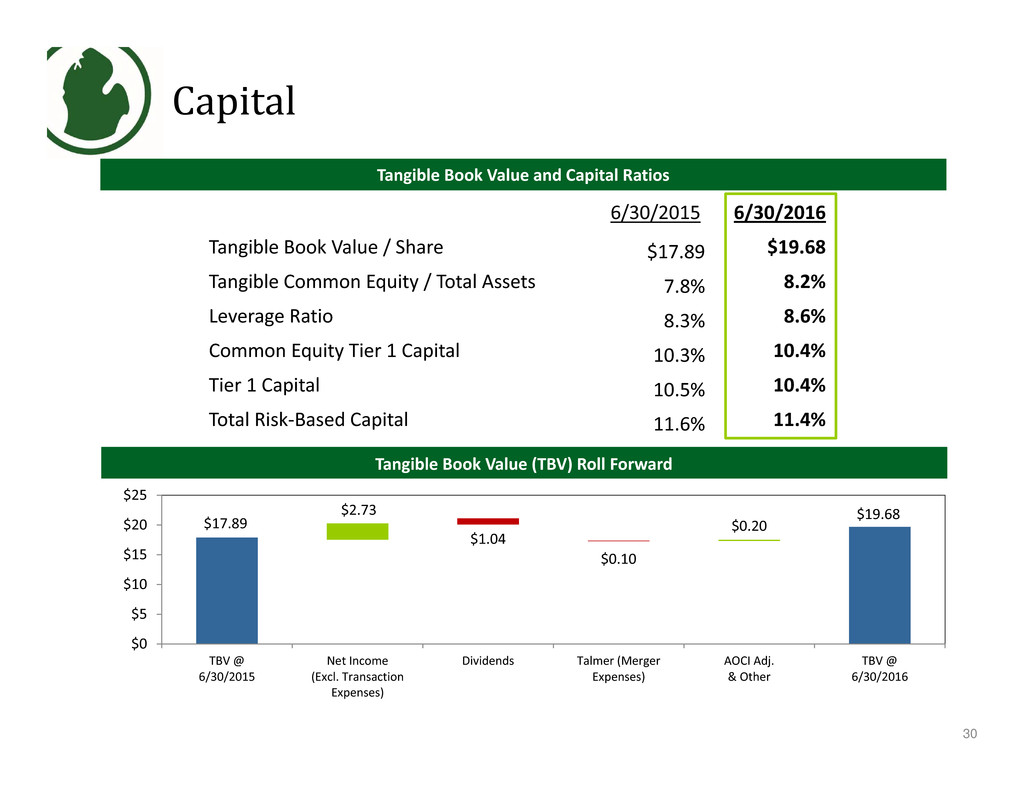
6/30/2015 6/30/2016
Tangible Book Value / Share $17.89 $19.68
Tangible Common Equity / Total Assets 7.8% 8.2%
Leverage Ratio 8.3% 8.6%
Common Equity Tier 1 Capital 10.3% 10.4%
Tier 1 Capital 10.5% 10.4%
Total Risk‐Based Capital 11.6% 11.4%
Capital
$19.68
$1.04
$0.10
$17.89
$2.73
$0.20
$0
$5
$10
$15
$20
$25
TBV @
6/30/2015
Net Income
(Excl. Transaction
Expenses)
Dividends Talmer (Merger
Expenses)
AOCI Adj.
& Other
TBV @
6/30/2016
30
Tangible Book Value and Capital Ratios
Tangible Book Value (TBV) Roll Forward
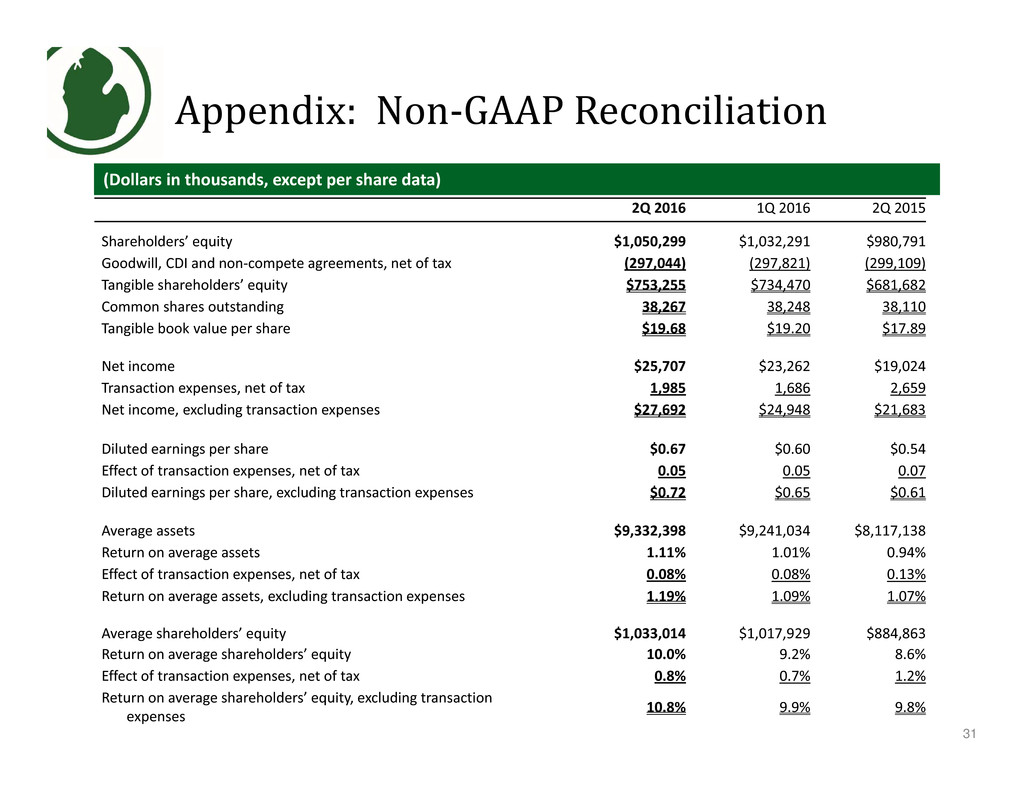
Appendix: Non‐GAAP Reconciliation
(Dollars in thousands, except per share data)
2Q 2016 1Q 2016 2Q 2015
Shareholders’ equity $1,050,299 $1,032,291 $980,791
Goodwill, CDI and non‐compete agreements, net of tax (297,044) (297,821) (299,109)
Tangible shareholders’ equity $753,255 $734,470 $681,682
Common shares outstanding 38,267 38,248 38,110
Tangible book value per share $19.68 $19.20 $17.89
Net income $25,707 $23,262 $19,024
Transaction expenses, net of tax 1,985 1,686 2,659
Net income, excluding transaction expenses $27,692 $24,948 $21,683
Diluted earnings per share $0.67 $0.60 $0.54
Effect of transaction expenses, net of tax 0.05 0.05 0.07
Diluted earnings per share, excluding transaction expenses $0.72 $0.65 $0.61
Average assets $9,332,398 $9,241,034 $8,117,138
Return on average assets 1.11% 1.01% 0.94%
Effect of transaction expenses, net of tax 0.08% 0.08% 0.13%
Return on average assets, excluding transaction expenses 1.19% 1.09% 1.07%
Average shareholders’ equity $1,033,014 $1,017,929 $884,863
Return on average shareholders’ equity 10.0% 9.2% 8.6%
Effect of transaction expenses, net of tax 0.8% 0.7% 1.2%
Return on average shareholders’ equity, excluding transaction
expenses
10.8% 9.9% 9.8%
31
Appendix II
Talmer Bancorp
2016 Second Quarter
Earnings Results
(1) Denotes a non-GAAP financial measure, see section entitled “Reconciliation of Non-GAAP Financial Measures”
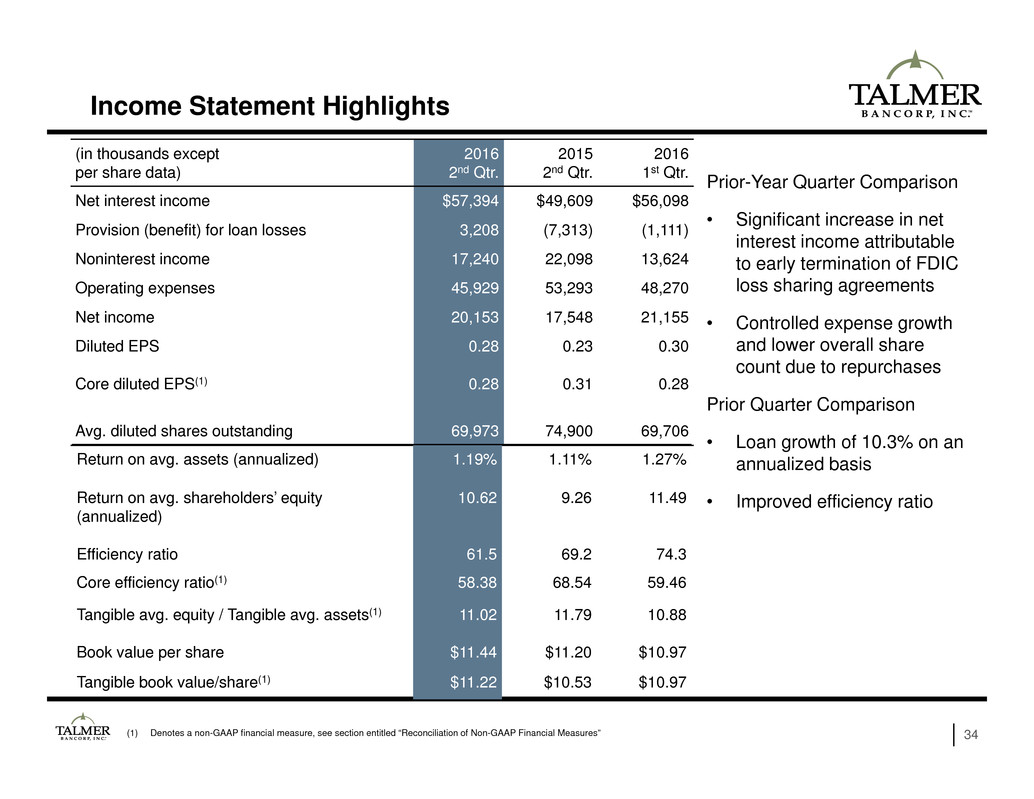
Income Statement Highlights
34
(in thousands except
per share data)
2016
2nd Qtr.
2015
2nd Qtr.
2016
1st Qtr.
Net interest income $57,394 $49,609 $56,098
Provision (benefit) for loan losses 3,208 (7,313) (1,111)
Noninterest income 17,240 22,098 13,624
Operating expenses 45,929 53,293 48,270
Net income 20,153 17,548 21,155
Diluted EPS
Core diluted EPS(1)
0.28
0.28
0.23
0.31
0.30
0.28
Avg. diluted shares outstanding 69,973 74,900 69,706
Return on avg. assets (annualized) 1.19% 1.11% 1.27%
Return on avg. shareholders’ equity
(annualized)
Efficiency ratio
10.62
61.5
9.26
69.2
11.49
74.3
Core efficiency ratio(1) 58.38 68.54 59.46
Tangible avg. equity / Tangible avg. assets(1)
Book value per share
11.02
$11.44
11.79
$11.20
10.88
$10.97
Tangible book value/share(1) $11.22 $10.53 $10.97
Prior-Year Quarter Comparison
• Significant increase in net
interest income attributable
to early termination of FDIC
loss sharing agreements
• Controlled expense growth
and lower overall share
count due to repurchases
Prior Quarter Comparison
• Loan growth of 10.3% on an
annualized basis
• Improved efficiency ratio
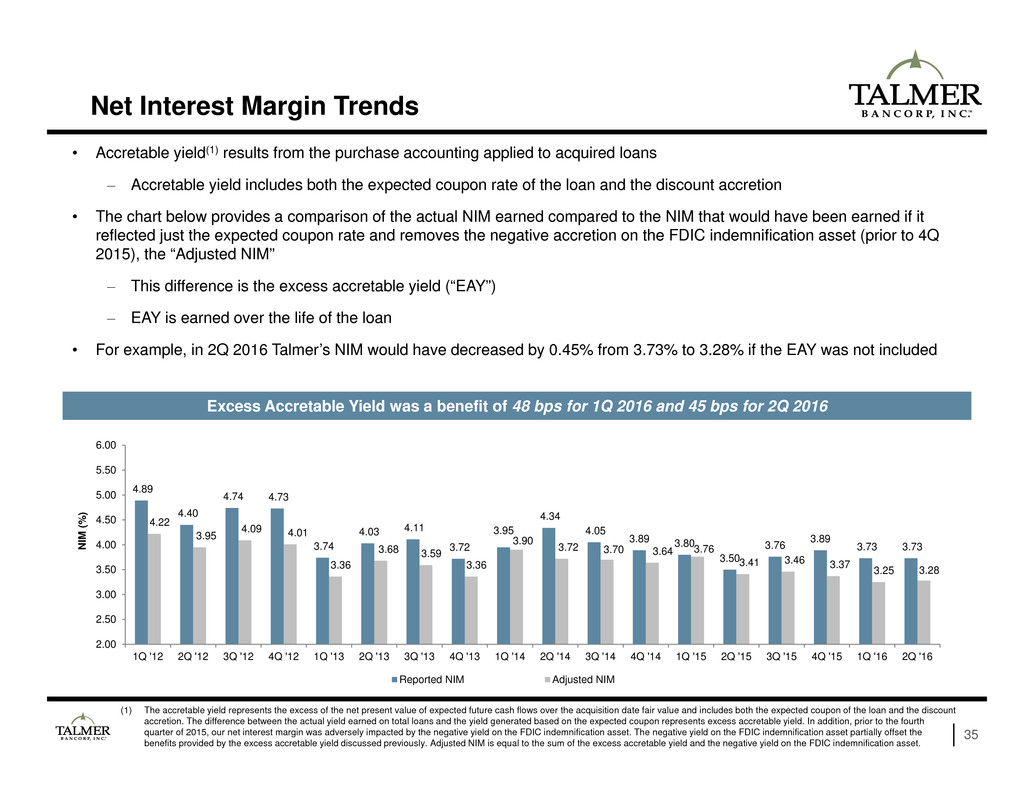
• Accretable yield(1) results from the purchase accounting applied to acquired loans
– Accretable yield includes both the expected coupon rate of the loan and the discount accretion
• The chart below provides a comparison of the actual NIM earned compared to the NIM that would have been earned if it
reflected just the expected coupon rate and removes the negative accretion on the FDIC indemnification asset (prior to 4Q
2015), the “Adjusted NIM”
– This difference is the excess accretable yield (“EAY”)
– EAY is earned over the life of the loan
• For example, in 2Q 2016 Talmer’s NIM would have decreased by 0.45% from 3.73% to 3.28% if the EAY was not included
Net Interest Margin Trends
35
Excess Accretable Yield was a benefit of 48 bps for 1Q 2016 and 45 bps for 2Q 2016
(1) The accretable yield represents the excess of the net present value of expected future cash flows over the acquisition date fair value and includes both the expected coupon of the loan and the discount
accretion. The difference between the actual yield earned on total loans and the yield generated based on the expected coupon represents excess accretable yield. In addition, prior to the fourth
quarter of 2015, our net interest margin was adversely impacted by the negative yield on the FDIC indemnification asset. The negative yield on the FDIC indemnification asset partially offset the
benefits provided by the excess accretable yield discussed previously. Adjusted NIM is equal to the sum of the excess accretable yield and the negative yield on the FDIC indemnification asset.
4.89
4.40
4.74 4.73
3.74
4.03 4.11
3.72
3.95
4.34
4.05
3.89 3.80
3.50
3.76 3.89 3.73 3.73
4.22
3.95
4.09 4.01
3.36
3.68 3.59
3.36
3.90 3.72 3.70 3.64 3.76
3.41 3.46 3.37 3.25 3.28
2.00
2.50
3.00
3.50
4.00
4.50
5.00
5.50
6.00
1Q '12 2Q '12 3Q '12 4Q '12 1Q '13 2Q '13 3Q '13 4Q '13 1Q '14 2Q '14 3Q '14 4Q '14 1Q '15 2Q '15 3Q '15 4Q '15 1Q '16 2Q '16
N
I
M
(
%
)
Reported NIM Adjusted NIM
36
Effectiveness in Building Recurring Earnings Streams
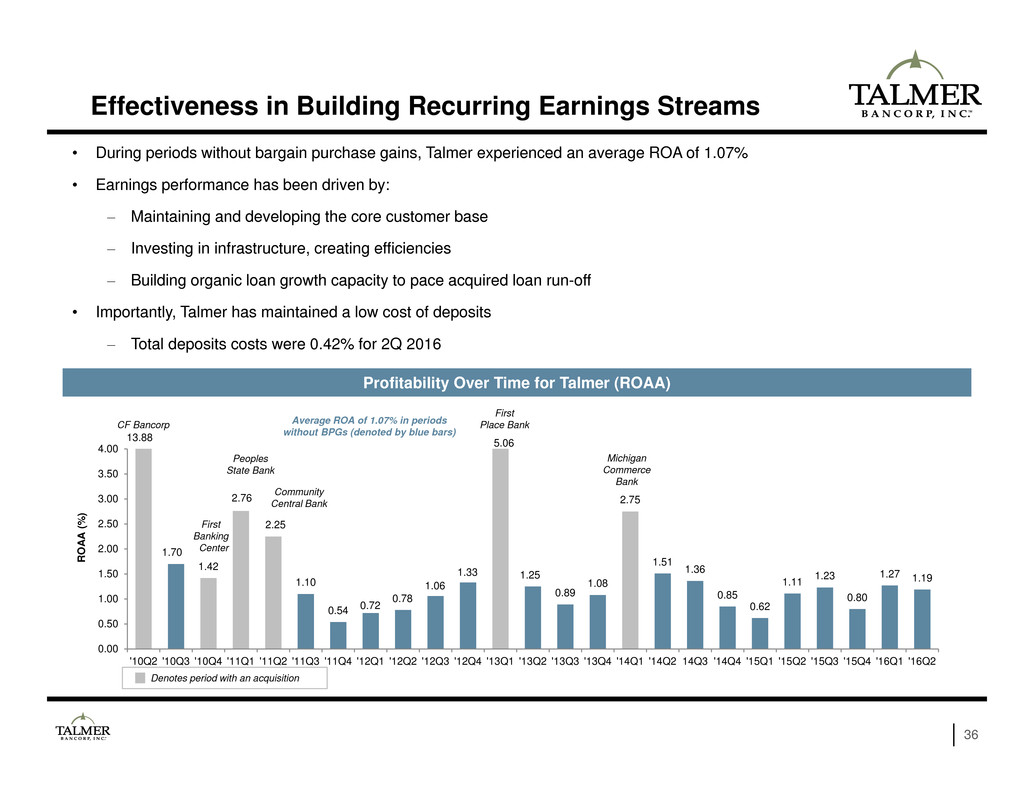
• During periods without bargain purchase gains, Talmer experienced an average ROA of 1.07%
• Earnings performance has been driven by:
– Maintaining and developing the core customer base
– Investing in infrastructure, creating efficiencies
– Building organic loan growth capacity to pace acquired loan run-off
• Importantly, Talmer has maintained a low cost of deposits
– Total deposits costs were 0.42% for 2Q 2016
Profitability Over Time for Talmer (ROAA)
13.88
Average ROA of 1.07% in periods
without BPGs (denoted by blue bars)
CF Bancorp
First
Banking
Center
Peoples
State Bank
Community
Central Bank
First
Place Bank
5.06
Michigan
Commerce
Bank
Denotes period with an acquisition
1.70
1.42
2.76
2.25
1.10
0.54 0.72
0.78
1.06
1.33 1.25
0.89
1.08
2.75
1.51
1.36
0.85
0.62
1.11 1.23
0.80
1.27 1.19
0.00
0.50
1.00
1.50
2.00
2.50
3.00
3.50
4.00
'10Q2 '10Q3 '10Q4 '11Q1 '11Q2 '11Q3 '11Q4 '12Q1 '12Q2 '12Q3 '12Q4 '13Q1 '13Q2 '13Q3 '13Q4 '14Q1 '14Q2 14Q3 '14Q4 '15Q1 '15Q2 '15Q3 '15Q4 '16Q1 '16Q2
R
O
A
A
(
%
)
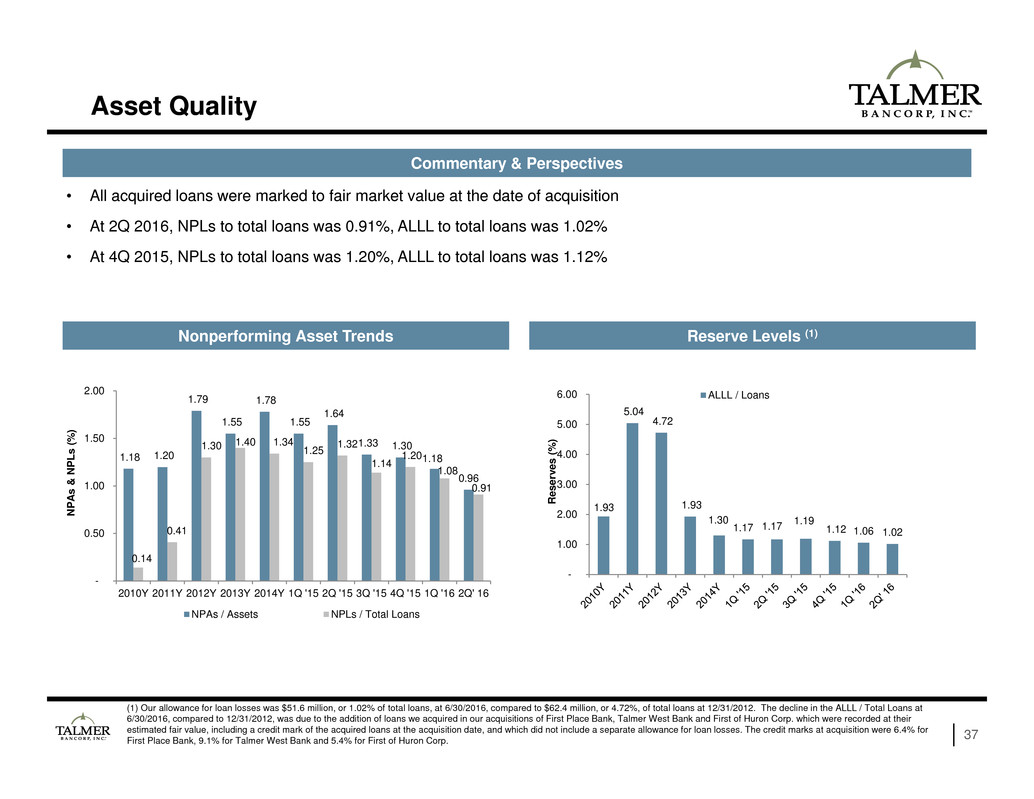
(1) Our allowance for loan losses was $51.6 million, or 1.02% of total loans, at 6/30/2016, compared to $62.4 million, or 4.72%, of total loans at 12/31/2012. The decline in the ALLL / Total Loans at
6/30/2016, compared to 12/31/2012, was due to the addition of loans we acquired in our acquisitions of First Place Bank, Talmer West Bank and First of Huron Corp. which were recorded at their
estimated fair value, including a credit mark of the acquired loans at the acquisition date, and which did not include a separate allowance for loan losses. The credit marks at acquisition were 6.4% for
First Place Bank, 9.1% for Talmer West Bank and 5.4% for First of Huron Corp. 37
Asset Quality
• All acquired loans were marked to fair market value at the date of acquisition
• At 2Q 2016, NPLs to total loans was 0.91%, ALLL to total loans was 1.02%
• At 4Q 2015, NPLs to total loans was 1.20%, ALLL to total loans was 1.12%
Commentary & Perspectives
Nonperforming Asset Trends Reserve Levels (1)
1.18 1.20
1.79
1.55
1.78
1.55
1.64
1.33 1.30
1.18
0.96
0.14
0.41
1.30 1.40 1.34 1.25
1.32
1.14
1.20
1.08
0.91
-
0.50
1.00
1.50
2.00
2010Y 2011Y 2012Y 2013Y 2014Y 1Q '15 2Q '15 3Q '15 4Q '15 1Q '16 2Q' 16
N
P
A
s
&
N
P
L
s
(
%
)
NPAs / Assets NPLs / Total Loans
1.93
5.04
4.72
1.93
1.30
1.17 1.17
1.19
1.12 1.06 1.02
-
1.00
2.00
3.00
4.00
5.00
6.00
R
e
s
e
r
v
e
s
(
%
)
ALLL / Loans
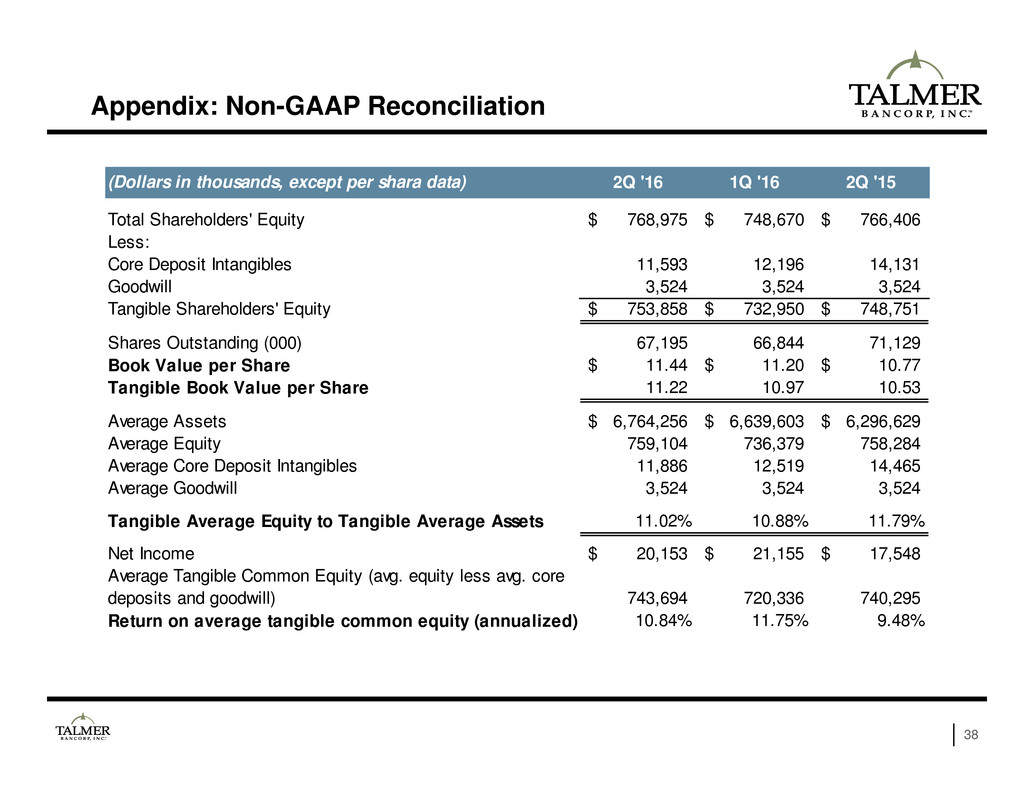
38
Appendix: Non-GAAP Reconciliation
(Dollars in thousands, except per shara data) 2Q '16 1Q '16 2Q '15
Total Shareholders' Equity 768,975$ 748,670$ 766,406$
Less:
Core Deposit Intangibles 11,593 12,196 14,131
Goodwill 3,524 3,524 3,524
Tangible Shareholders' Equity 753,858$ 732,950$ 748,751$
Shares Outstanding (000) 67,195 66,844 71,129
Book Value per Share 11.44$ 11.20$ 10.77$
Tangible Book Value per Share 11.22 10.97 10.53
Average Assets 6,764,256$ 6,639,603$ 6,296,629$
Average Equity 759,104 736,379 758,284
Average Core Deposit Intangibles 11,886 12,519 14,465
Average Goodwill 3,524 3,524 3,524
Tangible Average Equity to Tangible Average Assets 11.02% 10.88% 11.79%
Net Income 20,153$ 21,155$ 17,548$
Average Tangible Common Equity (avg. equity less avg. core
deposits and goodwill) 743,694 720,336 740,295
Return on average tangible common equity (annualized) 10.84% 11.75% 9.48%

39
Appendix: Non-GAAP Reconciliation
(Dollars in thousands, except per shara data) 2Q '16 1Q '16 2Q '15
Net interest income 57,394$ 56,098$ 49,609$
Noninterest income 17,240 13,624 22,098
Total revenue 74,634 69,722 71,707
Less:
(Expense)/benefit due to change in the fair value of loan
servicing rights (3,499) (6,625) 3,146
FDIC loss sharing income - - (5,928)
Total core revenue 78,133$ 76,347$ 74,489$
Total noninterest expense 45,929 48,270 53,293
Less:
Transaction and integration related costs 312 2,874 419
Property efficiency review - - 1,820
Total core noninterest expense 45,617$ 45,396$ 51,054$
Efficiency ratio 61.5% 69.2% 74.3%
Core efficiency ratio 58.4% 59.5% 68.5%
Diluted EPS available to common shareholders 0.28$ 0.30$ 0.23$
Impact to pre-tax net income due to non-core items listed above (3,811)$ (9,499)$ (5,021)$
Estimated income tax impact of above non-core items 1,212 3,022 1,597
Excess tax benefit realized 2,612 1,472 -
Benefit due to finaliztion of IRS settlement - 4,306
After-tax impact of non-core items 13 (699) (3,424)
Portion of non-core items applicable to common shareholders - (21) (34)
Impact of non-core items applicable to common shareholders 13 (720) (3,458)
Weighted average common shares outstanding - diluted 70,026 69,706 74,900
Impact to diluted EPS of non-core items -$ (0.01)$ (0.05)$
Core diluted EPS of non-core items 0.28$ 0.31$ 0.28$
