Attached files
| file | filename |
|---|---|
| 8-K - FORM 8-K - PREMIER FINANCIAL CORP | v445781_8k.htm |
Exhibit 99

Donald P. Hileman President & Chief Executive Officer Kevin T. Thompson Executive Vice President & Chief Financial Officer KBW Community Bank Investor Conference August 2016 Exhibit 99

The issuer has filed a registration statement including a prospectus, and will file a related supplement with the Securities and Exchange Commission (“SEC”), for the offering to which this communication relates. Before you invest, you should read the prospectus, the prospectus supplement and any other documents the issuer has filed or will file with the SEC for more complete information about the issuer and this offering. This presentation may contain certain forward - looking statements within the meaning of Section 27A of the Securities Act of 1933, as amended, and Section 21B of the Securities Exchange Act of 1934, as amended, which are intended to be safe harbors created thereby. Those statements may include, but are not limited to, all statements regarding intent, beliefs, expectations, projections, forecasts and plans of First Defiance Financial Corp. and its management, and specifically include statements regarding: changes in economic conditions, the nature, extent and timing of governmental actions and reforms, future movements of interest rates, the production levels of mortgage loan generation, the ability to grow loans and deposits, the ability to benefit from a changing interest rate environment, the ability to sustain credit quality ratios at current or improved levels, the ability to sell OREO properties, the continued strength of First Federal Bank of the Midwest in its market area, and the ability of First Defiance to grow in existing and adjacent markets. These forward - looking statements involve numerous risks and uncertainties, including those inherent in general and local banking, insurance and mortgage conditions, competitive factors specific to markets in which First Defiance and its subsidiaries operate, future interest rate levels, legislative and regulatory decisions or capital market conditions and other risks and uncertainties detailed from time to time in the First Defiance’s SEC filings, including First Defiance’s Annual Report on Form 10 - K for the year ended December 31, 2015. One or more of these factors have affected or could in the future affect First Defiance’s business and financial results and could cause actual results to differ materially from plans and projections. Therefore, there can be no assurances that the forward - looking statements included in this investor presentation will prove to be accurate. In light of significant uncertainties in the forward - looking statements included herein, the inclusion of such information should not be regarded as a representation by First Defiance or any other persons, that the objectives and plans of First Defiance will be achieved. All forward - looking statement made in this investor presentation are based on information presently available to the management of First Defiance. First Defiance assumes no obligation to update any forward - looking statements. Forward - Looking Statements 2

Company Overview 3
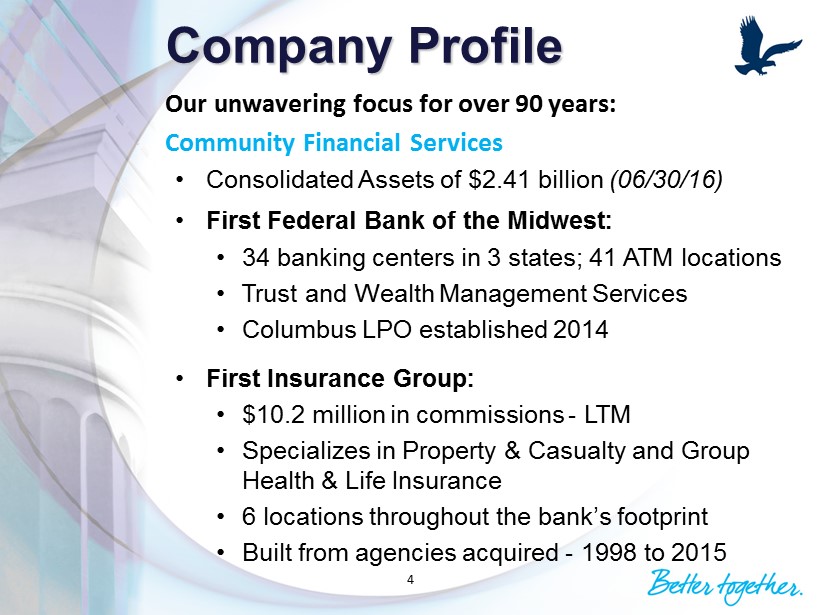
Company Profile 4 Our unwavering focus for over 90 years: Community Financial Services • Consolidated Assets of $2.41 billion (06/30/16) • First Federal Bank of the Midwest: • 34 banking centers in 3 states; 41 ATM locations • Trust and Wealth Management Services • Columbus LPO established 2014 • First Insurance Group: • $10.2 million in commissions - LTM • Specializes in Property & Casualty and Group Health & Life Insurance • 6 locations throughout the bank’s footprint • Built from agencies acquired - 1998 to 2015

Investment Highlights • Community leaders with deep roots in the communities we have served since the 1920s • Experienced and disciplined management team • Strong tangible capital levels • Stable core deposit base, changing mix • Historically stable and strong net interest margin • Strong and diversified balance sheet • Market leader in northwest Ohio 5
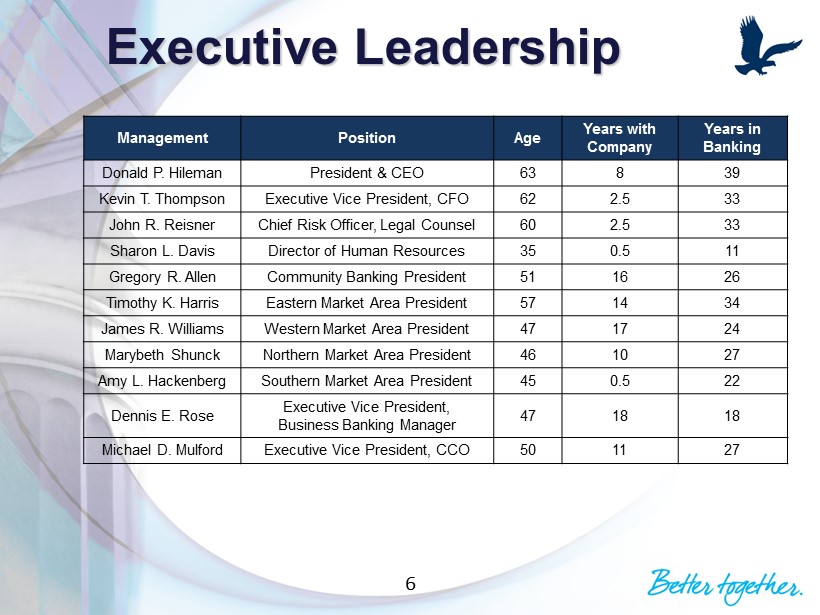
Executive Leadership 6 Management Position Age Years with Company Years in Banking Donald P. Hileman President & CEO 63 8 39 Kevin T. Thompson Executive Vice President, CFO 62 2.5 33 John R. Reisner Chief Risk Officer, Legal Counsel 60 2.5 33 Sharon L. Davis Director of Human Resources 35 0.5 11 Gregory R. Allen Community Banking President 51 16 26 Timothy K. Harris Eastern Market Area President 57 14 34 James R. Williams Western Market Area President 47 17 24 Marybeth Shunck Northern Market Area President 46 10 27 Amy L. Hackenberg Southern Market Area President 45 0.5 22 Dennis E. Rose Executive Vice President, Business Banking Manager 47 18 18 Michael D. Mulford Executive Vice President, CCO 50 11 27
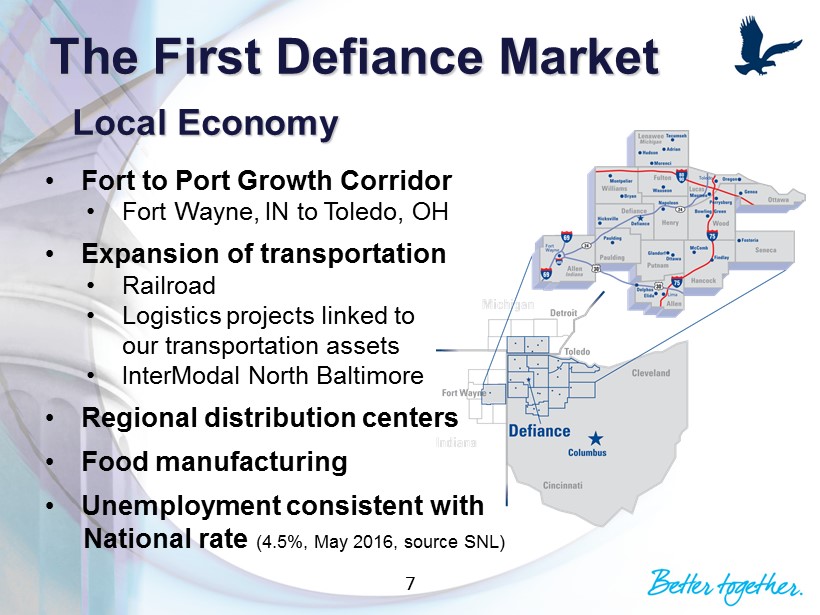
The First Defiance Market 7 • Fort to Port Growth Corridor • Fort Wayne, IN to Toledo, OH • Expansion of transportation • Railroad • Logistics projects linked to our transportation assets • InterModal North Baltimore • Regional distribution centers • Food manufacturing • Unemployment consistent with National rate (4.5%, May 2016, source SNL) Local Economy
Strategic Focus • Profitability High performance objectives for revenue growth, expense control and maintaining strong asset quality • Organic Growth Targeting newer markets, new relationships, enhanced delivery and deeper relationships in more established markets • Shareholder Value Enhancement Effective capital management supporting growth, dividend increases and share repurchases • Emphasis on the Community Bank Difference 8
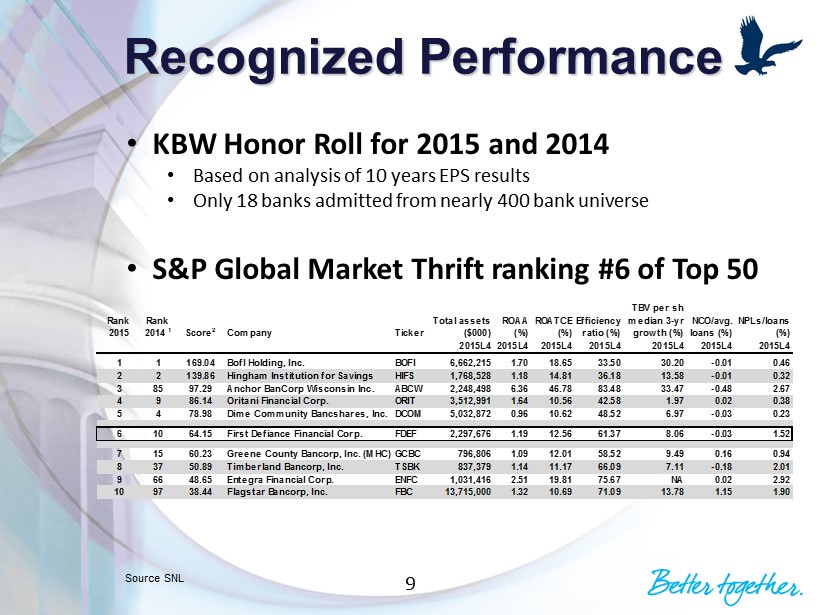
Recognized Performance Source SNL 9 • KBW Honor Roll for 2015 and 2014 • Based on analysis of 10 years EPS results • Only 18 banks admitted from nearly 400 bank universe • S&P Global Market Thrift ranking #6 of Top 50 Rank 2015 Rank 2014 1 Score2 Company Ticker Total assets ($000) ROAA (%) ROATCE (%) Efficiency ratio (%) TBV per sh median 3-yr growth (%) NCO/avg. loans (%) NPLs/loans (%) 2015L4 2015L4 2015L4 2015L4 2015L4 2015L4 2015L4 1 1 169.04 BofI Holding, Inc. BOFI 6,662,215 1.70 18.65 33.50 30.20 -0.01 0.46 2 2 139.86 Hingham Institution for Savings HIFS 1,768,528 1.18 14.81 36.18 13.58 -0.01 0.32 3 85 97.29 Anchor BanCorp Wisconsin Inc. ABCW 2,248,498 6.36 46.78 83.48 33.47 -0.48 2.67 4 9 86.14 Oritani Financial Corp. ORIT 3,512,991 1.64 10.56 42.58 1.97 0.02 0.38 5 4 78.98 Dime Community Bancshares, Inc. DCOM 5,032,872 0.96 10.62 48.52 6.97 -0.03 0.23 6 10 64.15 First Defiance Financial Corp. FDEF 2,297,676 1.19 12.56 61.37 8.06 -0.03 1.52 7 15 60.23 Greene County Bancorp, Inc. (MHC)GCBC 796,806 1.09 12.01 58.52 9.49 0.16 0.94 8 37 50.89 Timberland Bancorp, Inc. TSBK 837,379 1.14 11.17 66.09 7.11 -0.18 2.01 9 66 48.65 Entegra Financial Corp. ENFC 1,031,416 2.51 19.81 75.67 NA 0.02 2.92 10 97 38.44 Flagstar Bancorp, Inc. FBC 13,715,000 1.32 10.69 71.09 13.78 1.15 1.90

Consistent Profitability Source: Press Release 10 Second Quarter Results 2016 2015 Diluted EPS 0.80$ 0.70$ ROAA 1.22% 1.19% ROAE 10.34% 9.60% Net Interest Margin - TE 3.71% 3.81% Efficiency Ratio 61.51% 63.02% Net C/Os to Avg Loans -0.05% -0.02%

Strong Sales & Service Delivery 11 • Committed to earning our position as Trusted Advisors to our clients and creating long - term profitable relationships • Customer retention rate over 90% for last 7 years • Committed to enhancing customer experiences through technology advancements • Touch ID • Apple Pay • Mobile Wallet • M obile Deposit • Online Account Opening • EMV Cards • 29% growth in mobile banking year over year • Committed to reaching more customers through digital channel development • 49% of our transactions are now outside of the branch • Committed to growing our communities through our people • Financial literacy champions – sponsoring 14 schools for EverFi Financial Education reaching over 870 students, Junior Achievement and other events

Earned Market Share Strong Positions in Legacy Markets By County Counties Deposits % of FDEF Ranked #1 & #2 5 883,233 50% Ranked #3 & #4 4 645,629 36% Ranked #5 or above 5 251,882 14% By Metro Market Deposits % of Market Toledo MSA 288,800 2.9% Ft Wayne MSA 28,167 0.4% Source SNL data as of April 27, 2016 12 With Significant New Opportunities
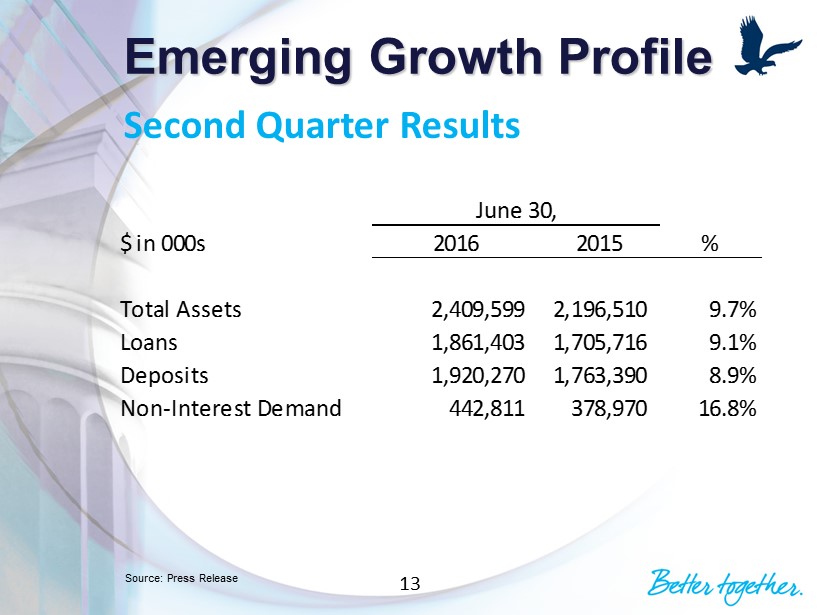
Emerging Growth Profile Second Quarter Results Source: Press Release 13 June 30, $ in 000s 2016 2015 % Total Assets 2,409,599 2,196,510 9.7% Loans 1,861,403 1,705,716 9.1% Deposits 1,920,270 1,763,390 8.9% Non-Interest Demand 442,811 378,970 16.8%

Strong Shareholder Returns First Defiance Financial Corp. – Total Return (%) First Defiance Financial Corp. (FDEF) SNL U.S. Banks $1B - $5B Includes all Major Exchange (NYSE, NYSE MKT, NASDAQ) Banks in SNL's coverage universe with $1B to $5B in Assets as of most recent financial data. Source SNL data as of July 15, 2016 – Five year 14

Top Five 2016 Initiatives 15 1. Relationship Management • Focus Sales Training and develop Sales Management System 2. Alternative Delivery • Expand digital banking solutions and facilitate customer education 3. Branch Transformation • Adapt sales and service models for improved banking experience 4. Metro Market Growth • Build brand awareness and grow market share 5. Deposit Growth • Maintain focus on core organic growth

Financial Highlights 16

Net Income & Earnings Per Share $15,534 $18,664 $22,235 $24,292 $26,423 $14,433 $1.42 $1.81 $2.19 $2.44 $2.82 $1.59 $0.50 $1.00 $1.50 $2.00 $2.50 $3.00 $0 $5,000 $10,000 $15,000 $20,000 $25,000 $30,000 2011 2012 2013 2014 2015 YTD 2016 Line Graph = Diluted EPS Source : Press releases (Net Income in thousands) 17 2016 data YTD as of 06/30/16

Total Assets & Return On Assets $2,068 $2,047 $2,137 $2,179 $2,298 $2,410 0.75% 0.90% 1.08% 1.12% 1.19% 1.23% 0.00% 0.25% 0.50% 0.75% 1.00% 1.25% 1.50% $0 $500 $1,000 $1,500 $2,000 $2,500 2011 2012 2013 2014 2015 YTD 2016 Line Graph = ROA Source : Press releases (In millions) 18 2016 data YTD as of 06/30/16
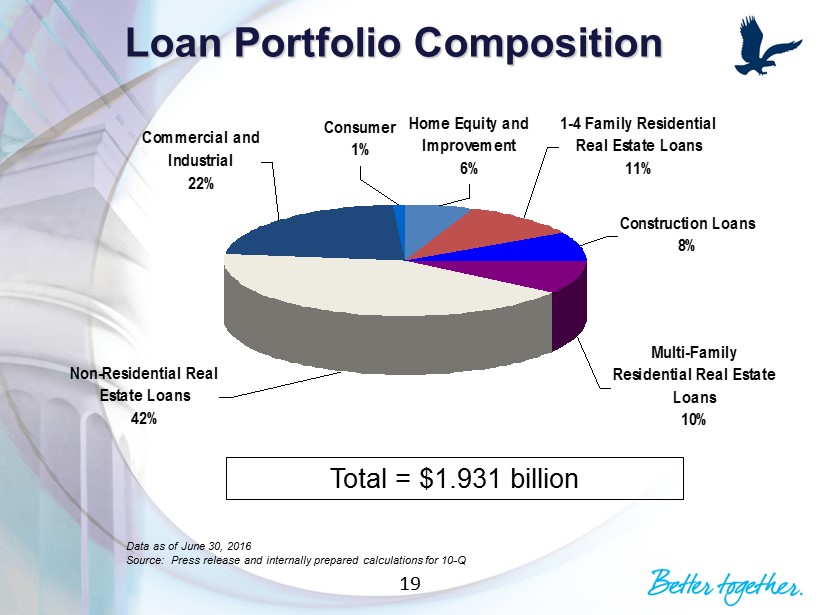
Loan Portfolio Composition Commercial and Industrial 22% Non-Residential Real Estate Loans 42% Multi-Family Residential Real Estate Loans 10% Consumer 1% Construction Loans 8% 1-4 Family Residential Real Estate Loans 11% Home Equity and Improvement 6% Data as of June 30, 2016 Source: Press release and internally prepared calculations for 10 - Q Total = $ 1.931 billion 19

$42,956 $36,375 $33,706 $30,311 $17,582 $17,502 2.08% 1.78% 1.58% 1.39% 0.77% 0.73% 0.00% 0.50% 1.00% 1.50% 2.00% 2.50% 3.00% 3.50% $0 $10,000 $20,000 $30,000 $40,000 $50,000 $60,000 2011 2012 2013 2014 2015 2016 Line Graph = NPA/Total Assets Source : Press releases Non - performing Assets & NPAs/Assets (In thousands) 20 2016 data as of 06/30/16

Net Charge - Offs/Avg. Loans 1.41% 1.18% 0.23% 0.08% - 0.03% - 0.02% -0.20% 0.30% 0.80% 1.30% 1.80% 2011 2012 2013 2014 2015 2016 2016 data YTD as of 06/30/16 Source: Press releases 21

Allowance & Coverage of NPLs $33,254 $26,711 $24,950 $24,766 $25,382 $25,948 84.6% 82.0% 89.6% 102.6% 156.1% 158.0% 0.00% 25.00% 50.00% 75.00% 100.00% 125.00% 150.00% 175.00% $0 $10,000 $20,000 $30,000 $40,000 $50,000 2011 2012 2013 2014 2015 2016 (In thousands) Line Graph = Allowance/NPLs Source : Press releases 22 2016 data as of 06/30/16

Quality Securities Portfolio US Government 1% CMO's 30% CDO's 5% MBS's 27% Municipals 37% Data as of June 30, 2016 Source: Press releases and internally prepared calculations for 10 - Q Total = $ 228.2 million 23

Total Deposits & Non - Interest Bearing % 24 $1,596 $1,667 $1,736 $1,761 $1,836 $1,920 20.1% 15.4% 18.9% 21.6% 22.9% 23.1% 0% 10% 20% 30% 40% 50% 60% 70% 80% 90% 100% $500 $1,000 $1,500 $2,000 2011 2012 2013 2014 2015 2016 (In millions) Line Graph = Non - Interest Deposits as % of Total Deposits Source : Press releases 2016 data as of 06/30/16
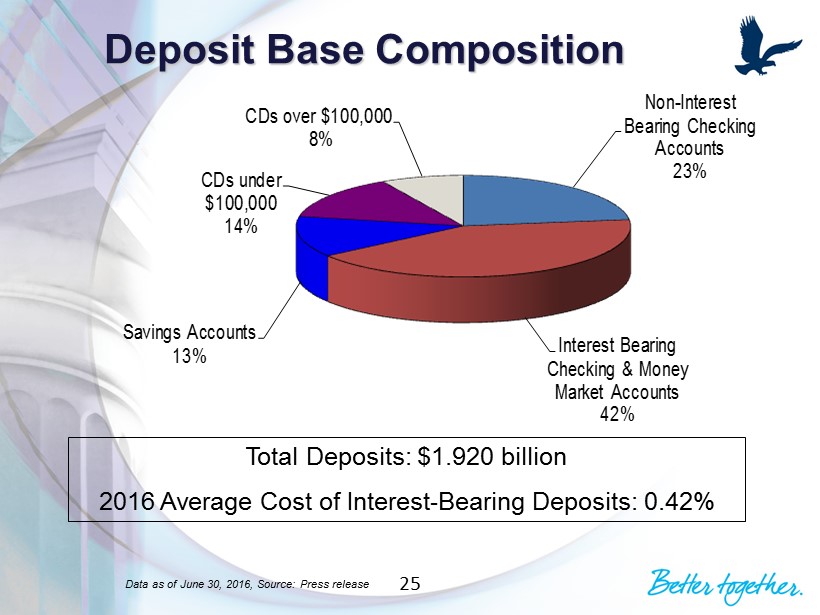
Deposit Base Composition Non - Interest Bearing Checking Accounts 23% Interest Bearing Checking & Money Market Accounts 42% Savings Accounts 13% CDs under $100,000 14% CDs over $100,000 8% Total Deposits: $ 1.920 billion 2016 Average Cost of Interest - Bearing Deposits: 0.42% Data as of June 30, 2016, Source: Press release 25
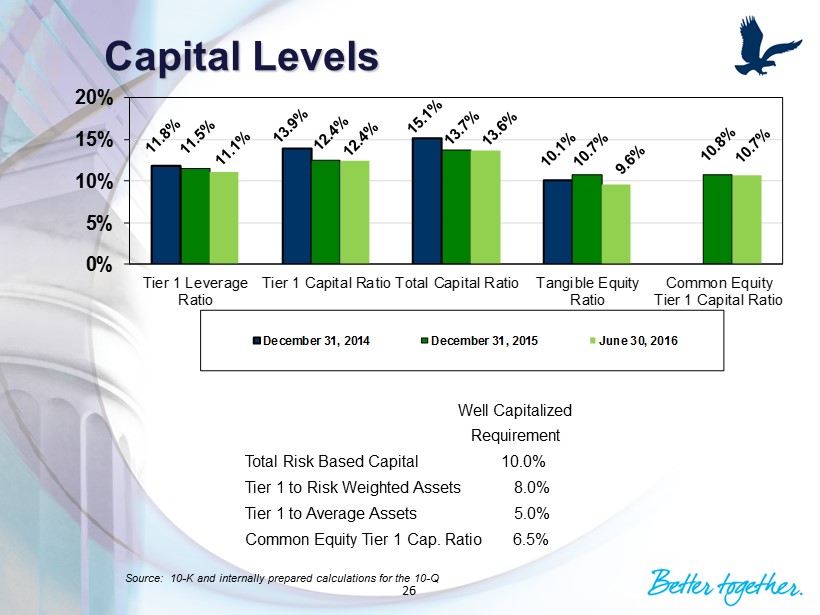
Capital Levels 0% 5% 10% 15% 20% Tier 1 Leverage Ratio Tier 1 Capital Ratio Total Capital Ratio Tangible Equity Ratio Common Equity Tier 1 Capital Ratio December 31, 2014 December 31, 2015 June 30, 2016 Well Capitalized Requirement Total Risk Based Capital 10.0% Tier 1 to Risk Weighted Assets 8.0% Tier 1 to Average Assets 5.0% Common Equity Tier 1 Cap. Ratio 6.5% Source: 10 - K and internally prepared calculations for the 10 - Q 26

Net Interest Income & Margin $71,360 $70,661 $69,243 $71,487 $75,960 $38,584 3.88% 3.81% 3.76% 3.68% 3.81% 3.75% 2.50% 3.00% 3.50% 4.00% 4.50% $0 $10,000 $20,000 $30,000 $40,000 $50,000 $60,000 $70,000 $80,000 $90,000 2011 2012 2013 2014 2015 YTD 2016 (In thousands) Bar Graph = Tax - Equivalent Net Int. Inc., Line Graph = Net Interest Margin Source : Press releases 27 2016 data YTD as of 06/30/16

Non - Interest Income & Pct of Total Revenue $27,300 $32,240 $31,018 $30,709 $31,781 $16,853 28.1% 31.8% 31.4% 30.6% 30.0% 30.4% 0.0% 10.0% 20.0% 30.0% 40.0% 50.0% 60.0% 70.0% 80.0% 90.0% 100.0% $0 $5,000 $10,000 $15,000 $20,000 $25,000 $30,000 $35,000 $40,000 2011 2012 2013 2014 2015 YTD 2016 (In thousands) Non - Interest Income excluding securities gains/losses and impairment on securities Line Graph = Non - Interest Income as a % of Revenue Source : Press releases 28 2016 data YTD as of 06/30/16

Non - Interest Expense & Efficiency Ratio $62,764 $65,780 $65,052 $66,758 $67,889 $34,621 63.6% 63.9% 64.8% 65.3% 63.0% 61.4% 10% 20% 30% 40% 50% 60% 70% 80% 90% $0 $10,000 $20,000 $30,000 $40,000 $50,000 $60,000 $70,000 2011 2012 2013 2014 2015 YTD 2016 (In thousands) Line Graph = Efficiency Ratio Source : Press releases 29 2016 data YTD as of 06/30/16

Return On Equity & ROTE 5.89% 6.99% 8.39% 8.78% 9.52% 10.34% 7.84% 9.32% 11.15% 11.46% 12.35% 13.20% 0.00% 1.00% 2.00% 3.00% 4.00% 5.00% 6.00% 7.00% 8.00% 9.00% 10.00% 11.00% 12.00% 13.00% 14.00% 15.00% 0.00% 1.00% 2.00% 3.00% 4.00% 5.00% 6.00% 7.00% 8.00% 9.00% 10.00% 11.00% 12.00% 13.00% 14.00% 15.00% 2011 2012 2013 2014 2015 YTD 2016 Line Graph = Return On Tangible Equity Source : Press releases 30 2016 data YTD as of 06/30/16

Shareholder Value 31
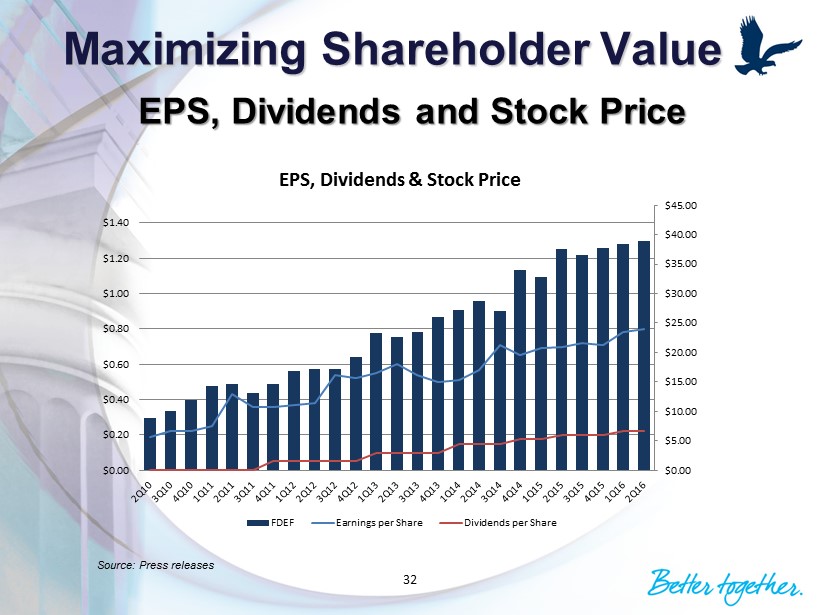
Maximizing Shareholder Value 32 EPS, Dividends and Stock Price Source: Press releases $0.00 $5.00 $10.00 $15.00 $20.00 $25.00 $30.00 $35.00 $40.00 $45.00 $0.00 $0.20 $0.40 $0.60 $0.80 $1.00 $1.20 $1.40 EPS, Dividends & Stock Price FDEF Earnings per Share Dividends per Share

Maximizing Shareholder Value Strong Five Year Returns First Defiance Financial Corp. – Total Return (%) With Upside Opportunity First Defiance Financial Corp. – Price/EPS (X) First Defiance Financial Corp. (FDEF) SNL U.S. Banks $1B - $5B Includes all Major Exchange (NYSE, NYSE MKT, NASDAQ) Banks in SNL's coverage universe with $1B to $5B in Assets as of most recent financial data. Source SNL data as of July 15, 2016 – Five year 33

Source SNL data as of July 15, 2016 Investment Opportunity 34 SNL Index FDEF $1B - $5B Price / Earnings 12.6x 17.8x Price / Book 126.0% 142.2% Price / Tangible Book 162.8% 163.2% Dividend Yield 2.2% 1.9% Maximizing Shareholder Value

Summary • Disciplined management team with proven track record • Reputation of focusing on fundamentals • Strong capital levels • Balance sheet strength – attractive core deposit base • Balanced loan portfolio with a disciplined approach to lending • Well - positioned to grow our balance sheet and geographic footprint, enhancing long - term shareholder value 35

Contact Information 36 Donald P. Hileman , President and CEO (419) 785 - 2210 dhileman@first - fed.com Kevin T. Thompson , Executive Vice President and CFO (419) 783 - 1098 kthompson@first - fed.com