Attached files
| file | filename |
|---|---|
| EX-99.1 - EXHIBIT 99.1 - BEACON ROOFING SUPPLY INC | v445717_ex99-1.htm |
| 8-K - FORM 8-K - BEACON ROOFING SUPPLY INC | v445717_8k.htm |
Exhibit 99.2

2016 Third Quarter Earnings Call August 2, 2016 www.BeaconRoofingSupply.com 2016 Third Quarter Earnings Call August 2 , 2016

2016 Third Quarter Earnings Call August 2, 2016 www.BeaconRoofingSupply.com Highlights □ Record third quarter net sales of $1.15 billion, 60.5% above prior year □ First quarter in Company history with $1 billion in sales □ Organic growth of 8.7% in existing markets □ Gross margin improvement of 90 basis points to 24.5% of sales □ EPS of $0.68 ($0.77 adjusted) vs. $0.56 in prior year □ Third quarter net income grew to $41.1 million from $28.3 million in prior year □ Third quarter adjusted EBITDA grew to $109.6 million from $60.0 million in prior year □ RSG integration and synergy realization on track □ Completed eight acquisitions year to date in Fiscal 2016 1
2016 Third Quarter Earnings Call August 2, 2016 www.BeaconRoofingSupply.com 19.8% of Sales RSG Integration Update □ Branch consolidation activities almost complete □ ERP system conversion complete □ Successfully migrating RSG branches to Beacon operating structure □ Minimal loss of net sales post - consolidation □ Synergy realization is on target to exceed expectations □ Notable improvement in RSG gross margins vs. prior year under Beacon supply chain contracts 2
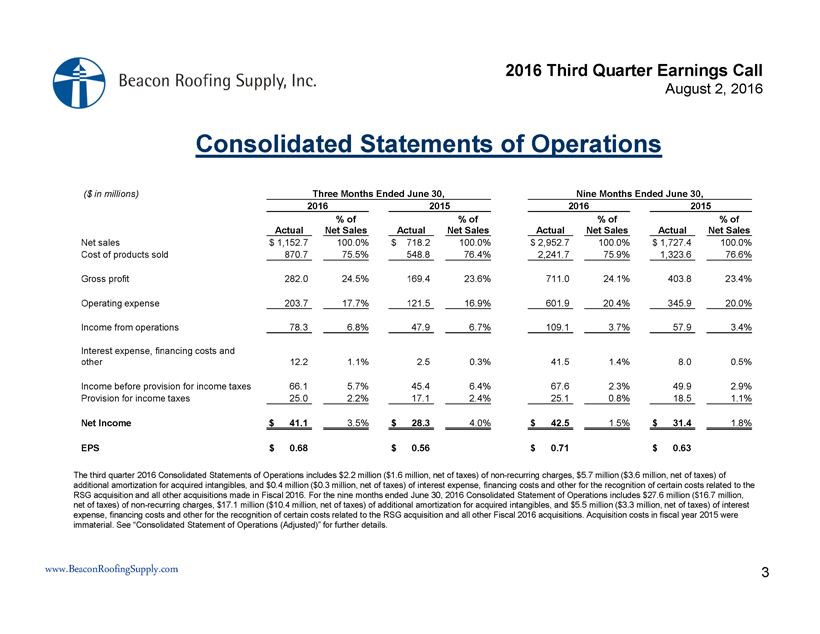
2016 Third Quarter Earnings Call August 2, 2016 www.BeaconRoofingSupply.com Consolidated Statements of Operations 3 ($ in millions) Three Months Ended June 30, Nine Months Ended June 30, 2016 2015 2016 2015 Actual % of Net Sales Actual % of Net Sales Actual % of Net Sales Actual % of Net Sales Net sales $ 1,152.7 100.0% $ 718.2 100.0% $ 2,952.7 100.0% $ 1,727.4 100.0% Cost of products sold 870.7 75.5% 548.8 76.4% 2,241.7 75.9% 1,323.6 76.6% Gross profit 282.0 24.5% 169.4 23.6% 711.0 24.1% 403.8 23.4% Operating expense 203.7 17.7% 121.5 16.9% 601.9 20.4% 345.9 20.0% Income from operations 78.3 6.8% 47.9 6.7% 109.1 3.7% 57.9 3.4% Interest expense, financing costs and other 12.2 1.1% 2.5 0.3% 41.5 1.4% 8.0 0.5% Income before provision for income taxes 66.1 5.7% 45.4 6.4% 67.6 2.3% 49.9 2.9% Provision for income taxes 25.0 2.2% 17.1 2.4% 25.1 0.8% 18.5 1.1% Net Income $ 41.1 3.5% $ 28.3 4.0% $ 42.5 1.5% $ 31.4 1.8% EPS $ 0.68 $ 0.56 $ 0.71 $ 0.63 The third quarter 2016 Consolidated Statements of Operations includes $2.2 million ($1.6 million, net of taxes) of non - recurring cha rges, $5.7 million ($3.6 million, net of taxes) of additional amortization for acquired intangibles, and $0.4 million ($0.3 million, net of taxes) of interest expense, financin g c osts and other for the recognition of certain costs related to the RSG acquisition and all other acquisitions made in Fiscal 2016. For the nine months ended June 30, 2016 Consolidated Statemen t o f Operations includes $27.6 million ($16.7 million, net of taxes) of non - recurring charges, $17.1 million ($10.4 million, net of taxes) of additional amortization for acquired inta ngibles, and $5.5 million ($3.3 million, net of taxes) of interest expense, financing costs and other for the recognition of certain costs related to the RSG acquisition and all other Fiscal 2 016 acquisitions. Acquisition costs in fiscal year 2015 were immaterial. See “Consolidated Statement of Operations (Adjusted)” for further details.

2016 Third Quarter Earnings Call August 2, 2016 www.BeaconRoofingSupply.com Consolidated Statements of Operations (Adjusted) 4 The above presentation excludes non - recurring charges, additional amortization for acquired intangibles, interest expense, financing costs and certain other expenses related to the RSG acquisition and all other acquisitions made in Fiscal 2016. Acquisition costs in fiscal year 2015 were immaterial. See “Reconciliation of GAAP to Adjusted” for further detail. ($ in millions) Three Months Ended June 30, Nine Months Ended June 30, 2016 2015 2016 2015 Actual (Adjusted) % of Net Sales Actual (Adjusted) % of Net Sales Actual (Adjusted) % of Net Sales Actual (Adjusted) % of Net Sales Net sales $ 1,152.7 100.0% $ 718.2 100.0% $ 2,952.7 100.0% $ 1,727.4 100.0% Cost of products sold 870.7 75.5% 548.8 76.4% 2,241.7 75.9% 1,323.6 76.6% Gross profit 282.0 24.5% 169.4 23.6% 711.0 24.1% 403.8 23.4% Operating expense 195.8 17.0% 121.5 16.9% 557.2 18.9% 345.9 20.0% Income from operations 86.2 7.5% 47.9 6.7% 153.8 5.2% 57.9 3.4% Interest expense, financing costs and other 11.8 1.0% 2.5 0.3% 36.0 1.2% 8.0 0.5% Income before provision for income taxes 74.4 6.5% 45.4 6.3% 117.8 4.0% 49.9 2.9% Provision for income taxes 27.8 2.4% 17.1 2.4% 44.9 1.5% 18.5 1.1% Adjusted Net Income $ 46.6 4.1% $ 28.3 3.9% $ 72.9 2.5% $ 31.4 1.8% Adjusted EPS $ 0.77 $ 0.56 $ 1.21 $ 0.63

2016 Third Quarter Earnings Call August 2, 2016 www.BeaconRoofingSupply.com 0% 20% 40% 60% 80% 100% FY 2016 FY 2015 14.9% 15.2% 32.7% 34.5% 52.4% 50.3% Residential Roofing Non-Residential Roofing Complementary $- $100 $200 $300 $400 $500 $600 $700 $800 FY 2016 FY 2015 $725.2 $666.9 $177.5 $158.3 Sales Gross Profit / Margin Quarterly Results Existing Market Product Mix Northeast (5.3%) Mid-Atlantic 6.6% Southeast 20.4% Southwest 45.9% Midwest 1.1% West 10.3% Canada (2.6%) Total 8.7% Existing Market Sales Growth (Decline) $ in millions 23.7% Existing Market Sales, Gross Profit & Gross Margin 24.5% Existing Market results above exclude growth from acquired branches until they have been under ownership for at least four full fiscal quarters at the start of the fiscal reporting period. 5

2016 Third Quarter Earnings Call August 2, 2016 www.BeaconRoofingSupply.com $- $20 $40 $60 $80 $100 $120 $140 FY 2016 FY 2015 $120.3 $112.6 $ in millions 16.6% of Sales 16.9% of Sales Existing Market Operating Expenses Quarterly Results Existing Market results above exclude growth from acquired branches until they have been under ownership for at least four full fiscal quarters at the start of the fiscal reporting period. Payroll, employee benefits, stock comp 7.5$ Bad debt expense 1.9 Greenfields 0.2 Amortization & depreciation (0.7) Selling expense & other (1.2) Total 7.7$ Operating Expense Increase (Decrease) 6

2016 Third Quarter Earnings Call August 2, 2016 www.BeaconRoofingSupply.com 19.8% of Sales RSG Synergy Highlights $25 $0 $10 $20 $30 $40 $50 $60 FY16 YTD Act FY16 Goal FY17 Goal in millions 7 ~$35 ~$55

2016 Third Quarter Earnings Call August 2, 2016 www.BeaconRoofingSupply.com (In millions) Q3 2016 YTD 2016 P&L Line Item Integration Costs $1.6 $21.2 Misc. SG&A $1.6 $16.9 Op Ex Stock Comp. Expense $0.0 $4.3 Op Ex Transaction Costs $1.0 $11.9 Misc. SG&A $0.6 $5.6 Op Ex Interest Expense $0.4 $5.5 Other (income) / expense (Gain) / Loss on Assets $0.0 $0.8 Op Ex Incremental Amortization $5.7 $17.1 Op Ex Total $8.3 $50.2 Acquisition costs reflected on a pre - tax basis RSG and Other Fiscal 2016 Acquisition Costs 8
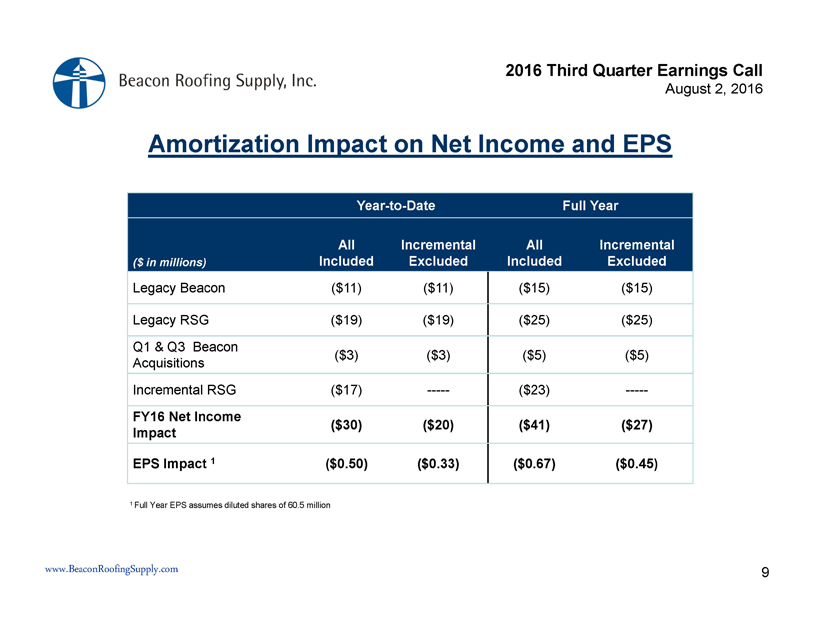
2016 Third Quarter Earnings Call August 2, 2016 www.BeaconRoofingSupply.com Year - to - Date Full Year ($ in millions) All Included Incremental Excluded All Included Incremental Excluded Legacy Beacon ($11) ($11) ($15) ($15) Legacy RSG ($19) ($19) ($25) ($25) Q1 & Q3 Beacon Acquisitions ($3) ($3) ($5) ($5) Incremental RSG ($17) ----- ($23) ----- FY16 Net Income Impact ($30) ($20) ($41) ($27) EPS Impact 1 ($0.50) ($0.33) ($0.67) ($0.45) 1 Full Year EPS assumes diluted shares of 60.5 million Amortization Impact on Net Income and EPS 9

2016 Third Quarter Earnings Call August 2, 2016 www.BeaconRoofingSupply.com $- $20 $40 $60 $80 FY 2015 FY 2016 $74.4 $11.2 in millions Cash Flow From Operations YTD Results CF from Ops $31.9 ($20.3) Non - Cash & WC Adj. $42.5 $31.5 Net Income FY 2016 FY 2015 10
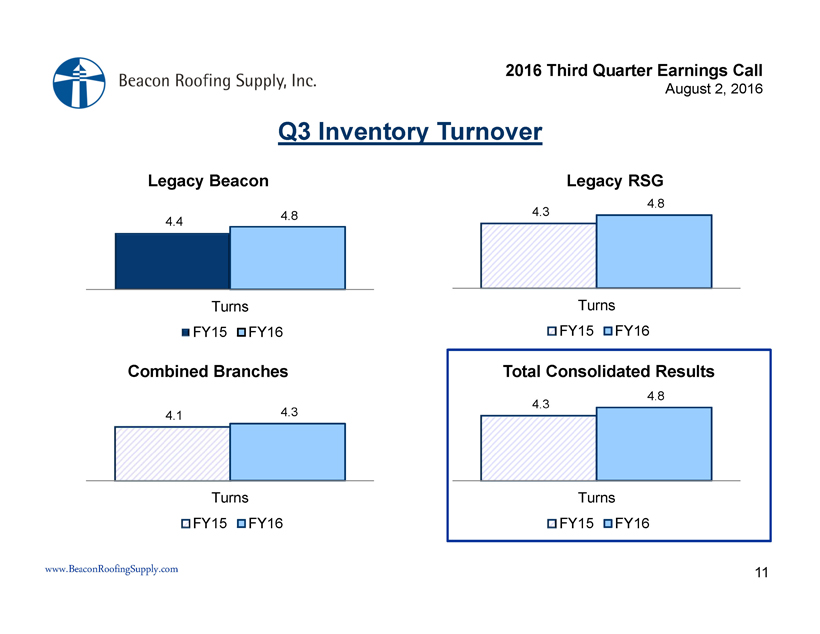
2016 Third Quarter Earnings Call August 2, 2016 www.BeaconRoofingSupply.com Q3 Inventory Turnover 4.4 4.8 Turns FY15 FY16 Legacy Beacon 4.3 4.8 Turns FY15 FY16 4.1 4.3 Turns FY15 FY16 Legacy RSG Combined Branches 11 Total Consolidated Results 4.3 4.8 Turns FY15 FY16

2016 Third Quarter Earnings Call August 2, 2016 www.BeaconRoofingSupply.com 19.8% of Sales Net Debt Leverage Ratio 1 4.3x 4.2x 3.6x 3.6x 2.0x 10/1/2015 PF 12/31/2015 3/31/2016 6/30/2016 FY18 Goal 1 Net Debt leverage calculation = Total debt net of cash / Trailing 4 quarter Proforma EBITDA □ Over $77 million in acquisitions □ Third quarter represents peak working capital usage □ Maintained net debt leverage ratio 12 Third Quarter Highlights:

2016 Third Quarter Earnings Call August 2, 2016 www.BeaconRoofingSupply.com 0% 20% 40% 60% 80% 100% FY 2016 FY 2015 16.1% 16.6% 33.6% 34.8% 50.3% 48.6% Residential Roofing Non-Residential Roofing Complementary $- $200 $400 $600 $800 $1,000 $1,200 $1,400 $1,600 $1,800 $2,000 FY 2016 FY 2015 $1,808.8 $1,588.1 $441.8 $373.3 Sales Gross Profit / Margin Year - to - Date Results Existing Market Product Mix Northeast 11.9% Mid-Atlantic 13.1% Southeast 30.5% Southwest 29.7% Midwest 3.0% West 18.1% Canada (2.1%) Total 13.9% Existing Market Sales Growth (Decline) $ in millions 23.5% Existing Market Sales, Gross Profit & Gross Margin 24.4% Existing Market results above exclude growth from acquired branches until they have been under ownership for at least four full fiscal quarters at the start of the fiscal reporting period. 13 * Sales growth 13.3% on a same day basis

2016 Third Quarter Earnings Call August 2, 2016 www.BeaconRoofingSupply.com $- $50 $100 $150 $200 $250 $300 $350 FY 2016 FY 2015 $335.5 $316.6 $ in millions 18.5% of Sales 19.9% of Sales Existing Market Operating Expenses Year - to - Date Results Existing Market results above exclude growth from acquired branches until they have been under ownership for at least four full fiscal quarters at the start of the fiscal reporting period. Payroll, employee benefits, stock comp 18.3$ Greenfields 2.5 Bad debt expense 2.5 Other (0.2) Gain on sale of assets (1.7) Selling expenses (2.5) Total 18.9$ Operating Expense Increase (Decrease) 14
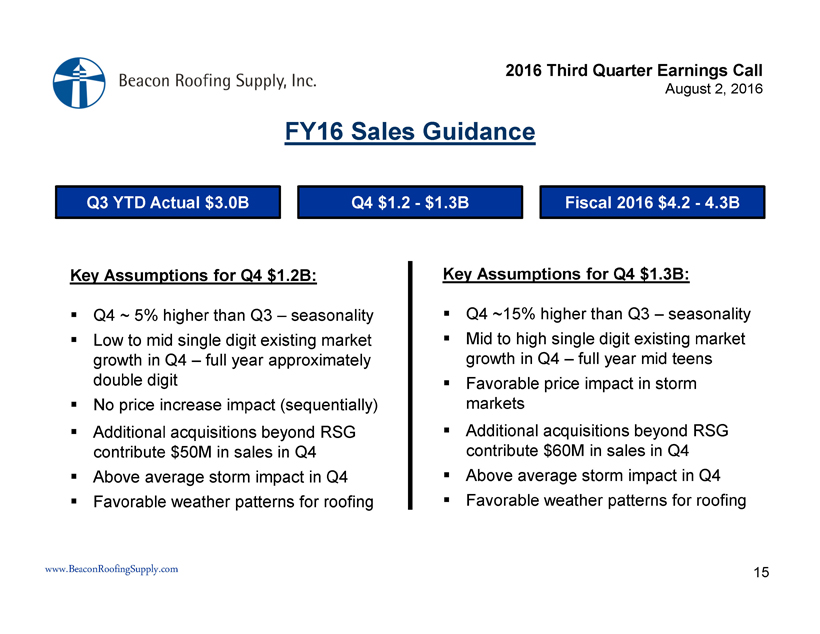
2016 Third Quarter Earnings Call August 2, 2016 www.BeaconRoofingSupply.com 19.8% of Sales FY16 Sales Guidance 15 Q3 YTD Actual $3.0B Q4 $1.2 - $1.3B Fiscal 2016 $4.2 - 4.3B Key Assumptions for Q4 $1.2B: ▪ Q4 ~ 5% higher than Q3 – seasonality ▪ Low to mid single digit existing market growth in Q4 – full year approximately double digit ▪ No price increase impact (sequentially) ▪ Additional acquisitions beyond RSG contribute $50M in sales in Q4 ▪ Above average storm impact in Q4 ▪ Favorable weather patterns for roofing Key Assumptions for Q4 $1.3B: ▪ Q4 ~15% higher than Q3 – seasonality ▪ Mid to high single digit existing market growth in Q4 – full year mid teens ▪ Favorable price impact in storm markets ▪ Additional acquisitions beyond RSG contribute $60M in sales in Q4 ▪ Above average storm impact in Q4 ▪ Favorable weather patterns for roofing

2016 Third Quarter Earnings Call August 2, 2016 www.BeaconRoofingSupply.com 19.8% of Sales FY16 Adjusted EPS Guidance 16 Q3 YTD $1.21 Q4 $0.84 – $0.94 Fiscal 2016 $2.05 - $2.15 Key Assumptions for Q4 $0.84: ▪ Q4 Sales of $1.2B ▪ No price increase impact (sequentially) ▪ Product mix consistent with YTD ▪ GM% in Q4 consistent with Q3 ▪ Op Ex leverage continues due to traditional 50% variable structure ▪ RSG synergy improvements continue a expected run rate ▪ ▪ 39% effective tax rate continues Key Assumptions for Q4 $0.94: ▪ Q4 Sales of $1.3B ▪ Ability to pass through price increase (sequentially) ▪ Product mix consistent with YTD ▪ GM% in Q4 up slightly from Q3 due to price ▪ Op Ex leverage continues due to traditional 50% variable structure ▪ RSG synergy improvements continue at expected run rate ▪ 39% effective tax rate continues
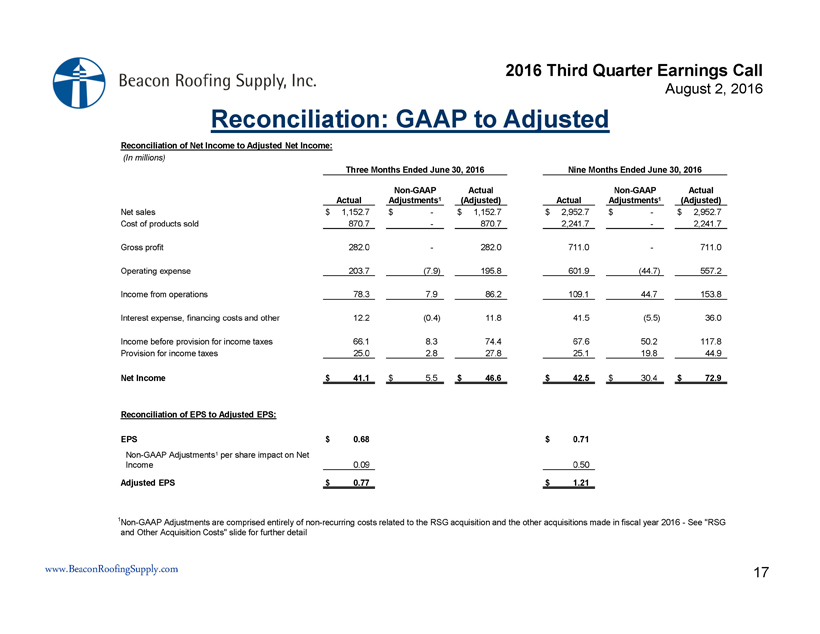
2016 Third Quarter Earnings Call August 2, 2016 www.BeaconRoofingSupply.com 19.8% of Sales Reconciliation: GAAP to Adjusted 17 Reconciliation of Net Income to Adjusted Net Income: (In millions) Three Months Ended June 30, 2016 Nine Months Ended June 30, 2016 Actual Non - GAAP Adjustments 1 Actual (Adjusted) Actual Non - GAAP Adjustments 1 Actual (Adjusted) Net sales $ 1,152.7 $ - $ 1,152.7 $ 2,952.7 $ - $ 2,952.7 Cost of products sold 870.7 - 870.7 2,241.7 - 2,241.7 Gross profit 282.0 - 282.0 711.0 - 711.0 Operating expense 203.7 (7.9) 195.8 601.9 (44.7) 557.2 Income from operations 78.3 7.9 86.2 109.1 44.7 153.8 Interest expense, financing costs and other 12.2 (0.4) 11.8 41.5 (5.5) 36.0 Income before provision for income taxes 66.1 8.3 74.4 67.6 50.2 117.8 Provision for income taxes 25.0 2.8 27.8 25.1 19.8 44.9 Net Income $ 41.1 $ 5.5 $ 46.6 $ 42.5 $ 30.4 $ 72.9 Reconciliation of EPS to Adjusted EPS: EPS $ 0.68 $ 0.71 Non - GAAP Adjustments 1 per share impact on Net Income 0.09 0.50 Adjusted EPS $ 0.77 $ 1.21 1 Non - GAAP Adjustments are comprised entirely of non - recurring costs related to the RSG acquisition and the other acquisitions mad e in fiscal year 2016 - See "RSG and Other Acquisition Costs" slide for further detail

2016 Third Quarter Earnings Call August 2, 2016 www.BeaconRoofingSupply.com 19.8% of Sales Reconciliation: Adjusted EBITDA 18 Reconciliation of Net Income to Adjusted EBITDA (In millions) Three Months Ended June 30, Nine Months Ended June 30, 2016 2015 2016 2015 Net Income 41.1 28.3 42.5 31.5 Acquisition costs 1 2.2 - 23.3 - Interest expense, net 12.5 2.5 41.8 7.8 Income taxes 25.0 17.1 25.1 18.5 Depreciation and amortization 25.4 9.5 73.0 25.9 Stock - based compensation 3.4 2.6 14.1 7.3 Adjusted EBITDA 109.6 60.0 219.8 91.0 1 Acquisition costs in fiscal year 2015 were immaterial

2016 Third Quarter Earnings Call August 2, 2016 www.BeaconRoofingSupply.com 19.8% of Sales Reconciliation: Net Debt Leverage Ratio 19 Reconciliation of Net Debt Leverage Ratio: (In millions) Gross total debt as of June 30, 2016 1,216$ Cash and cash equivalents as of June 30, 2016 (37) Net debt as of June 30, 2016 1,179$ Pro Forma RSG Adjusted EBITDA for the nine months ended September 30, 2015 1 49$ Pro Forma RSG Adjusted EBITDA for the six months ended June 30, 2015 2 15 Pro Forma RSG Adjusted EBITDA for the three months ended September 30, 2015 34$ Beacon Adjusted EBITDA for the quarter ended September 30, 2015 78 Adjusted EBITDA for the nine months ended June 30, 2016 220 Pro Forma Adjusted EBITDA for the twelve months ended June 30, 2016 332$ Net debt leverage ratio as of June 30, 2016 3.6 1 Adjusted EBITDA for the nine months ended September 30, 2015 Net loss attributable to controlling stockholders' interest (13,187)$ Interest expense, net 32,142 Provision for income taxes (4,031) Depreciation and amortization 32,510 Stock-based compensation 1,994 Adjusted EBITDA 49,428$ 2 Adjusted EBITDA for the six months ended June 30, 2015 Net loss attributable to controlling stockholders' interest (21,084)$ Interest expense, net 21,135 Provision for income taxes (8,156) Depreciation and amortization 21,494 Stock-based compensation 1,248 Adjusted EBITDA 14,637$

2016 Third Quarter Earnings Call August 2, 2016 www.BeaconRoofingSupply.com 19.8% of Sales Reconciliation: Adjusted EPS Guidance 20 Reconciliation of Adjusted EPS Guidance (In millions) Low End High End Earnings Per Share 1 $ 1.47 $ 1.57 Company adjustments, net of income taxes: Acquisition costs 2 $ 0.58 $ 0.58 Adjusted Earnings Per Share $ 2.05 $ 2.15 1 Represents projected diluted net income per share for full year Fiscal 2016 2 Represents projected EPS impact of non - recurring acquisition costs for full year Fiscal 2016, assuming 60.5 million diluted weig hted - average shares outstanding