Attached files
| file | filename |
|---|---|
| EX-99.1 - EXHIBIT 99.1 - Atkore Inc. | atkr3q16exhibit991.htm |
| 8-K - ATKR FORM 8-K - Atkore Inc. | form8-kdoc.htm |

PRINTING INSTRUCTIONS
CHECK TOC BEFORE PRINTING
Color/grayscale: Color (regardless of printing in b/w)
Scale to fit paper: OFF
Print hidden slides: OFF
POWERPOINT OPTIONS > ADVANCED > PRINT
Print in background: OFF
Third Quarter Fiscal 2016 Earnings Presentation
August 2016

1
Cautionary statements
This presentation contains forward-looking statements that are subject to known and unknown risks and uncertainties, many of which are beyond our control. All statements other than statements of historical
fact included in this presentation are forward-looking statements. Forward-looking statements appearing throughout this presentation include, without limitation, statements regarding our intentions, beliefs,
assumptions or current expectations concerning, among other things, financial position; results of operations; cash flows; prospects; growth strategies or expectations; customer retention; the outcome (by
judgment or settlement) and costs of legal, administrative or regulatory proceedings, investigations or inspections, including, without limitation, collective, representative or class action litigation; and the impact
of prevailing economic conditions. You can identify forward-looking statements by the fact that they do not relate strictly to historical or current facts. These statements may include words such as “believes,”
“expects,” “may,” “will,” “shall,” “should,” “would,” “could,” “seeks,” “aims,” “projects,” “is optimistic,” “intends,” “plans,” “estimates,” “anticipates” and other comparable terms. We caution you that forward-looking
statements are not guarantees of future performance or outcomes and that actual performance and outcomes, including, without limitation, our actual results of operations, financial condition and liquidity, and
the development of the market in which we operate, may differ materially from those made in or suggested by the forward-looking statements contained in this presentation. In addition, even if our results of
operations, financial condition and cash flows, and the development of the market in which we operate, are consistent with the forward-looking statements contained in this presentation, those results or
developments may not be indicative of results or developments in subsequent periods. A number of important factors, including, without limitation, the risks and uncertainties discussed under the captions “Risk
Factors” and “Management’s Discussion and Analysis of Financial Condition and Results of Operations” in the final prospectus filed pursuant to Rule 424(b)(4) of the Securities Act of 1933, as amended, filed
with the U.S. Securities and Exchange Commission on June 10, 2016 (File No. 333-209940), could cause actual results and outcomes to differ materially from those reflected in the forward-looking statements.
Because of these risks, we caution that you should not place undue reliance on any of our forward-looking statements. New risks and uncertainties arise from time to time, and it is impossible for us to predict
those events or how they may affect us. Further, any forward-looking statement speaks only as of the date on which it is made. We undertake no obligation to revise the forward-looking statements in this
presentation after the date of this presentation.
Market data and industry information used throughout this presentation are based on management’s knowledge of the industry and the good faith estimates of management. We also relied, to the extent
available, upon management’s review of independent industry surveys, forecasts and publications and other publicly available information prepared by a number of third party sources. All of the market data
and industry information used in this presentation involves a number of assumptions and limitations which we believe to be reasonable, and you are cautioned not to give undue weight to such estimates.
Although we believe that these sources are reliable, we cannot guarantee the accuracy or completeness of this information, and we have not independently verified this information. While we believe the
estimated market position, market opportunity and market size information included in this presentation are generally reliable, such information, which is derived in part from management’s estimates and
beliefs, is inherently uncertain and imprecise. Projections, assumptions and estimates of our future performance and the future performance of the industry in which we operate are subject to a high degree of
uncertainty and risk due to a variety of factors, including those described above. These and other factors could cause results to differ materially from those expressed in our estimates and beliefs and in the
estimates prepared by independent parties.
We present Adjusted net sales, Adjusted EBITDA. Adjusted EBITDA margin, Adjusted net income, Adjusted earnings per share, and Leverage ratio (net debt over Adjusted EBITDA on a trailing twelve month
basis) to help us describe our operating and financial performance. Adjusted net sales, Adjusted EBITDA, Adjusted EBITDA margin, Adjusted net income, Adjusted earnings per share, and Leverage ratio are
non-GAAP financial measures commonly used in our industry and have certain limitations and should not be construed as alternatives to net income, net sales and other income data measures (as determined
in accordance with generally accepted accounting principles in the United States, or GAAP), or as better indicators of operating performance. Adjusted net sales, Adjusted EBITDA, Adjusted EBITDA margin,
Adjusted net income , Adjusted earnings per share and Leverage ratio, as defined by us may not be comparable to similar non-GAAP measures presented by other issuers. Our presentation of such measures
should not be construed as an inference that our future results will be unaffected by unusual or non-recurring items. See the appendix to this presentation for a reconciliation of Adjusted net sales to net sales,
Adjusted EBITDA to net income, Adjusted net income to net income, Adjusted earnings per share to earnings per share, and net debt over Adjusted EBITDA on a trailing twelve month basis.
We have a 52- or 53-week fiscal year that ends on the last Friday in September. Fiscal 2015, 2014 and 2013 were 52-week fiscal years which ended on September 25, 2015, September 26, 2014 and
September 27, 2013, respectively. Our next fiscal year will end on September 30, 2016, and will be a 53-week year. Our fiscal quarters end on the last Friday in December, March and June.
.

Company introduction &
strategic overview

3
OEM
18%
Int'l
7%
Other
5%
U.S.
Construction
70%
Leading Electrical Raceway and Mechanical Products & Solutions provider
■ #1 or #2 market positions in most of our products1
■ Offer must-stock products to distribution and OEM
customers via single integrated platform
■ Established reputation as an industry leader in
quality, availability, delivery, value and innovation
■ Organized into two complementary segments:
Electrical Raceway and Mechanical Products &
Solutions (“MP&S”)
■ U.S.-centric player with large addressable market
and close adjacent opportunities
FY 2015 net sales
By reportable segment2 By end market
Addressable market opportunity3
$1B4
$13
Bil
li
o
n
Electrical
raceway
market
$78
Billio
n
U.S. electrical
products
market
$500M4
$3.8
Billio
n
U.S. mechanical
products &
solutions market
Electrical Raceway Mechanical Products & Solutions
1 Based on U.S. Adjusted net sales. Excludes impact of the exit of our Fence and Sprinkler product lines.
2 Split based on FY 2015 Adjusted net sales.
3 Management estimates based on market data and industry knowledge.
4 Atkore management estimates based on U.S. Adjusted net sales relative to the estimated U.S. addressable market size.
Mechanical
Products &
Solutions
35%
Electrical
Raceway
65%
4
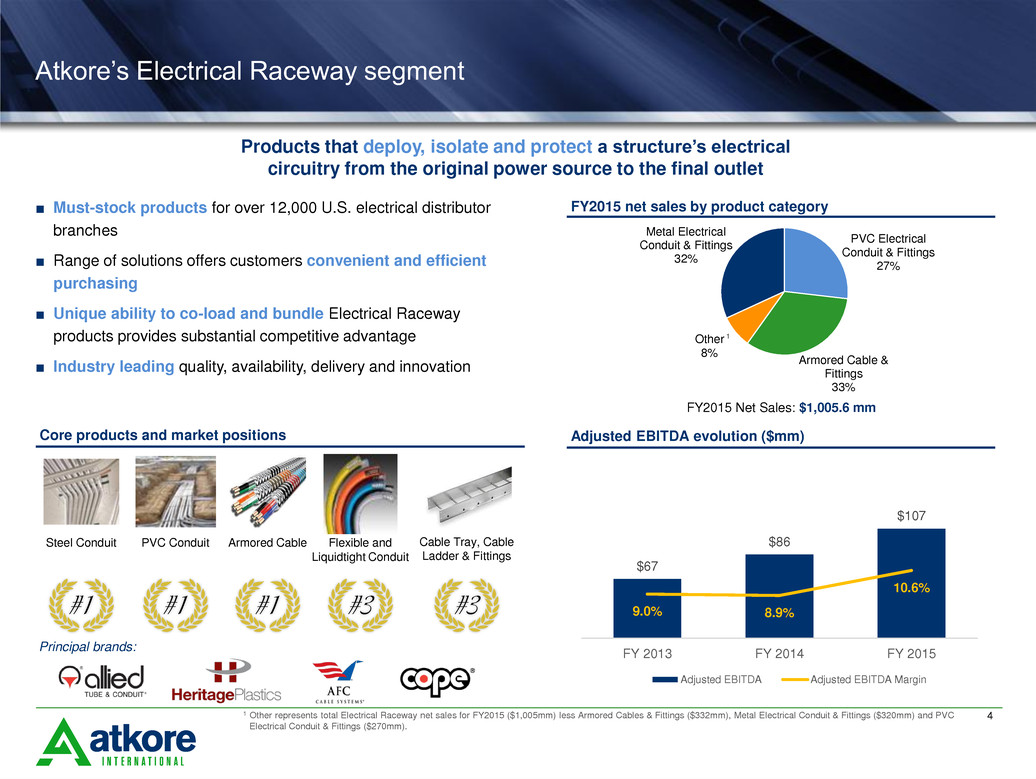
$67
$86
$107
9.0% 8.9%
10.6%
0.06
0.08
0.1
0.12
0.14
0.16
0.18
FY 2013 FY 2014 FY 2015
Adjusted EBITDA Adjusted EBITDA Margin
PVC Electrical
Conduit & Fittings
27%
Armored Cable &
Fittings
33%
Other
8%
Metal Electrical
Conduit & Fittings
32%
Atkore’s Electrical Raceway segment
FY2015 net sales by product category
Adjusted EBITDA evolution ($mm)
Products that deploy, isolate and protect a structure’s electrical
circuitry from the original power source to the final outlet
■ Must-stock products for over 12,000 U.S. electrical distributor
branches
■ Range of solutions offers customers convenient and efficient
purchasing
■ Unique ability to co-load and bundle Electrical Raceway
products provides substantial competitive advantage
■ Industry leading quality, availability, delivery and innovation
Core products and market positions
Principal brands:
Armored Cable
PVC Conduit
Steel Conduit
#1 #1 #1
Flexible and
Liquidtight Conduit
Cable Tray, Cable
Ladder & Fittings
#3 #3
1
1 Other represents total Electrical Raceway net sales for FY2015 ($1,005mm) less Armored Cables & Fittings ($332mm), Metal Electrical Conduit & Fittings ($320mm) and PVC
Electrical Conduit & Fittings ($270mm).
FY2015 Net Sales: $1,005.6 mm

5
Metal Framing
and Fittings
32%
Mechanical
Pipe
53%
Other
15%
■ Comprehensive offering of metal framing and in-line galvanized
mechanical tube
■ Offer critical combination of metal framing, value-added fittings
and construction services to industrial and electrical distributors
■ ~60% of framing used to mount Electrical Raceway products
■ One of only two companies in the U.S. that manufacture and
market in-line galvanized mechanical tube on a national basis
■ 90% of in-line galvanized tubular products are sold directly or
indirectly to OEMs
Atkore’s Mechanical Products & Solutions segment
FY2015 Adjusted net sales by product category
Products and services that frame, support and secure component parts in a broad range of structures,
equipment and systems in electrical, industrial and construction applications
Core products and market positions
Principal brands:
Metal Framing &
Related Fittings
In-Line Galvanized
Mechanical Tube
#1 #2
Historical financial performance
$63
$60
$80
11.8%
11.0%
14.6%
0.08
0.1
0.12
0.14
0.16
0.18
0.2
FY 2013 FY 2014 FY 2015
Adjusted EBITDA ($mm) Adjusted EBITDA Margin
1
1 Other represents total MP&S Adjusted net sales for FY2015 ($546mm) less Mechanical Pipe ($287mm) and Metal Framing and Fittings ($175mm).
FY2015 Net sales $724.8 mm
FY2015 Adjusted net sales $546.2 mm

6
Atkore’s significant transformation and current strategy
■ Limited strategic vision
■ Little customer coordination
■ Underperforming leadership
■ No growth or M&A strategy
2011 2011 - 2015 Atkore strategy
■ Leading market positions/brands
■ Upgraded over 90% of leadership
■ Developed clear strategy
■ Implemented Atkore Business System
(“ABS”)
■ Transformed portfolio (6 acquisitions,
4 divestitures and 4 closures)
■ Invested in new product development
■ Improved quality, delivery & service
■ Reduced fixed overhead
■ Drive growth
− Market position expansion
− New product innovation
− M&A growth execution
■ Expand margin
− Strategic and tactical pricing
− Mix driven by innovation and pricing
− Raw material and material usage savings
− Manufacturing productivity savings
− Volume leverage
■ Deliver cash flow
− Strong cash flow from earnings
− Disciplined CapEx deployment
− Efficient Working Capital Management
7
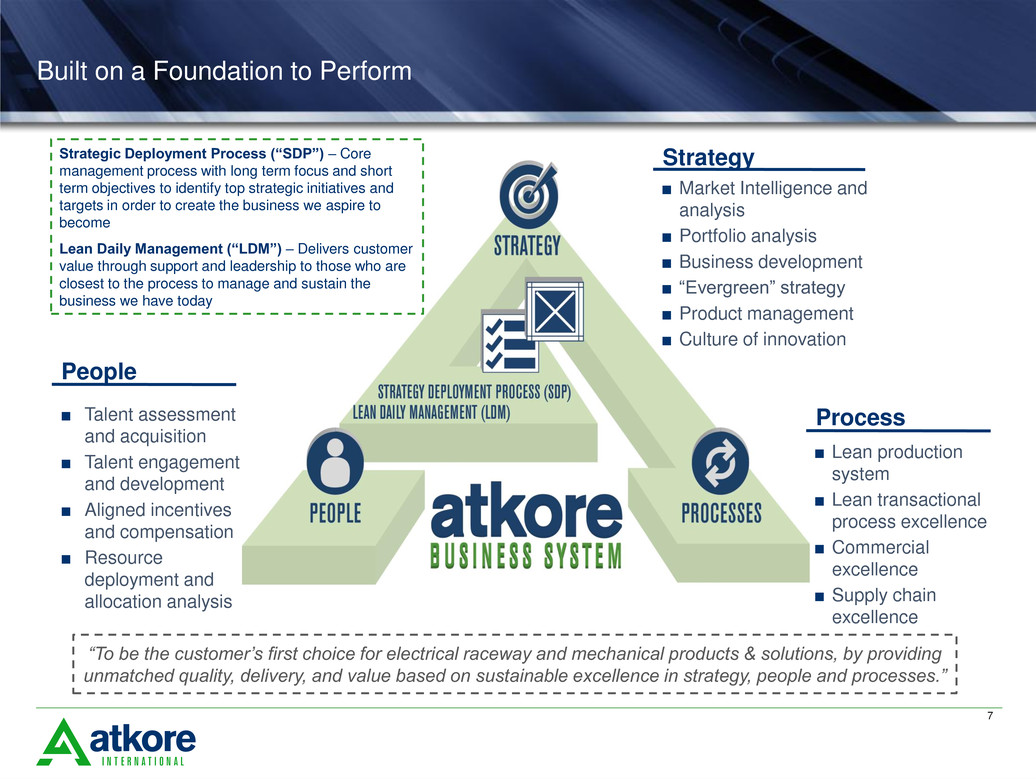
Built on a Foundation to Perform
Strategic Deployment Process (“SDP”) – Core
management process with long term focus and short
term objectives to identify top strategic initiatives and
targets in order to create the business we aspire to
become
Lean Daily Management (“LDM”) – Delivers customer
value through support and leadership to those who are
closest to the process to manage and sustain the
business we have today
“To be the customer’s first choice for electrical raceway and mechanical products & solutions, by providing
unmatched quality, delivery, and value based on sustainable excellence in strategy, people and processes.”
Strategy
Process
People
■ Talent assessment
and acquisition
■ Talent engagement
and development
■ Aligned incentives
and compensation
■ Resource
deployment and
allocation analysis
■ Market Intelligence and
analysis
■ Portfolio analysis
■ Business development
■ “Evergreen” strategy
■ Product management
■ Culture of innovation
■ Lean production
system
■ Lean transactional
process excellence
■ Commercial
excellence
■ Supply chain
excellence

Third quarter fiscal 2016
review

9
Atkore – Third quarter fiscal 2016 highlights
■ Net sales of $396 million down 8.5%, Adjusted net
sales $396 million up 2.2%*
■ Volume increase of $20 million or 5.3%
■ Net income of $21 million, up 8.3%; Adjusted net
income of $26 million up 34%
■ Gross margin up 1,000 basis points, Adjusted
EBITDA margin up 490 basis points year over year*
■ Gross profit up 41.6% to $112 million
■ Operating income up 50.7% to $42 million
■ Basic and Diluted EPS up 10% to $0.33
■ Adjusted EPS up 35.5% to $0.42
■ On a sequential basis, Q3 2016 vs. Q2 2016:
■ Volume growth of 9.1%
■ Gross profit up 22.0%
■ Gross margin up 230 basis points
* Compared to the third quarter of 2015 and adjusted to exclude the impact of the Fence and Sprinkler product lines
1. Net sales were $432mm and $396mm for the fiscal third quarter 2015 and 2016, respectively. Net sales were $1,291.4mm and $1,107.1mm for the nine
months year-to-date 2015 and 2016, respectively.
2. Net income was $19.1mm and $20.6mm for the fiscal third quarter 2015 and 2016, respectively. Net income was $22.1mm and $43.2mm for the nine
months year-to-date 2015 and 2016, respectively.
-
200
400
600
800
1,000
1,200
1,400
Q3'15 Q3'16 YTD 15 YTD 16
Adjusted Net Sales 1
0%
2%
4%
6%
8%
10%
12%
14%
16%
18%
Q3'15 Q3'16 YTD 15 YTD 16
Adjusted EBITDA Margin 2

10
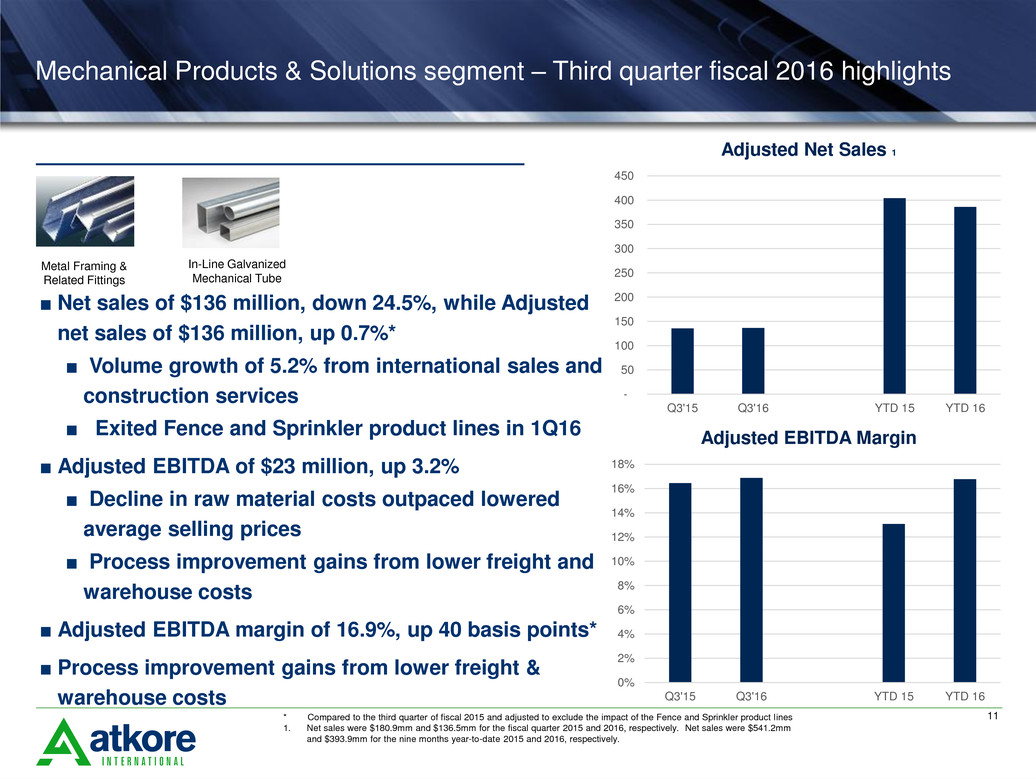
Electrical Raceway segment – Third quarter fiscal 2016 highlights
Electrical Raceway
■Net sales of $260 million, up 3.2%
■Adjusted EBITDA of $52 million, up 68.6%
■Adjusted EBITDA margin of 20.2%, up 790
basis points
■ Customer service driving ability to support
pricing benefit and margin expansion
■ Volume growth of 5.3%
■Sequential quarter increases in average
selling prices
Steel Conduit
PVC Conduit
Armored Cable
Flexible and
Liquidtight Conduit
Cable Tray, Cable
Ladder & Fittings
-
100
200
300
400
500
600
700
800
Q3'15 Q3'16 YTD 15 YTD 16
Net Sales
0%
5%
10%
15%
20%
25%
Q3'15 Q3'16 YTD 15 YTD 16
Adjusted EBITDA Margin
11
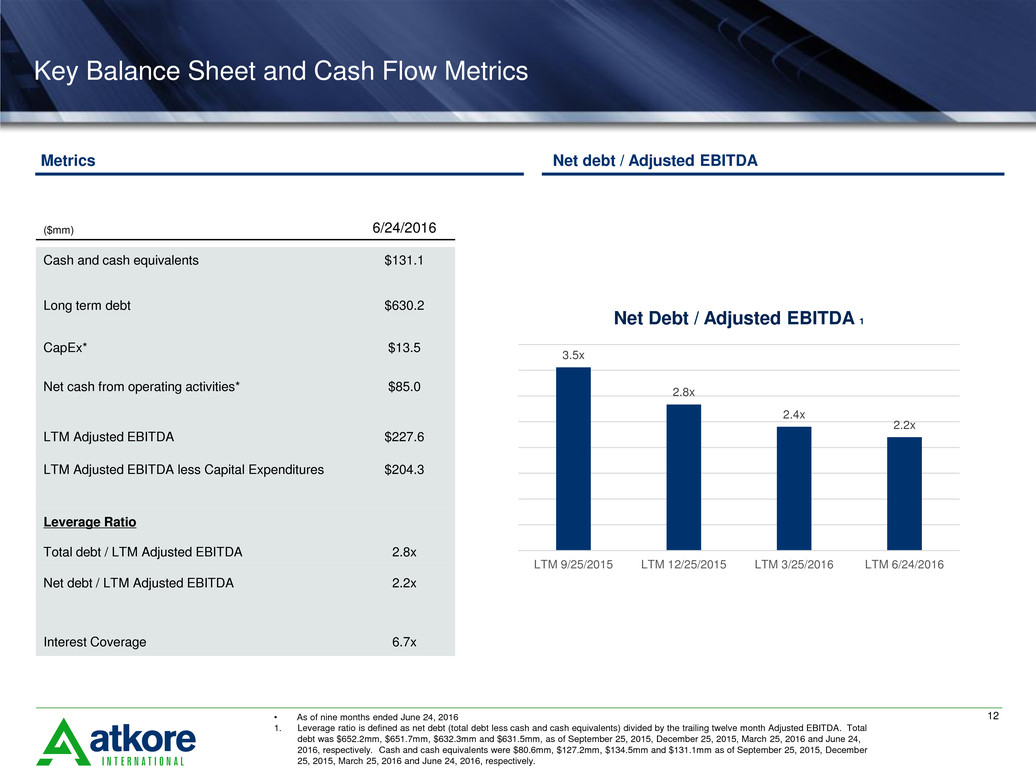
Mechanical Products & Solutions segment – Third quarter fiscal 2016 highlights
■ Net sales of $136 million, down 24.5%, while Adjusted
net sales of $136 million, up 0.7%*
■ Volume growth of 5.2% from international sales and
construction services
■ Exited Fence and Sprinkler product lines in 1Q16
■ Adjusted EBITDA of $23 million, up 3.2%
■ Decline in raw material costs outpaced lowered
average selling prices
■ Process improvement gains from lower freight and
warehouse costs
■ Adjusted EBITDA margin of 16.9%, up 40 basis points*
■ Process improvement gains from lower freight &
warehouse costs
* Compared to the third quarter of fiscal 2015 and adjusted to exclude the impact of the Fence and Sprinkler product lines
1. Net sales were $180.9mm and $136.5mm for the fiscal quarter 2015 and 2016, respectively. Net sales were $541.2mm
and $393.9mm for the nine months year-to-date 2015 and 2016, respectively.
Metal Framing &
Related Fittings
In-Line Galvanized
Mechanical Tube
-
50
100
150
200
250
300
350
400
450
Q3'15 Q3'16 YTD 15 YTD 16
Adjusted Net Sales 1
0%
2%
4%
6%
8%
10%
12%
14%
16%
18%
Q3'15 Q3'16 YTD 15 YTD 16
Adjusted EBITDA Margin
12
Key Balance Sheet and Cash Flow Metrics
($mm)
6/24/2016
Cash and cash equivalents $131.1
Long term debt $630.2
CapEx* $13.5
Net cash from operating activities* $85.0
LTM Adjusted EBITDA $227.6
LTM Adjusted EBITDA less Capital Expenditures $204.3
Leverage Ratio
Total debt / LTM Adjusted EBITDA 2.8x
Net debt / LTM Adjusted EBITDA 2.2x
Interest Coverage 6.7x
Metrics Net debt / Adjusted EBITDA
• As of nine months ended June 24, 2016
1. Leverage ratio is defined as net debt (total debt less cash and cash equivalents) divided by the trailing twelve month Adjusted EBITDA. Total
debt was $652.2mm, $651.7mm, $632.3mm and $631.5mm, as of September 25, 2015, December 25, 2015, March 25, 2016 and June 24,
2016, respectively. Cash and cash equivalents were $80.6mm, $127.2mm, $134.5mm and $131.1mm as of September 25, 2015, December
25, 2015, March 25, 2016 and June 24, 2016, respectively.
3.5x
2.8x
2.4x
2.2x
LTM 9/25/2015 LTM 12/25/2015 LTM 3/25/2016 LTM 6/24/2016
Net Debt / Adjusted EBITDA 1

Outlook and Summary

14
2016 Financial Outlook
■ Adjusted EBITDA – $226 million to $236 million*
■ Volume growth between 4% - 8% in the fourth quarter
■ Segment Details
■ Electrical Raceway – Adjusted EBITDA $170 million to $180 million
■ MP&S – Adjusted EBITDA $76 million to $86 million
■ Capital expenditures – $22.0 million
■ Interest Expense – $41 million
■ Tax Rate – 36%
* Reconciliation of the forward-looking full-year 2016 Adjusted EBITDA outlook is not being provided as the Company does not currently have sufficient data to
accurately estimate the variables and individual adjustments for such reconciliation.
15
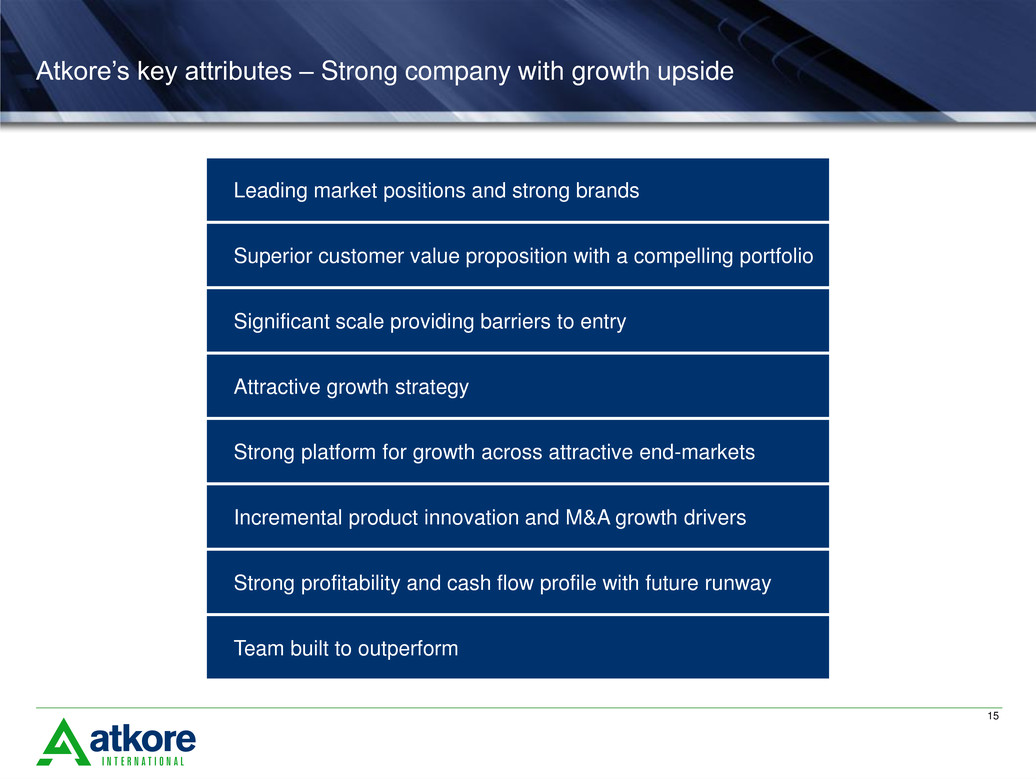
Atkore’s key attributes – Strong company with growth upside
Leading market positions and strong brands
Superior customer value proposition with a compelling portfolio
Significant scale providing barriers to entry
Attractive growth strategy
Strong platform for growth across attractive end-markets
Incremental product innovation and M&A growth drivers
Strong profitability and cash flow profile with future runway
Team built to outperform

Appendix

17
Adjusted net sales reconciliation
A
B
C
D
E
F
G
H
Consolidated Atkore International Group Inc.
Mechanical Products & Solutions
ATKORE INTERNATIONAL GROUP INC. - ADJUSTED NET SALES RECONCILIATION
Three Months Ended
($ in thousands) June 24, 2016 June 26, 2015 Change % Change
Net sales $ 395,724 $ 432,367 $ (36,643 ) (8.5 )%
Impact of Fence and Sprinkler exit — (45,298 ) 45,298 *
Adjusted net sales $ 395,724 $ 387,069 $ 8,655 2.2 %
* Not meaningful
MECHANICAL PRODUCTS & SOLUTIONS - ADJUSTED NET SALES RECONCILIATION
Three Months Ended
($ in thousands) June 24, 2016 June 26, 2015 Change % Change
Net sales $ 136,482 $ 180,863 $ (44,381 ) (24.5 )%
Impact of Fence and Sprinkler exit (45,298 ) 45,298 *
Adjusted net sales $ 136,482 $ 135,565 $ 917 0.7 %
* Not meaningful
18
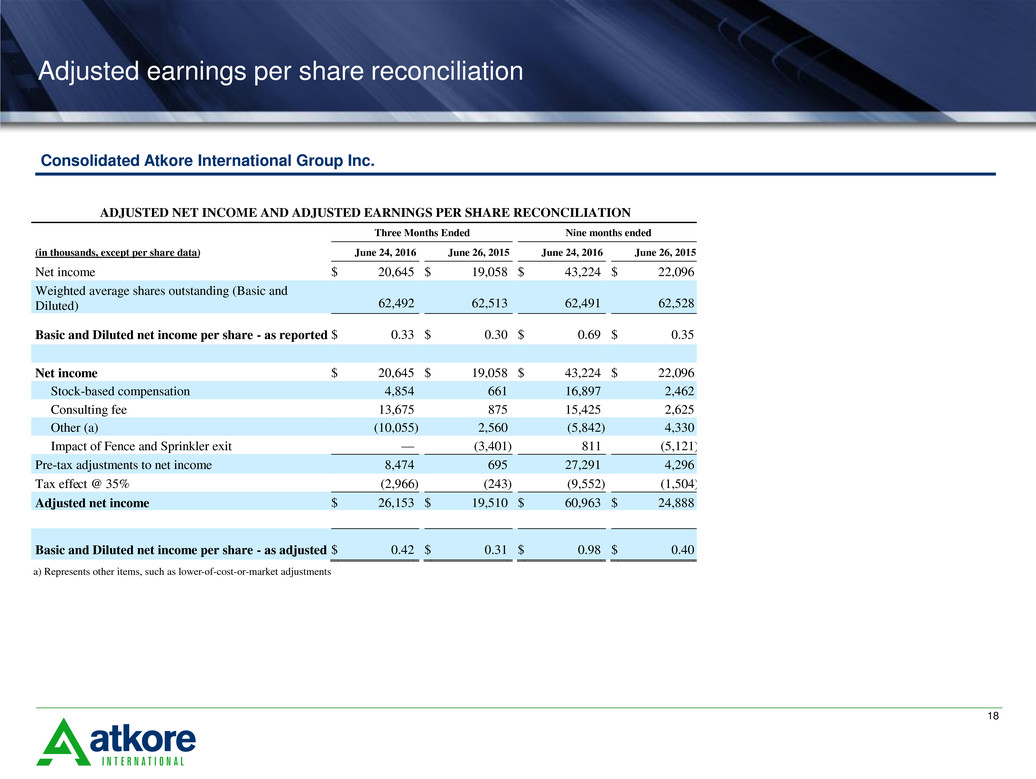
Adjusted earnings per share reconciliation
A
B
C
D
E
F
G
H
Consolidated Atkore International Group Inc.
ADJUSTED NET INCOME AND ADJUSTED EARNINGS PER SHARE RECONCILIATION
Three Months Ended Nine months ended
(in thousands, except per share data) June 24, 2016 June 26, 2015 June 24, 2016 June 26, 2015
Net income $ 20,645 $ 19,058 $ 43,224 $ 22,096
Weighted average shares outstanding (Basic and
Diluted) 62,492
62,513
62,491
62,528
Basic and Diluted net income per share - as reported $ 0.33
$ 0.30
$ 0.69
$ 0.35
Net income $ 20,645 $ 19,058 $ 43,224 $ 22,096
Stock-based compensation 4,854 661 16,897 2,462
Consulting fee 13,675 875 15,425 2,625
Other (a) (10,055 ) 2,560 (5,842 ) 4,330
Impact of Fence and Sprinkler exit — (3,401 ) 811 (5,121 )
Pre-tax adjustments to net income 8,474 695 27,291 4,296
Tax effect @ 35% (2,966 ) (243 ) (9,552 ) (1,504 )
Adjusted net income $ 26,153 $ 19,510 $ 60,963 $ 24,888
Basic and Diluted net income per share - as adjusted $ 0.42
$ 0.31
$ 0.98
$ 0.40
a) Represents other items, such as lower-of-cost-or-market adjustments

19
Net Income to Adjusted EBITDA reconciliation
A
B
C
D
E
F
G
H
Presented below is a reconciliation of net income to Adjusted EBITDA
Three Months Ended Nine months ended
(in thousands) June 24, 2016 June 26, 2015 June 24, 2016 June 26, 2015
Net income $ 20,645 $ 19,058 $ 43,224 $ 22,096
Depreciation and amortization 13,322 14,349 40,064 43,373
Gain on extinguishment of debt — — (1,661 ) —
Interest expense, net 10,169 11,212 30,617 33,624
Income tax expense (benefit) 10,749 (2,683 ) 24,093 (227 )
Restructuring & impairments 326 475 2,395 642
Net periodic pension benefit cost 110 144 330 434
Stock-based compensation 4,854 661 16,897 2,462
ABF product liability impact 212 561 637 1,683
Consulting fee 13,675 875 15,425 2,625
Legal settlements 1,300 — 1,300 —
Transaction costs (a) 1,917 2,876 5,348 4,030
Other (b) (10,055 ) 2,560 (5,842 ) 4,330
Impact of Fence and Sprinkler exit — (3,401 ) 811 (5,121 )
Adjusted EBITDA $ 67,224 $ 46,687 $ 173,638 $ 109,951
(a) Represents costs associated with our initial public offering, acquisition and divestiture-related activities.
(
(b) Represents other items, such as lower-of-cost-or-market adjustments.

20
Net debt / LTM Adjusted EBITDA reconciliation
A
B
C
D
E
F
G
H
ATKORE INTERNATIONAL GROUP INC.
NET DEBT/LTM ADJUSTED EBITDA RECONCILIATIONS
(Unaudited)
($ in thousands) June 24, 2016 March 25, 2016
December 25,
2015
September 25,
2015
Short-term debt and current maturities of long-
term debt $ 1,267
$ 1,881
$ 2,531
$ 2,864
Long-term debt 630,204 630,369 649,203 649,344
Total Debt 631,471 632,250 651,734 652,208
Less cash and cash equivalents 131,109 134,477 127,210 80,598
Net Debt $ 500,362 $ 497,773 $ 524,524 $ 571,610
LTM Adjusted EBITDA $ 227,637 $ 207,100 $ 184,852 $ 163,949
Net debt/LTM Adjusted EBITDA 2.2 2.4 2.8 3.5
