Attached files
| file | filename |
|---|---|
| 8-K - 8-K - PEAPACK GLADSTONE FINANCIAL CORP | form8k-16362_pgfc.htm |
Exhibit 99.1

Strategic Update “Expanding Our Reach” Investor Presentation June 30, 2016 P EAPACK - G LADSTONE B ANK
The foregoing contains forward - looking statements within the meaning of the Private Securities Litigation Reform Act of 1995. Such statements are not historical facts and include expressions about Management’s view of future interest income and net loans, Man agement’s confidence and strategies and Management’s expectations about new and existing programs and products, relationships, opportun iti es and market conditions. These statements may be identified by such forward - looking terminology as “expect”, “look”, “believe”, “antic ipate”, “may”, “will”, or similar statements or variations of such terms. Actual results may differ materially from such forward - looking statements. Factors that may cause actual results to differ materially from those contemplated by such forward - looking statements include, a mong others, those risk factors identified in the Company’s Form 10 - K for the year ended December 31, 2015, in addition to/which include the following: a) inability to successfully grow our business in line with our strategic plan; b) inability to grow deposits to fund loan growt h; c) inability to generate revenues to offset the increased personnel and other costs related to the strategic plan; d) inability to realize ex pec ted revenue synergies from the acquisition of a wealth management company in the amounts or the timeframe anticipated; e) inability to re tai n clients and employees of acquired wealth management company; f) inability to manage our growth; g) inability to successfully integrat e o ur expanded employee base; h) a further or unexpected decline in the economy, in particular in our New Jersey and New York marke t a reas; i ) declines in value in our investment portfolio; j) higher than expected increases in our allowance for loan losses; k) higher tha n expected increases in loan losses or in the level of non - performing loans ; unexpected changes in interest rates; l) a continued or unexpected decline in real estate values within our market areas; m) legislative and regulatory actions (including the impact of the Dodd - Frank Wall S treet Reform and Consumer Protection Act, Basel III and related regulations) subject us to additional regulatory oversight which may resul t i n increased compliance costs; n) successful cyber - attacks against our IT infrastructure or that of our IT providers; o) higher than expected FDIC premiums; p) adverse weather conditions ; inability to successfully generate new business in new geographic areas; q) inability to execute upon new business initiatives ; lack of liquidity to fund our various cash obligations; r) reduction in our lower - cost funding sources; s) our inability to adapt to technological changes; t) claims and litigation pertaining to fiduciary responsibility, environmental laws and other ma tters; and other unexpected material adverse changes in our operations or earnings. The Company assumes no responsibility to update such forward - looking statements in the future even if experience shows that the indicated results or events will not be realized. Although we believe that the expectations reflected in the forward - looking statements ar e reasonable, the Company cannot guarantee future results, levels of activity, performance, or achievements. Statement Regarding Forward - Looking Information 2
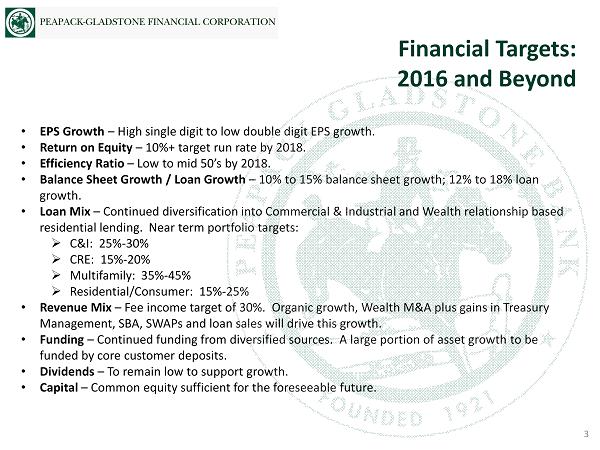
• EPS Growth – High single digit to low double digit EPS growth. • Return on Equity – 10 %+ target run rate by 2018. • Efficiency Ratio – Low to mid 50’s by 2018. • Balance Sheet Growth / Loan Growth – 10% to 15% balance sheet growth; 12% to 18% loan growth. • Loan Mix – Continued diversification into Commercial & Industrial and Wealth relationship based residential lending. Near term portfolio targets: » C&I: 25% - 30% » CRE: 15 % - 20% » Multifamily: 35% - 45% » Residential/Consumer: 15% - 25% • Revenue Mix – Fee income target of 30%. Organic growth, Wealth M&A plus gains in Treasury Management, SBA, SWAPs and loan sales will drive this growth. • Funding – Continued funding from diversified sources . A large portion of asset growth to be funded by core customer deposits . • Dividends – To remain low to support growth. • Capital – Common equity sufficient for the foreseeable future. Financial Targets: 2016 and Beyond 3
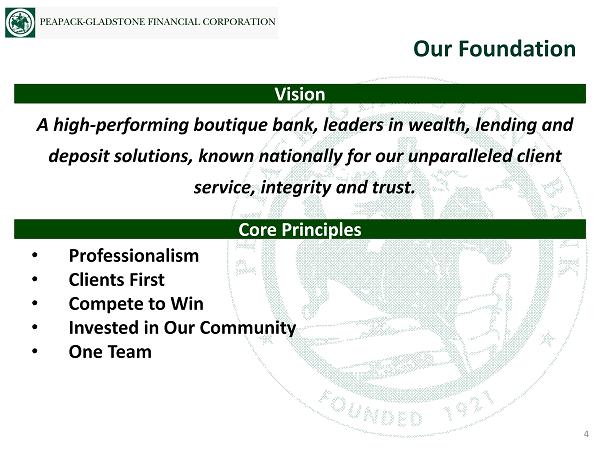
A high - performing boutique bank, leaders in wealth, lending and deposit solutions, known nationally for our unparalleled client service, integrity and trust. Our Foundation 4 • Professionalism • Clients First • Compete to Win • Invested in Our Community • One Team Vision Core Principles
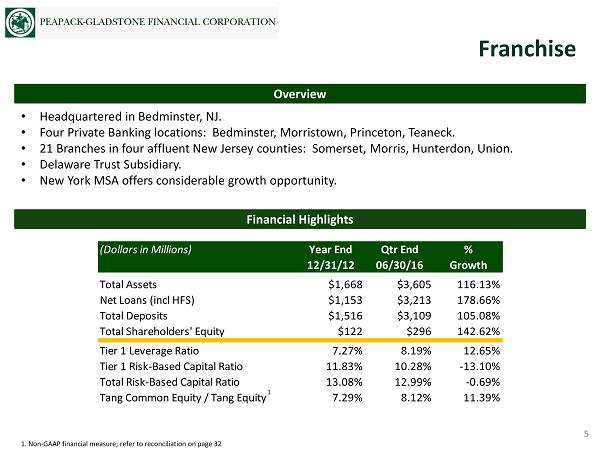
1. Non - GAAP financial measure; refer to reconciliation on page 32 • Headquartered in Bedminster, NJ. • Four Private Banking locations: Bedminster, Morristown, Princeton, Teaneck. • 21 Branches in four affluent New Jersey counties: Somerset, Morris, Hunterdon, Union. • Delaware Trust Subsidiary. • New York MSA offers considerable growth opportunity. Overview Franchise 5 Financial Highlights (Dollars in Millions) Year End Qtr End % 12/31/12 06/30/16 Growth Total Assets $1,668 $3,605 116.13% Net Loans (incl HFS) $1,153 $3,213 178.66% Total Deposits $1,516 $3,109 105.08% Total Shareholders' Equity $122 $296 142.62% Tier 1 Leverage Ratio 7.27% 8.19% 12.65% Tier 1 Risk-Based Capital Ratio 11.83% 10.28% -13.10% Total Risk-Based Capital Ratio 13.08% 12.99% -0.69% Tang Common Equity / Tang Equity 7.29% 8.12% 11.39% 1
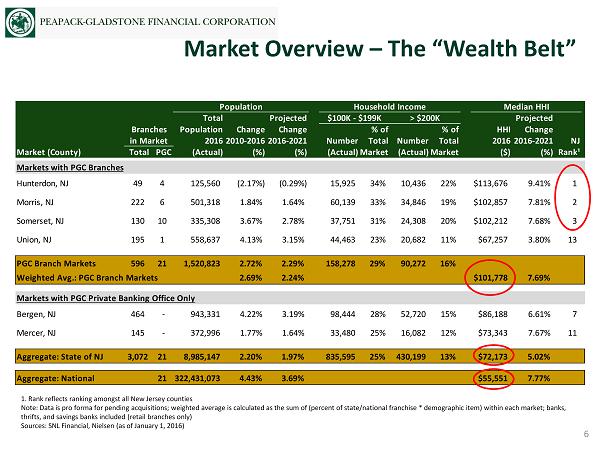
1. Rank reflects ranking amongst all New Jersey counties Note: Data is pro forma for pending acquisitions; weighted average is calculated as the sum of (percent of state/national franchise * demographic item) within each market; banks , thrifts , and savings banks included (retail branches only ) Sources: SNL Financial, Nielsen (as of January 1, 2016) Population Household Income Median HHI Total Projected $100K - $199K > $200K Projected Branches Population Change Change % of % of HHI Change in Market 20162010-20162016-2021 Number Total Number Total 20162016-2021 NJ Market (County) Total PGC (Actual) (%) (%) (Actual)Market (Actual)Market ($) (%)Rank¹ Markets with PGC Branches Hunterdon, NJ 49 4 125,560 (2.17%) (0.29%) 15,925 34% 10,436 22% $113,676 9.41% 1 Morris, NJ 222 6 501,318 1.84% 1.64% 60,139 33% 34,846 19% $102,857 7.81% 2 Somerset, NJ 130 10 335,308 3.67% 2.78% 37,751 31% 24,308 20% $102,212 7.68% 3 Union, NJ 195 1 558,637 4.13% 3.15% 44,463 23% 20,682 11% $67,257 3.80% 13 PGC Branch Markets 596 21 1,520,823 2.72% 2.29% 158,278 29% 90,272 16% Weighted Avg.: PGC Branch Markets 2.69% 2.24% $101,778 7.69% Markets with PGC Private Banking Office Only Bergen, NJ 464 - 943,331 4.22% 3.19% 98,444 28% 52,720 15% $86,188 6.61% 7 Mercer, NJ 145 - 372,996 1.77% 1.64% 33,480 25% 16,082 12% $73,343 7.67% 11 Aggregate: State of NJ 3,072 21 8,985,147 2.20% 1.97% 835,595 25% 430,199 13% $72,173 5.02% Aggregate: National 21 322,431,073 4.43% 3.69% $55,551 7.77% Market Overview – The “Wealth Belt” 6
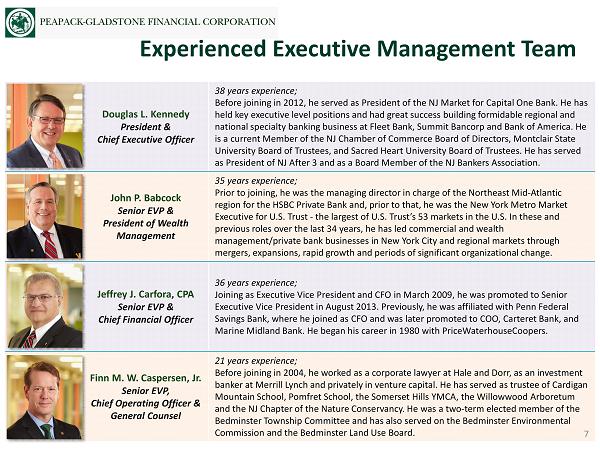
Douglas L. Kennedy President & Chief Executive Officer 38 years experience; Before joining in 2012, he served as President of the NJ Market for Capital One Bank. He has held key executive level positions and had great success building formidable regional and national specialty banking business at Fleet Bank, Summit Bancorp and Bank of America. He is a current Member of the NJ Chamber of Commerce Board of Directors, Montclair State University Board of Trustees, and Sacred Heart University Board of Trustees. He has served as President of NJ After 3 and as a Board Member of the NJ Bankers Association. John P. Babcock Senior EVP & President of Wealth Management 35 years experience; Prior to joining, he was the managing director in charge of the Northeast Mid - Atlantic region for the HSBC Private Bank and, prior to that, he was the New York Metro Market Executive for U.S. Trust - the largest of U.S. Trust’s 53 markets in the U.S. In these and previous roles over the last 34 years, he has led commercial and wealth management/private bank businesses in New York City and regional markets through mergers, expansions, rapid growth and periods of significant organizational change. Jeffrey J. Carfora, CPA Senior EVP & Chief Financial Officer 36 years experience; Joining as Executive Vice President and CFO in March 2009, he was promoted to Senior Executive Vice President in August 2013. Previously, he was affiliated with Penn Federal Savings Bank, where he joined as CFO and was later promoted to COO, Carteret Bank, and Marine Midland Bank. He began his career in 1980 with PriceWaterhouseCoopers . Finn M. W. Caspersen, Jr. Senior EVP, Chief Operating Officer & General Counsel 21 years experience; Before j oining in 2004, he worked as a corporate lawyer at Hale and Dorr, as an investment banker at Merrill Lynch and privately in venture capital. He has served as trustee of Cardigan Mountain School, Pomfret School, the Somerset Hills YMCA, the Willowwood Arboretum and the NJ Chapter of the Nature Conservancy. He was a two - term elected member of the Bedminster Township Committee and has also served on the Bedminster Environmental Commission and the Bedminster Land Use Board. Experienced Executive Management Team 7
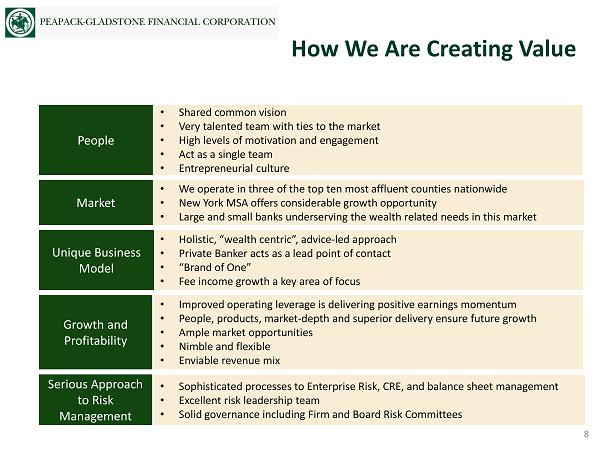
People Market Growth and Profitability • Shared common vision • Very talented team with ties to the market • High levels of motivation and engagement • Act as a single team • Entrepreneurial culture • We operate in three of the top ten most affluent counties nationwide • New York MSA offers considerable growth opportunity • Large and small banks underserving the wealth related needs in this market • Improved operating leverage is delivering positive earnings momentum • People , products, market - depth and superior delivery ensure future growth • Ample market opportunities • Nimble and flexible • Enviable revenue mix Unique Business Model • Holistic, “wealth centric”, advice - led approach • Private Banker acts as a lead point of contact • “Brand of One” • Fee income growth a key area of focus • Sophisticated processes to Enterprise Risk, CRE, and balance sheet management • Excellent risk leadership team • Solid governance including Firm and Board Risk Committees Serious Approach to Risk Management How We Are Creating Value 8
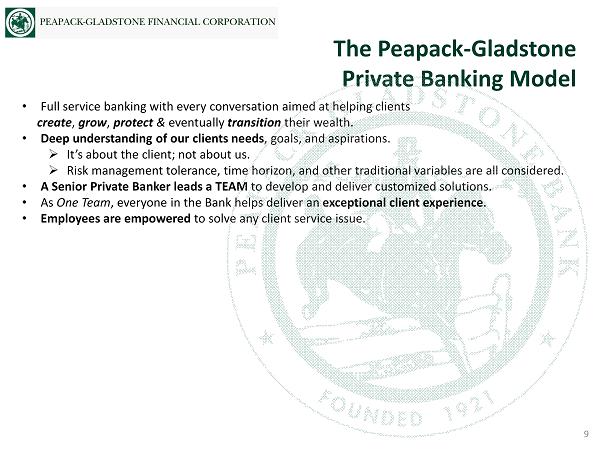
• Full service banking with every conversation aimed at helping clients create , grow , protect & eventually t ransition their wealth. • Deep understanding of our clients needs , goals, and aspirations. » It’s about the client; not a bout us. » Risk management tolerance , time horizon, and other traditional variables are all considered. • A Senior P rivate B anker leads a TEAM to develop and deliver customized solutions. • As One Team , everyone in the Bank helps deliver an exceptional client experience . • Employees are empowered to solve any client service issue. The Peapack - Gladstone Private Banking Model 9
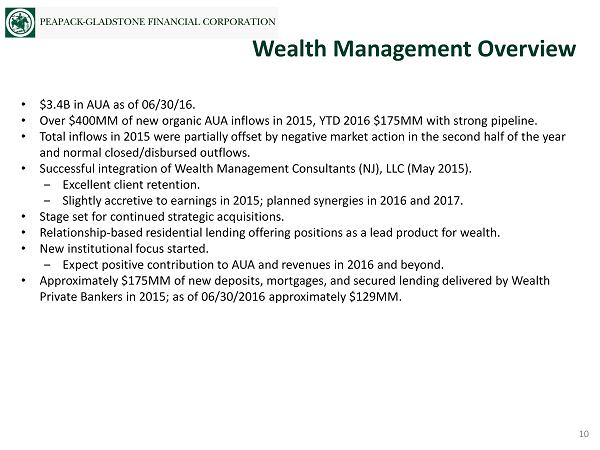
• $3.4B in AUA as of 06/30/16. • Over $ 400MM of new organic AUA inflows in 2015, YTD 2016 $175MM with strong pipeline. • Total inflows in 2015 were partially offset by negative market action in the second half of the year and normal closed/disbursed outflows . • Successful integration of Wealth Management Consultants (NJ), LLC (May 2015). ‒ E xcellent client retention. ‒ Slightly accretive to earnings in 2015; planned synergies in 2016 and 2017. • Stage set for continued strategic acquisitions. • Relationship - based residential lending offering positions as a lead product for wealth. • New institutional focus started. ‒ Expect positive contribution to AUA and revenues in 2016 and beyond. • Approximately $ 175MM of new deposits , mortgages, and secured lending delivered by Wealth Private Bankers in 2015; as of 06/30/2016 approximately $129MM. Wealth Management Overview 10
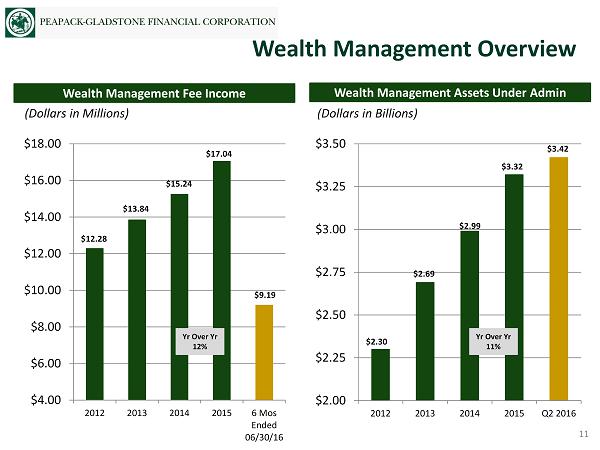
Wealth Management Assets Under Admin Wealth Management Fee Income Wealth Management Overview $4.00 $6.00 $8.00 $10.00 $12.00 $14.00 $16.00 $18.00 2012 2013 2014 2015 6 Mos Ended 06/30/16 (Dollars in Millions) $2.00 $2.25 $2.50 $2.75 $3.00 $3.25 $3.50 2012 2013 2014 2015 Q2 2016 (Dollars in Billions) 11 $12.28 $13.84 $15.24 $17.04 $9.19 $2.30 $2.69 $2.99 $3.42 $3.32 Yr Over Yr 12% Yr Over Yr 11%
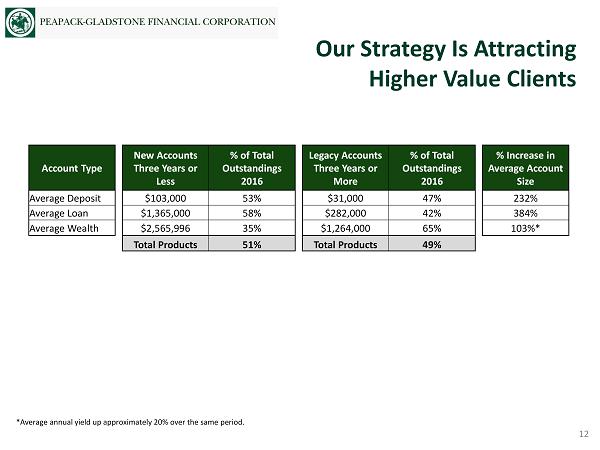
Our Strategy Is Attracting Higher Value Clients Account Type New Accounts Three Years or Less % of Total Outstandings 2016 Legacy Accounts Three Years or More % of Total Outstandings 2016 % Increase in Average Account Size Average Deposit $103,000 53% $31,000 47% 232% Average Loan $1,365,000 58% $282,000 42% 384% Average Wealth $2,565, 996 35% $1,264,000 65% 103%* Total Products 51% Total Products 49% *Average annual yield up approximately 20% over the same period. 12
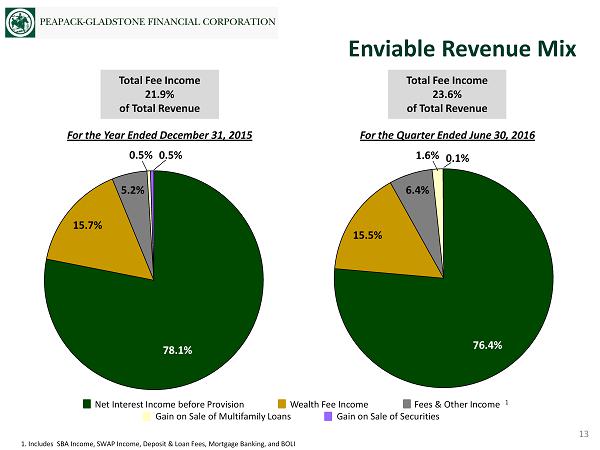
1. Includes SBA Income, SWAP Income, Deposit & Loan Fees, Mortgage Banking, and BOLI Enviable Revenue Mix 76.4% 15.5% 6.4% 0.1% 1 .6% 78.1% 15.7% 5.2% 0.5% 0.5% For the Year Ended December 31, 2015 For the Quarter Ended June 30, 2016 13 Total Fee Income 21.9% of Total Revenue Total Fee Income 23.6% of Total Revenue Net Interest Income before Provision Wealth Fee Income Fees & Other Income Gain on Sale of Multifamily Loans Gain on Sale of Securities 1
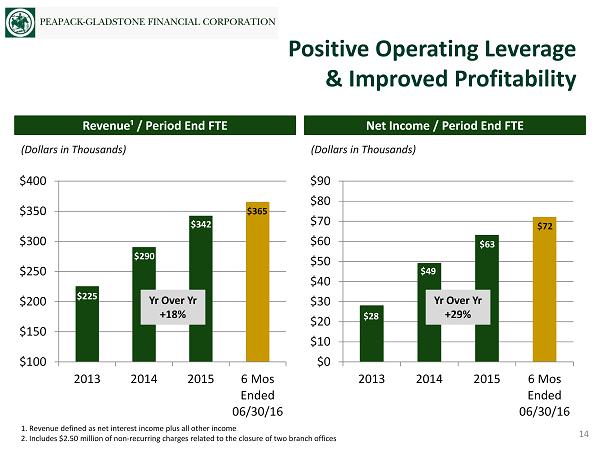
1. Revenue defined as net interest income plus all other income 2. Includes $2.50 million of non - recurring charges related to the closure of two branch offices Net Income / Period End FTE Revenue¹ / Period End FTE (Dollars in Thousands) (Dollars in Thousands) Positive Operating Leverage & Improved Profitability $100 $150 $200 $250 $300 $350 $400 2013 2014 2015 6 Mos Ended 06/30/16 $225 $290 $342 $365 Yr Over Yr +18% $0 $10 $20 $30 $40 $50 $60 $70 $80 $90 2013 2014 2015 6 Mos Ended 06/30/16 Yr Over Yr +29% $28 $49 $63 $72 14
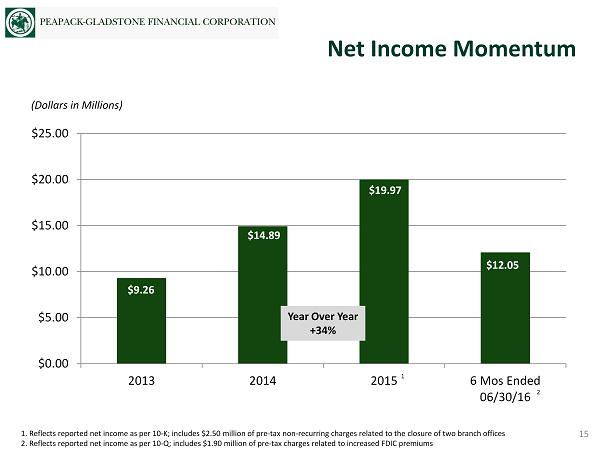
1. Reflects reported net income as per 10 - K; includes $ 2.50 million of pre - tax non - recurring charges related to the closure of two branch offices 2. Reflects reported net income as per 10 - Q; includes $1.90 million of pre - tax charges related to increased FDIC premiums Net Income Momentum $0.00 $5.00 $10.00 $15.00 $20.00 $25.00 2013 2014 2015 6 Mos Ended 06/30/16 2 (Dollars in Millions) $9.26 $14.89 $19.97 $12.05 1 Year Over Year +34% 15
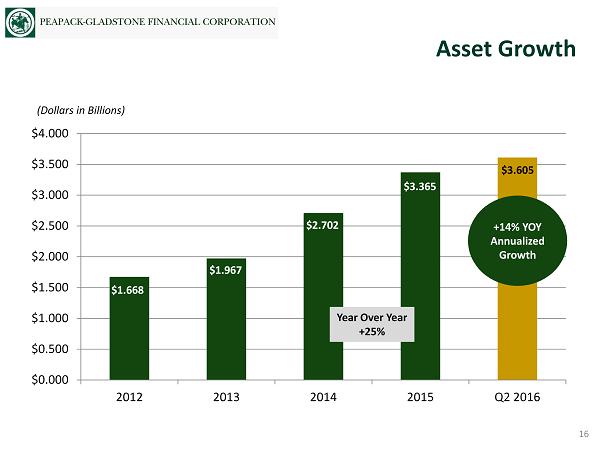
Asset Growth $0.000 $0.500 $1.000 $1.500 $2.000 $2.500 $3.000 $3.500 $4.000 2012 2013 2014 2015 Q2 2016 (Dollars in Billions) $3.605 16 +14% YOY Annualized Growth $3.365 $2.702 $1.967 $1.668 Year Over Year +25%
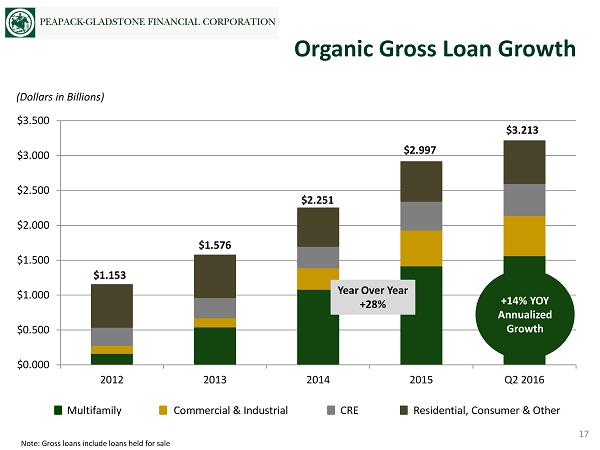
Note: Gross loans include loans held for sale Organic Gross Loan Growth 17 $0.000 $0.500 $1.000 $1.500 $2.000 $2.500 $3.000 $3.500 2012 2013 2014 2015 Q2 2016 $2.997 $2.251 $1.576 $1.153 $3.213 Year Over Year +28% +14% YOY Annualized Growth (Dollars in Billions) Multifamily Commercial & Industrial CRE Residential, Consumer & Oth er
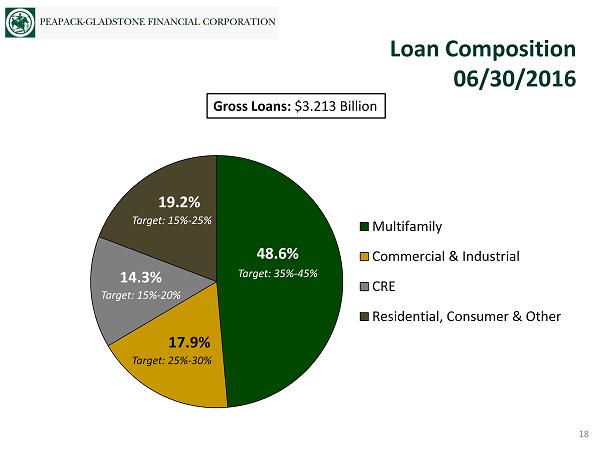
Gross Loans: $3.213 Billion Loan Composition 06/30/2016 Multifamily Commercial & Industrial CRE Residential, Consumer & Other 48.6% 19.2% 17.9% 14.3% 18 Target: 25% - 30% Target: 15% - 25% Target: 15% - 20% Target: 35% - 45%
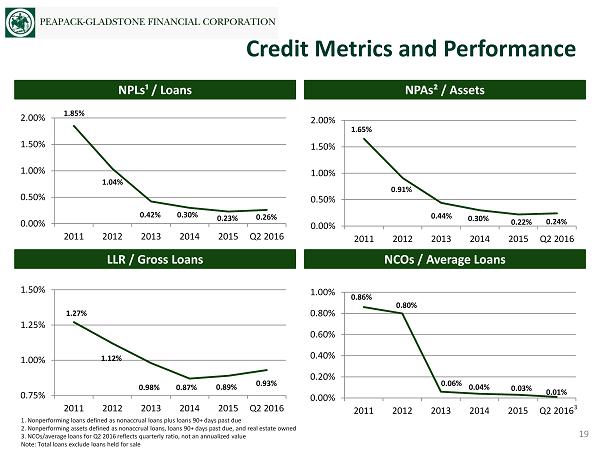
1. Nonperforming loans defined as nonaccrual loans plus loans 90+ days past due 2. Nonperforming assets defined as nonaccrual loans, loans 90+ days past due, and real estate owned 3. NCOs/average loans for Q2 2016 reflects quarterly ratio, not an annualized value Note: Total loans exclude loans held for sale NPAs² / Assets NPLs¹ / Loans NCOs / Average Loans LLR / Gross Loans Credit Metrics and Performance 0.00% 0.50% 1.00% 1.50% 2.00% 2011 2012 2013 2014 2015 Q2 2016 0.00% 0.50% 1.00% 1.50% 2.00% 2011 2012 2013 2014 2015 Q2 2016 0.75% 1.00% 1.25% 1.50% 2011 2012 2013 2014 2015 Q2 2016 0.00% 0.20% 0.40% 0.60% 0.80% 1.00% 2011 2012 2013 2014 2015 Q2 2016 1.85% 0.42% 0.30% 0.23% 0.26% 1.04% 1.65% 0.91% 0.44% 0.30% 0.22% 0.24% 1.27% 1.12% 0.98% 0.87% 0.89% 0.93% 0.86% 0.04% 0.80% 0.06% 0.03% 0.01% 3 19
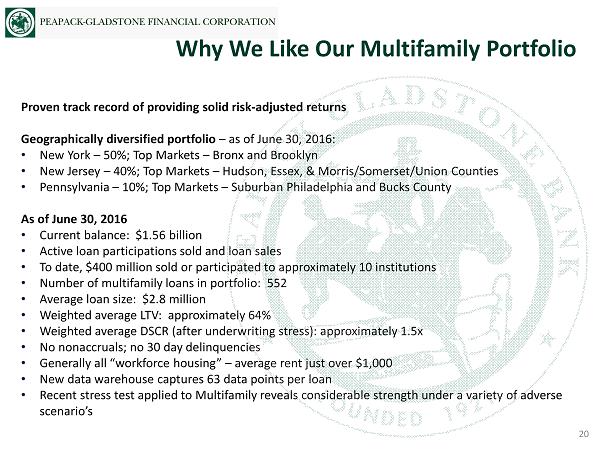
Proven track record of providing solid risk - adjusted returns Geographically diversified portfolio – as of June 30, 2016: • New York – 50%; Top Markets – Bronx and Brooklyn • New Jersey – 40%; Top Markets – Hudson, Essex, & Morris/Somerset/Union Counties • Pennsylvania – 10%; Top Markets – Suburban Philadelphia and Bucks County As of June 30, 2016 • Current balance: $1.56 billion • Active loan participations sold and loan sales • To date , $400 million sold or participated to approximately 10 institutions • Number of multifamily loans in portfolio : 552 • Average loan size : $2.8 million • Weighted average LTV: approximately 64% • Weighted average DSCR (after underwriting stress): approximately 1.5x • No nonaccruals; no 30 day delinquencies • Generally all “workforce housing” – average rent just over $1,000 • New data warehouse captures 63 data points per loan • Recent stress test applied to Multifamily reveals considerable strength under a variety of adverse scenario’s Why We Like Our Multifamily Portfolio 20
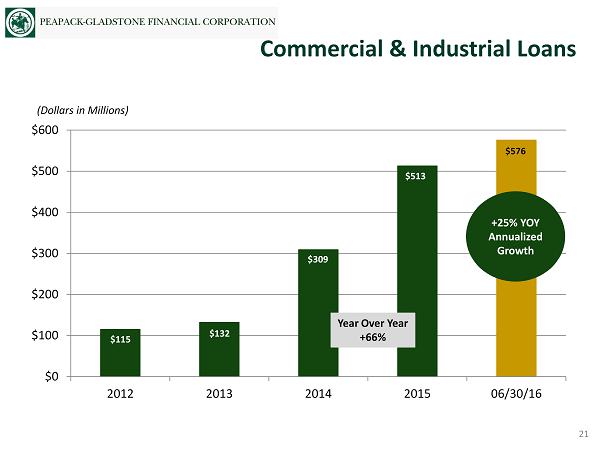
Commercial & Industrial Loans $0 $100 $200 $300 $400 $500 $600 2012 2013 2014 2015 06/30/16 (Dollars in Millions) $115 $132 $309 $513 $576 21 +25% YOY Annualized Growth Year Over Year +66%
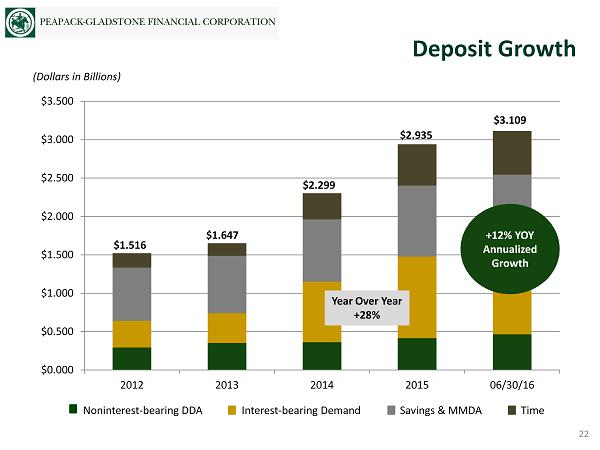
22 $0.000 $0.500 $1.000 $1.500 $2.000 $2.500 $3.000 $3.500 2012 2013 2014 2015 06/30/16 $2.935 $2.299 $1.647 $1.516 $3.109 Deposit Growth Year Over Year +28% +12% YOY Annualized Growth (Dollars in Billions) Noninterest - bearing DDA Interest - bearing Demand Savings & MMDA Time
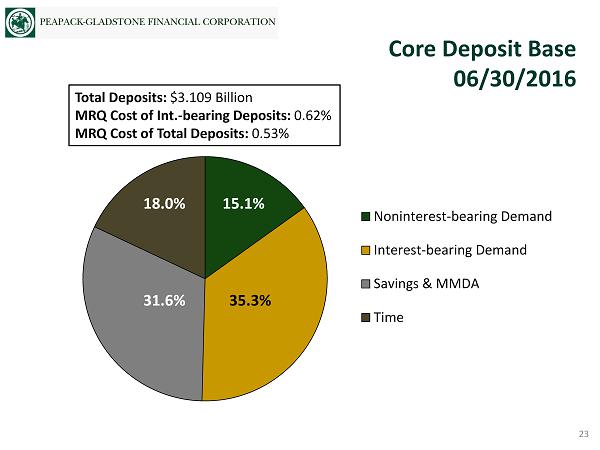
Total Deposits: $3.109 B illion MRQ Cost of Int. - bearing Deposits: 0.62% MRQ Cost of Total Deposits : 0.53% Core Deposit Base 06/30/2016 Noninterest-bearing Demand Interest-bearing Demand Savings & MMDA Time 35.3% 31.6% 18.0% 15.1% 23
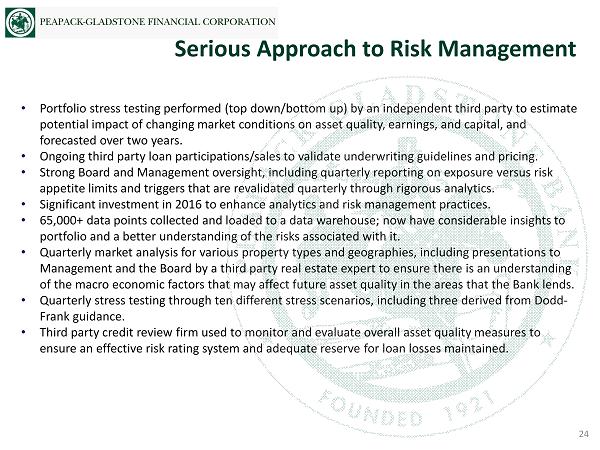
• Portfolio stress testing performed (top down/bottom up) by an independent third party to estimate potential impact of changing market conditions on asset quality, earnings, and capital, and forecasted over two years. • Ongoing third party loan participations/sales to validate underwriting guidelines and pricing. • Strong Board and Management oversight, including quarterly reporting on exposure versus risk appetite limits and triggers that are revalidated quarterly through rigorous analytics . • Significant investment in 2016 to enhance analytics and risk management practices. • 65,000+ data points collected and loaded to a data warehouse; now have considerable insights to portfolio and a better understanding of the risks associated with it. • Quarterly market analysis for various property types and geographies, including presentations to Management and the Board by a third party real estate expert to ensure there is an understanding of the macro economic factors that may affect future asset quality in the areas that the Bank lends. • Quarterly stress testing through ten different stress scenarios, including three derived from Dodd - Frank guidance. • Third party credit review firm used to monitor and evaluate overall asset quality measures to ensure an effective risk rating system and adequate reserve for loan losses maintained . Serious Approach to Risk Management 24
Robust balance sheet risk management: Capital • Stress test enhanced to bottom up / top down on a quarterly basis initiated in Q1 2016. • Ten stress scenarios. Liquidity • $81 million in cash and cash equivalents. • $206 million of unencumbered securities . • Nearly $1 billion additional borrowing capacity available at the FHLB . • Quarterly stress testing. Interest Rate • In an immediate and sustained 200 basis point increase in market rates at June 30, 2016 modeling results show that net interest income for year 1 would increase approximately 6%, when compared to a flat interest rate scenario. In year 2, this sensitivity improves to an expected increase in net interest income of approximately 10%. • Quarterly stress testing. Capital, Liquidity, & Interest Rate Risk Management 25
Financial Highlights P EAPACK - G LADSTONE B ANK
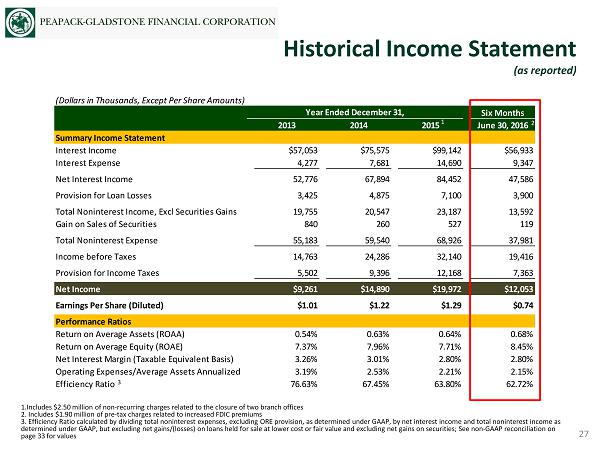
1.Includes $2.50 million of non - recurring charges related to the closure of two branch offices 2. Includes $1.90 million of pre - tax charges related to increased FDIC premiums 3. Efficiency Ratio calculated by dividing total noninterest expenses, excluding ORE provision, as determined under GAAP, by net interest income and total noninterest income as determined under GAAP, but excluding net gains/(losses) on loans held for sale at lower cost or fair value and excluding net gai ns on securities; See non - GAAP reconciliation on page 33 for values Historical Income Statement (as reported) 27 1 (Dollars in Thousands, Except Per Share Amounts) Six Months 2013 2014 2015 June 30, 2016 Summary Income Statement Interest Income $57,053 $75,575 $99,142 $56,933 Interest Expense 4,277 7,681 14,690 9,347 Net Interest Income 52,776 67,894 84,452 47,586 Provision for Loan Losses 3,425 4,875 7,100 3,900 Total Noninterest Income, Excl Securities Gains 19,755 20,547 23,187 13,592 Gain on Sales of Securities 840 260 527 119 Total Noninterest Expense 55,183 59,540 68,926 37,981 Income before Taxes 14,763 24,286 32,140 19,416 Provision for Income Taxes 5,502 9,396 12,168 7,363 Net Income $9,261 $14,890 $19,972 $12,053 Earnings Per Share (Diluted) $1.01 $1.22 $1.29 $0.74 Performance Ratios Return on Average Assets (ROAA) 0.54% 0.63% 0.64% 0.68% Return on Average Equity (ROAE) 7.37% 7.96% 7.71% 8.45% Net Interest Margin (Taxable Equivalent Basis) 3.26% 3.01% 2.80% 2.80% Operating Expenses/Average Assets Annualized 3.19% 2.53% 2.21% 2.15% Efficiency Ratio 76.63% 67.45% 63.80% 62.72% Year Ended December 31, 3 2 1
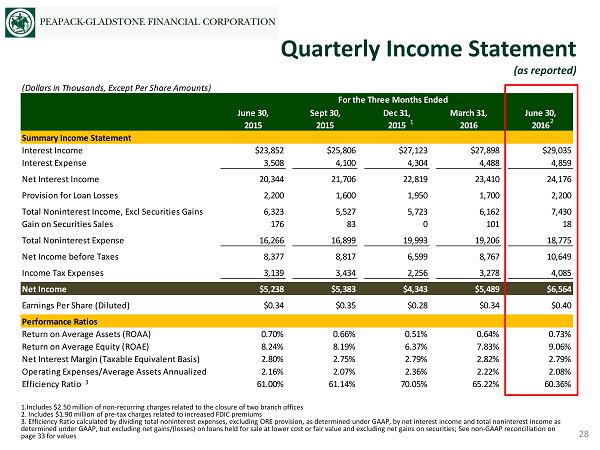
Quarterly Income Statement (as reported) 28 1.Includes $2.50 million of non - recurring charges related to the closure of two branch offices 2. Includes $1.90 million of pre - tax charges related to increased FDIC premiums 3. Efficiency Ratio calculated by dividing total noninterest expenses, excluding ORE provision, as determined under GAAP, by net interest income and total noninterest income as determined under GAAP, but excluding net gains/(losses) on loans held for sale at lower cost or fair value and excluding net gai ns on securities; See non - GAAP reconciliation on page 33 for values (Dollars in Thousands, Except Per Share Amounts) June 30, Sept 30, Dec 31, March 31, June 30, 2015 2015 2015 2016 2016 Summary Income Statement Interest Income $23,852 $25,806 $27,123 $27,898 $29,035 Interest Expense 3,508 4,100 4,304 4,488 4,859 Net Interest Income 20,344 21,706 22,819 23,410 24,176 Provision for Loan Losses 2,200 1,600 1,950 1,700 2,200 Total Noninterest Income, Excl Securities Gains 6,323 5,527 5,723 6,162 7,430 Gain on Securities Sales 176 83 0 101 18 Total Noninterest Expense 16,266 16,899 19,993 19,206 18,775 Net Income before Taxes 8,377 8,817 6,599 8,767 10,649 Income Tax Expenses 3,139 3,434 2,256 3,278 4,085 Net Income $5,238 $5,383 $4,343 $5,489 $6,564 Earnings Per Share (Diluted) $0.34 $0.35 $0.28 $0.34 $0.40 Performance Ratios Return on Average Assets (ROAA) 0.70% 0.66% 0.51% 0.64% 0.73% Return on Average Equity (ROAE) 8.24% 8.19% 6.37% 7.83% 9.06% Net Interest Margin (Taxable Equivalent Basis) 2.80% 2.75% 2.79% 2.82% 2.79% Operating Expenses/Average Assets Annualized 2.16% 2.07% 2.36% 2.22% 2.08% Efficiency Ratio 61.00% 61.14% 70.05% 65.22% 60.36% For the Three Months Ended 1 2 3
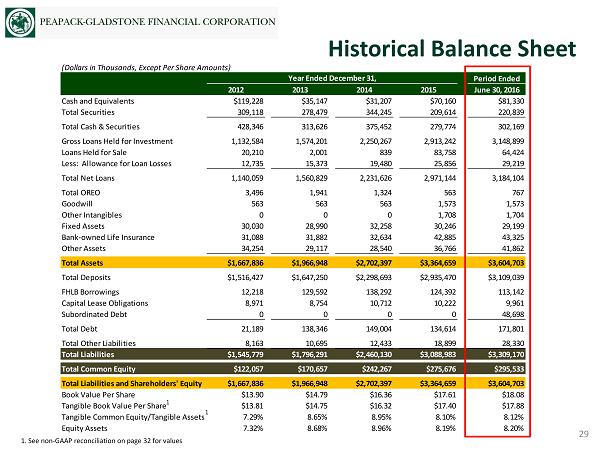
Historical Balance Sheet 29 1. See non - GAAP reconciliation on page 32 for values (Dollars in Thousands, Except Per Share Amounts) Period Ended 2012 2013 2014 2015 June 30, 2016 Cash and Equivalents $119,228 $35,147 $31,207 $70,160 $81,330 Total Securities 309,118 278,479 344,245 209,614 220,839 Total Cash & Securities 428,346 313,626 375,452 279,774 302,169 Gross Loans Held for Investment 1,132,584 1,574,201 2,250,267 2,913,242 3,148,899 Loans Held for Sale 20,210 2,001 839 83,758 64,424 Less: Allowance for Loan Losses 12,735 15,373 19,480 25,856 29,219 Total Net Loans 1,140,059 1,560,829 2,231,626 2,971,144 3,184,104 Total OREO 3,496 1,941 1,324 563 767 Goodwill 563 563 563 1,573 1,573 Other Intangibles 0 0 0 1,708 1,704 Fixed Assets 30,030 28,990 32,258 30,246 29,199 Bank-owned Life Insurance 31,088 31,882 32,634 42,885 43,325 Other Assets 34,254 29,117 28,540 36,766 41,862 Total Assets $1,667,836 $1,966,948 $2,702,397 $3,364,659 $3,604,703 Total Deposits $1,516,427 $1,647,250 $2,298,693 $2,935,470 $3,109,039 FHLB Borrowings 12,218 129,592 138,292 124,392 113,142 Capital Lease Obligations 8,971 8,754 10,712 10,222 9,961 Subordinated Debt 0 0 0 0 48,698 Total Debt 21,189 138,346 149,004 134,614 171,801 Total Other Liabilities 8,163 10,695 12,433 18,899 28,330 Total Liabilities $1,545,779 $1,796,291 $2,460,130 $3,088,983 $3,309,170 Total Common Equity $122,057 $170,657 $242,267 $275,676 $295,533 Total Liabilities and Shareholders' Equity $1,667,836 $1,966,948 $2,702,397 $3,364,659 $3,604,703 Book Value Per Share $13.90 $14.79 $16.36 $17.61 $18.08 Tangible Book Value Per Share $13.81 $14.75 $16.32 $17.40 $17.88 Tangible Common Equity/Tangible Assets 7.29% 8.65% 8.95% 8.10% 8.12% Equity Assets 7.32% 8.68% 8.96% 8.19% 8.20% Year Ended December 31, 1 1
Appendix P EAPACK - G LADSTONE B ANK
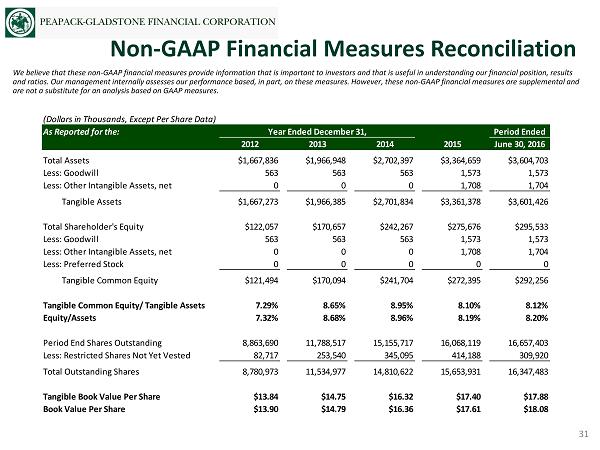
We believe that these non - GAAP financial measures provide information that is important to investors and that is useful in under standing our financial position, results and ratios. Our management internally assesses our performance based, in part, on these measures. However, these non - GAAP financ ial measures are supplemental and are not a substitute for an analysis based on GAAP measures. Non - GAAP Financial Measures Reconciliation 31 (Dollars in Thousands, Except Per Share Data) As Reported for the: Period Ended 2012 2013 2014 2015 June 30, 2016 Total Assets $1,667,836 $1,966,948 $2,702,397 $3,364,659 $3,604,703 Less: Goodwill 563 563 563 1,573 1,573 Less: Other Intangible Assets, net 0 0 0 1,708 1,704 Tangible Assets $1,667,273 $1,966,385 $2,701,834 $3,361,378 $3,601,426 Total Shareholder's Equity $122,057 $170,657 $242,267 $275,676 $295,533 Less: Goodwill 563 563 563 1,573 1,573 Less: Other Intangible Assets, net 0 0 0 1,708 1,704 Less: Preferred Stock 0 0 0 0 0 Tangible Common Equity $121,494 $170,094 $241,704 $272,395 $292,256 Tangible Common Equity/ Tangible Assets 7.29% 8.65% 8.95% 8.10% 8.12% Equity/Assets 7.32% 8.68% 8.96% 8.19% 8.20% Period End Shares Outstanding 8,863,690 11,788,517 15,155,717 16,068,119 16,657,403 Less: Restricted Shares Not Yet Vested 82,717 253,540 345,095 414,188 309,920 Total Outstanding Shares 8,780,973 11,534,977 14,810,622 15,653,931 16,347,483 Tangible Book Value Per Share $13.84 $14.75 $16.32 $17.40 $17.88 Book Value Per Share $13.90 $14.79 $16.36 $17.61 $18.08 Year Ended December 31,
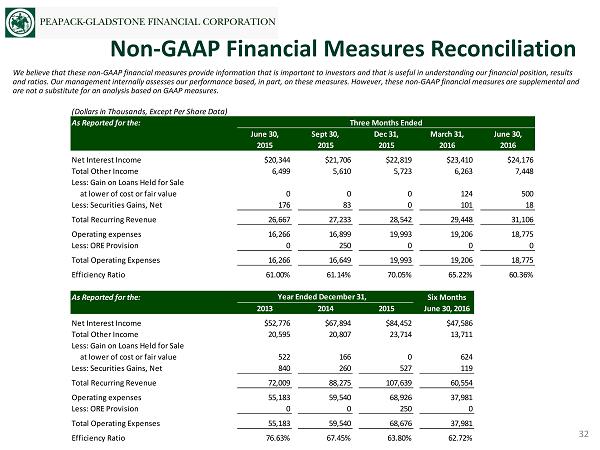
We believe that these non - GAAP financial measures provide information that is important to investors and that is useful in under standing our financial position, results and ratios. Our management internally assesses our performance based, in part, on these measures. However, these non - GAAP financ ial measures are supplemental and are not a substitute for an analysis based on GAAP measures. Non - GAAP Financial Measures Reconciliation 32 (Dollars in Thousands, Except Per Share Data) As Reported for the: June 30, Sept 30, Dec 31, March 31, June 30, 2015 2015 2015 2016 2016 Net Interest Income $20,344 $21,706 $22,819 $23,410 $24,176 Total Other Income 6,499 5,610 5,723 6,263 7,448 Less: Gain on Loans Held for Sale at lower of cost or fair value 0 0 0 124 500 Less: Securities Gains, Net 176 83 0 101 18 Total Recurring Revenue 26,667 27,233 28,542 29,448 31,106 Operating expenses 16,266 16,899 19,993 19,206 18,775 Less: ORE Provision 0 250 0 0 0 Total Operating Expenses 16,266 16,649 19,993 19,206 18,775 Efficiency Ratio 61.00% 61.14% 70.05% 65.22% 60.36% As Reported for the: Six Months 2013 2014 2015 June 30, 2016 Net Interest Income $52,776 $67,894 $84,452 $47,586 Total Other Income 20,595 20,807 23,714 13,711 Less: Gain on Loans Held for Sale at lower of cost or fair value 522 166 0 624 Less: Securities Gains, Net 840 260 527 119 Total Recurring Revenue 72,009 88,275 107,639 60,554 Operating expenses 55,183 59,540 68,926 37,981 Less: ORE Provision 0 0 250 0 Total Operating Expenses 55,183 59,540 68,676 37,981 Efficiency Ratio 76.63% 67.45% 63.80% 62.72% Three Months Ended Year Ended December 31,
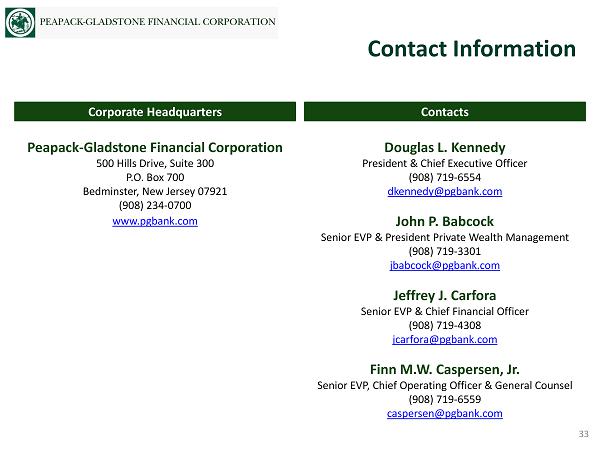
Peapack - Gladstone Financial Corporation 500 Hills Drive, Suite 300 P.O. Box 700 Bedminster, New Jersey 07921 (908) 234 - 0700 www.pgbank.com Douglas L. Kennedy President & Chief Executive Officer (908) 719 - 6554 dkennedy@pgbank.com John P. Babcock Senior EVP & President Private Wealth Management (908) 719 - 3301 jbabcock@pgbank.com Jeffrey J. Carfora Senior EVP & Chief Financial Officer (908) 719 - 4308 jcarfora@pgbank.com Finn M.W. Caspersen, Jr. Senior EVP, Chief Operating Officer & General Counsel (908) 719 - 6559 caspersen@pgbank.com Contacts Corporate Headquarters Contact Information 33