Attached files
| file | filename |
|---|---|
| EX-10.19 - EX-10.19 - Medpace Holdings, Inc. | d125783dex1019.htm |
| EX-23.1 - EX-23.1 - Medpace Holdings, Inc. | d125783dex231.htm |
| EX-10.16 - EX-10.16 - Medpace Holdings, Inc. | d125783dex1016.htm |
| EX-10.15 - EX-10.15 - Medpace Holdings, Inc. | d125783dex1015.htm |
| EX-10.14 - EX-10.14 - Medpace Holdings, Inc. | d125783dex1014.htm |
| EX-10.13 - EX-10.13 - Medpace Holdings, Inc. | d125783dex1013.htm |
| EX-5.1 - EX-5.1 - Medpace Holdings, Inc. | d125783dex51.htm |
Table of Contents
As filed with the Securities and Exchange Commission on August 1, 2016
Registration No. 333-212236
UNITED STATES
SECURITIES AND EXCHANGE COMMISSION
Washington, D.C. 20549
AMENDMENT NO. 2
TO
FORM S-1
REGISTRATION STATEMENT
UNDER
THE SECURITIES ACT OF 1933
MEDPACE HOLDINGS, INC.
(Exact name of registrant as specified in its charter)
| Delaware | 8731 | 32-0434904 | ||
| (State or other jurisdiction of incorporation or organization) |
(Primary Standard Industrial Classification Code Number) |
(I.R.S. Employer Identification No.) |
Medpace Holdings, Inc.
5375 Medpace Way
Cincinnati, Ohio 45227
(513) 579-9911
(Address, including zip code, and telephone number, including area code, of registrant’s principal executive offices)
Dr. August J. Troendle
President and Chief Executive Officer
Jesse J. Geiger
Chief Financial Officer
Medpace Holdings, Inc.
5375 Medpace Way
Cincinnati, Ohio 45227
(513) 579-9911
(Name, address, including zip code, and telephone number, including area code, of agent for service)
Copies to:
| Howard A. Sobel, Esq. Gregory P. Rodgers, Esq. Latham & Watkins LLP 885 Third Avenue New York, NY 10022 Telephone: (212) 906-1200 Fax: (212) 751-4864 |
Glenn R. Pollner, Esq. Gibson, Dunn & Crutcher LLP 200 Park Avenue New York, NY 10166 Telephone: (212) 351-4000 Fax: (212) 351-4035 |
APPROXIMATE DATE OF COMMENCEMENT OF PROPOSED SALE TO THE PUBLIC: AS SOON AS PRACTICABLE AFTER THIS REGISTRATION STATEMENT IS DECLARED EFFECTIVE.
If any of the securities being registered on this form are to be offered on a delayed or continuous basis pursuant to Rule 415 under the Securities Act of 1933, check the following box. ¨
If this form is filed to register additional securities for an offering pursuant to Rule 462(b) under the Securities Act, check the following box and list the Securities Act registration statement number of the earlier effective registration statement for the same offering. ¨
If this form is a post-effective amendment filed pursuant to Rule 462(c) under the Securities Act, check the following box and list the Securities Act registration statement number of the earlier effective registration statement for the same offering. ¨
If this form is a post-effective amendment filed pursuant to Rule 462(d) under the Securities Act, check the following box and list the Securities Act registration statement number of the earlier effective registration statement for the same offering. ¨
Indicate by check mark whether the registrant is a large accelerated filer, an accelerated filer, a non-accelerated filer, or a smaller reporting company. See the definitions of “large accelerated filer,” “accelerated filer” and “smaller reporting company” in Rule 12b-2 of the Exchange Act.
| Large accelerated filer | ¨ | Accelerated filer | ¨ | |||
| Non-accelerated filer | x (Do not check if a smaller reporting company) | Smaller reporting company | ¨ | |||
CALCULATION OF REGISTRATION FEE
|
| ||||||||
| TITLE OF EACH CLASS OF SECURITIES TO BE REGISTERED |
AMOUNT TO BE |
PROPOSED MAXIMUM OFFERING PRICE PER SHARE(2) |
PROPOSED OFFERING PRICE(1)(2) |
AMOUNT OF REGISTRATION | ||||
| Common Stock, $0.01 par value per share |
8,050,000 | $23.00 | $185,150,000.00 | $18,644.61 | ||||
|
| ||||||||
| (1) | Includes 1,050,000 shares of common stock that may be sold if the underwriters’ option to purchase additional shares granted by the Registrant is exercised. |
| (2) | Estimated solely for the purpose of calculating the registration fee pursuant to Rule 457(a) under the Securities Act of 1933, as amended. |
| (3) | The Registrant previously paid $15,105.00 in connection with a prior filing of this Registration Statement on June 24, 2016. |
The Registrant hereby amends this Registration Statement on such date or dates as may be necessary to delay its effective date until the Registrant shall file a further amendment which specifically states that this Registration Statement shall thereafter become effective in accordance with Section 8(a) of the Securities Act of 1933 or until the Registration Statement shall become effective on such date as the Commission, acting pursuant to said Section 8(a), may determine.
Table of Contents
The information in this prospectus is not complete and may be changed. We may not sell these securities until the registration statement filed with the Securities and Exchange Commission is effective. The prospectus is not an offer to sell these securities nor a solicitation of an offer to buy these securities in any jurisdiction where the offer and sale is not permitted.
SUBJECT TO COMPLETION DATED AUGUST 1, 2016
PRELIMINARY PROSPECTUS
7,000,000 Shares
Medpace Holdings, Inc.
Common Stock
Medpace Holdings, Inc. is offering 7,000,000 shares of its common stock. This is our initial public offering, and no public market currently exists for our common stock. We expect the initial public offering price to be between $20.00 and $23.00 per share. We have applied to list our common stock on the NASDAQ Global Select Market under the symbol “MEDP.”
We are an “emerging growth company” as defined by the Jumpstart Our Business Startups Act of 2012 and, as such, we have elected to comply with certain reduced public company reporting requirements for this prospectus and future filings.
Investing in our common stock involves risks. See “Risk Factors” beginning on page 20 to read about factors you should consider before purchasing our common stock.
Neither the Securities and Exchange Commission nor any state securities commission nor any other regulatory body has approved or disapproved of these securities or passed upon the accuracy or adequacy of this prospectus. Any representation to the contrary is a criminal offense.
| PER SHARE | TOTAL | |||||||
| Public Offering Price |
$ | $ | ||||||
| Underwriting Discounts and Commissions (1) |
$ | $ | ||||||
| Proceeds to Medpace Holdings, Inc., before expenses |
$ | $ | ||||||
| (1) | We have agreed to reimburse the underwriters for certain expenses in connection with this offering. See “Underwriting.” |
Our Chief Executive Officer and founder, Dr. August J. Troendle, has indicated an interest to purchase up to $20.0 million in shares of our common stock in this offering at the initial public offering price. However, because indications of interest are not binding agreements or commitments to purchase, Dr. Troendle may determine to increase or reduce the amount of his indication of interest, or otherwise elect not to purchase any shares. It is also possible that the number of shares, if any, allocated to Dr. Troendle in the offering may be smaller than the amount of his indication of interest. Any allocation of shares in the offering to Dr. Troendle will be made at our direction. The underwriters will receive the same underwriting discount on any shares purchased by Dr. Troendle as they will on any other shares sold to the public in this offering.
Delivery of the shares of common stock is expected to be made on or about . We have granted the underwriters an option for a period of 30 days to purchase up to an additional 1,050,000 shares of our common stock. If the underwriters exercise the option in full, the total underwriting discounts and commissions payable by us will be $ , and the total proceeds to us, before expenses will be $ .
Joint Book-Running Managers
| Jefferies | Credit Suisse | |
| UBS Investment Bank | Wells Fargo Securities | |
Co-Managers
| Baird | William Blair |
Prospectus dated , 2016.
Table of Contents
| PAGE | ||||
| 1 | ||||
| 20 | ||||
| 46 | ||||
| 48 | ||||
| 49 | ||||
| 50 | ||||
| 51 | ||||
| 53 | ||||
| MANAGEMENT’S DISCUSSION AND ANALYSIS OF FINANCIAL CONDITION AND RESULTS OF OPERATIONS |
58 | |||
| 88 | ||||
| 104 | ||||
| 110 | ||||
| 120 | ||||
| 125 | ||||
| 127 | ||||
| 132 | ||||
| MATERIAL U.S. FEDERAL INCOME TAX CONSEQUENCES TO NON-U.S. HOLDERS |
134 | |||
| 138 | ||||
| 145 | ||||
| 145 | ||||
| 145 | ||||
| F-1 | ||||
You should rely only on the information contained in this prospectus or in any free writing prospectus we may authorize to be delivered or made available to you. Neither we nor the underwriters (or any of our or their respective affiliates) have authorized anyone to provide any information other than that contained in this prospectus or in any free writing prospectus prepared by or on behalf of us or to which we have referred you. Neither we nor the underwriters (or any of our or their respective affiliates) take any responsibility for, and can provide no assurance as
i
Table of Contents
to the reliability of, any other information that others may give you. We and the underwriters (or any of our or their respective affiliates) are not making an offer to sell these securities in any jurisdiction where the offer or sale is not permitted. You should assume that the information appearing in this prospectus is only accurate as of the date on the front cover of this prospectus. Our business, financial condition, results of operations and prospects may have changed since that date.
TRADEMARKS
We own or have the rights to use various trademarks referred to in this prospectus, including, among others, Medpace and ClinTrak and their respective logos. Solely for convenience, we may refer to trademarks in this prospectus without the TM and ® symbols. Such references are not intended to indicate, in any way, that we will not assert, to the fullest extent permitted by law, our rights to our trademarks. Other trademarks appearing in this prospectus are the property of their respective owners.
MARKET AND INDUSTRY INFORMATION
Market data used throughout this prospectus is based on management’s knowledge of the industry and the good faith estimates of management. All of management’s estimates presented herein are based on industry sources, including analyst reports and management’s knowledge. We also relied, to the extent available, upon management’s review of independent industry surveys and publications prepared by a number of sources and other publicly available information. We are responsible for all of the disclosure in this prospectus and while we believe that each of the publications, studies and surveys used throughout this prospectus are prepared by reputable sources, neither we nor the underwriters have independently verified market and industry data from third-party sources.
All of the market data used in this prospectus involves a number of assumptions and limitations, and you are cautioned not to give undue weight to such estimates. While we believe the estimated market position, market opportunity and market size information included in this prospectus is generally reliable, such information, which in part is derived from management’s estimates and beliefs, is inherently uncertain and imprecise and has not been verified by any independent source. Projections, assumptions and estimates of our future performance and the future performance of the industry in which we operate are necessarily subject to a high degree of uncertainty and risk due to a variety of factors, including those described in “Risk Factors” and elsewhere in this prospectus. These and other factors could cause results to differ materially from those expressed in our estimates and beliefs and in the estimates prepared by independent parties. See “Cautionary Note Regarding Forward Looking Statements.”
GLOSSARY
We define the terms below that appear throughout this prospectus as follows:
“Backlog.” Backlog represents anticipated future net service revenue from net new business awards that have not commenced or are currently in process but not complete.
“Large pharmaceutical companies.” Large pharmaceutical companies represent the top 20 pharmaceutical companies by worldwide prescription drug sales in the year ended December 31, 2014 as classified by Evaluate Ltd in EvaluatePharma© World Preview 2015 Outlook to 2020, an industry report.
“Mid-sized biopharmaceutical companies.” Mid-sized biopharmaceutical companies represent biopharmaceutical companies with at least $250 million in sales in the year ended December 31, 2014, based on publicly available data and management’s knowledge, that are not classified as a top 20 pharmaceutical company by Evaluate Ltd in EvaluatePharma© World Preview 2015 Outlook to 2020, an industry report.
“Net new business awards.” Net new business awards are new business awards net of award modifications and cancellations that had previously been recognized in backlog during the period. New business awards represent the value of anticipated future net service revenue that has been awarded during the period that is recognized in backlog. This value is recognized upon the signing of a contract or receipt of a written pre-contract confirmation from a customer that confirms an agreement in principle on budget and scope. New business awards also include contract amendments, or changes in scope, where the customer has provided written authorization for changes in budget and scope or has approved us to perform additional work as of the measurement date. Awards may not be recognized as
ii
Table of Contents
backlog after consideration of a number of factors, including whether (i) the relevant net service revenue is expected only after a pending regulatory hurdle, which might result in cancellation of the study, (ii) the customer funding needed for commencement of the study is not believed to have been secured or (iii) study timelines are uncertain or not well defined. In addition, study amounts that extend beyond a three-year timeline are not included in backlog.
“Phase I.” Phase I trials are typically conducted in healthy individuals or, on occasion, in patients, and typically involve 20 to 80 subjects and range from a few months to several years. These trials are designed to establish the basic safety, dose tolerance, absorption, metabolism, distribution and excretion of the clinical product candidate, the side effects associated with increasing doses, and if possible, early evidence of effectiveness. If the trial establishes the basic safety and metabolism of the clinical product candidate, Phase II trials are generally initiated.
“Phase II.” Phase II trials are conducted in a limited population of patients with the disease or condition that the clinical product candidate is intended to treat. These trials typically test a few hundred patients and last on average 12 to 18 months. Phase II trials are typically designed to identify possible adverse effects and safety risks, to preliminarily evaluate the efficacy of the clinical product candidate for specific targeted diseases or conditions, and to determine dose tolerance, optimal dosage and dosing schedule. Phase II trials are sometimes divided into two phases: Phase IIa trials typically evaluate the dose response of the clinical product candidate and Phase IIb trials typically evaluate the efficacy of the clinical product candidate at the prescribed doses. If the Phase II trials indicate that the clinical product candidate may be safe and effective, Phase III trials are generally initiated.
“Phase III.” Phase III trials evaluate the clinical product candidate in significantly larger and more diverse patient populations than Phase I and II trials and are conducted at multiple, geographically dispersed sites. On average, this phase lasts from one to three years. Depending on the size and complexity, Phase III CRO contracts may include multiple sequential trials. During this phase, the clinical product candidate’s overall benefit/risk ratio and the basis for product approval are established. If the clinical product candidate successfully completes Phase III, then the sponsor may submit a New Drug Application, or NDA, or Biologics License Application for approval by the United States Food and Drug Administration, or FDA, or a similar marketing authorization application for approval by non-U.S. regulatory agencies.
“Phase IV.” Phase IV or “post-approval” trials are intended to monitor the drug’s long-term risks and benefits, to analyze different dosage levels, to evaluate different safety and efficacy parameters in target populations or to substantiate marketing claims. Phase IV trials typically enroll thousands of patients and last from six months to several years. The FDA may require Phase IV testing and surveillance programs to monitor the effect of approved drugs which have been commercialized, and the FDA has the power to prevent or limit further marketing of a product based on the results of post-marketing programs.
“Small biopharmaceutical companies.” Small biopharmaceutical companies represent biopharmaceutical companies that have less than $250 million in sales in the year ended December 31, 2014, based on publicly available data and management’s knowledge.
NON-GAAP FINANCIAL MEASURES
Certain financial measures presented in this prospectus, such as EBITDA, Adjusted EBITDA, Adjusted Net Income and Free Cash Flow, are not recognized under generally accepted accounting principles in the United States of America, or U.S. GAAP. Management uses EBITDA, Adjusted EBITDA, Adjusted Net Income and Free Cash Flow or comparable metrics:
| n | as a measurement used in evaluating our operating performance on a consistent basis; |
| n | as a consideration to assess incentive compensation for our employees; |
| n | for planning purposes, including the preparation of our internal annual operating budget; and |
| n | to evaluate the performance and effectiveness of our operational strategies. |
We believe that EBITDA and Adjusted EBITDA are useful to provide additional information to investors about certain material non-cash and non-recurring items. While we believe these financial measures are commonly used by investors to evaluate our performance and that of our competitors, because not all companies use identical calculations, this presentation of EBITDA and Adjusted EBITDA may not be comparable to other similarly titled measures of other companies and should not be considered as an alternative to performance measures derived in
iii
Table of Contents
accordance with U.S. GAAP. EBITDA is calculated as net income (loss) attributable to Medpace Holdings, Inc. before income tax expense, interest expense, net, depreciation and amortization with Adjusted EBITDA being further adjusted for unusual and other items. Our presentation of Adjusted EBITDA should not be construed as an inference that our future results will be unaffected by unusual or non-recurring items.
We utilize Free Cash Flow as a measure of profitability and an assessment of our ability to generate cash. Free Cash Flow is a commonly utilized metric that companies provide to investors, although the calculation of Free Cash Flow may not be comparable to other similarly titled metrics of other companies and should not be considered as an alternative to cash flow measures derived in accordance with U.S. GAAP. We define Free Cash Flow as net cash provided by operating activities, less capital expenditures and the principal portion of payments related to campus leases classified for accounting purposes as deemed landlord liabilities.
Adjusted Net Income measures our operating performance by adjusting net income (loss) attributable to Medpace Holdings, Inc. to include cash expenditures related to rental payments on leases classified for accounting purposes as deemed landlord liabilities, and exclude amortization expense, certain stock based compensation award non-cash expenses, certain litigation expenses, deferred financing fees and certain other non-recurring items. Management uses this measure to evaluate our core operating results as it excludes certain items whose fluctuations from period-to-period do not necessarily correspond to changes in the core operations of the business, but includes certain items such as depreciation, interest expense and tax expense, which are otherwise excluded from Adjusted EBITDA. We believe the presentation of Adjusted Net Income enhances our investors’ overall understanding of the financial performance and cash flow of our business. You should not consider Adjusted Net Income as an alternative to net income (loss) attributable to Medpace Holdings Inc., determined in accordance with U.S. GAAP, as an indicator of operating performance.
EBITDA, Adjusted EBITDA, Adjusted Net Income and Free Cash Flow have important limitations as analytical tools and you should not consider them in isolation, or as a substitute for, analysis of our results as reported under U.S. GAAP. See the consolidated financial statements included elsewhere in this prospectus for our U.S. GAAP results. Additionally, for reconciliations of EBITDA, Adjusted EBITDA, Adjusted Net Income and Free Cash Flow to our closest reported U.S. GAAP measures and a further discussion of these metrics, see “Prospectus Summary—Summary Historical Consolidated Financial and Other Data” and “Selected Historical Consolidated Financial and Other Data.”
iv
Table of Contents
This summary highlights information contained elsewhere in this prospectus. This summary does not contain all of the information you should consider before investing in our common stock. You should read this entire prospectus carefully, including the risks of investing in our common stock discussed under “Risk Factors,” “Management’s Discussion and Analysis of Financial Condition and Results of Operations” and our consolidated financial statements and the related notes thereto included elsewhere in this prospectus, before making an investment decision.
As used in this prospectus, unless the context otherwise requires, references to “Medpace,” “the Company,” “our company,” “we,” “us,” and “our” refer to Medpace Holdings, Inc., its consolidated subsidiaries and its predecessor entities.
Throughout this prospectus, we present financial information for two periods, Predecessor and Successor, which relate to the period preceding the consummation of the Transaction (as defined below) on April 1, 2014 and the period succeeding the consummation of the Transaction, respectively. References to the “Successor nine month period ended December 31, 2014” refer to the period from April 1, 2014 to December 31, 2014 and references to the “Predecessor three month period ended March 31, 2014” refer to the period from January 1, 2014 to March 31, 2014.
Overview
We are one of the world’s leading clinical contract research organizations, or CROs, by revenue, solely focused on providing scientifically-driven outsourced clinical development services to the biotechnology, pharmaceutical and medical device industries. Our mission is to accelerate the global development of safe and effective medical therapeutics. We differentiate ourselves from our competitors by our disciplined operating model centered on providing full-service Phase I-IV clinical development services and our therapeutic expertise. We believe this combination results in timely and cost-effective delivery of clinical development services for our customers. We believe that we are a partner of choice for small and mid-sized biopharmaceutical companies based on our ability to consistently utilize our full-service, disciplined operating model to deliver timely and high-quality results for our customers. Accordingly, we believe we are well positioned to continue to expand our market share and sustain margins in the growing $23 billion overall Phase I-IV CRO market.
We were founded in 1992 by Dr. August J. Troendle, an industry pioneer, as a Phase II-IV-focused CRO with a strong, scientifically-driven and disciplined operating model, and we continue today as a founder-led enterprise with Dr. Troendle retaining a significant ownership stake in Medpace. Throughout our 24-year history, we have grown almost exclusively organically, with our core founding members having been integrally involved in developing and instilling our differentiated culture and operating philosophy across our company. We focus on conducting clinical trials across all major therapeutic areas, with particular strength in Cardiology, Metabolic Disease, Oncology, Endocrinology, Central Nervous System, or CNS, Anti-Viral and Anti-Infective, or AVAI, as well as therapeutic expertise in Medical Devices. Our global platform includes approximately 2,300 employees across 35 countries, providing our customers with broad access to diverse markets and patient populations as well as local regulatory expertise and market knowledge.
Our singular focus on executing our disciplined, full-service operating model is a core tenet of our differentiated approach. Our operating model entails partnering with our customers from the beginning of the clinical trial process and holistically navigating all subsequent components of the process. This approach differs from other leading CROs that provide functional or partial outsourcing services as a core component of their business. We believe our full-service approach allows us to deliver timely and high-quality results for our customers. By clearly communicating and aligning our expectations with those of our customers at the beginning of an engagement, we develop a trusted relationship where our customers typically grant us greater control over the clinical trial process. This results in greater accountability on our part and, we believe, more
1
Table of Contents
consistent delivery of our services. We believe our partnering approach, coupled with our full-service, scientifically-driven model, ensures efficient and high-quality trial execution, limits changes in the scope of trials and enables timely completion of trials.
We focus on providing clinical development solutions primarily to companies that recognize the benefits of utilizing our full-service outsourcing model. We believe our model is particularly attractive to small and mid-sized biopharmaceutical companies, which seek specialized capabilities and infrastructure required for complex and global clinical trials, including therapeutic expertise, insightful protocol design, project feasibility assessment and timely and high-quality trial execution. We expect that outsourced development expenditures for small and mid-sized biopharmaceutical companies will continue to outpace outsourced development expenditures for the broader biopharmaceutical market. We believe we can expand our market share with this customer segment given our continued strategic focus and the attractiveness of our model to these companies. Furthermore, as the clinical development and regulatory processes grow increasingly more global and complex, we believe large pharmaceutical companies will increasingly recognize the benefits of our disciplined, full-service operating model. For the Successor year ended December 31, 2015, we generated 55.7%, 29.3% and 15.0% of our net service revenue from small biopharmaceutical companies, mid-sized biopharmaceutical companies and large pharmaceutical companies, respectively.
We believe that our model, focused on full-service delivery, and our attractive customer mix have resulted in robust levels of historical revenue growth, Adjusted EBITDA margins and strong Free Cash Flow. For the Successor year ended December 31, 2015, we generated total net service revenue of $320.1 million and Adjusted EBITDA of $101.2 million, representing net service revenue and Adjusted EBITDA compound annual growth rates, or CAGRs, of 21.7% and 26.2%, respectively, since 2012. Our net (loss) income for the Successor year ended December 31, 2015, the Successor nine month period ended December 31, 2014, the Predecessor three month period ended March 31, 2014 and the Predecessor year ended December 31, 2013 was $(8.7) million, $(14.3) million, $(1.2) million and $24.8 million, respectively, partially as a result of non-cash amortization expense associated with identified intangible assets acquired as part of the Transaction. Over the last 15 years, we have maintained average Adjusted EBITDA margins of approximately 34%, while significantly scaling our business organically and expanding globally. Additionally, we have consistently demonstrated an ability to convert Adjusted EBITDA into Free Cash Flow. Our annual Free Cash Flow conversion, defined as Free Cash Flow divided by Adjusted EBITDA, has averaged 81.7% since 2012. Net cash provided by operating activities for the Successor year ended December 31, 2015, the Successor nine month period ended December 31, 2014, the Predecessor three month period ended March 31, 2014 and the Predecessor year ended December 31, 2013 was $84.1 million, $62.5 million, $12.8 million and $98.1 million, respectively. For a reconciliation of Adjusted EBITDA, a non-GAAP measure, to net (loss) income, and for a reconciliation of Free Cash Flow, also a non-GAAP measure, to net cash provided by operating activities, see “—Summary Historical Consolidated Financial and Other Data.” Additionally, as of June 30, 2016 and December 31, 2015, we had total long-term debt, net of $364.0 million and $377.9 million outstanding, respectively. We intend to use the net proceeds of this offering to repay a portion of this indebtedness. See “Use of Proceeds.”
Our Market
CRO Market Size
We estimate, based on industry sources, including analyst reports and management’s knowledge, that total global biopharmaceutical clinical development expenditures were approximately $100 billion in 2014. We further estimate, based on these industry sources, that the portion of these expenditures attributable to Phase I-IV clinical development services was $44 billion, of which we estimate $23 billion was outsourced. In addition, based on these industry sources, we estimate the CRO market will experience a CAGR of approximately 6% from 2014 through 2019, growing to approximately $31 billion in 2019, as a result of increasing biopharmaceutical clinical development expenditures combined with increased outsourcing penetration.
2
Table of Contents
CRO Market Trends
Increasing Development Expenditures. We estimate that biopharmaceutical development expenditures will grow from approximately $100 billion in 2014 to approximately $114 billion in 2019, representing a CAGR of approximately 3%. We believe that the growth in development expenditures is primarily attributed to the heightened pace of biopharmaceutical innovation, pressure on companies to replenish pipelines with new therapies, the favorable regulatory environment and the significant amount of capital raised by biotechnology and pharmaceutical companies during the last several years. In line with the significant capital raised by biotechnology and pharmaceutical companies, based upon financial data available from FactSet Research Systems Inc., a provider of financial information, as of September 30, 2015, the companies comprising the NASDAQ Biotechnology Index, or NBI, had approximately $109.3 billion in cash available to support ongoing clinical development. This figure represents a 24.7% increase above the cash balance of approximately $87.6 billion held by the companies comprising the NBI as of December 31, 2014, and a 111.5% increase above the cash balance of approximately $51.7 billion held by companies comprising the NBI as of December 31, 2010.
Increasing Outsourcing Penetration. Outsourcing penetration is the percentage of biopharmaceutical clinical development costs that are outsourced to CROs. We estimate, based on industry sources, including analyst reports and management’s knowledge, that approximately 52% of Phase I-IV clinical development expenditures were outsourced in 2014. Driven by increased clinical trial complexity, the need for regulatory and therapeutic expertise and global access to patient populations, we expect outsourcing penetration will reach approximately 62% in 2019.
Pressures Facing Biopharmaceutical Industry. The biopharmaceutical industry continues to experience significant challenges, including regulatory and pricing pressures resulting from healthcare reform, intensifying generic competition, pipeline failures and the need for continued innovation. In order to combat these challenges and maintain revenue growth and operating margins, biopharmaceutical companies increasingly seek clinical expertise and seek to outsource clinical services to CROs to accelerate clinical development and maximize commercialization success.
Increasing Clinical Trial Complexity. Clinical trial design and structure have become increasingly complex based on regulatory agency sophistication, more complicated protocols and a growing focus by biopharmaceutical companies on developing new cutting-edge drug therapies. This growing complexity brings new challenges in study feasibility, site selection, patient recruitment and retention.
Small and Mid-Sized Biopharmaceutical Segment
We believe small and mid-sized biopharmaceutical companies are important to the continued growth of the CRO industry. These companies are primary centers of innovation, developing new, cutting-edge therapies for niche or previously untreatable diseases, which frequently require sophisticated clinical trials. These companies have limited ability to conduct global clinical trials independently, and as a result, they typically seek a strategic partner that can provide the therapeutic experience and infrastructure required to deliver timely completion of complex, global clinical trials. We estimate, based on industry sources, including analyst reports and management’s knowledge, that outsourced development expenditures for these companies will grow at a CAGR of 10% from 2014 to 2019, outpacing the estimated overall biopharmaceutical market CAGR of 6%. In 2014, we estimate, based on industry sources, including analyst reports and management’s knowledge, that small and mid-sized biopharmaceutical companies outsourced approximately 69% of their development expenditures, representing an estimated addressable CRO market of approximately $7 billion, which we estimate, based on these same sources, will increase to approximately 76%, representing an estimated addressable CRO market of approximately $11 billion in 2019.
3
Table of Contents
Our Competitive Strengths
We believe we are well positioned to capitalize on positive trends in the CRO industry based on our key competitive strengths set forth below:
Disciplined and Integrated Full-Service Model. Since our founding in 1992, we have focused on building and executing our disciplined, full-service operating model to provide clinical development services to the biotechnology and pharmaceutical industries. At the center of our differentiated operating model is our full-service focused, end-to-end approach to delivering clinical development services. We partner with customers from the beginning of the clinical trial process and holistically navigate all subsequent components of the process. While many CROs engage in functional or partial outsourcing services as a significant component of their business model, we take a disciplined approach and do not typically provide such piecemeal services. We have developed and consistently utilize effective standard operating procedures, or SOPs, that we believe result in high-quality and timely clinical development outcomes for our customers. Additionally, our operating model utilizes our proprietary ClinTrak clinical trial management software, or ClinTrak, which is customized and streamlined to our SOPs. We believe that a full-service approach delivers greater efficiency, better quality and, ultimately, higher value for our customers.
High-Science Approach with Deep Therapeutic Expertise. Our therapeutic expertise encompasses areas that are among the largest, most complex and fastest growing in pharmaceutical development, including Oncology, Cardiology, Metabolic Disease, Endocrinology, CNS and AVAI, as well as Medical Devices. Our core therapeutic expertise covers the therapeutic areas where a majority of all drugs are currently in development, as identified by Citeline Pharma R&D Annual Review 2016, an industry publication. Collectively, these areas constituted 81.6% of our backlog as of June 30, 2016. We leverage the insights of our senior leaders who have specific therapeutic expertise to employ a high-science approach to our projects. In clinical trial execution, our therapeutic leads are embedded into every aspect of the process from start to finish. Our scientific and medical staff is fundamental to delivering high-quality trial execution and enabling timely completion of complex processes.
Attractive and Diversified Customer Base. We have a strong track record of serving our core customer base of small and mid-sized biopharmaceutical companies, which we believe represents an attractive growth opportunity. We believe outsourced development expenditures in our core customer base will outpace the growth of the broader biopharmaceutical market. While we estimate, based on industry sources, including analyst reports and management’s knowledge, that the overall biopharmaceutical market will grow its outsourced development expenditures for Phase I-IV clinical development and laboratory services at a 6% CAGR from 2014 to 2019, we expect the small and mid-sized biopharmaceutical outsourced development expenditures will grow at a 10% CAGR during this period.
In addition, we have a highly diversified customer base comprising many of the largest global biopharmaceutical companies, as well as high-growth small and mid-sized biopharmaceutical companies. For the Successor year ended December 31, 2015, we generated 55.7%, 29.3% and 15.0% of our net service revenue from small biopharmaceutical companies, mid-sized biopharmaceutical companies and large pharmaceutical companies, respectively. For the Successor six months ended June 30, 2016 and the Successor year ended December 31, 2015, our largest customer accounted for 6.3% and 6.9% of our net service revenue, respectively, and our top 10 customers represented 38.2% and 39.9% of our net service revenue, respectively.
Partner of Choice for Biopharmaceutical Customers. Based on our extensive operating history and therapeutic experience, we believe that we have established a reputation as a partner of choice to our core customer segment of small and mid-sized biopharmaceutical companies. Acting as incubators of pharmaceutical development, small and mid-sized biopharmaceutical companies are responsible for a number of innovative drug candidates currently being developed to address unmet medical needs. These biopharmaceutical customers, sometimes new to the clinical development process, seek to partner with us based on our differentiated approach and expertise to execute trials in a timely and efficient manner. We believe we are viewed as a strategic and trusted partner by these customers given our full-service approach, disciplined
4
Table of Contents
operating model and significant therapeutic expertise. As a result, our customers often grant us significant autonomy in executing clinical trials for their most valued assets.
Global Platform with Scalable Infrastructure. We believe that we are one of the leading CROs with the scale and therapeutic expertise necessary to effectively conduct global clinical trials. We began our disciplined international expansion in 2004 and have since increased the breadth and depth of our international footprint significantly, with approximately 45% of our clinical operations employees located outside of North America as of June 30, 2016. We now offer our services through a highly skilled staff of approximately 2,300 employees across 35 countries as of June 30, 2016.
Strong Financial Performance. We have a proven track record of strong organic growth and achieved significant revenue and Adjusted EBITDA growth and robust Free Cash Flow over the past several years. For the Successor year ended December 31, 2015, we achieved net service revenue of $320.1 million and Adjusted EBITDA of $101.2 million, which represent a CAGR of 21.7% and 26.2%, respectively, since 2012. Our net (loss) income for the Successor year ended December 31, 2015, the Successor nine month period ended December 31, 2014, the Predecessor three month period ended March 31, 2014 and the Predecessor year ended December 31, 2013 was $(8.7) million, $(14.3) million, $(1.2) million and $24.8 million, respectively, partially as a result of non-cash amortization expense associated with identified intangible assets acquired as part of the Transaction. For the Successor year ended December 31, 2015, our Adjusted EBITDA margin was 31.6%. Additionally, we have consistently demonstrated an ability to convert Adjusted EBITDA into Free Cash Flow. Our annual Free Cash Flow conversion, defined as Free Cash Flow divided by Adjusted EBITDA, has averaged 81.7% since 2012. Net cash provided by operating activities for the Successor year ended December 31, 2015, the Successor nine month period ended December 31, 2014, the Predecessor three month period ended March 31, 2014 and the Predecessor year ended December 31, 2013 was $84.1 million, $62.5 million, $12.8 million and $98.1 million, respectively. For a reconciliation of Adjusted EBITDA, a non-GAAP measure, to net (loss) income, and for a reconciliation of Free Cash Flow, also a non-GAAP measure, to net cash provided by operating activities, see “—Summary Historical Consolidated Financial and Other Data.” Additionally, as of June 30, 2016 and December 31, 2015, we had total long-term debt, net of $364.0 million and $377.9 million outstanding, respectively. We intend to use the net proceeds of this offering to repay a portion of this indebtedness. See “Use of Proceeds.”
Highly Regarded, Experienced and Committed Management Team. We are led by a dedicated and experienced senior management team with significant industry experience and knowledge focused on clinical development. We were founded in 1992 by Dr. August J. Troendle, an industry pioneer, and we continue today as a founder-led enterprise with Dr. Troendle retaining a significant ownership stake in Medpace. Our management team has been responsible for developing our scientifically-driven, disciplined operating model, building our global platform and realizing our significant organic growth in revenue and earnings. Our senior management team has an average tenure with Medpace of 12 years, including four senior managers with over 20 years with us, and brings a healthy balance of significant experience with Medpace, regulators and other companies in the industry, including public companies.
Our Growth Strategy
Key elements of our growth strategy include:
Continued Focus on Organic Growth. Our strong organic growth has been the result of consistently reinvesting our positive cash flow to support our therapeutic capabilities, service offerings and global expansion. As a founder-led enterprise, we intend to continue to emphasize preserving our unique culture and operating philosophy as we grow our scientific capabilities and clinical trial expertise by further investing in human capital. In addition to leveraging our operating model, we intend to continue to selectively hire employees to strengthen and expand our expertise in high-growth therapeutic areas, including Oncology, CNS and AVAI. We methodically look to hire employees early in their careers and thoroughly train them to excel in our disciplined operating model, while instilling within them our corporate culture and philosophy. We apply this same training and standardization globally in order to maintain consistency and minimize inefficiencies in our operations.
5
Table of Contents
Continue to Sustain Industry-Leading Margins. Over the last 15 years, we have maintained average Adjusted EBITDA margins of approximately 34%. We intend to continue to maintain industry-leading margins (compared to our public competitors) while growing organically. We believe the key to sustaining margins is through the execution of our disciplined operating philosophy and full-service business model. Furthermore, we intend to continue to develop our centralized operations at our corporate headquarters in order to maintain standardization and consistency across our global operations.
Leverage Our Experience and Reputation in the Attractive, High-Growth Clinical Development Market. Our customers value the knowledge and therapeutic expertise we have developed from a long history of successfully executing clinical trials. As the regulatory landscape adapts to greater clinical trial complexity, we believe that biopharmaceutical companies will increasingly engage CROs with the requisite global resources as well as therapeutic and regulatory expertise to assume full responsibility of the clinical trial process. Based on our successful execution of clinical trials across many therapeutic areas in multiple countries, as well as our focus on closely partnering with our customers through all aspects of the clinical trial process, we believe we have developed a strong reputation in the industry as a leading CRO. We believe that this reputation positions us to continue capturing additional share of the attractive, high-growth clinical development market as the industry increasingly recognizes the benefits of our operating model.
Deepen Existing and Develop New Relationships with Our Core Customer Segment. We look to continue to deepen our long-standing relationships with existing customers through new engagements and expand our relationships with new small and mid-sized biopharmaceutical customers. As a strategic partner of choice, we clearly communicate and align our expectations with our customers at the beginning of an engagement to develop a close working relationship that is built on trust. We believe this trust, supported by our high-quality execution and frequent dialogue with our customers’ key decision makers, positions us to be awarded additional business in existing and new therapies, allowing us to grow alongside our customers and leading to an increasingly significant, and growing, contribution from repeat business. While our successes to date have built a substantial customer base, we believe that there is opportunity for continued growth and penetration in our core customer segment. We place our therapeutic leads alongside our sales team to actively participate in the procurement of new customers whose portfolios align with our therapeutic expertise, which we believe further differentiates us from our competitors.
Pursue Selective and Complementary Bolt-On Acquisitions. We intend to augment our organic growth with targeted acquisitions to expand our current capabilities and service offerings that are complementary to our full-service model. Our acquisition strategy is driven by our comprehensive commitment to serve customer needs. While we are continuously assessing the market for attractive opportunities, we do so selectively with a focus on targeting opportunities to acquire and integrate complementary and strategic, non-transformative acquisitions within the CRO sector in order to strengthen our competitive position and provide enhanced value to our customers.
Position Ourselves to Increase Our Presence Among Large Pharmaceutical Companies as These Customers Adopt and Appreciate the Full-Service Approach. Given the growing pressures large pharmaceutical companies are facing, these companies seek solutions beyond simply outsourcing clinical development. These companies are increasingly seeking strategic partnerships that provide more holistic clinical development services and also the expertise that CRO partners offer. We have witnessed a noticeable shift by large pharmaceutical companies away from lower-value, functional outsourcing service providers toward full-service CROs. Given our differentiated operating model, we believe larger pharmaceutical companies will be increasingly appreciative of our proven approach to clinical development and expertise, and we intend to actively market the strength and depth of our services to these companies.
6
Table of Contents
Implications of Being an Emerging Growth Company
As a company with less than $1.0 billion in revenues during our last fiscal year, we qualify as an “emerging growth company” as defined in the Jumpstart Our Business Startups Act of 2012, or the JOBS Act. An emerging growth company may take advantage of specified reduced reporting and other regulatory requirements for up to five years that are otherwise applicable generally to public companies. These provisions include, among other matters:
| n | exemption from the auditor attestation requirement on the effectiveness of our system of internal control over financial reporting; |
| n | exemption from the adoption of new or revised financial accounting standards until they would apply to private companies; |
| n | exemption from compliance with any new requirements adopted by the Public Company Accounting Oversight Board requiring mandatory audit firm rotation or a supplement to the auditor’s report in which the auditor would be required to provide additional information about the audit and the financial statements of the issuer; |
| n | an exemption from the requirement to seek non-binding advisory votes on executive compensation and golden parachute arrangements; and |
| n | reduced disclosure about executive compensation arrangements. |
Section 107 of the JOBS Act provides that an emerging growth company can take advantage of the extended transition period provided in Section 7(a)(2)(B) of the Securities Act of 1933, as amended, or the Securities Act, for complying with new and revised accounting standards. An emerging growth company can, therefore, delay the adoption of certain accounting standards until those standards would otherwise apply to private companies. However, we are choosing to “opt out” of that extended transition period and, as a result, we plan to comply with new and revised accounting standards on the relevant dates on which adoption of those standards is required for non-emerging growth companies. Section 107 of the JOBS Act provides that our decision to opt out of the extended transition period for complying with new and revised accounting standards is irrevocable.
We will remain an emerging growth company for five years unless, prior to that time, we (i) have more than $1.0 billion in annual revenues, (ii) have a market value for our common stock held by non-affiliates of more than $700 million as of the last day of our second fiscal quarter of the fiscal year when a determination is made whether we are deemed to be a “large accelerated filer,” as defined in Rule 12b-2 promulgated under the Securities Exchange Act of 1934, as amended, or the Exchange Act, or (iii) issue more than $1.0 billion of non-convertible debt over a three-year period.
We have elected to take advantage of some of the reduced disclosure obligations listed above in this prospectus, and may elect to take advantage of other reduced reporting requirements in future filings. As a result, the information that we provide to our shareholders may be different than you might receive from other public reporting companies in which you hold equity interests. In addition, it is possible that some investors will find our common stock less attractive as a result of our elections, which may cause a less active trading market for our common stock and more volatility in our stock price.
Risks Associated with Our Business
Investing in our common stock involves a number of risks, including the following:
| n | The potential loss, delay or non-renewal of our contracts, or the non-payment by our customers for services that we have performed, could adversely affect our results. |
| n | Our backlog may not convert to net service revenue at our historical conversion rates. |
| n | Our operating results have historically fluctuated between fiscal quarters and years and may continue to fluctuate in the future, which may adversely affect the market price of our stock after this offering. |
| n | Our operating margins could decrease due to increased pricing pressure or other pressures. |
7
Table of Contents
| n | If we fail to perform our services in accordance with contractual requirements, government regulations and ethical considerations, we could be subject to significant costs or liability and our reputation could be adversely affected. |
| n | Outsourcing trends in the biopharmaceutical industry and changes in aggregate expenditures and R&D budgets could adversely affect our operating results and growth rate. |
| n | We face intense competition in many areas of our business and, if we do not compete effectively, our business may be harmed. |
| n | Our indebtedness could adversely affect our financial condition and prevent us from fulfilling our debt obligations and may otherwise restrict our activities. |
| n | Cinven (defined below) and Dr. August J. Troendle, our Chief Executive Officer and founder, will collectively own a substantial majority of our outstanding common stock after this offering, and they will have control over decisions that require the approval of shareholders, which could limit your ability to influence the outcome of matters submitted to shareholders for a vote. In addition, their interests may be different from or conflict with yours. |
| n | Upon the listing of our shares on the NASDAQ Global Select Market, or NASDAQ, we will be a “controlled company” within the meaning of the NASDAQ rules and, as a result, will qualify for, and intend to rely on, exemptions from certain corporate governance requirements. You will not have the same protections afforded to shareholders of companies that are subject to such requirements. |
These and other risks are more fully described in the section entitled “Risk Factors” below, which you should carefully read and consider before making a decision to invest in our common stock. If any of these risks actually occur, our business, financial condition, results of operations, cash flows or reputation would likely be materially adversely affected. In such case, the trading price of our common stock would likely decline, and you could lose all or part of your investment.
The Transaction
In April 2014, investment funds managed by Cinven Capital Management (V) General Partner Limited, or Cinven, a private equity firm, acquired 100% of the outstanding shares of Medpace IntermediateCo, Inc., or Medpace IntermediateCo, for an aggregate purchase price of $921.3 million. In connection with the acquisition, certain employees of the Company, through Medpace Investors, LLC, or MPI, agreed to contribute shares held in Medpace IntermediateCo in exchange for a percentage stake in Medpace Holdings, Inc. We refer to these transactions, collectively, as the “Transaction.” Immediately following the Transaction, Cinven and MPI owned approximately 75% and 25%, respectively, of Medpace Holdings, Inc. For an overview of our ownership structure following this offering, see “—Our Structure.”
Prior to the Transaction, CCMP Capital, or CCMP, a private equity firm, held 80% of our equity interests and the noncontrolling interests were held by certain current and former members of management, along with former members of the board of directors of Medpace, Inc., our wholly owned subsidiary.
Our Private Equity Sponsor
The Cinven group is a leading private equity firm, founded in 1977, with offices in Guernsey, London, Frankfurt, Paris, Madrid, Milan, Luxembourg, Hong Kong and New York. The group focuses on investments across six core sectors: Healthcare, Financial Services, Business Services, Consumer, Industrials and Technology and Media and Telecommunications. Its funds acquire high-quality companies and work with them to help them grow and develop. The Cinven group is a responsible investor, seeking to build long-term value through sustainable growth in the portfolio companies of its funds with consideration for their employees, suppliers, local communities, the environment and society. Since 1977, the Cinven group has completed transactions valued at in excess of €85 billion.
Upon the completion of this offering, Cinven will own approximately 58.0% of the outstanding shares of our common stock (or 56.5% if the underwriters exercise their option to purchase additional shares in full).
8
Table of Contents
Accordingly, Cinven will be able to exert a significant degree of influence or actual control over our management and affairs. See “Risk Factors—Risks Relating to Our Common Stock and This Offering—Cinven and our Chief Executive Officer and founder will collectively control a substantial majority of our outstanding common stock following this offering and their interests may be different from or conflict with those of our other shareholders” and “Principal Shareholders.”
Our Structure
The diagram below reflects a simplified overview of our organizational structure following this offering (including the application of the net proceeds therefrom):
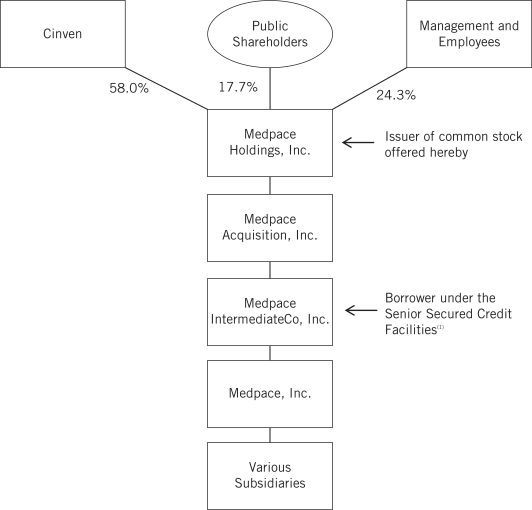
| (1) | In conjunction with the Transaction, we entered into a new credit agreement, which provided for a $530.0 million term loan, or the Senior Secured Term Loan Facility, and a $60.0 million revolving credit facility, or the Senior Secured Revolving Credit Facility, and, together with the Senior Secured Term Loan Facility, the Senior Secured Credit Facilities. As of June 30, 2016, as described under “Use of Proceeds,” on an as adjusted basis after giving effect to this offering and the use of proceeds therefrom, we would have had approximately $225.7 million of outstanding indebtedness under our Senior Secured Term Loan Facility and no borrowings outstanding under our Senior Secured Revolving Credit Facility. For additional information about our Senior Secured Credit Facilities, see “Management’s Discussion and Analysis of Financial Condition and Results of Operations—Liquidity and Capital Resources—Indebtedness.” |
9
Table of Contents
Corporate Information
We are a Delaware corporation and were incorporated on February 18, 2014. Our principal executive offices are located at 5375 Medpace Way, Cincinnati, Ohio 45227, and our telephone number is (513) 579-9911. Our corporate website address is www.medpace.com. Our website and the information contained in, or that can be accessed through, our website is not deemed to be incorporated by reference in, and is not considered part of, this prospectus. You should not rely on any such information in making your decision whether to purchase our common stock.
10
Table of Contents
THE OFFERING
| Common stock offered by us |
7,000,000 shares. |
| Option to purchase additional shares of common stock |
The underwriters have the option to purchase up to an additional 1,050,000 shares of common stock from us. The underwriters can exercise this option at any time within 30 days from the date of this prospectus. |
| Common stock to be outstanding after this offering |
39,642,113 shares (40,692,113 shares if the underwriters’ exercise their option to purchase additional shares in full). |
| Use of proceeds |
We estimate that the net proceeds to us from our sale of 7,000,000 shares of common stock in this offering will be approximately $138.3 million, assuming an initial public offering price of $21.50 per share (the midpoint of the price range listed on the cover page of this prospectus), and after deducting estimated underwriting discounts and commissions and estimated expenses payable by us in connection with this offering. We intend to use the net proceeds of this offering to repay $138.3 million in aggregate principal amount of outstanding borrowings under our Senior Secured Term Loan Facility. In the event that the underwriters exercise their option to purchase additional shares, we intend to use the net proceeds from the sale of such shares to repay additional borrowings outstanding under our Senior Secured Term Loan Facility. See “Use of Proceeds.” |
| Dividend policy |
We have no current plans to pay any cash dividends on our common stock in the foreseeable future; however, we may change this policy in the future. See “Dividend Policy.” |
| Risk factors |
Investing in our common stock involves a high degree of risk. See “Risk Factors” beginning on page 20 of this prospectus for a discussion of factors you should consider carefully before investing in our common stock. |
| Listing |
We have applied to list our common stock on NASDAQ under the symbol “MEDP.” |
Except as otherwise indicated in this prospectus, the number of shares of common stock to be outstanding after this offering is based on 32,642,113 shares outstanding as of June 30, 2016 and excludes:
| n | 1,779,637 shares of common stock issuable upon exercise of stock options outstanding as of June 30, 2016 at a weighted average exercise price of $15.48 per share; and |
| n | an additional 6,000,000 shares of common stock reserved for future issuance under our 2016 Incentive Award Plan, or the Plan, including pursuant to equity awards to be granted in connection with this offering, as described in “Executive and Director Compensation—Narrative to Summary Compensation Table—Offering Grants to Employees under the 2016 Incentive Award Plan.” |
Unless otherwise indicated, all information in this prospectus:
| n | assumes the initial public offering price of $21.50 per share (the midpoint of the price range listed on the cover page of this prospectus); |
| n | assumes no exercise of the underwriters’ option to purchase additional shares of our common stock; |
11
Table of Contents
| n | assumes the filing of our amended and restated certificate of incorporation and the adoption of our amended and restated bylaws, which will be in effect prior to the consummation of this offering; and |
| n | with respect to the Successor periods presented, reflects a 1-for-1.35 reverse stock split of our common stock, which we effectuated on July 25, 2016. |
Our Chief Executive Officer and founder, Dr. August J. Troendle, has indicated an interest to purchase up to $20.0 million in shares of our common stock in this offering at the initial public offering price. However, because indications of interest are not binding agreements or commitments to purchase, Dr. Troendle may determine to increase or reduce the amount of his indication of interest, or otherwise elect not to purchase any shares. It is also possible that the number of shares, if any, allocated to Dr. Troendle in the offering may be smaller than the amount of his indication of interest. Any allocation of shares in the offering to Dr. Troendle will be made at our direction. The underwriters will receive the same underwriting discount on any shares purchased by Dr. Troendle as they will on any other shares sold to the public in this offering.
12
Table of Contents
SUMMARY HISTORICAL CONSOLIDATED FINANCIAL AND OTHER DATA
The following tables set forth our summary consolidated financial and other data for the periods ending on and as of the dates indicated. We derived the consolidated statements of operations data for the years ended December 31, 2013 (Predecessor) and December 31, 2015 (Successor) from our audited consolidated financial statements and the related notes thereto included elsewhere in this prospectus. We derived the consolidated statements of operations data for the Predecessor three month period ended March 31, 2014 and the Successor nine month period ended December 31, 2014 from our audited consolidated financial statements and the related notes thereto included elsewhere in this prospectus. We derived the condensed consolidated statements of operations data for the Successor six months ended June 30, 2015 and June 30, 2016 and the condensed consolidated balance sheet data as of June 30, 2016 from our unaudited condensed consolidated financial statements included elsewhere in this prospectus. We have prepared the unaudited condensed consolidated financial information set forth below on the same basis as our audited consolidated financial statements and have included all adjustments, consisting of only normal recurring adjustments, that we consider necessary for a fair presentation of our financial position and operating results for such periods.
The accompanying consolidated statements of operations, cash flows and shareholders’ equity are presented for two periods, Predecessor and Successor, which relate to the period preceding the Transaction and the period succeeding the Transaction, respectively. The Company refers to the operations of Medpace Holdings, Inc. and subsidiaries for both the Predecessor period and Successor period.
The results for any interim period are not necessarily indicative of the results that may be expected for a full year. Additionally, our historical results are not necessarily indicative of future results. You should read the information set forth below together with “Selected Historical Consolidated Financial and Other Data,” “Management’s Discussion and Analysis of Financial Condition and Results of Operations,” “Capitalization” and our consolidated financial statements and the related notes thereto included elsewhere in this prospectus.
| SUCCESSOR | PREDECESSOR | |||||||||||||||||||||||
| (In thousands, except per share data) | SIX MONTHS ENDED JUNE 30, 2016 |
SIX MONTHS ENDED JUNE 30, 2015 |
YEAR ENDED DECEMBER 31, 2015 |
NINE MONTH PERIOD FROM APRIL 1, 2014 THROUGH DECEMBER 31, 2014 |
THREE MONTH PERIOD FROM JANUARY 1, 2014 THROUGH MARCH 31, 2014 |
YEAR ENDED DECEMBER 31, 2013 |
||||||||||||||||||
| Consolidated Statements of Operations Data: |
||||||||||||||||||||||||
| Service revenue, net |
$ | 180,433 | $ | 152,782 | $ | 320,101 | $ | 219,791 | $ | 70,250 | $ | 244,270 | ||||||||||||
| Reimbursed out-of-pocket revenue |
25,107 | 18,105 | 38,958 | 28,708 | 7,679 | 28,620 | ||||||||||||||||||
|
|
|
|
|
|
|
|
|
|
|
|
|
|||||||||||||
| Total revenue |
205,540 | 170,887 | 359,059 | 248,499 | 77,929 | 272,890 | ||||||||||||||||||
| Operating expenses: |
||||||||||||||||||||||||
| Direct costs, excluding depreciation and amortization |
96,215 | 77,725 | 163,707 | 117,550 | 38,759 | 119,779 | ||||||||||||||||||
| Reimbursed out-of-pocket expenses |
25,107 | 18,105 | 38,958 | 28,708 | 7,679 | 28,620 | ||||||||||||||||||
| Selling, general and administrative |
28,333 | 23,448 | 56,998 | 29,465 | 10,203 | 35,109 | ||||||||||||||||||
| Acquisition and integration |
— | — | — | 9,297 | 12,420 | — | ||||||||||||||||||
| Impairment of goodwill |
— | — | 9,313 | — | — | — | ||||||||||||||||||
| Depreciation |
3,566 | 3,110 | 6,379 | 4,610 | 1,832 | 6,665 | ||||||||||||||||||
| Amortization |
25,336 | 34,243 | 63,142 | 56,422 | 5,199 | 23,854 | ||||||||||||||||||
|
|
|
|
|
|
|
|
|
|
|
|
|
|||||||||||||
| Total operating expenses |
178,557 | 156,631 | 338,497 | 246,052 | 76,092 | 214,027 | ||||||||||||||||||
13
Table of Contents
| SUCCESSOR | PREDECESSOR | |||||||||||||||||||||||
| (In thousands, except per share data) | SIX MONTHS ENDED JUNE 30, 2016 |
SIX MONTHS ENDED JUNE 30, 2015 |
YEAR ENDED DECEMBER 31, 2015 |
NINE MONTH PERIOD FROM APRIL 1, 2014 THROUGH DECEMBER 31, 2014 |
THREE MONTH PERIOD FROM JANUARY 1, 2014 THROUGH MARCH 31, 2014 |
YEAR ENDED DECEMBER 31, 2013 |
||||||||||||||||||
| Income from operations |
26,983 | 14,256 | 20,562 | 2,447 | 1,837 | 58,863 | ||||||||||||||||||
| Other (expense) income, net: |
||||||||||||||||||||||||
| Miscellaneous (expense) income, net |
(941 | ) | (978 | ) | (1,133 | ) | (301 | ) | 1,213 | (1,718 | ) | |||||||||||||
| Interest expense, net |
(11,894 | ) | (13,975 | ) | (27,259 | ) | (23,185 | ) | (3,272 | ) | (18,000 | ) | ||||||||||||
|
|
|
|
|
|
|
|
|
|
|
|
|
|||||||||||||
| Total other expense, net |
(12,835 | ) | (14,953 | ) | (28,392 | ) | (23,486 | ) | (2,059 | ) | (19,718 | ) | ||||||||||||
|
|
|
|
|
|
|
|
|
|
|
|
|
|||||||||||||
| Income (loss) before income taxes |
14,148 | (697 | ) | (7,830 | ) | (21,039 | ) | (222 | ) | 39,145 | ||||||||||||||
| Income tax provision (benefit) |
5,738 | (733 | ) | 843 | (6,703 | ) | 1,014 | 14,301 | ||||||||||||||||
|
|
|
|
|
|
|
|
|
|
|
|
|
|||||||||||||
| Net income (loss) |
$ | 8,410 | $ | 36 | $ | (8,673 | ) | $ | (14,336 | ) | $ | (1,236 | ) | $ | 24,844 | |||||||||
|
|
|
|
|
|
|
|
|
|
|
|
|
|||||||||||||
| Net income (loss) per share attributable to common shareholders: |
||||||||||||||||||||||||
| Basic |
$ | 0.26 | $ | 0.00 | $ | (0.28 | ) | $ | (0.46 | ) | $ | (0.05 | ) | $ | 0.99 | |||||||||
| Diluted |
$ | 0.26 | $ | 0.00 | $ | (0.28 | ) | $ | (0.46 | ) | $ | (0.05 | ) | $ | 0.95 | |||||||||
| Weighted average common shares outstanding: |
||||||||||||||||||||||||
| Basic |
32,631 | 31,527 | 31,346 | 30,869 | 25,047 | 25,204 | ||||||||||||||||||
| Diluted |
32,631 | 31,591 | 31,346 | 30,869 | 25,047 | 26,150 | ||||||||||||||||||
| Unaudited Pro Forma Data: |
||||||||||||||||||||||||
| Pro forma as adjusted net income (loss) per common share (1): |
||||||||||||||||||||||||
| Basic |
$ | 0.26 | $ | (0.12 | ) | |||||||||||||||||||
| Diluted |
$ | 0.26 | $ | (0.12 | ) | |||||||||||||||||||
| Pro forma as adjusted weighted average number of common shares outstanding (1): |
||||||||||||||||||||||||
| Basic |
39,631 | 38,346 | ||||||||||||||||||||||
| Diluted |
39,631 | 38,346 | ||||||||||||||||||||||
| Cash Flow Data: |
||||||||||||||||||||||||
| Net cash provided by operating activities |
$ | 19,982 | $ | 26,271 | $ | 84,117 | $ | 62,539 | $ | 12,807 | $ | 98,142 | ||||||||||||
| Net cash used in investing activities |
(5,653 | ) | (2,658 | ) | (6,432 | ) | (907,640 | ) | (827 | ) | (4,472 | ) | ||||||||||||
| Net cash (used in) provided by financing activities |
(15,678 | ) | (65,702 | ) | (116,489 | ) | 900,171 | (17,968 | ) | (95,851 | ) | |||||||||||||
14
Table of Contents
| SUCCESSOR | PREDECESSOR | |||||||||||||||||||||||
| (In thousands) | SIX MONTHS ENDED JUNE 30, 2016 |
SIX MONTHS ENDED JUNE 30, 2015 |
YEAR ENDED DECEMBER 31, 2015 |
NINE MONTH PERIOD FROM APRIL 1, 2014 THROUGH DECEMBER 31, 2014 |
THREE MONTH PERIOD FROM JANUARY 1, 2014 THROUGH MARCH 31, 2014 |
YEAR ENDED DECEMBER 31, 2013 |
||||||||||||||||||
| Other Financial Data: |
||||||||||||||||||||||||
| EBITDA (2) |
$ | 54,944 | $ | 50,631 | $ | 88,950 | $ | 63,178 | $ | 10,081 | $ | 87,664 | ||||||||||||
| Adjusted EBITDA (2) |
56,427 | 48,385 | 101,216 | 70,450 | 21,710 | 85,409 | ||||||||||||||||||
| Adjusted net income (2) |
26,271 | 21,147 | 40,445 | 26,685 | 9,715 | 41,407 | ||||||||||||||||||
| Free Cash Flow (2) |
13,545 | 23,030 | 76,360 | 57,030 | 11,552 | 93,581 | ||||||||||||||||||
| Backlog (at period end) (3) |
465,738 | 400,627 | 429,659 | 394,023 | 386,047 | 359,341 | ||||||||||||||||||
| Net new business awards (4) |
218,113 | 162,638 | 359,538 | 231,918 | 97,220 | 291,577 | ||||||||||||||||||
| (In thousands) | AS OF JUNE 30, 2016 |
AS ADJUSTED AS OF JUNE 30, 2016 (5) |
||||||
| Consolidated Balance Sheet Data: |
||||||||
| Cash and cash equivalents |
$ | 13,674 | $ | 13,674 | ||||
| Restricted cash |
3,366 | 3,366 | ||||||
| Accounts receivable and unbilled, net |
90,048 | 90,048 | ||||||
| Working capital |
(22,260 | ) | (24,121 | ) | ||||
| Total assets |
994,863 | 993,002 | ||||||
| Total long-term debt, net |
364,033 | 225,744 | ||||||
| Total liabilities |
572,227 | 433,938 | ||||||
| Total shareholders’ equity |
422,636 | 559,064 | ||||||
| Total liabilities and shareholders’ equity |
994,863 | 993,002 | ||||||
| (1) | We present certain information on a pro forma as adjusted basis to give pro forma effect to the sale by us of 7,000,000 shares of our common stock in this offering (assuming no exercise of the underwriters’ option to purchase additional shares) at an assumed initial public offering price of $21.50 per share (the midpoint of the price range listed on the cover page of this prospectus) after deducting estimated underwriting discounts and commissions and estimated expenses payable by us in connection with this offering and the application of the net proceeds to be received by us from this offering to repay $138.3 million in aggregate principal amount of outstanding borrowings under our Senior Secured Term Loan Facility as described in “Use of Proceeds.” |
Pro forma as adjusted net income (loss) reflects (i) the decrease in interest expense, net resulting from the repayment of $138.3 million in aggregate principal amount of outstanding borrowings under our Senior Secured Term Loan Facility with the net proceeds from this offering, as described in “Use of Proceeds,” and (ii) increases in income tax expense due to higher income before income taxes resulting from a decrease in interest expense, net as a result of the repayment of $138.3 million in aggregate principal amount of outstanding borrowings under our Senior Secured Term Loan Facility as described in (i) above as if each of these events had occurred on January 1, 2015. Pro forma as adjusted basic net income (loss) per common share consists of pro forma as adjusted net income (loss) divided by the pro forma as adjusted basic weighted average number of common shares outstanding. Pro forma as adjusted diluted net income (loss) per common share consists of pro forma as adjusted net income (loss) divided by the pro forma as adjusted diluted weighted average number of common shares outstanding.
15
Table of Contents
The table below provides a summary of net income (loss) used in the calculation of basic and diluted net income (loss) per common share on a pro forma as adjusted basis for the periods presented (in thousands):
| SIX MONTHS ENDED JUNE 30, 2016 |
YEAR ENDED DECEMBER 31, 2015 |
|||||||
| Net income (loss) |
$ | 8,410 | $ | (8,673 | ) | |||
| Reduction of interest expense |
3,321 | 6,660 | ||||||
| Tax effect of the above adjustments |
(1,295 | ) | (2,597 | ) | ||||
|
|
|
|
|
|||||
| Pro forma as adjusted net income (loss) |
$ | 10,436 | $ | (4,610 | ) | |||
|
|
|
|
|
|||||
Pro forma as adjusted weighted average number of common shares outstanding used in the calculation of pro forma as adjusted basic and diluted net income (loss) per common share gives effect to the sale by us of 7,000,000 shares of our common stock in this offering (assuming no exercise of the underwriters’ option to purchase additional shares) as if this event had occurred on January 1, 2015.
The table below provides a summary of the weighted average number of common shares outstanding used in the calculation of basic and diluted net income (loss) per common share on a pro forma as adjusted basis:
| SIX MONTHS ENDED JUNE 30, 2016 |
YEAR ENDED DECEMBER 31, 2015 |
|||||||
| Weighted average common shares outstanding—basic |
32,631 | 31,346 | ||||||
| Common shares sold in this offering |
7,000 | 7,000 | ||||||
|
|
|
|
|
|||||
| Pro forma as adjusted weighted average common share outstanding—basic |
39,631 | 38,346 | ||||||
| Incremental shares from the assumed exercise of outstanding stock options |
— | — | ||||||
|
|
|
|
|
|||||
| Pro forma as adjusted weighted average common shares outstanding—diluted |
39,631 | 38,346 | ||||||
|
|
|
|
|
|||||
| (2) | We prepare our financial statements in conformity with U.S. GAAP. To supplement this information, we also use the following non-GAAP financial measures in this prospectus: EBITDA, Adjusted EBITDA, Adjusted Net Income and Free Cash Flow. EBITDA, Adjusted EBITDA, Adjusted Net Income and Free Cash Flow are measures used by management to assess operating performance. EBITDA, Adjusted EBITDA, Adjusted Net Income and Free Cash Flow are not presented in accordance with U.S. GAAP, are not measures of financial condition or profitability and should not be considered as an alternative to net income (loss) determined in accordance with U.S. GAAP or net cash provided by operating activities determined in accordance with U.S. GAAP, as applicable, or any other performance measure derived in accordance with U.S. GAAP and should not be construed as an inference that our future results will be unaffected by unusual non-recurring items. Management uses EBITDA, Adjusted EBITDA, Adjusted Net Income and Free Cash Flow or comparable metrics: |
| n | as a measurement used in evaluating our operating performance on a consistent basis; |
| n | as a consideration to assess incentive compensation for our employees; |
| n | for planning purposes, including the preparation of our internal annual operating budget; and |
| n | to evaluate the performance and effectiveness of our operational strategies. |
We believe that the inclusion of EBITDA and Adjusted EBITDA in this prospectus is useful to provide additional information to investors about certain material non-cash and non-recurring items. While we believe these financial measures are commonly used by investors to evaluate our performance and that of our competitors, because not all companies use identical calculations, this presentation of EBITDA and Adjusted EBITDA may not be comparable to other similarly titled measures of other companies and should not be considered as an alternative to performance measures derived in accordance with U.S. GAAP. EBITDA is calculated as net income (loss) attributable to Medpace Holdings, Inc. before income tax expense, interest expense, net, depreciation and amortization with Adjusted EBITDA being further adjusted for unusual and other items reflected in the reconciliation table below. Our presentation of Adjusted EBITDA should not be construed as an inference that our future results will be unaffected by usual or non-recurring items.
16
Table of Contents
EBITDA and Adjusted EBITDA have important limitations as analytical tools and you should not consider them in isolation, or as a substitute for, analysis of our results as reported under U.S. GAAP. Some of these limitations are:
| n | they do not reflect our interest expense, or the cash requirements necessary to service interest or principal payments, on our debt; |
| n | they do not reflect our cash expenditures, or future requirements for capital expenditures or contractual commitments; |
| n | they do not reflect changes in, or cash requirements for, our working capital needs; |
| n | although depreciation and amortization are non-cash charges, the assets being depreciated and amortized will often have to be replaced in the future, and EBITDA and Adjusted EBITDA do not reflect the cash requirements for such replacements; |
| n | they do not reflect our income tax expense or the cash requirements to pay our taxes; |
| n | Adjusted EBITDA does not reflect the non-cash component of certain stock based awards related to fair value adjustments and unusual non-recurring stock awards; |
| n | Adjusted EBITDA does not reflect the impact of earnings or charges resulting from matters we consider not to be indicative of our ongoing operations, as discussed in our presentation of Adjusted EBITDA and “Management’s Discussion and Analysis of Financial Condition and Results of Operations” in this prospectus; and |
| n | other companies in our industry may calculate Adjusted EBITDA differently than we do, limiting its usefulness as comparative measures. |
Because of these limitations, EBITDA and Adjusted EBITDA should not be considered as a measure of discretionary cash available to us to invest in the growth of our business. We compensate for these limitations by relying primarily on our U.S. GAAP results and using EBITDA and Adjusted EBITDA only supplementally.
We utilize Free Cash Flow as a measure of profitability and an assessment of our ability to generate cash. Free Cash Flow is a commonly utilized metric that companies provide to investors, although the calculation of Free Cash Flow may not be comparable to other similarly titled metrics of other companies and should not be considered as an alternative to cash flow measures derived in accordance with U.S. GAAP. We define Free Cash Flow as net cash provided by operating activities, less capital expenditures and the principal portion of payments related to campus leases classified for accounting purposes as deemed landlord liabilities.
Adjusted Net Income measures our operating performance by adjusting net income (loss) attributable to Medpace Holdings, Inc. to include cash expenditures related to rental payments on leases classified for accounting purposes as deemed landlord liabilities, and exclude amortization expense, certain stock based compensation award non-cash expenses, certain litigation expenses, deferred financing fees and certain other non-recurring items. Management uses this measure to evaluate our core operating results as it excludes certain items whose fluctuations from period-to-period do not necessarily correspond to changes in the core operations of the business, but includes certain items such as depreciation, interest expense and tax expense, which are otherwise excluded from Adjusted EBITDA. We believe the presentation of Adjusted Net Income enhances our investors’ overall understanding of the financial performance and cash flow of our business. You should not consider Adjusted Net Income as an alternative to net income (loss) attributable to Medpace Holdings, Inc., determined in accordance with U.S. GAAP, as an indicator of operating performance.
17
Table of Contents
See the consolidated financial statements included elsewhere in this prospectus for our U.S. GAAP results. Set forth below are the reconciliations of EBITDA, Adjusted EBITDA, Adjusted Net Income and Free Cash Flow to our closest reported U.S. GAAP measures.
| SUCCESSOR | PREDECESSOR | |||||||||||||||||||||||
| (In thousands) | SIX MONTHS ENDED JUNE 30, 2016 |
SIX MONTHS ENDED JUNE 30, 2015 |
YEAR ENDED DECEMBER 31, 2015 |
NINE MONTH PERIOD FROM APRIL 1, 2014 THROUGH DECEMBER 31, 2014 |
THREE MONTH PERIOD FROM JANUARY 1, 2014 THROUGH MARCH 31, 2014 |
YEAR ENDED DECEMBER 31, 2013 |
||||||||||||||||||
| EBITDA and Adjusted EBITDA: |
||||||||||||||||||||||||
| Net income (loss) as reported |
$ | 8,410 | $ | 36 | $ | (8,673 | ) | $ | (14,336 | ) | $ | (1,236 | ) | $ | 24,844 | |||||||||
| Interest expense, net |
11,894 | 13,975 | 27,259 | 23,185 | 3,272 | 18,000 | ||||||||||||||||||
| Income tax provision (benefit) |
5,738 | (733 | ) | 843 | (6,703 | ) | 1,014 | 14,301 | ||||||||||||||||
| Depreciation |
3,566 | 3,110 | 6,379 | 4,610 | 1,832 | 6,665 | ||||||||||||||||||
| Amortization |
25,336 | 34,243 | 63,142 | 56,422 | 5,199 | 23,854 | ||||||||||||||||||
|
|
|
|
|
|
|
|
|
|
|
|
|
|||||||||||||
| EBITDA |
54,944 | 50,631 | 88,950 | 63,178 | 10,081 | 87,664 | ||||||||||||||||||
|
|
|
|
|
|
|
|
|
|
|
|
|
|||||||||||||
| Stock compensation expense: liability awards mark-to-market and CEO award (a) |
2,576 | (12 | ) | 9,780 | — | — | — | |||||||||||||||||
| Private equity transaction related cost (b) |
— | — | — | 9,297 | 12,420 | — | ||||||||||||||||||
| Corporate campus lease payments (c) |
(1,860 | ) | (1,860 | ) | (3,720 | ) | (2,773 | ) | (918 | ) | (3,635 | ) | ||||||||||||
| Litigation matters (d) |
— | (374 | ) | (3,107 | ) | 748 | 127 | 1,380 | ||||||||||||||||
| Impairment of goodwill |
— | — | 9,313 | — | — | — | ||||||||||||||||||
| Other transaction expenses (f) |
767 | — | — | — | — | — | ||||||||||||||||||
|
|
|
|
|
|
|
|
|
|
|
|
|
|||||||||||||
| Adjusted EBITDA |
$ | 56,427 | $ | 48,385 | $ | 101,216 | $ | 70,450 | $ | 21,710 | $ | 85,409 | ||||||||||||
|
|
|
|
|
|
|
|
|
|
|
|
|
|||||||||||||
| Adjusted Net Income: |
||||||||||||||||||||||||
| Net income (loss) as reported |
$ | 8,410 | $ | 36 | $ | (8,673 | ) | $ | (14,336 | ) | $ | (1,236 | ) | $ | 24,844 | |||||||||
| Amortization |
25,336 | 34,243 | 63,142 | 56,422 | 5,199 | 23,854 | ||||||||||||||||||
| Stock compensation expense: liability awards mark-to-market and CEO award (a) |
2,576 | (12 | ) | 9,780 | — | — | — | |||||||||||||||||
| Private equity transaction related cost (b) |
— | — | — | 9,297 | 12,420 | — | ||||||||||||||||||
| Corporate campus lease payments—principal portion (c) |
(744 | ) | (576 | ) | (1,292 | ) | (1,284 | ) | (165 | ) | — | |||||||||||||
| Litigation matters (d) |
— | (374 | ) | (3,107 | ) | 748 | 127 | 1,380 | ||||||||||||||||
| Impairment of goodwill |
— | — | 9,313 | — | — | — | ||||||||||||||||||
| Deferred financing fees (e) |
1,345 | 1,328 | 2,687 | 2,064 | 371 | 1,918 | ||||||||||||||||||
| Other transaction expenses (f) |
767 | — | — | — | — | — | ||||||||||||||||||
| Income tax effect of adjustments (39.0%) |
(11,419 | ) | (13,498 | ) | (31,405 | ) | (26,226 | ) | (7,001 | ) | (10,589 | ) | ||||||||||||
|
|
|
|
|
|
|
|
|
|
|
|
|
|||||||||||||
| Adjusted Net Income |
$ | 26,271 | $ | 21,147 | $ | 40,445 | $ | 26,685 | $ | 9,715 | $ | 41,407 | ||||||||||||
|
|
|
|
|
|
|
|
|
|
|
|
|
|||||||||||||
| Free Cash Flow: |
||||||||||||||||||||||||
| Cash flow provided by operating activities |
$ | 19,982 | $ | 26,271 | $ | 84,117 | $ | 62,539 | $ | 12,807 | $ | 98,142 | ||||||||||||
| Less: Capital expenditures |
(5,693 | ) | (2,665 | ) | (6,465 | ) | (4,225 | ) | (1,090 | ) | (4,561 | ) | ||||||||||||
| Less: Corporate campus lease payments—principal portion (c) |
(744 | ) | (576 | ) | (1,292 | ) | (1,284 | ) | (165 | ) | — | |||||||||||||
|
|
|
|
|
|
|
|
|
|
|
|
|
|||||||||||||
| Free Cash Flow |
$ | 13,545 | $ | 23,030 | $ | 76,360 | $ | 57,030 | $ | 11,552 | $ | 93,581 | ||||||||||||
|
|
|
|
|
|
|
|
|
|
|
|
|
|||||||||||||
| (a) | Consists of period end mark-to-market fair value adjustments associated with liability classified awards and the impact of a one-time stock based compensation award to our Chief Executive Officer and founder. Future stock based awards activity is expected to be classified as equity for accounting purposes and will not be subject to period ending fair value adjustments. |
| (b) | Represents attorney fees, advisory fees and other professional service fees incurred in connection with the Transaction. |
18
Table of Contents
| (c) | Represents cash rental payments on two corporate headquarter buildings that are accounted for as deemed assets and subject to depreciation expense over the life of the lease. Payments made for these leases are accounted for with a principal portion and an interest portion, consistent with deemed landlord liability accounting. For purposes of Free Cash Flow, the interest portion of these payments is included in net cash provided by operating activities in our statement of cash flows. The principal portion is reflected as a financing activity in our statement of cash flows. These adjustments for purposes of arriving at Adjusted EBITDA, Adjusted Net Income and Free Cash Flow have the effect of presenting these leases consistently with all other office lease rentals that we have globally. |
| (d) | Represents non-recurring costs and recovery related to a customer bad debt and non-recurring expenses related to the settlement of an employment related matter. |
| (e) | Represents amortization of the discount and issuance costs deferred on the consolidated balance sheet associated with the issuance of the Senior Secured Credit Facility. |
| (f) | Represents advisory costs and other fees related to this offering. |
| (3) | Backlog represents anticipated future net service revenue from net new business awards that have not commenced or are currently in process but not complete. However, because the contracts included in our backlog are generally terminable without cause, we do not believe that our backlog as of any date is necessarily a meaningful predictor of future results. |
| (4) | Net new business awards are new business awards net of award modifications and cancellations that had previously been recognized in backlog during the period. New business awards represent the value of anticipated future net service revenue that has been awarded during the period that is recognized in backlog. This value is recognized upon the signing of a contract or receipt of a written pre-contract confirmation from a customer that confirms an agreement in principle on budget and scope. New business awards also include contract amendments, or changes in scope, where the customer has provided written authorization for changes in budget and scope or has approved us to perform additional work as of the measurement date. Awards may not be recognized as backlog after consideration of a number of factors, including whether (i) the relevant net service revenue is expected only after a pending regulatory hurdle, which might result in cancellation of the study, (ii) the customer funding needed for commencement of the study is not believed to have been secured or (iii) study timelines are uncertain or not well defined. In addition, study amounts that extend beyond a three-year timeline are not included in backlog. The number and amount of new business awards can vary significantly from period to period, and an award’s contractual duration can range from several months to several years based on customer and project specifications. |
| (5) | On an as adjusted basis to give effect to our issuance and sale of 7,000,000 shares of our common stock in this offering at the initial public offering price of $21.50 per share (the midpoint of the price range listed on the cover page of this prospectus), after deducting estimated underwriting discounts and commissions and estimated expenses payable by us in connection with this offering and the application of the net proceeds to be received by us from this offering as described under “Use of Proceeds.” |
19
Table of Contents
Investing in our common stock involves a high degree of risk. You should consider carefully the risks and uncertainties described below together with the other information included in this prospectus, including our consolidated financial statements and related notes included elsewhere in this prospectus, before deciding to purchase our common stock. The occurrence of any of the following risks may materially and adversely affect our business, financial condition, results of operations and future prospects. In such an event, the market price of our common stock could decline, and you could lose part or all of your investment.
Risks Relating to Our Business
The potential loss, delay or non-renewal of our contracts, or the non-payment by our customers for services that we have performed, could adversely affect our results.
We experience termination, cancellation and non-renewals of contracts by our customers in the ordinary course of business, and the number and dollar value of cancellations can vary significantly from year to year.
The time between when a clinical trial is awarded and when it goes to contract is typically several months, and prior to a new business award going to contract, our customers can cancel the award without notice. Moreover, once an award goes to contract, most of our customers for clinical trial services can terminate our contracts without cause upon 30 days’ notice. For example, our average quarterly cancellation rates as a percentage of the beginning of the period backlog were 4.2% and 2.7% for the Successor six months ended June 30, 2016 and June 30, 2015, respectively, and 3.2% for the Successor year ended December 31, 2015, 3.3% for the Successor nine month period ended December 2014, 2.5% for the Predecessor three month period ended March 2014 and 3.7% for the Predecessor year ended December 2013. Our customers may delay, terminate or reduce the scope of our contracts for a variety of reasons beyond our control, including, but not limited to:
| n | decisions to forego or terminate a particular clinical trial; |
| n | lack of available financing, budgetary limits or changing priorities; |
| n | actions by regulatory authorities; |
| n | changes in law; |
| n | production problems resulting in shortages of the drug being tested; |
| n | failure of the drug being tested to satisfy safety requirements or efficacy criteria; |
| n | unexpected or undesired clinical results; |
| n | insufficient investigator recruitment or patient enrollment in a trial; |
| n | decisions to downsize product development portfolios; |
| n | dissatisfaction with our performance, including the quality of data provided and our ability to meet agreed upon schedules; |
| n | shift of business to another CRO or internal resources; |
| n | product withdrawal following market launch; or |
| n | shut down of our customers’ manufacturing facilities. |
As a result, contract terminations, delays and modifications are a regular part of our business. In the event of termination, our contracts often provide for payment to us of fees for services provided up to the point of termination and for close-out activities for winding down the clinical trial, and reimbursement of all non-cancellable expenses. These payments may not be sufficient for us to maintain our profit margins, and termination or non-renewal may result in lower resource utilization rates, including with respect to personnel who we are not able to place on another customer engagement. Historically, cancellations and delays have negatively impacted our operating results.
Clinical trials can be costly and for the Successor year ended December 31, 2015, 55.7% and 29.3% of our net service revenue was derived from small biopharmaceutical companies and mid-sized biopharmaceutical companies, respectively, which may have limited access to capital. In addition, we provide services to our customers before they pay us for some of our services. There is a risk that we may initiate a clinical trial for a customer, and the customer subsequently becomes unwilling or unable to fund the completion of the trial. In such a situation, notwithstanding
20
Table of Contents
the customer’s ability or willingness to pay for or otherwise facilitate the completion of the trial, we may be legally or ethically bound to complete or wind down the trial at our own expense.
Because the contracts included in our backlog are generally terminable without cause, we do not believe that our backlog as of any date is necessarily a meaningful predictor of future results. In addition, we may not realize the full benefits of our backlog of contractually committed services if our customers cancel, delay or reduce their commitments under our contracts with them. Thus, the loss or delay of a large contract or the loss or delay of multiple contracts could adversely affect our net service revenue and profitability. In addition, the terminability of our contracts puts increased pressure on our quality control efforts, since not only can our contracts be terminated by customers as a result of poor performance, but any such termination may also affect our ability to obtain future contracts from the customer involved and others.
Our backlog may not convert to net service revenue at our historical conversion rates.
Backlog represents anticipated future net service revenue from net new business awards that have not commenced or are currently in process but not complete. Reported backlog will fluctuate based on new business awards, changes in scope to existing contracts, cancellations, revenue recognition on existing contracts and foreign exchange adjustments from non-U.S. dollar denominated backlog. Our backlog as of June 30, 2016 and June 30, 2015 was approximately $465.7 and $400.6 million, respectively. Included within backlog as of June 30, 2016 is approximately $170.1 million to $175.1 million that we expect to convert to net service revenue in 2016, with the remainder expected to convert to net service revenue in years after 2016. Once work begins on a project, net service revenue is recognized over the duration of the project. Projects may be terminated or delayed by the customer or delayed by regulatory authorities for reasons beyond our control. To the extent projects are delayed, the timing of our net service revenue could be adversely affected. Moreover, in the event that a customer cancels a contract, we often would be entitled to receive payment for services provided up to the point of cancellation and for close-out activities for winding down the clinical trial, and reimbursement of all non-cancellable expenses. Typically, however, we have no contractual right to the full amount of the future net service revenue reflected in our backlog in the event of a contract cancellation or subsequent changes in scope that reduce the value of the contract. The duration of the projects included in our backlog, and the related net service revenue recognition, generally range from a few months to several years. Our backlog may not be indicative of our future net service revenue, and we may not realize all of the anticipated future net service revenue reflected in our backlog. A number of factors may affect the realization of our net service revenue from backlog, including:
| n | the size, complexity and duration of the projects; |
| n | the cancellation or delay of projects; and |
| n | changes in the scope of work during the course of a project. |
Fluctuations in our reported backlog levels also result from the fact that we may receive a small number of relatively large projects in any given reporting period that may be included in our backlog. Because of these large projects, our backlog in that reporting period may reach levels that may not be sustained in subsequent reporting periods. Additionally, although an increase in backlog will generally result in an increase in net service revenue over time, an increase in backlog at a particular point in time does not necessarily correspond directly to an increase in net service revenue during any particular period, or at all. The extent to which contracts in backlog will result in net service revenue depends on many factors, including, but not limited to, delivery against project schedules, scope changes, contract terminations and the nature, duration and complexity of the contracts, and can vary significantly over time.
As we increasingly compete for and enter into large contracts that are more global in nature, there can be no assurance about the rate at which our backlog will convert into net service revenue. A decrease in this conversion rate would mean that the rate of net service revenue recognized on contracts may be slower than what we have experienced in the past, which could impact our net service revenue and results of operations on a quarterly and annual basis. The revenue recognition on larger, more global projects could be slower than on smaller, less global projects for a variety of reasons, including, but not limited to, an extended period of negotiation between the time the project is awarded to us and the actual execution of the contract, as well as an increased timeframe for obtaining the necessary regulatory approvals. Additionally, delayed projects will remain in backlog and will not generate revenue at the rate originally expected. Thus, the relationship of backlog to realized revenues is indirect and may vary significantly over time.
21
Table of Contents
Additionally, there has been a recent slowdown in funding in the biotechnology industry. If small and mid-sized biopharmaceutical companies become less able to access capital in the future, we may see a decrease in backlog conversion to net service revenue and net new business awards due to project delays or cancellations. These companies have contributed materially to our historical net service revenue. If they cannot commit the same or a greater level of capital to our services going forward, our results of operations may suffer.
Our operating results have historically fluctuated between fiscal quarters and years and may continue to fluctuate in the future, which may adversely affect the market price of our stock after this offering.
Our operating results have fluctuated in previous quarters and years and may continue to vary significantly from quarter to quarter and year to year and are influenced by a variety of factors, such as:
| n | timing of contract amendments for changes in scope that could affect the value of a contract and potentially impact the amount of net new business awards and net service revenue from quarter to quarter; |
| n | commencement, completion, execution, postponement or termination of large contracts; |
| n | contract terms for the billing and recognition of revenue milestones; |
| n | progress of ongoing contracts and retention of customers; |
| n | timing of and charges associated with completion of acquisitions and other events; |
| n | changes in the mix of services delivered, both in terms of geography and type of services; |
| n | customer disputes or other issues that may impact the revenue we are able to recognize or the collectability of our related accounts receivable; and |
| n | exchange rate fluctuations. |
Our operating results for any particular quarter or year are not necessarily a meaningful indicator of future results and fluctuations in our quarterly or yearly operating results could negatively affect the market price and liquidity of shares of our common stock.
Our operating margins could decrease due to increased pricing pressure or other pressures.
Historically, we have been able to generate the operating margins that we do because of our disciplined, full-service operating model. However, we operate in a highly competitive environment, and, if we experience increased levels of competitive pricing pressure, our operating margins may decrease. In addition, we may adapt our operating model to achieve greater levels of growth or in response to investor demands. Such a change could result in lower operating margins.
If we fail to perform our services in accordance with contractual requirements, government regulations and ethical considerations, we could be subject to significant costs or liability and our reputation could be adversely affected.
We contract with biopharmaceutical companies to perform a wide range of services to assist them in bringing new drugs to market. Our services include monitoring clinical trials, data and laboratory analysis, electronic data capture, patient recruitment and other related services. Such services are complex and subject to contractual requirements, government regulations, and ethical considerations. For example, we are subject to regulation by the FDA and comparable foreign regulatory authorities relating to our activities in conducting pre-clinical studies and clinical trials. Before clinical trials begin in the United States, a drug is tested in pre-clinical trials that must comply with Good Laboratory Practice and other requirements. An applicant must file an Investigational New Drug Application, or IND, which must become effective before human clinical testing may begin. Further, an independent Institutional Review Board, or IRB, for each medical center proposing to participate in the clinical trial must review and approve the protocol for the clinical trial. Once initiated, clinical trials must be conducted pursuant to and in accordance with the applicable IND conditions, the requirements of the relevant IRBs, the Federal Food, Drug, and Cosmetic Act and its implementing regulations, including Good Clinical Practice, or GCP, and other requirements. We are also subject to regulation by the Drug Enforcement Administration, or DEA, which regulates the distribution, recordkeeping, handling, security, and disposal of controlled substances. If we fail to perform our services in accordance with these requirements, regulatory authorities may take action against us or our customers. Such actions may include injunctions or failure of such regulatory authority to grant marketing approval of our customers’ products, imposition of clinical holds or delays, suspension or withdrawal of approvals, rejection of data collected in our clinical trials, license revocation, product seizures or recalls, operational restrictions, civil or criminal penalties or prosecutions, damages or fines. Customers may also bring claims against us for breach of our contractual
22
Table of Contents
obligations, and patients in the clinical trials and patients taking drugs approved on the basis of those trials may bring personal injury claims against us. Any such action could have a material adverse effect on our business, financial condition, results of operations, cash flows or reputation.
Such consequences could arise if, among other things, the following occur:
Improper performance of our services. The performance of clinical development services is complex and time-consuming. For example, we may make mistakes in conducting a clinical trial that could negatively impact or obviate the usefulness of results of the trial or cause the results of the trial to be reported improperly. If the trial results are compromised, we could be subject to significant costs or liability, which could have an adverse impact on our ability to perform our services and our reputation would be harmed. As examples:
| n | non-compliance generally could result in the termination of ongoing clinical trials or the disqualification of data for submission to regulatory authorities; |
| n | non-compliance could compromise data from a particular trial, such as failure to verify that adequate informed consent was obtained from patients, which could require us to repeat the trial under the terms of our contract at no further cost to our customer, but at a potentially substantial cost to us; and |
| n | breach of a contractual term could result in liability for damages or termination of the contract. |
The services we provide in connection with large clinical trials can cost tens of millions of dollars, and while we endeavor to contractually limit our exposure to such risks, improper performance of our services could have a material adverse effect on our financial condition, damage our reputation and result in the cancellation of current contracts by the affected customer or other current customers or failure to obtain future contracts from the affected customer or other current or potential customers.
Investigation of customers. From time to time, one or more of our customers are investigated by regulatory authorities or enforcement agencies with respect to regulatory compliance of their clinical trials, programs or the marketing and sale of their drugs. In these situations, we have often provided services to our customers with respect to the clinical trials, programs or activities being investigated, and we are called upon to respond to requests for information by the authorities and agencies. There is a risk that either our customers or regulatory authorities could claim that we performed our services improperly or that we are responsible for clinical trial or program compliance. If our customers or regulatory authorities make such claims against us, we could be subject to significant costs in defending our activities and potential damages, fines or penalties. In addition, negative publicity regarding regulatory compliance of our customers’ clinical trials, programs or products could have an adverse effect on our business and reputation.
Insufficient customer funding to complete a clinical trial. As noted above, clinical trials can cost tens of millions of dollars. There is a risk that we may initiate a clinical trial for a customer, and then the customer becomes unwilling or unable to fund the completion of the trial. In such a situation, notwithstanding the customer’s ability or willingness to pay for or otherwise facilitate the completion of the trial, we may be ethically bound to complete or wind down the trial at our own expense.
Interactive voice/web response service malfunction. We develop and maintain our own, and also use third-parties to run, interactive voice/web response systems. These systems automatically manage the randomization of patients in a given clinical trial to different treatment arms and regulate the supply of investigational drugs. An error in the design, programming or validation of these systems could lead to inappropriate assignment or dosing of patients which could give rise to patient safety issues, invalidation of the trial or liability claims against us. Furthermore, negative publicity associated with such a malfunction could have an adverse effect on our business and reputation. Additionally, errors in randomization may require us to repeat the trial at no further cost to our customer, but at a substantial cost to us.
In addition to the above U.S. laws and regulations, we must comply with the laws of all countries where we do business, including laws governing clinical trials in the jurisdiction where the trials are performed. Failure to comply with applicable requirements could subject us to regulatory risk, liability and potential costs associated with redoing the trials, which could damage our reputation and adversely affect our operating results.
23
Table of Contents
We bear financial risk if we underprice our fixed-fee contracts or overrun cost estimates, and our financial results can also be adversely affected by failure to receive approval for change orders or delays in documenting change orders.
The majority of our Phase I–IV contracts are fixed-fee contracts. We bear the financial risk if we initially underprice our contracts or otherwise overrun our cost estimates. In addition, contracts with our customers are subject to change orders, which we commonly experience and which occur when the scope of work we perform needs to be modified from that originally contemplated by our contract with the customer. Modifications can occur, for example, when there is a change in a key trial assumption or parameter, a significant change in timing or a change in staffing needs. Furthermore, we may be unable to successfully negotiate changes in scope or change orders on a timely basis or at all, which could require us to incur cost outlays ahead of the receipt of any additional revenue. In addition, under U.S. GAAP, we cannot recognize additional revenue anticipated from change orders until appropriate documentation is received by us from the customer authorizing the change. However, if we incur additional expense in anticipation of receipt of that documentation, we must recognize the expense as incurred. Such underpricing, significant cost overruns or delay in documentation of change orders could have a material adverse effect on our business, results of operations, financial condition or cash flows.
If we are unable to successfully execute our growth strategies, our results of operations or financial condition could be adversely affected.
Our key growth strategies include: continued organic growth, continued maintenance of industry-leading margins (compared to our public competitors), increasing capture of the high-growth clinical development market, deepening existing and developing new relationships with our core customer segment, pursuing selective and complementary bolt-on acquisitions and increasing our capture of the large pharmaceutical company market. Though we will strive to meet these goals, we may not have or adequately build the competencies necessary to achieve our objectives. In addition, we may not receive market acceptance for our services and we may face increased competition. If we are unable to successfully continue our organic growth, continue to maintain our margins, increase our capture of the clinical development market, deepen existing and develop new relationships with our core customer segment, pursue complementary and non-transformative acquisitions or attract additional large pharmaceutical company customers, our future business, reputation, results of operations and financial condition could be adversely affected. For more information on our growth strategies, see “Business—Our Growth Strategy.”
If we lose the services of key personnel or are unable to recruit experienced personnel, our business could be adversely affected.
Our success substantially depends on the collective performance, contributions and expertise of our senior management team, including Dr. August J. Troendle, our Chief Executive Officer and founder, and other key personnel including qualified management, professional, scientific and technical operating staff. There is significant competition for qualified personnel in the biopharmaceutical services industry, particularly for those with higher educational degrees, such as a medical or nursing degree, a Doctor of Philosophy, or Ph.D., or an equivalent degree, and our industry generally tends to experience relatively high levels of employee turnover. If any of our key employees were to join a competitor or to form a competing company, some of our customers might choose to use the services of that competitor or new company instead of our own. Furthermore, customers or other companies seeking to develop in-house capabilities may hire some of our senior management or other key employees. The departure of any key contributor, the payment of increased compensation to attract and retain qualified personnel or our inability to continue to identify, attract and retain qualified personnel or replace any departed personnel in a timely fashion may impact our ability to grow our business and compete effectively in our industry and may negatively affect our business, financial condition, results of operations, cash flows or reputation.
24
Table of Contents
Our business depends on the continued effectiveness and availability of our information systems, including the information systems we use to provide our services to our customers, such as ClinTrak, and failures of these systems may materially limit our operations.
Due to the global nature of our business and our reliance on information systems to provide our services, we intend to increase our use of web-enabled and other integrated information systems in delivering our services. We already provide access to such an information system, ClinTrak, to certain of our customers in connection with the services we provide to them. As the breadth and complexity of our information systems continue to grow, we will increasingly be exposed to the risks inherent in the development, integration and ongoing operation of evolving information systems, including:
| n | disruption, impairment or failure of data centers, telecommunications facilities or other key infrastructure platforms; |
| n | security breaches of, cyberattacks on and other failures or malfunctions in our critical application systems or their associated hardware; and |
| n | excessive costs, excessive delays or other deficiencies in systems development and deployment. |
The materialization of any of these risks may impede the processing of data, the delivery of databases and services and the day-to-day management of our business and could result in the corruption, loss or unauthorized disclosure of proprietary, confidential or other data. While we have disaster recovery plans in place, they might not adequately protect us in the event of a system failure. Despite any precautions we take, damage from fire, floods, hurricanes, power loss, telecommunications failures, computer viruses, information system security breaches and similar events at our facilities or at those of our third party provider that backs up our data centers could result in interruptions in the flow of data to our servers and from our servers to our customers. Corruption or loss of data may result in the need to repeat a trial at no cost to the customer, but at significant cost to us, or result in the termination of a contract or damage to our reputation. Moreover, regulatory authorities may impose requirements on the use of electronic records and signatures for regulatory purposes. For example, FDA’s regulations at 21 CFR Part 11 establish the criteria pursuant to which the FDA will consider electronic records and signatures to be trustworthy, reliable, and generally equivalent to paper records and handwritten signatures. Any failures to comply with those regulatory requirements could impact our customers’ ability to rely on the data contained in those electronic records in our systems or result in the FDA’s rejection of the data. Additionally, in order for our information systems to continue to be effective going forward, we periodically need to upgrade our technology systems and increase our capacity to keep pace with technological developments and our growth as a company. Significant delays in system enhancements or inadequate performance of new or upgraded systems once completed could damage our reputation and harm our business. Our operations also may suffer if we are unable to effectively manage the implementation of and adapt to new technology systems. Any such shortcoming may require us to make substantial further investments in our IT platform, which could adversely affect our financial results. Finally, long-term disruptions in the infrastructure caused by events such as natural disasters, the outbreak of war, the escalation of hostilities and acts of terrorism, particularly involving cities in which we have offices, could adversely affect our business. As our business continues to expand globally, these types of risks may be further increased by instability in the geopolitical climate of certain regions, underdeveloped and less stable utilities and communications infrastructure and other local and regional factors. Although we carry property and business interruption insurance, our coverage might not be adequate to compensate us for all losses that may occur.
Unauthorized disclosure of sensitive or confidential data, whether through system failure or breaches or employee negligence, fraud or misappropriation, could damage our reputation and cause us to lose customers. Similarly, unauthorized access to or through our information systems or those we develop for our customers, whether by our employees or third parties, including a cyberattack by computer programmers and hackers who may develop and deploy viruses, worms or other malicious software programs, could result in negative publicity, significant remediation costs, legal liability and damage to our reputation and could have a material adverse effect on our results of operations. In addition, our liability insurance might not be sufficient in type or amount to adequately cover us against claims related to security breaches, cyberattacks and other related breaches.
25
Table of Contents
Our business could be harmed if we are unable to manage our growth effectively.
We believe that sustained growth places a strain on operational, human and financial resources. To manage our growth, we must continue to improve our operating and administrative systems and to attract and retain qualified management, professional, scientific and technical operating personnel. We believe that maintaining and enhancing both our systems and personnel at reasonable cost are instrumental to our success. We cannot assure you that we will be able to enhance our current technology or obtain new technology that will enable our systems to keep pace with developments and the needs of our customers. The nature and pace of our growth introduces risks associated with quality control and customer dissatisfaction due to delays in performance or other problems. In addition, foreign operations involve the additional risks of assimilating differences in foreign business practices, hiring and retaining qualified personnel and overcoming language barriers. Failure to manage growth effectively could have a material adverse effect on our business.
Our customer or therapeutic area concentration may have a material adverse effect on our business, financial condition, results of operations or cash flows.
Although we did not have any customer that represented 10% or more of our net service revenue during the Successor six months ended June 30, 2016 or the Successor year ended December 31, 2015, we derive a significant portion of our revenues from a limited number of large customers. For the Successor six months ended June 30, 2016, we derived 38.2% and 6.3% of our net service revenue from our top 10 customers and our largest customer, respectively. For the Successor year ended December 31, 2015, we derived 39.9% and 6.9% of our net service revenue from our top 10 customers and our largest customer, respectively. For more information about our largest customer, see “Certain Relationships and Related Person Transactions—Service Agreements.” In addition, approximately 44.6% and 7.8% of our backlog, as of June 30, 2016, was concentrated among our top 10 customers and our largest customer by backlog concentration, respectively. Moreover, 4.0% of our backlog, as of June 30, 2016, was concentrated with our largest customer by net service revenue. If any large customer decreases or terminates its relationship with us, our business, financial condition, results of operations or cash flows could be materially adversely affected. Also, consolidation in our actual or potential customer base results in increased competition for important market segments and fewer available customer accounts.
Additionally, conducting multiple clinical trials for different sponsors in a single therapeutic class, involving similar drugs, biologics or medical devices, may adversely affect our business if some or all of the trials are terminated because of new scientific information or regulatory decisions that affect the products as a class. Moreover, even if these trials are not terminated, they may compete with each other, thereby limiting our potential revenue going forward.
Our business is subject to international economic, political and other risks that could negatively affect our results of operations and financial condition.
We have significant operations in foreign countries, including, but not limited to, countries in Europe, Latin America, Asia, the Middle East and Africa, that may require complex arrangements to deliver services on global contracts for our customers. As of June 30, 2016 and December 31, 2015, approximately 34% of our workforce was located outside of North America, and for the Successor six months ended June 30, 2016 and the Successor year ended December 31, 2015, 9.2% and 8.4% of our revenue was denominated in currencies other than the U.S. dollar, respectively. As a result, we are subject to heightened risks inherent in conducting business internationally, including the following:
| n | conducting a single trial across multiple countries is complex, and issues in one country, such as a failure to comply with local regulations or restrictions, may affect the progress of the trial in the other countries, for example, by limiting the amount of data necessary for a trial to proceed, resulting in delays or potential cancellation of contracts, which in turn may result in loss of revenue; |
| n | the United States or other countries could enact legislation or impose regulations or other restrictions, including unfavorable labor regulations or tax policies, which could have an adverse effect on our ability to conduct business in or expatriate profits from those countries; |
| n | tax rates in certain foreign countries may exceed those in the United States and foreign earnings may be subject to withholding requirements or the imposition of tariffs, exchange controls or other restrictions, including restrictions on repatriation; |
26
Table of Contents
| n | certain foreign countries are expanding or may expand their regulatory framework with respect to patient informed consent, protection and compensation in clinical trials, and privacy, which could delay or inhibit our ability to conduct trials in such jurisdictions or which could materially increase the risks associated with performing trials in such jurisdictions; |
| n | certain foreign countries are expanding or may expand their banking regulations that govern international currency transactions, particularly cross-border transfers, which may inhibit our ability to transfer funds into or within a jurisdiction, impeding our ability to pay our principal investigators, vendors and employees, thereby impacting our ability to conduct trials in such jurisdictions; |
| n | the regulatory or judicial authorities of foreign countries may not enforce legal rights and recognize business procedures in a manner to which we are accustomed or would reasonably expect; |
| n | we may have difficulty complying with a variety of laws and regulations in foreign countries, some of which may conflict with laws in the United States; |
| n | potential violations of existing or newly adopted local laws or anti-bribery laws, such as the United States Foreign Corrupt Practices Act, or FCPA, and the UK Bribery Act of 2010, may cause a material adverse effect on our business, financial condition, results of operations, cash flows or reputation; |
| n | changes in political and economic conditions, including inflation, may lead to changes in the business environment in which we operate, as well as changes in foreign currency exchange rates; |
| n | foreign governments may enact currency exchange controls that may limit the ability to fund our operations or significantly increase the cost of maintaining operations; |
| n | customers in foreign jurisdictions may have longer payment cycles, and it may be more difficult to collect receivables in foreign jurisdictions; and |
| n | natural disasters, pandemics or international conflict, including terrorist acts, could interrupt our services, endanger our personnel or cause project delays or loss of trial materials or results. |
These risks and uncertainties could negatively impact our ability to, among other things, perform large, global projects for our customers. Furthermore, our ability to deal with these issues could be affected by applicable U.S. laws and the need to protect our assets. In addition, we may be more susceptible to these risks as we enter and continue to target growth in emerging countries and regions, including Asia, Eastern Europe and Latin America, which may be subject to a relatively higher risk of political instability, economic volatility, crime, corruption and social and ethnic unrest, all of which are exacerbated in many cases by a lack of an independent and experienced judiciary and uncertainties in how local law is applied and enforced. The materialization of any such risks could have an adverse impact on our financial condition, results of operations, cash flows or reputation.
Due to the global nature of our business, we may be exposed to liabilities under the Foreign Corrupt Practices Act and various other anti-corruption laws, and any allegation or determination that we violated these laws could have a material adverse effect on our business.
We are required to comply with the FCPA, UK Bribery Act of 2010 and other U.S. and foreign anti-corruption laws, which prohibit companies from engaging in bribery including corruptly or improperly offering, promising, or providing money or anything else of value to foreign officials and certain other recipients. In addition, the FCPA imposes certain books, records and accounting control obligations on public companies and other issuers. We operate in parts of the world in which corruption can be common and compliance with anti-bribery laws may conflict with local customs and practices. Our global operations face the risk of unauthorized payments or offers being made by employees, consultants, sales agents and other business partners outside of our control or without our authorization. It is our policy to implement safeguards (including mandatory training) to prohibit these practices by our employees and business partners with respect to our operations. However, irrespective of these safeguards, or as a result of monitoring compliance with such safeguards, it is possible that we or certain other parties may discover or receive information at some point that certain employees, consultants, sales agents, or other business partners may have engaged in corrupt conduct for which we might be held responsible. Violations of the FCPA or other foreign anti-corruption laws may result in restatements of, or irregularities in, our financial statements as well as severe criminal or civil sanctions, and we may be subject to other liabilities, which could negatively affect our business, operating results and financial condition. In some cases, companies that violate the FCPA may be debarred by the U.S. government and/or lose their U.S. export privileges. Changes in anti-corruption laws or enforcement priorities could also result in increased compliance requirements and related costs which could adversely affect our business,
27
Table of Contents
financial condition and results of operations. In addition, the U.S. or other governments may seek to hold us liable for successor liability FCPA violations or violations of other anti-corruption laws committed by companies in which we invest or that we acquired or will acquire.
In the past, we have had net losses and we may report net losses in the future, which could negatively impact our ability to achieve or sustain profitability.
In the past, we have had net losses and we cannot assure you that we will achieve or sustain profitability on a quarterly or annual basis in the future. For the Successor six months ended June 30, 2016 and June 30, 2015, the Successor year ended December 31, 2015, the Successor nine month period ended December 31, 2014, the Predecessor three month period ended March 31, 2014 and the Predecessor year ended December 31, 2013 our net income (loss) was $8.4 million, less than $0.1 million, $(8.7) million, $(14.3) million, $(1.2) million and $24.8 million, respectively. If we cannot reach or maintain profitability, the value of our stock price may be impacted.
Our effective income tax rate may fluctuate, which may adversely affect our operations, earnings and earnings per share.
Our effective income tax rate is influenced by our projected profitability in the various taxing jurisdictions in which we operate. The global nature of our business increases our tax risks. In addition, for various reasons, revenue authorities in many of the jurisdictions in which we operate are known to have become more active in their tax collection activities. Changes in the distribution of profits and losses among taxing jurisdictions may have a significant impact on our effective income tax rate, which in turn could have an adverse effect on our net income and earnings per share. The application of tax laws in various taxing jurisdictions, including the United States, is subject to interpretation, and tax authorities in various jurisdictions may have diverging and sometimes conflicting interpretations of the application of tax laws. Changes in tax laws or tax rulings, in the United States or other tax jurisdictions in which we operate, could materially impact our effective tax rate.
Factors that may affect our effective income tax rate include, but are not limited to:
| n | the requirement to exclude from our quarterly worldwide effective income tax calculations losses in jurisdictions where no income tax benefit can be recognized; |
| n | actual and projected full year pre-tax income, including differences between actual and anticipated income before taxes in various jurisdictions; |
| n | changes in tax laws, or in the interpretation or application of tax laws, in various taxing jurisdictions; |
| n | audits or other challenges by taxing authorities; |
| n | the establishment of valuation allowances against a portion or all of certain deferred income tax assets if we determined that it is more likely than not that future income tax benefits will not be realized; and |
| n | changes in the relative mix and size of clinical trials and staffing levels in various tax jurisdictions. |
These changes may cause fluctuations in our effective income tax rate that could adversely affect our results of operations and cause fluctuations in our earnings and earnings per share.
Governmental authorities may question our intercompany transfer pricing policies or change their laws in a manner that could increase our effective tax rate or otherwise harm our business.
As a U.S. company doing business in international markets through subsidiaries, we are subject to foreign tax and intercompany pricing laws, including those relating to the flow of funds between the parent and subsidiaries. Tax authorities in the United States and in foreign markets closely monitor our corporate structure and how we account for intercompany fund transfers. If tax authorities challenge our corporate structure, transfer pricing mechanisms or intercompany transfers, our operations may be negatively impacted and our effective tax rate may increase. Tax rates vary from country to country and if regulators determine that our profits in one jurisdiction should be increased, we might not be able to fully utilize all foreign tax credits that are generated, which would increase our effective tax rate. Additionally, the Organization for Economic Cooperation and Development, or OECD, has issued certain proposed guidelines regarding base erosion and profit sharing. Once these guidelines are formally adopted by the OECD, it is possible that separate taxing jurisdictions may also adopt some form of these guidelines. In such case, we may need to change our approach to intercompany transfer pricing in order to maintain compliance under the new rules. Our effective tax rate may increase or decrease depending on the current location of global operations at the time of the change. Finally, we might not always be in compliance with all applicable customs, exchange control, Value Added Tax and transfer pricing laws despite our efforts to be aware of and to comply with such laws. In such case, we may need to adjust our operating procedures and our business could be adversely affected.
28
Table of Contents
If we are unable to recruit suitable investigators and enroll patients for our customers’ clinical trials, our clinical development business may suffer.
The recruitment of investigators and patients for clinical trials is essential to our business. Investigators are typically located at hospitals, clinics or other sites and supervise the administration of the investigational drug, biologic or device to patients during the course of a clinical trial. Patients typically include people from the communities in which the clinical trials are conducted. Our clinical development business could be adversely affected if we are unable to attract suitable and willing investigators or patients for clinical trials on a consistent basis. For example, if we are unable to engage investigators to conduct clinical trials as planned or enroll sufficient patients in clinical trials, we may need to expend additional funds to obtain access to resources or else be compelled to delay or modify the clinical trial plans, which may result in additional costs to us. These considerations might result in our being unable to successfully achieve our projected development timelines, or potentially even lead to the termination of ongoing clinical trials or development of a product.
Our research and development services could subject us to potential liability that may adversely affect our results of operations and financial condition.
Our business involves the testing of new drugs, biologics and medical devices on patients in clinical trials. Our involvement in the clinical trial and development process creates a risk of liability for personal injury to or death of patients, particularly for those with life-threatening illnesses, resulting from adverse reactions to the products administered during testing or after regulatory approval. For example, we may be sued in the future by individuals alleging personal injury due to their participation in clinical trials and seeking damages from us under a variety of legal theories. If we are required to pay damages or incur defense costs in connection with any personal injury claim that is outside the scope of indemnification agreements we have with our customers, if any indemnification agreement is not performed in accordance with its terms or if our liability exceeds the amount of any applicable indemnification limits or available insurance coverage, our business, financial condition, results of operations, cash flows or reputation could be materially and adversely affected. We might also not be able to obtain adequate insurance or indemnification for these types of risks at reasonable rates in the future.
We also contract with institutions and physicians to serve as investigators in conducting clinical trials. Investigators are typically located at hospitals, clinics or other sites and supervise the administration of the investigational products to patients during the course of a clinical trial. If the investigators or study staff commit errors or make omissions during a clinical trial that result in harm to trial patients, or patients suffer harm with a delayed onset after a clinical trial is completed and the product has obtained regulatory approval, claims for personal injury or products liability damages may result. Additionally, if the investigators engage in fraudulent or negligent behavior, trial data may be compromised, which may require us to repeat the clinical trial or subject us to liability or regulatory action. We do not believe we are legally responsible for the medical care rendered by such third party investigators, and we would vigorously defend any claims brought against us. However, it is possible we could be found liable for claims with respect to the actions of third party investigators and the institutions at which clinical trials may be conducted.
Some of our services involve direct interaction with clinical trial patients and operation of a Phase I clinical facility, which could create potential liability that may adversely affect our results of operations and financial condition.
We operate a facility where Phase I clinical trials are conducted, which ordinarily involve testing an investigational drug, biologic or medical device on a limited number of individuals to evaluate its safety, determine a safe dosage range and identify side effects. Failure to operate such a facility and clinical trials in accordance with FDA, DEA and other applicable regulations could result in disruptions to our operations. Additionally, we face risks associated with adverse events resulting from the administration of such drugs, biologics and medical devices and the professional malpractice of medical care providers. We also directly employ nurses and other trained employees who assist in implementing the testing involved in our clinical trials, such as drawing blood from subjects. Any professional malpractice or negligence by such investigators, nurses or other employees could potentially result in liability to us in the event of personal injury to or death of a subject in clinical trials. This liability, particularly if it were to exceed the limits of any indemnification agreements and insurance coverage we may have, may adversely affect our financial condition, results of operations and reputation.
29
Table of Contents
Our insurance may not cover all of our indemnification obligations and other liabilities associated with our operations.
We maintain insurance designed to provide coverage for ordinary risks associated with our operations and our ordinary indemnification obligations, which we believe to be customary for our industry. The coverage provided by such insurance may not be adequate for all claims we may make or may be contested by our insurance carriers. If our insurance is not adequate or available to pay liabilities associated with our operations, or if we are unable to purchase adequate insurance at reasonable rates in the future, our business, financial condition, results of operations or cash flows may be materially adversely impacted.
Exchange rate fluctuations may have a material adverse effect on our business, financial condition, results of operations or cash flows.
For the Successor six months ended June 30, 2016 and the Successor year ended December 31, 2015, approximately 9.2% and 8.4% of our revenue was denominated in currencies other than U.S. dollars, respectively, and 24.5% and 24.9% of our operational costs, including, but not limited to, salaries, wages and other employee benefits were denominated in foreign currencies, respectively. Of these exposures, 91.4% and 94.9% of our revenue denominated in foreign currencies, respectively, and 46.0% and 46.8% of our operational costs denominated in foreign currencies, respectively, were Euro denominated. Because a large portion of our net service revenue and expenses are denominated in currencies other than the U.S. dollar and our financial statements are reported in U.S. dollars, changes in foreign currency exchange rates could significantly affect our financial condition, results of operations and cash flows.
The revenue and expenses of our foreign operations are generally denominated in local currencies and translated into U.S. dollars for financial reporting purposes. Accordingly, exchange rate fluctuations will affect the translation of foreign results into U.S. dollars for purposes of reporting our consolidated results.
We are subject to foreign currency transaction risk for fluctuations in exchange rates during the period of time between the consummation and cash settlement of a transaction. We earn revenue from our service contracts over a period of several months and, in some cases, over several years. Accordingly, exchange rate fluctuations during such periods may affect our profitability with respect to such contracts.
Additionally, the majority of our global contracts are denominated in U.S. dollars or Euros, while the currency used to fund our operating costs in foreign countries is denominated in various different currencies. Fluctuations in the exchange rates of the currencies we use to contract with our customers and the currencies in which we incur cost to complete those contracts can have a significant impact on our results of operations.
We may limit these risks through exchange rate fluctuation provisions stated in our service contracts. We have not, however, mitigated all of our foreign currency transaction risk, and we may experience fluctuations in financial results from our operations outside the United States and foreign currency transaction risk associated with our service contracts.
Our relationships with existing or potential customers who are in competition with each other may adversely impact the degree to which other customers or potential customers use our services, which may adversely affect our results of operations.
The biopharmaceutical industry is highly competitive, with companies each seeking to persuade payors, providers and patients that their drug therapies are more cost-effective than competing therapies marketed or being developed by competing firms. In addition to the adverse competitive interests that biopharmaceutical companies have with each other, these companies also have adverse interests with respect to drug selection, coverage and reimbursement with other participants in the healthcare industry, including payors and providers. Biopharmaceutical companies also compete to be first to the market with new drug therapies. We regularly provide services to biopharmaceutical companies who compete with each other, and we sometimes provide services to such customers regarding competing drugs in development. Our existing or future relationships with our biopharmaceutical customers may deter other biopharmaceutical customers from using our services or, in certain instances, may result in our customers seeking to place limits on our ability to serve their competitors and other industry participants. In addition, our further expansion into the broader healthcare market may adversely impact our relationships with biopharmaceutical customers, and such customers may elect not to use our services, reduce the scope of services that we provide to
30
Table of Contents
them or seek to place restrictions on our ability to serve customers in the broader healthcare market with interests that are adverse to theirs. Any loss of customers or reductions in the level of revenues from a customer could have a material adverse effect on our business, financial condition, results of operations or cash flows.
If we are unable to successfully integrate potential future acquisitions, our business, financial condition, results of operations and cash flows could be adversely affected.
We anticipate that a portion of our future growth may come from targeted acquisitions to expand our current capabilities and service offerings. The success of any acquisition will depend upon, among other things, our ability to effectively integrate acquired personnel, operations, products and technologies into our business and to retain the key personnel and customers of our acquired businesses. In addition, we may be unable to identify suitable acquisition opportunities or obtain any necessary financing on commercially acceptable terms. We may also spend time and money investigating and negotiating with potential acquisition targets but not complete the transaction. Any acquisition could involve other risks, including, among others, the assumption of additional liabilities and expenses, difficulties and expenses in connection with integrating the acquired companies and achieving the expected benefits, issuances of potentially dilutive securities or interest-bearing debt, loss of key employees of the acquired companies, transaction expenses, diversion of management’s attention from other business concerns and, with respect to the acquisition of international companies, the inability to overcome differences in international business practices, language and customs. Our failure to successfully integrate potential future acquisitions could have an adverse effect on our business, financial condition, results of operations and cash flows.
We have a significant amount of goodwill and intangible assets on our balance sheet, and our results of operations may be adversely affected if we fail to realize the full value of our goodwill and intangible assets.
Our balance sheet reflects goodwill and intangibles assets of $661.0 million and $161.4 million, respectively, as of June 30, 2016. Collectively, goodwill and intangibles assets represented 82.7% of our total assets as of June 30, 2016. Our goodwill was recorded in connection with the Transaction. In accordance with U.S. GAAP, goodwill and indefinite lived intangible assets are not amortized, but are subject to a periodic impairment evaluation. We assess the realizability of our indefinite lived intangible assets and goodwill annually and conduct an interim evaluation whenever events or changes in circumstances, such as operating losses or a significant decline in earnings associated with the acquired business or asset, indicate that these assets may be impaired. In addition, we review long-lived assets for impairment whenever events or changes in circumstances indicate that the carrying amount of the assets might not be recoverable. If indicators of impairment are present, we evaluate the carrying value in relation to estimates of future discounted cash flows. Our ability to realize the value of the goodwill and intangible assets will depend on the future cash flows of our businesses. The carrying amount of the goodwill could be impaired if there is a downturn in our business or our industry or other factors that affect the fair value of our business, in which case a charge to earnings would become necessary. If we are not able to realize the value of the goodwill and intangible assets, we may be required to incur material charges relating to the impairment of those assets. For example, in conjunction with the 2015 fourth quarter annual assessment of goodwill, we determined that goodwill related to our Clinics reporting unit was impaired and we recognized an impairment charge of $9.3 million, which represented 100% of the goodwill that had been allocated to this reporting unit. Such impairment charges in the future could materially and adversely affect our business, financial condition, results of operations and cash flows.
Our ability to utilize our net operating loss carryforwards or certain other tax attributes may be limited.
Under Sections 382 and 383 of the U.S. Internal Revenue Code of 1986, as amended, if a corporation undergoes an “ownership change” (generally defined as a greater than 50 percentage point change, by value, in the aggregate stock ownership of certain shareholders over a three-year period), the corporation’s ability to use its pre-change net operating loss carryforwards to offset its future taxable income and other pre-change tax attributes may be limited. We have experienced at least one ownership change in the past. We may experience additional ownership changes in the future (including in connection with this offering). In addition, future changes in our stock ownership (including future sales by Cinven) could result in additional ownership changes. Any such ownership changes could limit our ability to use our net operating loss carryforwards to offset any future taxable income and other tax attributes. State and foreign tax laws may also impose limitations on our ability to utilize net operating loss carryforwards and other tax attributes.
Our operations involve the use and disposal of hazardous substances and waste which can give rise to liability that could adversely impact our financial condition.
We conduct activities that have involved, and may continue to involve, the controlled use of hazardous materials and the creation of hazardous substances, including medical waste and other highly regulated substances. As a result,
31
Table of Contents
our operations pose the risk of accidental contamination or injury caused by the release of these materials and/or the creation of hazardous substances, including medical waste and other highly regulated substances. In the event of such an accident, we could be held liable for damages and cleanup costs which, to the extent not covered by existing insurance or indemnification, could harm our business. In addition, other adverse effects could result from such liability, including reputational damage resulting in the loss of additional business from certain customers.
The failure of third parties to provide us critical support services could materially adversely affect our business, financial condition, results of operations, cash flows or reputation.
We depend on third parties for support services vital to our business. Such support services include, but are not limited to, laboratory services, third-party transportation and travel providers, technology providers, freight forwarders and customs brokers, drug depots and distribution centers, suppliers or contract manufacturers of drugs for patients participating in clinical trials and providers of licensing agreements, maintenance contracts or other services. In addition, we also rely on third-party CROs and other contract clinical personnel for clinical services either in regions where we have limited resources, or in cases where demand cannot be met by our internal staff. The failure of any of these third parties to adequately provide us critical support services could have a material adverse effect on our business, financial condition, results of operations, cash flows or reputation.
We have only a limited ability to protect our intellectual property rights, and these rights are important to our success.
Our success depends, in part, upon our ability to develop, use and protect our proprietary methodologies, analytics, systems, technologies and other intellectual property. Existing laws of the various countries in which we provide services or solutions offer only limited protection of our intellectual property rights, and the protection in some countries may be very limited. We rely upon a combination of trade secrets, confidentiality policies, nondisclosure, invention assignment and other contractual arrangements, and copyright, trademark and trade secret laws, to protect our intellectual property rights. These laws are subject to change at any time and certain agreements may not be fully enforceable, which could further restrict our ability to protect our innovations. Our intellectual property rights may not prevent competitors from independently developing services similar to or duplicative of ours. Further, the steps we take in this regard might not be adequate to prevent or deter infringement or other misappropriation of our intellectual property by competitors, former employees or other third parties, and we might not be able to detect unauthorized use of, or take appropriate and timely steps to enforce, our intellectual property rights. Enforcing our rights might also require considerable time, money and oversight, and we may not be successful in enforcing our rights.
The results of the United Kingdom’s referendum on withdrawal from the European Union may have a negative effect on global economic conditions, financial markets and our business.
In June 2016, a majority of voters in the United Kingdom elected to withdraw from the European Union, or the EU, in a national referendum. The referendum was advisory, and the terms of any withdrawal are subject to a negotiation period that could last at least two years after the government of the United Kingdom formally initiates a withdrawal process. Nevertheless, the referendum has created significant uncertainty about the future relationship between the United Kingdom and the EU, including with respect to the laws and regulations that will apply as the United Kingdom determines which EU laws to replace or replicate in the event of a withdrawal. The referendum has also given rise to calls for the governments of other EU member states to consider withdrawal. These developments, or the perception that any of them could occur, have had and may continue to have a material adverse effect on global economic conditions and the stability of global financial markets, and may significantly reduce global market liquidity and restrict the ability of key market participants to operate in certain financial markets. Any of these factors could depress economic activity and restrict our access to capital, which could have a material adverse effect on our business, financial condition and results of operations and reduce the price of our common stock.
Potential future investments in our customers’ businesses or products could have a negative impact on our financial results.
We have in the past and may in the future enter into arrangements with our customers or other drug, biologic or medical device companies in which we take on payment risk by making strategic investments in our customers or other drug companies, providing flexible payment terms or fee financing to customers or other companies, or entering into other risk sharing arrangements on trial execution. Our financial results would be adversely affected if the amount realized from any such risk sharing arrangement was less than the value of our services under the contract related to such arrangement.
32
Table of Contents
Our operations might be affected by the occurrence of a natural disaster or other catastrophic event.
We depend on our customers, investigators, laboratories and other facilities for the continued operation of our business. Although we have contingency plans in place for natural disasters or other catastrophic events, these events, including terrorist attacks, pandemic flu, hurricanes, floods and ice and snow storms, could nevertheless disrupt our operations or those of our customers, investigators and collaboration partners, which could also affect us. Even though we carry business interruption insurance policies and typically have provisions in our contracts that protect us in certain events, we might suffer losses as a result of business interruptions that exceed the coverage available under our insurance policies or for which we do not have coverage. Any natural disaster or catastrophic event affecting us or our customers, investigators or collaboration partners could have a significant negative impact on our operations and financial performance.
Risks Relating to Our Industry
Outsourcing trends in the biopharmaceutical industry and changes in aggregate expenditures and R&D budgets could adversely affect our operating results and growth rate.
Our revenues depend on the level of R&D expenditures, size of the drug development pipelines and outsourcing trends of the biopharmaceutical industry, including the amount of such R&D expenditures that is outsourced and subject to competitive bidding among CROs. Accordingly, economic factors and industry trends that affect biopharmaceutical companies affect our business. For example, if biopharmaceutical companies become less able to access capital in the future, they may commit less capital to our services going forward. Also, biopharmaceutical companies continue to seek long-term strategic collaborations with global CROs with favorable pricing terms. Many of our competitors seek out these collaborations, while we generally do not. If our competitors can successfully enter into these collaborations, it may reduce the share of the biopharmaceutical outsourcing business that we might otherwise be positioned to capture.
In addition, if the biopharmaceutical industry reduces its outsourcing of clinical trials or such outsourcing fails to grow at projected or expected rates, or at all, our business, financial condition, results of operations and cash flows could be materially and adversely affected. We may also be negatively impacted by consolidation and other factors in the biopharmaceutical industry, which may slow decision making by our customers, result in the delay or cancellation of existing projects, cause reductions in overall R&D expenditures or lead to increased pricing pressures. Further, in the event that one of our customers combines with a company that is using the services of one of our competitors, the combined company could decide to use the services of that competitor or another provider. All of these events could adversely affect our business, financial condition, cash flows or results of operations.
We face intense competition in many areas of our business and, if we do not compete effectively, our business may be harmed.
The CRO industry is highly competitive. We often compete for business with other CROs as well as internal development departments at some of our customers, some of which could be considered large CROs in their own right. We also compete with universities and teaching hospitals. Some of these competitors have greater financial resources and a wider range of service offerings over a greater geographic area than we do. If we do not compete successfully, our business will suffer. The industry is highly fragmented, with numerous smaller specialized companies and a handful of full-service companies with global capabilities similar to ours. Increased competition has led to price and other forms of competition, such as acceptance of less favorable contract terms, which could adversely affect our operating results. In recent years, our industry has experienced consolidation. This trend is likely to produce more competition from the resulting larger companies. Further, certain of our key competitors are private and, therefore, they do not contend with the cost pressures of being a public company. We compete with both large CROs and mid-sized CROs, and have increasingly faced more competition from larger CROs. Our ability to continue to grow and perform effectively will directly impact our success against our competitors. In addition, there are few barriers to entry for smaller specialized companies considering entering the industry. Because of their size and focus, small CROs might compete effectively against larger companies such as us, especially in lower cost geographic areas, which could have a material adverse effect on our business.
33
Table of Contents
We may be affected by healthcare reform and potential additional regulatory reforms, which may adversely impact the biopharmaceutical industry or otherwise reduce the need for our services or negatively impact our profitability.
Numerous government bodies are considering or have adopted various healthcare reforms and may undertake, or are in the process of undertaking, efforts to control growing healthcare costs through legislation, regulation and voluntary agreements with healthcare providers and biopharmaceutical companies, including many of our customers. By way of example, in March 2010, the Patient Protection and Affordable Care Act, as amended by the Health Care and Education Reconciliation Act, or collectively, the Affordable Care Act, was signed into law, which, among other things, expanded, over time, health insurance coverage, imposed health industry cost containment measures, enhanced remedies against healthcare fraud and abuse, added new transparency requirements for healthcare and health insurance industries, imposed new taxes and fees on pharmaceutical and medical device manufacturers, added new requirements for certain applicable drug and device manufacturers to disclose payments to physicians, including principal investigators, and imposed additional health policy reforms, any of which may significantly impact the biopharmaceutical industry. We are uncertain as to the full effects of these reforms on our business and are unable to predict what legislative proposals, if any, will be adopted in the future. If regulatory cost containment efforts limit the profitability of new drugs, our customers may reduce their R&D expenditures, which could reduce the business they outsource to us. Similarly, if regulatory requirements for product testing are relaxed or harmonized across jurisdictions, or simplified drug approval procedures are adopted, the demand for our services could decrease.
Government bodies may also adopt healthcare legislation or regulations that are more burdensome than existing regulations. For example, product safety concerns and recommendations by the Drug Safety Oversight Board could change the regulatory environment for drug products, and new or heightened regulatory requirements may increase our expenses or limit our ability to offer some of our services. Additionally, new or heightened regulatory requirements may have a negative impact on the ability of our customers to conduct industry sponsored clinical trials, which could reduce the need for our services.
Recent consolidation in the biopharmaceutical industry could lead to a reduction in our revenues.
The biopharmaceutical industry is currently undergoing a period of increased merger activity. Several large biopharmaceutical companies have recently completed mergers and acquisitions that will consolidate the outsourcing trends and R&D expenditures into fewer companies, and many larger and medium sized biopharmaceutical companies have been acquiring smaller biopharmaceutical companies. As a result of this and future consolidations, our customer diversity may decrease and our business may be adversely affected.
If we fail to comply with federal, state and foreign healthcare laws, including fraud and abuse laws, we could face substantial penalties and our business, results of operations, financial condition and prospects could be adversely affected.
Even though we do not order healthcare services or bill directly to Medicare, Medicaid or other third party payors, certain federal and state healthcare laws and regulations pertaining to fraud and abuse are applicable to our business. We could be subject to healthcare fraud and abuse laws of both the federal government and the states in which we conduct our business. Because of the breadth of these laws and the narrowness of available statutory and regulatory exceptions, it is possible that some of our business activities could be subject to challenge under one or more of such laws. If we or our operations are found to be in violation of any of the laws described above or any other governmental regulations that apply to us, we may be subject to penalties, including civil and criminal penalties, damages, fines, imprisonment and the curtailment or restructuring of our operations, any of which could materially adversely affect our ability to operate our business and our financial results.
Current and proposed laws and regulations regarding the protection of personal data could result in increased risks of liability or increased cost to us or could limit our service offerings.
The confidentiality, collection, use and disclosure of personal data, including clinical trial patient-specific information, are subject to governmental regulation generally in the country in which the personal data was collected or used. For example, U.S. federal regulations under the Health Insurance Portability and Accountability Act of 1996, as amended by the Health Information Technology for Economic and Clinical Health Act of 2009 and their implementing regulations, including the Privacy and Security Rules, or collectively, HIPAA, generally require individuals’ written authorization, in addition to any required informed consent, before protected health information may be used for research and such regulations specify standards for de-identifications and for limited data sets. We may also be subject to applicable state privacy and security laws and regulations in states in which we operate. Two
34
Table of Contents
of our subsidiaries, Medpace Clinical Pharmacology, LLC and C-MARC, LLC, are covered entities under HIPAA. Further, because of amendments to the HIPAA Privacy and Security Rules that were promulgated on January 25, 2013, known as the Omnibus Final Rule, service providers to covered entities under HIPAA, known as business associates, are now directly subject to HIPAA. There are some instances where we may be a HIPAA “business associate” of a “covered entity,” meaning that we may be directly liable for any breaches of protected health information and other HIPAA violations. We are also liable contractually under any business associate agreements we have signed with covered entities. If we are determined to be a business associate, we would be subject to HIPAA’s enforcement scheme, which, as amended, can result in up to $1.5 million in annual civil penalties for each HIPAA violation. A single breach incident can result in multiple violations of the HIPAA standards, meaning that penalties could be in excess of $1.5 million.
HIPAA also authorizes state attorneys general to file suit on behalf of their residents for violations. Courts are able to award damages, costs and attorneys’ fees related to violations of HIPAA in such cases. While HIPAA does not create a private right of action allowing individuals to file suit against us in civil court for violations of HIPAA, its standards have been used as the basis for duty of care cases in state civil suits such as those for negligence or recklessness in the misuse or breach of protected health information. In addition, HIPAA mandates that the Secretary of the U.S. Department of Health and Human Services conduct periodic compliance audits of HIPAA covered entities and their business associates for compliance with the HIPAA privacy and security standards.
In the EU, personal data includes any information that relates to an identified or identifiable natural person with health information carrying additional obligations, including obtaining the explicit consent from the individual for collection, use or disclosure of the information. In addition, we are subject to EU rules with respect to export of such data out of the EU. Such data export rules are constantly changing, for example, following a decision of the European Court of Justice in October 2015, transferring personal data to U.S. companies like us that had certified as a member of the EU-U.S. Safe Harbor Scheme was declared invalid and the other methods to permit transfer are now under review. In February 2016, the European Commission issued the proposed legal texts of the EU-U.S. Privacy Shield, which is intended to replace the U.S. Safe Harbor Scheme. These legal texts are currently under review by the European legislative bodies and it is unclear when they will be approved and when data exports out of the EU will be allowed to take place under the new framework. The United States, the EU and its member states, and other countries where we have operations, such as Singapore and Russia, continue to issue new privacy and data protection rules and regulations that relate to personal data and health information. Failure to comply with certain certification/registration and annual re-certification/registration provisions associated with these data protection and privacy regulations and rules in various jurisdictions, or to resolve any serious privacy or security complaints, could subject us to regulatory sanctions, criminal prosecution or civil liability. Federal, state and foreign governments may propose or have adopted additional legislation governing the collection, possession, use or dissemination of personal data, such as personal health information, and personal financial data as well as security breach notification rules for loss or theft of such data. Additional legislation or regulation of this type might, among other things, require us to implement new security measures and processes or bring within the legislation or regulation de-identified health or other personal data, each of which may require substantial expenditures or limit our ability to offer some of our services. Additionally, if we violate applicable laws, regulations or duties relating to the use, privacy or security of personal data, we could be subject to civil liability or criminal prosecution, be forced to alter our business practices and suffer reputational harm. The laws in the EU are under reform and from early 2018 onwards, we will be subject to the requirements of the General Data Protection Regulation, or GDPR, because we are processing data in the EU. The GDPR increases the deadline for data breach notifications, imposes additional obligations when we process personal data on behalf of our customers, including in relation to security measures, and increases administrative burdens on companies processing personal data. If we do not comply with our obligations under the GDPR we could be exposed to significant fines of up to 20 million EUR or up to 4% of the total worldwide annual turnover of the preceding financial year, whichever is higher.
The biopharmaceutical industry has a history of patent and other intellectual property litigation, and we might be involved in costly intellectual property lawsuits.
The biopharmaceutical industry has a history of intellectual property litigation, and these lawsuits will likely continue in the future. Accordingly, even without wrongdoing on our part, we may face patent infringement suits by companies that have patents for similar business processes or other suits alleging infringement of their intellectual property rights. Legal proceedings relating to intellectual property could be expensive, take significant time and
35
Table of Contents
divert management’s attention from other business concerns, regardless of the outcome of the litigation. If we do not prevail in an infringement lawsuit brought against us, we might have to pay substantial damages, and we could be required to stop the infringing activity or obtain a license to use technology on unfavorable terms. Further, our customers could be similarly exposed to intellectual property suits and the resulting economic and operational strain defending such claims could negatively impact such customers’ ability to fund or continue ongoing clinical trials on which we are working.
Actions by regulatory authorities or customers to limit the scope of or withdraw an approved drug, biologic or medical device from the market could result in a loss of revenue.
Government regulators have the authority, after approving a drug, biologic or medical device, to limit its indication for use by requiring additional labeled warnings or to withdraw the product’s approval for its approved indication based on safety or other concerns. Similarly, customers may act to voluntarily limit the availability of approved products or withdraw them from the market after we begin our work. If we are providing services to customers for products that are limited in availability or withdrawn, we may be required to narrow the scope of or terminate our services with respect to such products, which would prevent us from earning the full amount of net service revenue anticipated under the related service contracts.
If we do not keep pace with rapid technological changes, our services may become less competitive or obsolete.
The biopharmaceutical industry generally, and drug development and clinical research more specifically, are subject to rapid technological changes. Our current competitors or other businesses might develop technologies or services that are more effective or commercially attractive than, or render obsolete, our current or future technologies and services. If our competitors introduce superior technologies or services and if we cannot make enhancements to remain competitive, our competitive position would be harmed. If we are unable to compete successfully, we may lose customers or be unable to attract new customers, which could lead to a decrease in our revenue and have a material adverse effect on our financial condition.
Circumstances beyond our control could cause the CRO industry to suffer reputational or other harm that could result in an industry-wide reduction in demand for CRO services, which could harm our business.
Demand for our services may be affected by perceptions of our customers regarding the CRO industry as a whole. For example, other CROs could engage in conduct that could render our customers less willing to do business with us or any CRO. Likewise, a widely reported injury to clinical trial participants could result in negative perceptions of clinical trial activity, thereby adversely impacting our industry. One or more CROs could engage in or fail to detect malfeasance, such as inadequately monitoring sites, producing inaccurate databases or analysis, falsifying patient records, and performing incomplete lab work, or take other actions that would reduce the confidence of our customers in the CRO industry. As a result, the willingness of biopharmaceutical companies to outsource R&D services to CROs could diminish and our business could thus be harmed materially by events outside our control.
Risks Relating to Our Indebtedness
Our indebtedness could adversely affect our financial condition and prevent us from fulfilling our debt obligations and may otherwise restrict our activities.
Our Senior Secured Credit Facilities consist of a $60.0 million Senior Secured Revolving Credit Facility maturing in April 2019 and a $530.0 million Senior Secured Term Loan Facility maturing in April 2021. On an as adjusted basis, after giving effect to this offering and the use of proceeds therefrom, as of June 30, 2016, we would have had approximately $225.7 million of outstanding indebtedness under our Senior Secured Term Loan Facility and no borrowings outstanding under our Senior Secured Revolving Credit Facility. In addition, we would have had up to $60.0 million of additional borrowing capacity available under our Senior Secured Revolving Credit Facility. Our substantial indebtedness could adversely affect our financial condition and thus make it more difficult for us to satisfy our obligations with respect to our Senior Secured Credit Facilities. If our cash flow is not sufficient to service our debt and adequately fund our business, we may be required to seek further additional financing or refinancing or dispose of assets. We might not be able to influence any of these alternatives on satisfactory terms or at all. Our substantial indebtedness could also:
| n | increase our vulnerability to adverse general economic, industry or competitive developments; |
| n | require us to dedicate a more substantial portion of our cash flows from operations to payments on our indebtedness, thereby reducing the availability of our cash flows to fund working capital, investments, acquisitions, capital expenditures, and other general corporate purposes; |
36
Table of Contents
| n | limit our ability to make required payments under our existing contractual commitments, including our existing long-term indebtedness; |
| n | limit our ability to fund a change of control offer; |
| n | require us to sell certain assets; |
| n | restrict us from making strategic investments, including acquisitions or cause us to make non-strategic divestitures; |
| n | limit our flexibility in planning for, or reacting to, changes in market conditions, our business and the industry in which we operate; |
| n | place us at a competitive disadvantage compared to our competitors that have less debt; |
| n | cause us to incur substantial fees from time to time in connection with debt amendments or refinancings; |
| n | increase our exposure to rising interest rates because a portion of our borrowings is at variable interest rates; and |
| n | limit our ability to borrow additional funds or to borrow on terms that are satisfactory to us. |
For more information about our indebtedness, see “Management’s Discussion and Analysis of Financial Condition and Results of Operations—Liquidity and Capital Resources—Indebtedness.”
Despite our current level of indebtedness, we may incur more debt and undertake additional obligations. Incurring such debt or undertaking such additional obligations could further exacerbate the risks to our financial condition.
Although the credit agreement governing the Senior Secured Credit Facilities contains restrictions on our incurrence of additional indebtedness, these restrictions are subject to a number of qualifications and exceptions and the indebtedness incurred in compliance with these restrictions could increase. To the extent new debt is added to our current debt levels, the risks to our financial condition would increase.
While the credit agreement governing the Senior Secured Credit Facilities also contains restrictions on our ability to make loans and investments, these restrictions are subject to a number of qualifications and exceptions, and the investments incurred in compliance with these restrictions could be substantial.
Covenant restrictions under our Senior Secured Credit Facilities may limit our ability to operate our business.
The agreement governing our Senior Secured Credit Facilities contains covenants that may restrict our ability to, among other things:
| n | create, incur or assume any lien upon any of our property, assets or revenue; |
| n | make or hold certain investments; |
| n | incur or assume any indebtedness; |
| n | merge, dissolve, liquidate or consolidate with or into another person; |
| n | make certain dispositions of property or other assets (including sale leaseback transactions); |
| n | declare or make certain restricted payments, including dividends; |
| n | enter into certain transactions with affiliates; |
| n | prepay subordinated debt; |
| n | enter into burdensome agreements; |
| n | engage in any material line of business substantially different from our currently conducted business; or |
| n | change our fiscal year. |
In addition, if we have drawn greater than 30% of the commitments under the Senior Secured Revolving Credit Facility as of the last date of any quarter, then we are required to report compliance with a financial covenant that is tested at the end of such quarter. This financial covenant requires us to maintain a funded first lien net debt to consolidated EBITDA leverage ratio of less than or equal to 8.00:1.00 for any fiscal quarter ending on or prior to March 31, 2016 and 7.50:1.00, thereafter. As of June 30, 2016, we maintained a net debt to consolidated EBITDA leverage ratio, as defined under the Senior Secured Credit Facilities, of 2.95:1.00. As of June 30, 2016, we were in compliance with all covenants under our Senior Secured Credit Agreement.
Although the covenants in our Senior Secured Credit Facilities are subject to various exceptions, we cannot assure you that these covenants will not adversely affect our ability to finance future operations or capital needs or to
37
Table of Contents
engage in other activities that may be in our best interest. In addition, in certain circumstances, our long-term debt requires us to maintain a specified financial ratio and satisfy certain financial condition tests, which may require that we take action to reduce our debt or to act in a manner contrary to our business objectives. A breach of any of these covenants could result in a default under our Senior Secured Credit Facilities. If an event of default under our Senior Secured Credit Facilities occurs, the lenders thereunder could elect to declare all amounts outstanding thereunder, together with accrued interest, to be immediately due and payable. In such case, we might not have sufficient funds to repay all the outstanding amounts. In addition, our Senior Secured Credit Facilities are secured by first priority security interests on substantially all of our assets, including the capital stock of certain of our subsidiaries. If an event of default under our Senior Secured Credit Facilities occurs, the lenders thereunder could exercise their rights under the related security documents. Any acceleration of amounts due under the Senior Secured Credit Facilities or the substantial exercise by the lenders of their rights under the security documents would likely have a material adverse effect on us.
We may not be able to generate sufficient cash to service all of our indebtedness, and may be forced to take other actions to satisfy our obligations under our indebtedness that may not be successful.
Our ability to satisfy our debt obligations will depend upon, among other things:
| n | our future financial and operating performance, which will be affected by prevailing economic conditions and financial, business, regulatory and other factors, many of which are beyond our control; and |
| n | the future availability of borrowings under our Senior Secured Credit Facilities, which depends on, among other things, our complying with the covenants in those facilities. |
We cannot assure you that our business will generate sufficient cash flow from operations, or that future borrowings will be available to us under our Senior Secured Credit Facilities or otherwise, in an amount sufficient to fund our liquidity needs.
If our cash flows and capital resources are insufficient to service our indebtedness, we may be forced to reduce or delay capital expenditures, sell assets, seek additional capital or restructure or refinance our indebtedness. These alternative measures may not be successful and may not permit us to meet our scheduled debt service obligations. Our ability to restructure or refinance our debt will depend on the condition of the capital markets and our financial condition at such time. Any refinancing of our debt could be at higher interest rates and may require us to comply with more onerous covenants, which could further restrict our business operations. In addition, the terms of existing or future debt agreements, may restrict us from adopting some of these alternatives. In the absence of such operating results and resources, we could face substantial liquidity problems and might be required to dispose of material assets or operations to meet our debt service and other obligations. We may not be able to consummate those dispositions for fair market value or at all, and any proceeds that we could realize from any such dispositions may not be adequate to meet our debt service obligations then due.
Interest rate fluctuations may affect our results of operations and financial condition.
Because a substantial portion of our debt is variable-rate debt, fluctuations in interest rates could have a material effect on our business. As a result, we may incur higher interest costs if interest rates increase. These higher interest costs could have a material adverse impact on our financial condition and the levels of cash we maintain for working capital.
We are dependent upon our lenders for financing to execute our business strategy and meet our liquidity needs. If our lenders are unable to fund borrowings under their credit commitments or we are unable to borrow, it could negatively impact our business.
During periods of volatile credit markets, there is risk that any lenders, even those with strong balance sheets and sound lending practices, could fail or refuse to honor their legal commitments and obligations under existing credit commitments, including but not limited to, extending credit up to the maximum permitted by a credit facility. If our lenders are unable to fund borrowings under their revolving credit commitments or we are unable to borrow (such as having insufficient capacity under our borrowing base), it could be difficult in such environments to obtain sufficient liquidity to meet our operational needs.
38
Table of Contents
Risks Relating to Our Common Stock and This Offering
Cinven and our Chief Executive Officer and founder will collectively control a substantial majority of our outstanding common stock following this offering and their interests may be different from or conflict with those of our other shareholders.
Upon the completion of this offering, Cinven will own approximately 58.0% of the outstanding shares of our common stock (or 56.5% if the underwriters exercise their option to purchase additional shares in full) and Dr. August J. Troendle, our Chief Executive Officer and founder, through his direct ownership of 351,851 shares of our common stock and his beneficial ownership of 9,201,377 shares of our common stock held by MPI, will control approximately 24.1% of the outstanding shares of our common stock (or 23.5% if the underwriters exercise their option to purchase additional shares in full). Additionally, upon a distribution of our common stock held by MPI, our Chief Executive Officer would receive approximately 73% of such shares. Accordingly, both Cinven and Dr. Troendle will be able to exert a significant degree of influence or actual control over our management and affairs and will control all corporate actions requiring shareholder approval, irrespective of how our other shareholders may vote, including:
| n | subject to the voting arrangements described in “Certain Relationships and Related Person Transactions,” the election and removal of directors and the size of our board of directors, or the Board; |
| n | any amendment of our articles of incorporation or bylaws; or |
| n | the approval of mergers and other significant corporate transactions, including a sale of substantially all of our assets. |
Dr. Troendle has indicated an interest in purchasing shares of our common stock in this offering at the initial public offering price. If he were to purchase all of the shares he has indicated an interest in purchasing in this offering, assuming an initial public offering price of $21.50 per share, which is the midpoint of the price range set forth on the cover page of this prospectus, he would purchase an aggregate of approximately 930,233 shares, and as a result the percentage of the outstanding shares of our common stock that he would control directly or through his beneficial ownership of shares of our common stock held by MPI would increase to approximately 26.4% (or 25.8% if the underwriters exercise their option to purchase additional shares in full).
Moreover, Cinven’s and Dr. Troendle’s share ownership may also adversely affect the trading price for our common stock to the extent investors perceive disadvantages in owning shares of a company with controlling shareholders. In addition, we have historically paid an affiliate of Cinven an annual fee for certain advisory and consulting services pursuant to an advisory services agreement, or the Advisory Services Agreement. See “Certain Relationships and Related Person Transactions—Advisory Fees.” The Advisory Services Agreement will be terminated in connection with the consummation of this offering. In addition, Cinven is in the business of making investments in companies and may, from time to time, acquire interests in businesses that directly or indirectly compete with our business, as well as businesses that are significant existing or potential customers. Cinven may acquire or seek to acquire assets that we seek to acquire and, as a result, those acquisition opportunities may not be available to us or may be more expensive for us to pursue, and as a result, the interests of Cinven may not coincide and may even conflict with the interests of our other shareholders.
Upon the listing of our common stock on NASDAQ, we will be a “controlled company” within the meaning of the rules and, as a result, will qualify for, and intend to rely on, exemptions from certain corporate governance requirements. You will not have the same protections afforded to shareholders of companies that are subject to such requirements.
We understand that, substantially concurrently with the closing of this offering, Cinven and Dr. August J. Troendle, our Chief Executive Officer and founder, intend to enter into a voting agreement, or the Voting Agreement. Pursuant to the terms of the Voting Agreement, for so long as Cinven and Dr. Troendle collectively hold at least 40% of our outstanding voting shares, or the Voting Agreement is otherwise terminated in accordance with its terms, Cinven will agree to vote its shares of our common stock in favor of the election of Dr. Troendle to our Board (so long as Dr. Troendle remains our Chief Executive Officer) upon his nomination by our Board and Dr. Troendle will agree to vote his shares of our common stock in favor of the election of the directors affiliated with Cinven upon their nomination by our Board; provided, that in the event that Cinven holds less than (a) 40% but greater than or equal to 25% of our voting shares then outstanding, Dr. Troendle shall be required to vote for two directors affiliated with Cinven, after giving effect to the directors then sitting on the Board, (b) 25% but greater than or equal to 10% of our voting shares then outstanding, Dr. Troendle shall be required to vote for one director affiliated with Cinven, after
39
Table of Contents
giving effect to the directors then sitting on the Board and (c) 10% of our voting shares then outstanding, Dr. Troendle shall not be required to vote for any directors affiliated with Cinven.
Because of the Voting Agreement and the aggregate voting power of Cinven and Dr. Troendle, we are considered a “controlled company” within the meaning of the corporate governance standards of NASDAQ. Under these rules, a company of which more than 50% of the voting power for the election of directors is held by an individual, group or another company is a “controlled company” and may elect not to comply with certain corporate governance requirements, including the requirements that, within one year of the date of the listing of our common stock:
| n | we have a Board that is composed of a majority of “independent directors,” as defined under the rules of such exchange; |
| n | we have a compensation committee that is composed entirely of independent directors with a written charter addressing the committee’s purpose and responsibilities; and |
| n | director nominations be made, or recommended to the full Board, by our independent directors or by a nominating and corporate governance committee that is composed entirely of independent directors with a written charter addressing the committee’s purpose and responsibilities. |
After we cease to be a “controlled company,” we will be required to comply with the above-referenced requirements within one year.
Following this offering, we will not have a nominating and corporate governance committee. Accordingly, you will not have the same protections afforded to shareholders of companies that are subject to all of the corporate governance requirements of NASDAQ. Cinven and Dr. Troendle, however, are not subject to any contractual obligation to retain their controlling interest, except that they have agreed, subject to certain exceptions, not to sell or otherwise dispose of any shares of our common stock or other capital stock or other securities exercisable or convertible therefor for a period of at least 180 days after the date of this prospectus without the prior written consent of Jefferies LLC. Except for this brief period, there can be no assurance as to the period of time during which Cinven and Dr. Troendle will maintain their ownership of our common stock following the offering. As a result, there can be no assurance as to the period of time during which we will be able to avail ourselves of the controlled company exemptions.
Our anti-takeover provisions could prevent or delay a change in control of our company, even if such change in control would be beneficial to our shareholders.
Provisions of our amended and restated certificate of incorporation and amended and restated bylaws, as they will be in effect upon completion of this offering, as well as provisions of Delaware law could discourage, delay or prevent a merger, acquisition or other change in control of our company, even if such change in control would be beneficial to our shareholders. These provisions include:
| n | authorizing the issuance of “blank check” preferred stock that could be issued by our Board to increase the number of outstanding shares and thwart a takeover attempt; |
| n | establishing a classified Board so that not all members of our Board are elected at one time; |
| n | the removal of directors only for cause; |
| n | prohibiting the use of cumulative voting for the election of directors; |
| n | limiting the ability of shareholders to call special meetings or amend our bylaws; |
| n | requiring all shareholder actions to be taken at a meeting of our shareholders and not by written consent; and |
| n | establishing advance notice and duration of ownership requirements for nominations for election to the Board or for proposing matters that can be acted upon by shareholders at shareholder meetings. |
These provisions could also discourage proxy contests and make it more difficult for you and other shareholders to elect directors of your choosing and cause us to take other corporate actions you desire. In addition, because our Board is responsible for appointing the members of our management team, these provisions could in turn affect any attempt by our shareholders to replace current members of our management team.
In addition, the Delaware General Corporation Law, or the DGCL, to which we are subject, prohibits us, except under specified circumstances, from engaging in any mergers, significant sales of stock or assets or business combinations
40
Table of Contents
with any shareholder or group of shareholders who owns at least 15% of our common stock for three years following their becoming the owner of 15% of our common stock.
Cinven and our non-employee directors may acquire interests and positions that could present potential conflicts with our and our shareholders’ interests.
Cinven and our non-employee directors make investments in companies and may, from time to time, acquire and hold interests in businesses that compete directly or indirectly with us. Cinven and our non-employee directors may also pursue, for their own accounts, acquisition opportunities that may be complementary to our business, and as a result, those acquisition opportunities might not be available to us. Our organizational documents contain provisions renouncing any interest or expectancy held by Cinven or by our non-employee directors in corporate opportunities. Accordingly, the interests of Cinven and our non-employee directors may supersede ours, causing Cinven or its affiliates or our non-employee directors and their affiliates to compete against us or to pursue opportunities instead of us, for which we have no recourse. Such actions on the part of Cinven or our non-employee directors and inaction on our part could have a material adverse effect on our business, financial condition, results of operations and cash flows.
Full-time investment professionals of Cinven occupy three seats on our Board. Because Cinven could invest in entities that directly or indirectly compete with us, when conflicts arise between the interests of Cinven and the interests of our shareholders, these directors may not be disinterested.
We may issue shares of preferred stock in the future, which could make it difficult for another company to acquire us or could otherwise adversely affect holders of our common stock, which could depress the price of our common stock.
Our amended and restated certificate of incorporation will authorize us to issue one or more series of preferred stock. Our Board will have the authority to determine the preferences, limitations and relative rights of the shares of preferred stock and to fix the number of shares constituting any series and the designation of such series, without any further vote or action by our shareholders. Our preferred stock could be issued with voting, liquidation, dividend and other rights superior to the rights of our common stock. The potential issuance of preferred stock may delay or prevent a change in control of us, discourage bids for our common stock at a premium to the market price, and materially and adversely affect the market price and the voting and other rights of the holders of our common stock.
The provision of our amended and restated certificate of incorporation requiring exclusive venue in the Court of Chancery in the State of Delaware for certain types of lawsuits may have the effect of discouraging lawsuits against our directors and officers.
Our amended and restated certificate of incorporation will require, to the fullest extent permitted by law, that (i) any derivative action or proceeding brought on our behalf, (ii) any action asserting a claim of breach of a fiduciary duty owed by any of our directors, officers or other employees to us or our shareholders, (iii) any action asserting a claim against us arising pursuant to any provision of the DGCL or our amended and restated certificate of incorporation or the bylaws or (iv) any action asserting a claim against us governed by the internal affairs doctrine will have to be brought only in the Court of Chancery in the State of Delaware. Although we believe this provision benefits us by providing increased consistency in the application of Delaware law in the types of lawsuits to which it applies, the provision may have the effect of discouraging lawsuits against our directors and officers.
If you purchase shares of common stock sold in this offering, you will incur immediate and substantial dilution.
Dilution is the difference between the offering price per share and the net tangible book value per share of our common stock immediately after the offering. The price you pay for shares of our common stock sold in this offering is substantially higher than our net tangible book value per share immediately after this offering. If you purchase shares of common stock in this offering, you will incur immediate and substantial dilution in the amount of $(28.14) per share based upon an assumed initial public offering price of $21.50 per share (the midpoint of the price range listed on the cover page of this prospectus). In addition, you may also experience additional dilution, or potential dilution, upon future equity issuances to investors or to our employees and directors under the Plan and any other equity incentive plans we may adopt. As a result of this dilution, investors purchasing shares of common stock in this offering may receive significantly less than the full purchase price that they paid for the stock purchased in this offering in the event of liquidation. See “Dilution.”
41
Table of Contents
Failure to establish and maintain effective internal controls in accordance with Section 404 of the Sarbanes-Oxley Act could have a material adverse effect on our business and stock price.
We are not currently required to comply with the rules of the U.S. Securities and Exchange Commission, or the SEC, implementing Section 404 of the Sarbanes-Oxley Act of 2002, or the Sarbanes-Oxley Act, and are therefore not required to make a formal assessment of the effectiveness of our internal control over financial reporting for that purpose. Upon becoming a public company, we will be required to comply with the SEC’s rules implementing Sections 302 and 404 of the Sarbanes-Oxley Act, which will require management to certify financial and other information in our quarterly and annual reports and provide an annual management report on the effectiveness of controls over financial reporting. Though we will be required to disclose changes made in our internal controls and procedures on a quarterly basis, we will not be required to make our first annual assessment of our internal control over financial reporting pursuant to Section 404 until the year following our first annual report required to be filed with the SEC. Additionally, as an emerging growth company, our independent registered public accounting firm will not be required to formally attest to the effectiveness of our internal control over financial reporting pursuant to Section 404 until the later of the year following our first annual report required to be filed with the SEC or the date we are no longer an emerging growth company. At such time, our independent registered public accounting firm may issue a report that is adverse in the event it is not satisfied with the level at which our controls are documented, designed or operating.
To comply with the requirements of being a public company, we have undertaken various actions, and may need to take additional actions, such as implementing new internal controls and procedures and hiring additional accounting or internal audit staff. Testing and maintaining internal control can divert our management’s attention from other matters that are important to the operation of our business. Additionally, when evaluating our internal control over financial reporting, we may identify material weaknesses that we may not be able to remediate in time to meet the applicable deadline imposed upon us for compliance with the requirements of Section 404. If we are unable to comply with the requirements of Section 404 in a timely manner or assert that our internal control over financial reporting is effective, or if our independent registered public accounting firm is unable to express an opinion as to the effectiveness of our internal control over financial reporting once we are no longer an emerging growth company, investors may lose confidence in the accuracy and completeness of our financial reports and the market price of our common stock could be negatively affected, and we could become subject to investigations by the stock exchange on which our securities are listed, the SEC or other regulatory authorities, which could require additional financial and management resources.
We will incur significant costs as a result of operating as a public company, and our management will devote substantial time to new compliance initiatives.
As a privately-held company, we were not required to comply with certain corporate governance and financial reporting practices and policies required of a publicly traded company. As a publicly traded company, we will incur significant legal, accounting and other expenses that we were not required to incur in the recent past, particularly after we are no longer an “emerging growth company” as defined under the JOBS Act. In addition, compliance with new and changing laws, regulations and standards relating to corporate governance and public disclosure, including the Dodd-Frank Wall Street Reform and Customer Protection Act, or the Dodd-Frank Act, and the rules and regulations promulgated and to be promulgated thereunder, as well as under the Sarbanes-Oxley Act, and the rules and regulations of the SEC, will increase our legal and financial compliance costs and make some activities more difficult, time-consuming or costly. For example, the Exchange Act will require us, among other things, to file annual, quarterly and current reports with respect to our business and operating results. We also expect that being a public company and being subject to new rules and regulations will make it more expensive for us to obtain director and officer liability insurance, and we may be required to accept reduced coverage or incur substantially higher costs to obtain coverage. As such, we expect to incur additional annual expenses of $3.0 million to $4.0 million related to operating as a public company. These factors may therefore strain our resources, divert management’s attention, and affect our ability to attract and retain qualified members of our Board and adversely affect our operating margins.
Furthermore, the need to establish the corporate infrastructure demanded of a public company may divert management’s attention from implementing our growth strategy, which could prevent us from improving our business, results of operations and financial condition. We have made, and will continue to make, changes to our internal controls and procedures for financial reporting and accounting systems to meet our reporting obligations as a publicly traded company. However, the measures we take may not be sufficient to satisfy our obligations as a publicly traded company.
42
Table of Contents
There is no existing market for our common stock, and we do not know if one will develop to provide you with liquidity.
Prior to this offering, there has not been a public market for our common stock. An active market for our common stock might not develop following the consummation of this offering, or if it does develop, might not be maintained. If an active trading market does not develop, you may have difficulty selling any of our common stock that you buy. The initial public offering price for the shares of our common stock will be determined by negotiations between us and the representatives of the underwriters and might not be indicative of prices that will prevail in the open market following this offering. Consequently, you might not be able to sell shares of our common stock at prices equal to or greater than the initial public offering price.
Our Chief Executive Officer and founder, Dr. August J. Troendle, has indicated an interest to purchase up to $20.0 million in shares of our common stock in this offering at the initial public offering price. To the extent Dr. Troendle is allocated and purchases shares in this offering, such a purchase may reduce the available public float for our shares because Dr. Troendle will be restricted from selling the shares by restrictions under applicable securities laws and contractual agreements described in “Shares Eligible for Future Sale.” As a result, the liquidity of our common stock could be significantly reduced from what it would have been if these shares had been purchased by investors that were not affiliated with us.
Our operating results and share price may be volatile, and the market price of our common stock after this offering may drop below the price you pay.
Our quarterly operating results have fluctuated, and are likely to fluctuate in the future as a publicly traded company. In addition, securities markets worldwide have experienced, and are likely to continue to experience, significant price and volume fluctuations. This market volatility, as well as general economic, market or political conditions, could subject the market price of shares of our common stock to wide price fluctuations regardless of our operating performance. We and the underwriters will negotiate to determine the initial public offering price. You may not be able to resell your shares at or above the initial public offering price, or at all. Our operating results and the trading price of shares of our common stock may fluctuate in response to various factors, including:
| n | market conditions in the broader stock market or in the healthcare sector; |
| n | developments affecting biopharmaceutical companies generally or biopharmaceutical research and development outsourcing; |
| n | actual or anticipated fluctuations in our quarterly financial and operating results; |
| n | introduction of new products or services by us or our competitors; |
| n | the public’s reaction to our press releases, our other public announcements and our filings with the SEC; |
| n | changes in, or failure to meet, earnings estimates or recommendations by research analysts who track our common stock or the stock of other companies in our industries; |
| n | strategic actions by us, our customers or our competitors, such as acquisitions or restructurings; |
| n | changes in accounting standards, policies, guidance, interpretations or principles; |
| n | issuance of new or changed securities analysts’ reports or recommendations or termination of coverage of our common stock by securities analysts; |
| n | sales, or anticipated sales, of large blocks of our stock; |
| n | the granting or exercise of employee stock options; |
| n | volume of trading in our common stock; |
| n | additions or departures of key personnel; |
| n | regulatory or political developments; |
| n | litigation and governmental investigations; |
| n | changing economic conditions; |
| n | defaults on our indebtedness; |
| n | exchange rate fluctuations; and |
| n | the other factors listed in this “Risk Factors” section. |
43
Table of Contents
These and other factors, many of which are beyond our control, may cause our operating results and the market price and demand for shares of our common stock to fluctuate substantially. While we believe that operating results for any particular quarter are not necessarily a meaningful indication of future results, fluctuations in our quarterly operating results could limit or prevent investors from readily selling their shares and may otherwise negatively affect the market price and liquidity of shares of our common stock. In addition, in the past, when the market price of a stock has been volatile, holders of that stock have sometimes instituted securities class action litigation against the company that issued the stock. If any of our shareholders brought a lawsuit against us, we could incur substantial costs defending the lawsuit. Such a lawsuit could also divert the time and attention of our management from our business, which could have a material adverse effect on our business, financial condition, results of operations and cash flows.
A significant portion of our total outstanding shares are restricted from immediate resale but may be sold into the market in the near future. This could cause the market price of our common stock to drop significantly, even if our business is doing well.
Sales of a substantial number of shares of our common stock in the public market could occur at any time. After this offering, we will have 39,642,113 shares of outstanding common stock (or 40,692,113 if the underwriters exercise their option to purchase additional shares in full). In addition, under the Plan, we intend to grant to certain of our employees and non-employee directors in connection with this offering awards of stock options at an exercise price equal to the initial public offering price of our common stock with respect to an aggregate of up to 685,310 shares of common stock immediately following the completion of this offering. We have not yet determined the allocation of such awards of stock options among the individuals, except for the executive officers and certain non-employee directors. See “Executive and Director Compensation—Narrative to Summary Compensation Table—Offering Grants to Employees under the 2016 Incentive Award Plan” and “Executive and Director Compensation—Director Compensation.” The shares of common stock sold in this offering or issuable pursuant to the equity awards we grant will be freely tradable without restriction under the Securities Act, except as described in the next paragraph with respect to the lock-up arrangements and for any shares of our common stock that may be held or acquired by our directors, executive officers and other affiliates, as that term is defined in the Securities Act, which will be restricted securities under the Securities Act. Restricted securities may not be sold in the public market unless the sale is registered under the Securities Act or an exemption from registration is available.
We and each of our directors, executive officers and holders of substantially all of our outstanding common stock have agreed with the underwriters, subject to certain exceptions, not to sell or otherwise dispose of any shares of our common stock or other capital stock or other securities exercisable or convertible therefor for a period of at least 180 days after the date of this prospectus without the prior written consent of Jefferies LLC. See “Underwriting” and “Shares Eligible for Future Sale—Lock-Up Agreements.” All of the shares of our common stock outstanding as of the date of this prospectus may be sold in the public market by existing shareholders following the expiration of the applicable lock-up period, subject to applicable limitations imposed under federal securities laws.
We also intend to enter into a Registration Rights Agreement pursuant to which the shares of common stock held by Cinven and Dr. August J. Troendle, our Chief Executive Officer and founder, will be eligible for resale, subject to certain limitations set forth therein. See “Certain Relationships and Related Person Transactions—Registration Rights Agreement.”
We intend to file one or more registration statements on Form S-8 under the Securities Act to register all shares of common stock issued or issuable under the Plan. Any such Form S-8 registration statements will automatically become effective upon filing. Accordingly, shares registered under such registration statements will be available for sale in the open market following the expiration of the applicable lock-up period. We expect that the initial registration statement on Form S-8 will cover 6,000,000 shares of our common stock.
See “Shares Eligible for Future Sale” for a more detailed description of the restrictions on selling shares of our common stock after this offering.
In the future, we may also issue additional securities if we need to raise capital or make acquisitions, which could constitute a material portion of our then-outstanding shares of common stock.
44
Table of Contents
Because we have no current plans to pay regular cash dividends on our common stock following this offering, you may not receive any return on investment unless you sell your common stock for a price greater than that which you paid for it.
We do not anticipate paying any regular cash dividends on our common stock for the foreseeable future. Any decision to declare and pay dividends in the future will be made at the discretion of our Board and will depend on, among other things, our results of operations, financial condition, cash requirements, contractual restrictions and other factors that our Board may deem relevant. In addition, our ability to pay dividends is, and may continue to be, limited by covenants of existing and any future outstanding indebtedness we or our subsidiaries incur, including under our existing Senior Secured Credit Facilities. Therefore, any return on investment in our common stock is solely dependent upon the appreciation of the price of our common stock on the open market, which may not occur. See “Dividend Policy” for more detail.
We are a holding company and rely on dividends and other payments, advances and transfers of funds from our subsidiaries to meet our obligations and pay any dividends.
We have no direct operations and no significant assets other than ownership of 100% of the capital stock of our subsidiaries. Because we conduct our operations through our subsidiaries, we depend on those entities for dividends and other payments to generate the funds necessary to meet our financial obligations, and to pay any dividends with respect to our common stock. Legal and contractual restrictions in our Senior Secured Credit Facilities and other agreements which may govern future indebtedness of our subsidiaries, as well as the financial condition and operating requirements of our subsidiaries, may limit our ability to obtain cash from our subsidiaries. The earnings from, or other available assets of, our subsidiaries might not be sufficient to pay dividends or make distributions or loans to enable us to pay any dividends on our common stock or other obligations. Any of the foregoing could materially and adversely affect our business, financial condition, results of operations and cash flows. See “Dividend Policy.”
If securities or industry analysts do not publish research or reports about our business, if they adversely change their recommendations regarding our common stock or if our results of operations do not meet their expectations, our share price and trading volume could decline.
The trading market for shares of our common stock will be influenced by the research and reports that industry or securities analysts publish about us or our business. We do not have any control over these analysts. If one or more of these analysts cease coverage of our company or fail to publish reports on us regularly, we could lose visibility in the financial markets, which in turn could cause our share price or trading volume to decline. Moreover, if one or more of the analysts who cover us downgrade our stock, or if our results of operations do not meet their expectations, our share price could decline.
We are an “emerging growth company” and as a result of the reduced disclosure and governance requirements applicable to emerging growth companies, our common stock may be less attractive to investors.
The JOBS Act provides that, so long as a company qualifies as an “emerging growth company,” it will, among other things:
| n | be exempt from the provisions of Section 404(b) of the Sarbanes-Oxley Act requiring that its independent registered public accounting firm provide an attestation report on the effectiveness of its internal control over financial reporting; |
| n | be exempt from the “say on pay” and “say on golden parachute” advisory vote requirements of the Dodd-Frank Act; |
| n | be exempt from certain disclosure requirements of the Dodd-Frank Act relating to compensation of its executive officers and be permitted to omit the detailed compensation discussion and analysis from proxy statements and reports filed under the Exchange Act; and |
| n | be exempt from any rules that may be adopted by the Public Company Accounting Oversight Board requiring mandatory audit firm rotations or a supplement to the auditor’s report on the financial statements. |
We currently intend to take advantage of each of the exemptions described above. We have irrevocably elected not to take advantage of the extension of time to comply with new or revised financial accounting standards available under Section 107(b) of the JOBS Act. We could be an emerging growth company for up to five years after this offering. We cannot predict if investors will find our common stock less attractive if we elect to rely on these exemptions, or if taking advantage of these exemptions would result in less active trading or more volatility in the price of our common stock. For additional information about the implications of qualifying as an emerging growth company, see “Prospectus Summary—Implications of Being an Emerging Growth Company.”
45
Table of Contents
CAUTIONARY NOTE REGARDING FORWARD LOOKING STATEMENTS
This prospectus, including the sections entitled “Prospectus Summary,” “Risk Factors,” “Management’s Discussion and Analysis of Financial Condition and Results of Operations,” and “Business,” contains forward looking statements. All statements other than statements of historical facts contained in this prospectus, including statements regarding our future results of operations and financial position, business strategy and plans and our objectives for future operations, are forward looking statements. The words “believe,” “may,” “might,” “will,” “estimate,” “continue,” “anticipate,” “intend,” “seek,” “plan,” “should,” “expect” and similar expressions are intended to identify forward looking statements. Examples of forward looking statements include, but are not limited to, statements we make regarding: (i) growth of (a) the CRO market, (b) biopharmaceutical companies’ development expenditures and (c) the percentage of biopharmaceutical clinical development costs that are outsourced to CROs; (ii) the amount of the expected conversion of our backlog to net service revenue; (iii) high-growth therapeutic areas and (iv) the continuous enhancement of our clinical development services and our therapeutic expertise. Forward looking statements are based largely on our current expectations and projections about future events and financial trends that we believe may affect our financial condition, results of operations, business strategy, short-term and long-term business operations and objectives, and financial needs. These forward looking statements are subject to inherent uncertainties, risks and changes in circumstances that are difficult to predict. Moreover, we operate in a very competitive and rapidly changing environment. New risks emerge from time to time. It is not possible for our management to predict all risks, nor can we assess the impact of all factors on our business or the extent to which any factor, or combination of factors, may cause actual results to differ materially from those contained in any forward looking statements we may make. In light of these risks, uncertainties and assumptions, the forward looking events and circumstances discussed in this prospectus may not occur and actual results could differ materially and adversely from those anticipated or implied in the forward looking statements. We caution you therefore against relying on these forward looking statements.
Some of the key factors that could cause actual results to differ from our expectations include regional, national or global political, economic, business, competitive, market and regulatory conditions and the following:
| n | the potential loss, delay or non-renewal of our contracts, or the non-payment by customers for services we have performed; |
| n | the failure to convert backlog to revenue at our historical conversion rate; |
| n | fluctuation in our results between fiscal quarters and years; |
| n | decreased operating margins due to increased pricing pressure or other pressures; |
| n | failure to perform our services in accordance with contractual requirements, government regulations and ethical considerations; |
| n | the impact of underpricing our contracts, overrunning our cost estimates or failing to receive approval for or experiencing delays with documentation of change orders; |
| n | our failure to successfully execute our growth strategies; |
| n | the impact of a failure to retain key personnel or recruit experienced personnel; |
| n | the risks associated with our information systems infrastructure; |
| n | our failure to manage our growth effectively; |
| n | adverse results from customer or therapeutic area concentration; |
| n | the risks associated with doing business internationally; |
| n | the risks associated with the Foreign Corrupt Practices Act and other anti-corruption laws; |
| n | future net losses; |
| n | the impact of income tax rate fluctuations on operations, earnings and earnings per share; |
| n | the risks associated with our intercompany transfer pricing policies; |
| n | our failure to attract suitable investigators and patients for our clinical trials; |
| n | the liability risks associated with our R&D services; |
| n | the risks related to our Phase I clinical services; |
46
Table of Contents
| n | inadequate insurance coverage for our operations and indemnification obligations; |
| n | fluctuations in exchange rates; |
| n | the risks related to our relationships with existing or potential customers who are in competition with each other; |
| n | our failure to successfully integrate potential future acquisitions; |
| n | potential impairment of goodwill or other intangible assets; |
| n | our limited ability to utilize our net operating loss carryforwards or other tax attributes; |
| n | the risks associated with the use and disposal of hazardous substances and waste; |
| n | the failure of third parties to provide us critical support services; |
| n | our limited ability to protect our intellectual property rights; |
| n | the impact of the United Kingdom’s referendum on withdrawal from the EU; |
| n | the risks associated with potential future investments in our customers’ businesses or drugs; |
| n | the impact of a natural disaster or other catastrophic event; |
| n | negative outsourcing trends in the biopharmaceutical industry and a reduction in aggregate expenditures and R&D budgets; |
| n | our inability to compete effectively with other CROs; |
| n | the impact of healthcare reform; |
| n | the impact of recent consolidation in the biopharmaceutical industry; |
| n | failure to comply with federal, state and foreign healthcare laws; |
| n | the effect of current and proposed laws and regulations regarding the protection of personal data; |
| n | our potential involvement in costly intellectual property lawsuits; |
| n | actions by regulatory authorities or customers to limit the scope of or withdraw an approved drug, biologic or medical device from the market; |
| n | failure to keep pace with rapid technological changes; |
| n | the impact of industry-wide reputational harm to CROs; |
| n | our ability to fulfill our debt obligations; |
| n | the risks associated with incurring additional debt or undertaking additional debt obligations; |
| n | the effect of covenant restrictions under our debt agreements on our ability to operate our business; |
| n | our inability to generate sufficient cash to service all of our indebtedness; |
| n | fluctuations in interest rates; |
| n | our dependence on our lenders, which may not be able to fund borrowings under their credit commitments, and our inability to borrow; and |
| n | the other factors set forth in “Risk Factors.” |
See “Risk Factors” for a further description of these and other factors. The forward looking statements included in this prospectus are made only as of the date hereof. You should not rely upon forward looking statements as predictions of future events. Although we believe that the expectations reflected in the forward looking statements are reasonable, we cannot guarantee that the future results, levels of activity, performance or events and circumstances reflected in the forward looking statements will be achieved or occur. Moreover, neither we nor any other person assumes responsibility for the accuracy and completeness of the forward looking statements. We undertake no obligation to update publicly any forward looking statements for any reason after the date of this prospectus to conform these statements to actual results or to changes in our expectations, except as may be required by law.
You should read this prospectus with the understanding that our actual future results, levels of activity, performance and events and circumstances may be materially different from what we expect.
47
Table of Contents
We estimate that the net proceeds to us from our sale of shares of 7,000,000 our common stock in this offering will be approximately $138.3 million, assuming an initial public offering price of $21.50 per share (the midpoint of the price range listed on the cover page of this prospectus), and after deducting $12.2 million of estimated underwriting discounts and commissions and estimated expenses payable by us in connection with this offering. The underwriters may also purchase up to a maximum of 1,050,000 additional shares of common stock from us pursuant to their option to purchase additional shares. We estimate that the net proceeds to us, if the underwriters exercise their right to purchase the maximum of 1,050,000 additional shares of common stock from us, will be approximately $159.5 million, assuming an initial public offering price of $21.50 per share (the midpoint of the price range listed on the cover page of this prospectus), and after deducting underwriting estimated discounts and commissions and estimated expenses payable by us in connection with this offering.
We intend to use the net proceeds of this offering to repay $138.3 million in aggregate principal amount of outstanding borrowings under our Senior Secured Term Loan Facility.
The Senior Secured Term Loan Facility had $364.0 million outstanding (net of an unamortized discount of $1.8 million and unamortized debt issuance costs of $9.2 million) as of June 30, 2016 with a maturity date of April 1, 2021. Borrowings under the Senior Secured Term Loan Facility bear interest at a rate equal to, at our option, either (a) a Eurocurrency rate based on LIBOR for U.S. dollar deposits for loans denominated in dollars, EURIBOR for Euro deposits for loans denominated in Euros and the offer rate for any other currencies for loans denominated in such other currencies for the relevant interest period, plus 4.00% per annum if our total net leverage ratio is greater than 4.75:1.00, or 3.75% if our total net leverage ratio is less than or equal to 4.75:1:00; provided that the relevant Eurocurrency rate shall be deemed to be no less than 1.00% per annum; or (b) a base rate, which is defined as the highest of (i) the Federal Funds Rate on such day plus 1⁄2 of 1.00%, (ii) the Prime Lending Rate on such day, (iii) the Adjusted Eurocurrency Rate for Loans denominated in U.S. dollars published on such day for an Interest Period of one month plus 1.00% and (iv) 2.00%, plus 3.00% per annum if our total net leverage ratio is greater than 4.75:1.00, or 2.75% if our total net leverage ratio is less than or equal to 4.75:1:00; provided that the base rate shall be deemed to be no less than 2.00% per annum. We may voluntarily prepay outstanding loans under the Senior Secured Term Loan Facility without premium or penalty. As of June 30, 2016, the interest applicable on the Senior Secured Term Loan Facility was the Eurocurrency minimum floor interest rate of 4.75%. See “Management’s Discussion and Analysis of Financial Condition and Results of Operations—Liquidity and Capital Resources—Indebtedness.”
If the underwriters exercise their option to purchase additional shares from us in full, we estimate that we will receive additional net proceeds of $21.2 million, which we intend to use to repay additional borrowings outstanding under our Senior Secured Term Loan Facility.
Assuming no exercise of the underwriters’ option to purchase additional shares, a $1.00 increase (decrease) in the assumed initial public offering price of $21.50 per share (the midpoint of the price range listed on the cover page of this prospectus) would increase (decrease) the net proceeds to us from this offering by $6.6 million, assuming the number of shares offered by us, as set forth on the cover page of this prospectus, remains the same, and after deducting estimated underwriting discounts and commissions and estimated expenses payable by us in connection with this offering. We may also increase or decrease the number of shares we are offering. Each increase (decrease) of 1,000,000 shares in the number of shares of common stock offered by us would increase (decrease) the net proceeds to us from this offering by $20.2 million, assuming an initial public offering price of $21.50 per share (the midpoint of the price range listed on the cover page of this prospectus), and after deducting estimated underwriting discounts and commissions and estimated expenses payable by us in connection with this offering.
48
Table of Contents
We have no current plans to pay any cash dividends on our common stock for the foreseeable future and instead intend to retain earnings, if any, for future operations, expansion and debt repayment. However, in the future, subject to the factors described below and our future liquidity and capitalization, we may change this policy and choose to pay dividends.
We are a holding company which does not conduct any business operations of our own. As a result, our ability to pay cash dividends on our common stock is dependent upon cash dividends and distributions and other transfers from our subsidiaries. The ability of our subsidiaries to pay dividends is currently restricted by the terms of our Senior Secured Credit Facilities and may be further restricted by any future indebtedness we or they incur.
In addition, under Delaware law, our Board may declare dividends only to the extent of our surplus (which is defined as total assets at fair market value minus total liabilities, minus statutory capital) or, if there is no surplus, out of our net profits for the then current and/or immediately preceding fiscal year.
Any future determination to declare dividends will be at the discretion of our Board and will take into account:
| n | restrictions in our debt instruments, including our Senior Secured Credit Facilities; |
| n | general economic business conditions; |
| n | our net income, financial condition and results of operations; |
| n | our capital requirements; |
| n | our prospects; |
| n | the ability of our operating subsidiaries to pay dividends and make distributions to us; |
| n | legal restrictions; and |
| n | such other factors as our Board may deem relevant. |
See “Management’s Discussion and Analysis of Financial Condition and Results of Operations—Liquidity and Capital Resources—Indebtedness” for restrictions on our ability to pay dividends.
49
Table of Contents
The following table sets forth our cash and cash equivalents and our capitalization, as of June 30, 2016:
| n | on an actual basis; and |
| n | on an as adjusted basis to give effect to our issuance and sale of 7,000,000 shares of our common stock in this offering at the initial public offering price of $21.50 per share (the midpoint of the price range listed on the cover page of this prospectus), after deducting estimated underwriting discounts and commissions and estimated expenses payable by us in connection with this offering and the application of the net proceeds to be received by us from this offering as described under “Use of Proceeds.” |
You should read this information together with our audited consolidated financial statements and related notes included elsewhere in this prospectus and the information set forth under the headings ‘‘Use of Proceeds,’’ ‘‘Selected Historical Consolidated Financial and Other Data’’ and ‘‘Management’s Discussion and Analysis of Financial Condition and Results of Operations.’’
| AS OF JUNE 30, 2016 | ||||||||
| (In thousands, except share amounts) | ACTUAL | AS ADJUSTED(3) | ||||||
| Cash and cash equivalents |
$ | 13,674 | $ | 13,674 | ||||
|
|
|
|
|
|||||
| Debt: |
||||||||
| Senior Secured Term Loan Facility (1) |
364,033 | 225,744 | ||||||
| Senior Secured Revolving Credit Facility (2) |
— | — | ||||||
|
|
|
|
|
|||||
| Total long-term debt, net |
364,033 | 225,744 | ||||||
|
|
|
|
|
|||||
| Shareholders’ equity: |
||||||||
| Common stock, par value $0.01 per share; 60,000,000 shares authorized, 32,642,113 shares issued and outstanding, actual; 250,000,000 shares authorized and 39,642,113 shares issued and outstanding, as adjusted |
326 | 396 | ||||||
| Additional paid-in-capital |
439,460 | 575,818 | ||||||
| Accumulated deficit |
(14,599 | ) | (14,599 | ) | ||||
| Accumulated other comprehensive loss |
(2,551 | ) | (2,551 | ) | ||||
|
|
|
|
|
|||||
| Total shareholders’ equity |
422,636 | 559,064 | ||||||
|
|
|
|
|
|||||
| Total capitalization |
$ | 786,669 | 784,808 | |||||
|
|
|
|
|
|||||
| (1) | This amount is presented net of an unamortized discount of $1.8 million and unamortized debt issuance costs of $9.2 million. |
| (2) | As of June 30, 2016, the Senior Secured Credit Facilities provided for a $60.0 million Senior Secured Revolving Credit Facility, under which we had no borrowings outstanding and $60.0 million of available borrowings. |
| (3) | Assuming no exercise of the underwriters’ option to purchase additional shares, a $1.00 increase (decrease) in the assumed initial public offering price of $21.50 per share (the midpoint of the price range listed on the cover page of this prospectus) would increase (decrease) the as adjusted amount of the Senior Secured Term Loan Facility, additional paid-in capital and total shareholders’ equity by $6.6 million, assuming the number of shares offered by us, as set forth on the cover page of this prospectus, remains the same. Each increase (decrease) of 1,000,000 shares in the number of shares of common stock offered by us would increase (decrease) the as adjusted amount of the Senior Secured Term Loan Facility, additional paid-in capital and total shareholders’ equity by $20.2 million, assuming an initial public offering price of $21.50 per share (the midpoint of the price range listed on the cover page of this prospectus). |
50
Table of Contents
If you invest in our common stock in this offering, your interest will be diluted to the extent of the difference between the initial public offering price per share of our common stock and the net tangible book value per share of our common stock after this offering. Net tangible book value per share represents our total tangible assets less our total liabilities, divided by the total number of shares of common stock deemed to be outstanding at that date. Our net tangible book value (deficit) as of June 30, 2016 was $(399.8) million, or $(12.25) per share of our common stock.
After giving effect to the sale of 7,000,000 shares of common stock in this offering at the assumed initial public offering price of $21.50 per share (the midpoint of the price range listed on the cover page of this prospectus) and the application of the net proceeds from this offering, our as adjusted net tangible book value (deficit) as of June 30, 2016 would have been $(263.3) million, or $(6.64) per share of our common stock. This represents an immediate increase in net tangible book value (deficit) of $5.61 per share to our existing investors and an immediate dilution in net tangible book value (deficit) of $(28.14) per share to new investors.
The following table illustrates this dilution on a per share of common stock basis:
| Assumed initial public offering price per share of common stock |
$ | 21.50 | ||||||
| Net tangible book value (deficit) per share as of June 30, 2016 before this offering |
$ | (12.25 | ) | |||||
| Increase in net tangible book value (deficit) per share attributable to new investors |
5.61 | |||||||
|
|
|
|||||||
| As adjusted net tangible book value (deficit) per share after this offering |
(6.64 | ) | ||||||
|
|
|
|||||||
| Dilution in net tangible book value (deficit) per share to new investors |
$ | (28.14 | ) | |||||
|
|
|
A $1.00 increase (decrease) in the assumed initial public offering price of $21.50 per share (the midpoint of the price range listed on the cover page of this prospectus) would increase (decrease) the as adjusted net tangible book value (deficit) per share after this offering by approximately $0.17, and dilution in net tangible book value (deficit) per share to new investors by approximately $(0.17), assuming that the number of shares offered by us, as set forth on the cover page of this prospectus, remains the same and after deducting estimated underwriting discounts and commissions and estimated expenses payable by us in connection with this offering.
If the underwriters exercise their option to purchase additional shares of our common stock in full in this offering, the as adjusted net tangible book value (deficit) after the offering would be $(5.95) per share, the increase in net tangible book value (deficit) per share to existing shareholders would be $6.30 and the dilution in net tangible book value (deficit) per share to new investors would be $(27.45) per share, in each case assuming an initial public offering price of $21.50 per share (the midpoint of the price range listed on the cover page of this prospectus).
The following table summarizes as of June 30, 2016, on an as adjusted basis after giving effect to this offering, the total number of shares of common stock purchased from us, the total cash consideration paid to us, or to be paid, and the average price per share paid, or to be paid, by our existing investors and by new investors purchasing shares in this offering, at the assumed initial public offering price of $21.50 per share (the midpoint of the price range listed on the cover page of this prospectus) before deducting the estimated underwriting discounts and commissions and estimated expenses payable by us in connection with this offering:
| SHARES PURCHASED |
TOTAL CONSIDERATION |
AVERAGE PRICE PER SHARE |
||||||||||||||||||
| NUMBER | PERCENT | AMOUNT | PERCENT | |||||||||||||||||
| Existing shareholders |
32,642,113 | 82.3 | % | $ | 414,960,028 | 73.4 | % | $ | 12.71 | |||||||||||
| New investors |
7,000,000 | 17.7 | % | $ | 150,500,000 | 26.6 | % | $ | 21.50 | |||||||||||
|
|
|
|
|
|
|
|
|
|
|
|||||||||||
| Total |
39,642,113 | 100 | % | $ | 565,460,028 | 100 | % | $ | 14.26 | |||||||||||
|
|
|
|
|
|
|
|
|
|
|
|||||||||||
51
Table of Contents
A $1.00 increase (decrease) in the assumed initial public offering price of $21.50 per share (the midpoint of the price range listed on the cover page of this prospectus) would increase (decrease) the total consideration paid by new investors and the total consideration paid by all shareholders by $7.0 million, assuming the number of shares offered by us remains the same and before deducting the estimated underwriting discounts and commissions and estimated expenses payable by us in connection with this offering.
If the underwriters were to fully exercise their option to purchase 1,050,000 additional shares of our common stock, the percentage of shares of our common stock held by existing investors would be 80.2%, and the percentage of shares of our common stock held by new investors would be 19.8%.
The above discussion and tables are based on the number of shares outstanding as of June 30, 2016 and excludes:
| n | 1,779,637 shares of common stock issuable upon exercise of stock options outstanding as of June 30, 2016 at a weighted average exercise price of $15.48 per share; and |
| n | an additional 6,000,000 shares of common stock reserved for future issuance under the Plan, including pursuant to equity awards to be granted in connection with this offering, as described in “Executive and Director Compensation—Narrative to Summary Compensation Table—Offering Grants to Employees under the 2016 Incentive Award Plan.” |
In addition, we may choose to raise additional capital due to market conditions or strategic considerations even if we believe we have sufficient funds for our current or future operating plans. To the extent that additional capital is raised through the sale of equity or convertible debt securities, the issuance of such securities could result in further dilution to our shareholders. See “Risk Factors—Risks Relating to Our Common Stock and this Offering—If you purchase shares of common stock sold in this offering, you will incur immediate and substantial dilution.”
Our Chief Executive Officer and founder, Dr. August J. Troendle, has indicated an interest to purchase up to $20.0 million in shares of our common stock in this offering at the initial public offering price. However, because indications of interest are not binding agreements or commitments to purchase, this existing shareholder may determine to increase or reduce the amount of his indication of interest, or otherwise elect not to purchase any shares. It is also possible that the number of shares, if any, allocated to this shareholder in the offering may be smaller than the amount of his indication of interest. Any allocation of shares in the offering to this existing shareholder will be made at our direction.
52
Table of Contents
SELECTED HISTORICAL CONSOLIDATED FINANCIAL AND OTHER DATA
The following tables set forth our selected consolidated historical financial and other data for the periods ending on and as of the dates indicated. We derived the consolidated statements of operations data for the years ended December 31, 2013 (Predecessor) and December 31, 2015 (Successor) and the consolidated balance sheet data as of December 31, 2014 and December 31, 2015 from our audited consolidated financial statements and the related notes thereto included elsewhere in this prospectus. We derived the consolidated statements of operations data for the Predecessor three month period ended March 31, 2014 and the Successor nine month period ended December 31, 2014 from our audited consolidated financial statements and the related notes thereto included elsewhere in this prospectus. We derived the condensed consolidated statements of operations data for the Successor six months ended June 30, 2015 and June 30, 2016 and the condensed consolidated balance sheet data as of June 30, 2016 from our unaudited condensed consolidated financial statements included elsewhere in this prospectus. We have prepared the unaudited condensed consolidated financial information set forth below on the same basis as our audited consolidated financial statements and have included all adjustments, consisting of only normal recurring adjustments, that we consider necessary for a fair presentation of our financial position and operating results for such periods.
The accompanying consolidated statements of operations, cash flows and shareholders’ equity are presented for two periods, Predecessor and Successor, which relate to the period preceding the Transaction and the period succeeding the Transaction, respectively. The Company refers to the operations of Medpace Holdings, Inc. and subsidiaries for both the Predecessor period and Successor period.
The results for any interim period are not necessarily indicative of the results that may be expected for a full year. Additionally, our historical results are not necessarily indicative of future results. You should read the information set forth below together with “Management’s Discussion and Analysis of Financial Condition and Results of Operations,” “Capitalization” and our consolidated financial statements and the related notes thereto included elsewhere in this prospectus.
| SUCCESSOR | PREDECESSOR | |||||||||||||||||||||||
| (In thousands, except per share data) |
SIX MONTHS ENDED JUNE 30, 2016 |
SIX MONTHS ENDED JUNE 30, 2015 |
YEAR ENDED DECEMBER 31, 2015 |
NINE MONTH PERIOD FROM APRIL 1, 2014 THROUGH DECEMBER 31, 2014 |
THREE MONTH PERIOD FROM JANUARY 1, 2014 THROUGH MARCH 31, 2014 |
YEAR ENDED DECEMBER 31, 2013 |
||||||||||||||||||
| Consolidated Statements of Operations Data: |
||||||||||||||||||||||||
| Service revenue, net |
$ | 180,433 | $ | 152,782 | $ | 320,101 | $ | 219,791 | $ | 70,250 | $ | 244,270 | ||||||||||||
| Reimbursed out-of-pocket revenue |
25,107 | 18,105 | 38,958 | 28,708 | 7,679 | 28,620 | ||||||||||||||||||
|
|
|
|
|
|
|
|
|
|
|
|
|
|||||||||||||
| Total revenue |
205,540 | 170,887 | 359,059 | 248,499 | 77,929 | 272,890 | ||||||||||||||||||
| Operating expenses: |
||||||||||||||||||||||||
| Direct costs, excluding depreciation and amortization |
96,215 | 77,725 | 163,707 | 117,550 | 38,759 | 119,779 | ||||||||||||||||||
| Reimbursed out-of-pocket expenses |
25,107 | 18,105 | 38,958 | 28,708 | 7,679 | 28,620 | ||||||||||||||||||
| Selling, general and administrative |
28,333 | 23,448 | 56,998 | 29,465 | 10,203 | 35,109 | ||||||||||||||||||
| Acquisition and integration |
— | — | — | 9,297 | 12,420 | — | ||||||||||||||||||
| Impairment of goodwill |
— | — | 9,313 | — | — | — | ||||||||||||||||||
| Depreciation |
3,566 | 3,110 | 6,379 | 4,610 | 1,832 | 6,665 | ||||||||||||||||||
| Amortization |
25,336 | 34,243 | 63,142 | 56,422 | 5,199 | 23,854 | ||||||||||||||||||
|
|
|
|
|
|
|
|
|
|
|
|
|
|||||||||||||
| Total operating expenses |
178,557 | 156,631 | 338,497 | 246,052 | 76,092 | 214,027 | ||||||||||||||||||
| Income from operations |
26,983 | 14,256 | 20,562 | 2,447 | 1,837 | 58,863 | ||||||||||||||||||
| Other (expense) income, net: |
||||||||||||||||||||||||
| Miscellaneous (expense) income, net |
(941 | ) | (978 | ) | (1,133 | ) | (301 | ) | 1,213 | (1,718 | ) | |||||||||||||
| Interest expense, net |
(11,894 | ) | (13,975 | ) | (27,259 | ) | (23,185 | ) | (3,272 | ) | (18,000 | ) | ||||||||||||
|
|
|
|
|
|
|
|
|
|
|
|
|
|||||||||||||
| Total other expense, net |
(12,835 | ) | (14,953 | ) | (28,392 | ) | (23,486 | ) | (2,059 | ) | (19,718 | ) | ||||||||||||
|
|
|
|
|
|
|
|
|
|
|
|
|
|||||||||||||
| Income (loss) before income taxes |
14,148 | (697 | ) | (7,830 | ) | (21,039 | ) | (222 | ) | 39,145 | ||||||||||||||
| Income tax provision (benefit) |
5,738 | (733 | ) | 843 | (6,703 | ) | 1,014 | 14,301 | ||||||||||||||||
|
|
|
|
|
|
|
|
|
|
|
|
|
|||||||||||||
| Net income (loss) |
$ | 8,410 | $ | 36 | $ | (8,673 | ) | $ | (14,336 | ) | $ | (1,236 | ) | $ | 24,844 | |||||||||
|
|
|
|
|
|
|
|
|
|
|
|
|
|||||||||||||
53
Table of Contents
| SUCCESSOR | PREDECESSOR | |||||||||||||||||||||||
| (In thousands, except per share data) |
SIX MONTHS ENDED JUNE 30, 2016 |
SIX MONTHS ENDED JUNE 30, 2015 |
YEAR ENDED DECEMBER 31, 2015 |
NINE MONTH PERIOD FROM APRIL 1, 2014 THROUGH DECEMBER 31, 2014 |
THREE MONTH PERIOD FROM JANUARY 1, 2014 THROUGH MARCH 31, 2014 |
YEAR ENDED DECEMBER 31, 2013 |
||||||||||||||||||
| Net income (loss) per share attributable to common shareholders: |
||||||||||||||||||||||||
| Basic |
$ | 0.26 | $ | 0.00 | $ | (0.28 | ) | $ | (0.46 | ) | $ | (0.05 | ) | $ | 0.99 | |||||||||
| Diluted |
$ | 0.26 | $ | 0.00 | $ | (0.28 | ) | $ | (0.46 | ) | $ | (0.05 | ) | $ | 0.95 | |||||||||
| Weighted average common shares outstanding: |
||||||||||||||||||||||||
| Basic |
32,631 | 31,527 | 31,346 | 30,869 | 25,047 | 25,204 | ||||||||||||||||||
| Diluted |
32,631 | 31,591 | 31,346 | 30,869 | 25,047 | 26,150 | ||||||||||||||||||
| Cash Flow Data: |
||||||||||||||||||||||||
| Net cash provided by operating activities |
$ | 19,982 | $ | 26,271 | $ | 84,117 | $ | 62,539 | $ | 12,807 | $ | 98,142 | ||||||||||||
| Net cash used in investing activities |
(5,653 | ) | (2,658 | ) | (6,432 | ) | (907,640 | ) | (827 | ) | (4,472 | ) | ||||||||||||
| Net cash (used in) provided by financing activities |
(15,678 | ) | (65,702 | ) | (116,489 | ) | 900,171 | (17,968 | ) | (95,851 | ) | |||||||||||||
| SUCCESSOR | PREDECESSOR | |||||||||||||||||||||||
| (In thousands) | SIX MONTHS ENDED JUNE 30, 2016 |
SIX MONTHS ENDED JUNE 30, 2015 |
YEAR ENDED DECEMBER 31, 2015 |
NINE MONTH PERIOD FROM APRIL 1, 2014 THROUGH DECEMBER 31, 2014 |
THREE MONTH PERIOD FROM JANUARY 1, 2014 THROUGH MARCH 31, 2014 |
YEAR ENDED DECEMBER 31, 2013 |
||||||||||||||||||
| Other Financial Data: |
||||||||||||||||||||||||
| EBITDA (1) |
$ | 54,944 | $ | 50,631 | $ | 88,950 | $ | 63,178 | $ | 10,081 | $ | 87,664 | ||||||||||||
| Adjusted EBITDA (1) |
56,427 | 48,385 | 101,216 | 70,450 | 21,710 | 85,409 | ||||||||||||||||||
| Adjusted net income (1) |
26,271 | 21,147 | 40,445 | 26,685 | 9,715 | 41,407 | ||||||||||||||||||
| Free Cash Flow (1) |
13,545 | 23,030 | 76,360 | 57,030 | 11,552 | 93,581 | ||||||||||||||||||
| Backlog (at period end) (2) |
465,738 | 400,627 | 429,659 | 394,023 | 386,047 | 359,341 | ||||||||||||||||||
| Net new business awards (3) |
218,113 | 162,638 | 359,538 | 231,918 | 97,220 | 291,577 | ||||||||||||||||||
| (In thousands) | AS OF JUNE 30, 2016 |
AS OF DECEMBER 31, 2015 |
AS OF DECEMBER 31, 2014 |
|||||||||
| Consolidated Balance Sheet Data |
||||||||||||
| Cash and cash equivalents |
$ | 13,674 | $ | 14,880 | $ | 54,285 | ||||||
| Restricted cash |
3,366 | 2,857 | 1,104 | |||||||||
| Accounts receivable and unbilled, net |
90,048 | 65,088 | 65,248 | |||||||||
| Working capital |
(22,260 | ) | (39,296 | ) | (319 | ) | ||||||
| Total assets |
994,863 | 984,041 | 1,096,912 | |||||||||
| Total long-term debt, net |
364,033 | 377,882 | 491,518 | |||||||||
| Total liabilities |
572,227 | 570,567 | 694,942 | |||||||||
| Total shareholders’ equity |
422,636 | 413,474 | 401,970 | |||||||||
| Total liabilities and shareholders’ equity |
994,863 | 984,041 | 1,096,912 | |||||||||
| (1) | We prepare our financial statements in conformity with U.S. GAAP. To supplement this information, we also use the following non-GAAP financial measures in this prospectus: EBITDA, Adjusted EBITDA, Adjusted Net Income and Free Cash Flow. EBITDA, Adjusted EBITDA, Adjusted Net Income and Free Cash Flow are measures used by management to assess operating performance. EBITDA, Adjusted EBITDA, Adjusted Net Income and Free Cash Flow are not presented in accordance with U.S. GAAP, are not measures of financial condition or profitability and should not be considered as an alternative to net income (loss) determined in accordance with U.S. GAAP or net cash provided by operating activities determined in accordance with U.S. GAAP, as applicable, or any other performance measure derived in accordance with U.S. GAAP and should not be construed as an inference that our future results will be unaffected by unusual non-recurring items. Management uses EBITDA, Adjusted EBITDA, Adjusted Net Income and Free Cash Flow or comparable metrics: |
| n | as a measurement used in evaluating our operating performance on a consistent basis; |
54
Table of Contents
| n | as a consideration to assess incentive compensation for our employees; |
| n | for planning purposes, including the preparation of our internal annual operating budget; and |
| n | to evaluate the performance and effectiveness of our operational strategies. |
We believe that the inclusion of EBITDA and Adjusted EBITDA in this prospectus is useful to provide additional information to investors about certain material non-cash and non-recurring items. While we believe these financial measures are commonly used by investors to evaluate our performance and that of our competitors, because not all companies use identical calculations, this presentation of EBITDA and Adjusted EBITDA may not be comparable to other similarly titled measures of other companies and should not be considered as an alternative to performance measures derived in accordance with U.S. GAAP. EBITDA is calculated as net income (loss) attributable to Medpace Holdings, Inc. before income tax expense, interest expense, net, depreciation and amortization with Adjusted EBITDA being further adjusted for unusual and other items reflected in the reconciliation table below. Our presentation of Adjusted EBITDA should not be construed as an inference that our future results will be unaffected by usual or non-recurring items.
EBITDA and Adjusted EBITDA have important limitations as analytical tools and you should not consider them in isolation, or as a substitute for, analysis of our results as reported under U.S. GAAP. Some of these limitations are:
| n | they do not reflect our interest expense, or the cash requirements necessary to service interest or principal payments, on our debt; |
| n | they do not reflect our cash expenditures, or future requirements for capital expenditures or contractual commitments; |
| n | they do not reflect changes in, or cash requirements for, our working capital needs; |
| n | although depreciation and amortization are non-cash charges, the assets being depreciated and amortized will often have to be replaced in the future, and EBITDA and Adjusted EBITDA do not reflect the cash requirements for such replacements; |
| n | they do not reflect our income tax expense or the cash requirements to pay our taxes; |
| n | Adjusted EBITDA does not reflect the non-cash component of certain stock based awards related to fair value adjustments and unusual non-recurring stock awards; |
| n | Adjusted EBITDA does not reflect the impact of earnings or charges resulting from matters we consider not to be indicative of our ongoing operations, as discussed in our presentation of Adjusted EBITDA and “Management’s Discussion and Analysis of Financial Condition and Results of Operations” in this prospectus; and |
| n | other companies in our industry may calculate Adjusted EBITDA differently than we do, limiting its usefulness as comparative measures. |
Because of these limitations, EBITDA and Adjusted EBITDA should not be considered as a measure of discretionary cash available to us to invest in the growth of our business. We compensate for these limitations by relying primarily on our U.S. GAAP results and using EBITDA and Adjusted EBITDA only supplementally.
We utilize Free Cash Flow as a measure of profitability and an assessment of our ability to generate cash. Free Cash Flow is a commonly utilized metric that companies provide to investors, although the calculation of Free Cash Flow may not be comparable to other similarly titled metrics of other companies and should not be considered as an alternative to cash flow measures derived in accordance with U.S. GAAP. We define Free Cash Flow as net cash provided by operating activities, less capital expenditures and the principal portion of payments related to campus leases classified for accounting purposes as deemed landlord liabilities.
Adjusted Net Income measures our operating performance by adjusting net income (loss) attributable to Medpace Holdings, Inc. to include cash expenditures related to rental payments on leases classified for accounting purposes as deemed landlord liabilities, and exclude amortization expense, certain stock based compensation award non-cash expenses, certain litigation expenses, deferred financing fees and certain other non-recurring items. Management uses this measure to evaluate our core operating results as it excludes certain items whose fluctuations from period-to-period do not necessarily correspond to changes in the core operations of the business, but includes certain items such as depreciation, interest expense and tax expense, which are otherwise excluded from Adjusted EBITDA. We believe the presentation of Adjusted Net Income enhances our investors’ overall understanding of the financial performance and cash flow of our business. You should not consider Adjusted Net Income as an alternative to net income (loss) attributable to Medpace Holdings, Inc., determined in accordance with U.S. GAAP, as an indicator of operating performance.
55
Table of Contents
See the consolidated financial statements included elsewhere in this prospectus for our U.S. GAAP results. Set forth below are the reconciliations of EBITDA, Adjusted EBITDA, Adjusted Net Income and Free Cash Flow to our closest reported U.S. GAAP measures.
| SUCCESSOR | PREDECESSOR | |||||||||||||||||||||||
| (In thousands) | SIX MONTHS ENDED JUNE 30, 2016 |
SIX MONTHS ENDED JUNE 30, 2015 |
YEAR ENDED DECEMBER 31, 2015 |
NINE MONTH PERIOD FROM APRIL 1, 2014 THROUGH DECEMBER 31, 2014 |
THREE MONTH PERIOD FROM JANUARY 1, 2014 THROUGH MARCH 31, 2014 |
YEAR ENDED DECEMBER 31, 2013 |
||||||||||||||||||
| EBITDA and Adjusted EBITDA: |
||||||||||||||||||||||||
| Net income (loss) as reported |
$ | 8,410 | $ | 36 | $ | (8,673 | ) | $ | (14,336 | ) | $ | (1,236 | ) | $ | 24,844 | |||||||||
| Interest expense, net |
11,894 | 13,975 | 27,259 | 23,185 | 3,272 | 18,000 | ||||||||||||||||||
| Income tax provision (benefit) |
5,738 | (733 | ) | 843 | (6,703 | ) | 1,014 | 14,301 | ||||||||||||||||
| Depreciation |
3,566 | 3,110 | 6,379 | 4,610 | 1,832 | 6,665 | ||||||||||||||||||
| Amortization |
25,336 | 34,243 | 63,142 | 56,422 | 5,199 | 23,854 | ||||||||||||||||||
|
|
|
|
|
|
|
|
|
|
|
|
|
|||||||||||||
| EBITDA |
54,944 | 50,631 | 88,950 | 63,178 | 10,081 | 87,664 | ||||||||||||||||||
|
|
|
|
|
|
|
|
|
|
|
|
|
|||||||||||||
| Stock compensation expense: liability awards mark-to-market and CEO award (a) |
2,576 | (12 | ) | 9,780 | — | — | — | |||||||||||||||||
| Private equity transaction related cost (b) |
— | — | — | 9,297 | 12,420 | — | ||||||||||||||||||
| Corporate campus lease payments (c) |
(1,860 | ) | (1,860 | ) | (3,720 | ) | (2,773 | ) | (918 | ) | (3,635 | ) | ||||||||||||
| Litigation matters (d) |
— | (374 | ) | (3,107 | ) | 748 | 127 | 1,380 | ||||||||||||||||
| Impairment of goodwill |
— | — | 9,313 | — | — | — | ||||||||||||||||||
| Other transaction expenses (f) |
767 | — | — | — | — | — | ||||||||||||||||||
|
|
|
|
|
|
|
|
|
|
|
|
|
|||||||||||||
| Adjusted EBITDA |
$ | 56,427 | $ | 48,385 | $ | 101,216 | $ | 70,450 | $ | 21,710 | $ | 85,409 | ||||||||||||
|
|
|
|
|
|
|
|
|
|
|
|
|
|||||||||||||
| Adjusted Net Income: |
||||||||||||||||||||||||
| Net income (loss) as reported |
$ | 8,410 | $ | 36 | $ | (8,673 | ) | $ | (14,336 | ) | $ | (1,236 | ) | $ | 24,844 | |||||||||
| Amortization |
25,336 | 34,243 | 63,142 | 56,422 | 5,199 | 23,854 | ||||||||||||||||||
| Stock compensation expense: liability awards mark-to-market and CEO award (a) |
2,576 | (12 | ) | 9,780 | — | — | — | |||||||||||||||||
| Private equity transaction related cost (b) |
— | — | — | 9,297 | 12,420 | — | ||||||||||||||||||
| Corporate campus lease payments—principal portion (c) |
(744 | ) | (576 | ) | (1,292 | ) | (1,284 | ) | (165 | ) | — | |||||||||||||
| Litigation matters (d) |
— | (374 | ) | (3,107 | ) | 748 | 127 | 1,380 | ||||||||||||||||
| Impairment of goodwill |
— | — | 9,313 | — | — | — | ||||||||||||||||||
| Deferred financing fees (e) |
1,345 | 1,328 | 2,687 | 2,064 | 371 | 1,918 | ||||||||||||||||||
| Other transaction expenses (f) |
767 | — | — | — | — | — | ||||||||||||||||||
| Income tax effect of adjustments (39.0%) |
(11,419 | ) | (13,498 | ) | (31,405 | ) | (26,226 | ) | (7,001 | ) | (10,589 | ) | ||||||||||||
|
|
|
|
|
|
|
|
|
|
|
|
|
|||||||||||||
| Adjusted Net Income |
$ | 26,271 | $ | 21,147 | $ | 40,445 | $ | 26,685 | $ | 9,715 | $ | 41,407 | ||||||||||||
|
|
|
|
|
|
|
|
|
|
|
|
|
|||||||||||||
| Free Cash Flow: |
||||||||||||||||||||||||
| Cash flow provided by operating activities |
$ | 19,982 | $ | 26,271 | $ | 84,117 | $ | 62,539 | $ | 12,807 | $ | 98,142 | ||||||||||||
| Less: Capital expenditures |
(5,693 | ) | (2,665 | ) | (6,465 | ) | (4,225 | ) | (1,090 | ) | (4,561 | ) | ||||||||||||
| Less: Corporate campus lease payments—principal portion (c) |
(744 | ) | (576 | ) | (1,292 | ) | (1,284 | ) | (165 | ) | — | |||||||||||||
|
|
|
|
|
|
|
|
|
|
|
|
|
|||||||||||||
| Free Cash Flow |
$ | 13,545 | $ | 23,030 | $ | 76,360 | $ | 57,030 | $ | 11,552 | $ | 93,581 | ||||||||||||
|
|
|
|
|
|
|
|
|
|
|
|
|
|||||||||||||
| (a) | Consists of period end mark-to-market fair value adjustments associated with liability classified awards and the impact of a one-time stock based compensation award to our Chief Executive Officer and founder. Future stock based awards activity is expected to be classified as equity for accounting purposes and will not be subject to period ending fair value adjustments. |
| (b) | Represents attorney fees, advisory fees and other professional service fees incurred in connection with the Transaction. |
| (c) | Represents cash rental payments on two corporate headquarter buildings that are accounted for as deemed assets and subject to depreciation expense over the life of the lease. Payments made for these leases are accounted for with a principal portion and an interest portion, consistent with deemed landlord liability accounting. For purposes of Free Cash Flow, the interest portion of these payments is included in net cash provided by operating activities in our statement of cash flows. The principal portion is reflected as a financing activity in our statement of cash flows. These adjustments for purposes of arriving at Adjusted EBITDA, Adjusted Net Income and Free Cash Flow have the effect of presenting these leases consistently with all other office lease rentals that we have globally. |
| (d) | Represents non-recurring costs and recovery related to a customer bad debt and non-recurring expenses related to the settlement of an employment related matter. |
| (e) | Represents amortization of the discount and issuance costs deferred on the consolidated balance sheet associated with the issuance of the Senior Secured Credit Facility. |
56
Table of Contents
| (f) | Represents advisory costs and other fees related to this offering. |
| (2) | Backlog represents anticipated future net service revenue from net new business awards that have not commenced or are currently in process but not complete. However, because the contracts included in our backlog are generally terminable without cause, we do not believe that our backlog as of any date is necessarily a meaningful predictor of future results. |
| (3) | Net new business awards are new business awards net of award modifications and cancellations that had previously been recognized in backlog during the period. New business awards represent the value of anticipated future net service revenue that has been awarded during the period that is recognized in backlog. This value is recognized upon the signing of a contract or receipt of a written pre-contract confirmation from a customer that confirms an agreement in principle on budget and scope. New business awards also include contract amendments, or changes in scope, where the customer has provided written authorization for changes in budget and scope or has approved us to perform additional work as of the measurement date. Awards may not be recognized as backlog after consideration of a number of factors, including whether (i) the relevant net service revenue is expected only after a pending regulatory hurdle, which might result in cancellation of the study, (ii) the customer funding needed for commencement of the study is not believed to have been secured or (iii) study timelines are uncertain or not well defined. In addition, study amounts that extend beyond a three-year timeline are not included in backlog. The number and amount of new business awards can vary significantly from period to period, and an award’s contractual duration can range from several months to several years based on customer and project specifications. |
57
Table of Contents
MANAGEMENT’S DISCUSSION AND ANALYSIS OF FINANCIAL CONDITION AND RESULTS OF OPERATIONS
The following discussion and analysis of our financial condition and results of operations should be read together with “Selected Historical Consolidated Financial and Other Data” and the consolidated financial statements and the related notes included elsewhere in this prospectus. This discussion contains forward looking statements related to future events and our future financial performance that are based on current expectations and subject to risks and uncertainties. Our actual results may differ materially from those anticipated in these forward looking statements as a result of many factors, including those set forth under “Risk Factors,” “Cautionary Note Regarding Forward Looking Statements” and elsewhere in this prospectus.
The following discussion and analysis presents operations and cash flows for two periods, Predecessor and Successor, which relate to the period preceding the Transaction (as defined below) and the period succeeding the Transaction, respectively. References to the “Successor nine month period ended December 31, 2014” refer to the period from April 1, 2014 to December 31, 2014 and references to the “Predecessor three month period ended March 31, 2014” refer to the period from January 1, 2014 to March 31, 2014. The Company refers to the operations of Medpace Holdings., Inc. and subsidiaries for both the Predecessor period and Successor period.
Business Overview
We are one of the world’s leading clinical contract research organizations, or CROs, by revenue, solely focused on providing scientifically-driven outsourced clinical development services to the biotechnology, pharmaceutical and medical device industries. Our mission is to accelerate the global development of safe and effective medical therapeutics. We differentiate ourselves from our competitors by our disciplined operating model centered on providing full-service Phase I-IV clinical development services and our therapeutic expertise. We believe this combination results in timely and cost-effective delivery of clinical development services for our customers. We believe that we are a partner of choice for small and mid-sized biopharmaceutical companies based on our ability to consistently utilize our full-service, disciplined operating model to deliver timely and high-quality results for our customers. Accordingly, we believe we are well positioned to continue to expand our market share and sustain margins in the growing $23 billion overall Phase I-IV CRO market.
We focus on conducting clinical trials across all major therapeutic areas, with particular strength in Cardiology, Metabolic Disease, Oncology, Endocrinology, Central Nervous System, or CNS, Anti-Viral and Anti-Infective, or AVAI, as well as therapeutic expertise in Medical Devices. Our global platform includes approximately 2,300 employees across 35 countries, providing our customers with broad access to diverse markets and patient populations and local regulatory expertise and market knowledge.
Our History
We were founded in 1992 as a Phase II-IV-focused CRO with a strong, scientifically-driven and disciplined operating model, and we continue today as a founder-led enterprise. Throughout our 24-year history, we have grown almost exclusively organically, with our core founding members having been integrally involved in developing and instilling our differentiated culture and operating philosophy across our company.
In April 2014, investment funds managed by Cinven Capital Management (V) General Partner Limited, or Cinven, a private equity firm, acquired 100% of the outstanding shares of Medpace IntermediateCo, Inc., or Medpace IntermediateCo, for an aggregate purchase price of $921.3 million. In connection with the acquisition, certain employees of the Company, through Medpace Investors, LLC, or MPI, agreed to contribute shares held in Medpace IntermediateCo in exchange for a percentage stake in Medpace Holdings, Inc. We refer to these transactions collectively, as the “Transaction.” Immediately following the Transaction, Cinven and MPI owned approximately 75% and 25%, respectively, of Medpace Holdings, Inc. For an overview of our ownership structure following this offering, see “Prospectus Summary—Our Structure.”
Prior to the Transaction, CCMP Capital, or CCMP, a private equity firm, held 80% of our equity interests and the noncontrolling interests were held by certain current and former members of management, along with former members of the board of directors of Medpace, Inc., our wholly owned subsidiary.
58
Table of Contents
The Transaction was accounted for as a business combination using the acquisition method of accounting. As of the Transaction date, our consolidated financial statements reflect the allocation of the $921.3 million purchase price to the assets acquired, including identifiable intangible assets of $306.3 million, and liabilities assumed based on fair values at the date of the Transaction. The excess of the purchase price over the fair value of the assets acquired and liabilities assumed amounted to $670.3 million, which was recorded as goodwill. Transaction related costs, including attorney fees, advisory fees and other professional service fees related to the Transaction, were $9.3 million, including $3.3 million related to success based advisory fees, for the Successor nine month period ended December 31, 2014 and $12.4 million, including $10.1 million related to success based advisory fees, for the Predecessor three month period ended March 31, 2014.
Stock Split
On July 25, 2016, the Board approved, and made legally effective, a 1-for-1.35 reverse stock split of the Company’s common stock. All share, stock option and per share information presented in the Successor consolidated financial statements have been adjusted to reflect the reverse stock split on a retroactive basis for all periods presented. The Company will make a cash payment to shareholders for all fractional shares which would have otherwise been required to be issued as a result of the reverse stock split. There was no change in number of authorized shares or the par value of the Company’s common stock.
How We Generate Revenue
Our revenue consists of net service revenue and reimbursed-out-of-pocket revenue.
Net Service Revenue
We earn customer fees through the performance of services detailed in our customer contracts. Contract scope and pricing is typically based on either a fixed-fee or unit-of-service model and our contracts can range in duration from a few months to several years. These contracts are individually priced and negotiated based on the anticipated project scope, including the complexity of the project and the performance risks inherent in the project. The majority of our contracts are structured with an upfront fee that is collected at the time of contract signing, and the balance of the fee is collected over the duration of the contract either through an arranged billing schedule or upon completion of certain performance targets or defined milestones. This payment structure is standard in the CRO industry.
Net service revenue, which is distinct from billing and cash receipt, is generally recognized based on the proportional performance methodology, which is determined by assessing the proportion of performance completed or delivered to date compared to total specific measures to be delivered or completed under the terms of the contract. The measures utilized to assess performance are specific to the service provided. Net service revenue for unit-of-service contracts is recognized as services are performed or delivered. Cancellation provisions in our contracts allow our customers to terminate a contract either immediately or according to advance notice terms specified within the applicable contract, which is typically 30 days. Contract cancellation may occur for various reasons, including, but not limited to, adverse patient reactions, lack of efficacy or inadequate patient enrollment. Upon cancellation, we are entitled to fees for services rendered through the date of termination, including payment for subsequent services necessary to conclude the study or close out the contract. These fees are typically subject to negotiation and are realized as net service revenue when collection is reasonably assured. Changes in net service revenue from period to period are driven primarily by new business volume and task order execution activity, project cancellations, and the mix of active studies during a given period that can vary based on therapeutic and or study life cycle stage.
Reimbursed Out-of-Pocket Revenue
Reimbursed out-of-pocket revenue consists primarily of expenses we incur in relation to projects that are reimbursed by our customers with no profit or mark-up. These expenses are defined in our contracts and generally include, but are not limited to, travel, meetings, printing and shipping and handling fees. Such reimbursements received are included in revenue with the expenditures reflected as a separate component of operating expense. Certain fees paid to investigators and other disbursements in which we act as an agent on behalf of the study sponsor are reflected in the consolidated statements of operations with no resulting effect on our revenue or expenses.
Costs and Expenses
Our costs and expenses are comprised primarily of our direct costs, selling, general and administrative costs, depreciation and amortization and income taxes. In addition, as noted above, we also have reimbursed out-of-pocket expenditures that are directly offset by our reimbursed out-of-pocket revenue.
59
Table of Contents
Direct Costs, Excluding Depreciation and Amortization
Direct costs, excluding depreciation and amortization are primarily driven by labor and related employee benefits, but also include laboratory supplies and other expenses contributing to service delivery. The other costs of service delivery can include office rent, utilities, supplies and software license expenses, which are allocated between direct costs, excluding depreciation and amortization and selling, general and administrative expenses based on the estimated contribution among service delivery and support function efforts on a percentage basis. Direct costs, excluding depreciation and amortization exclude reimbursed out-of-pocket expenses. Direct costs, excluding depreciation and amortization are expensed as incurred and are not deferred in anticipation of contracts being awarded or finalization of changes in scope. Direct costs, excluding depreciation and amortization as a percentage of net service revenue can vary from period to period due to project labor efficiencies, changes in workforce, compensation/bonus programs and service mix.
Selling, General and Administrative
Selling, general and administrative expenses are primarily driven by compensation and related employee benefits, as well as rent, utilities, supplies, software licenses, professional fees (e.g., legal and accounting expenses), travel, marketing and other operating expenses.
Depreciation
Depreciation is provided on our property and equipment on the straight-line method at rates adequate to allocate the cost of the applicable assets over their estimated useful lives, which is three to five years for computer hardware, software, phone and medical imaging equipment, five to seven years for furniture and fixtures and other equipment, and thirty to forty years for buildings. Leasehold improvements and deemed assets from landlord building construction are amortized on a straight-line basis over the shorter of the estimated useful life of the improvement or the associated remaining lease term.
Amortization
Amortization relates to finite-lived intangible assets recognized as expense using the straight-line method or using an accelerated method over their estimated useful lives, which range in term from 17 months to 15 years.
Income Tax Provision (Benefit)
Income tax provision (benefit) consists of federal, state and local taxes on income in multiple jurisdictions. Our income tax is impacted by the pre-tax earnings in jurisdictions with varying tax rates and any related tax credits that may be available to us. Our current and future provision for income taxes will vary from statutory rates due to the impact of valuation allowances in certain countries, income tax incentives, certain non-deductible expenses and other discrete items.
Key Performance Metrics
To evaluate the performance of our business, we utilize a variety of financial and performance metrics. These key measures include new business awards, cancellations and backlog.
New Business Awards, Cancellations and Backlog
New business awards represent the value of anticipated future net service revenue that has been awarded during the period that is recognized in backlog. This value is recognized upon the signing of a contract or receipt of a written pre-contract confirmation from a customer that confirms an agreement in principle on budget and scope. New business awards also include contract amendments, or changes in scope, where the customer has provided written authorization for changes in budget and scope or has approved us to perform additional work as of the measurement date. Awards may not be recognized as backlog after consideration of a number of factors, including whether (i) the relevant net service revenue is expected only after a pending regulatory hurdle, which might result in cancellation of the study, (ii) the customer funding needed for commencement of the study is not believed to have been secured or (iii) study timelines are uncertain or not well defined. In addition, study amounts that extend beyond a three-year timeline are not included in backlog. The number and amount of new business awards can vary significantly from period to period, and an award’s contractual duration can range from several months to several years based on customer and project specifications.
Cancellations arise in the normal course of business and are reflected when we receive written confirmation from the customer to cease work on a contractual agreement. The majority of our customers can terminate our contracts
60
Table of Contents
without cause upon 30 days’ notice. Similar to new business awards, the number and amount of cancellations can vary significantly period over period due to timing of customer correspondence and study-specific circumstances. Total cancellations in a period are offset against gross new business awards received in a period to determine net new business awards in our backlog calculation. Our average quarterly cancellation rates as a percentage of the beginning of the period backlog were 4.2% and 2.7% for the Successor six months ended June 30, 2016 and June 30, 2015, respectively, and 3.2% for the Successor year ended December 31, 2015, 3.3% for the Successor nine month period ended December 2014, 2.5% for the Predecessor three month period ended March 2014 and 3.7% for the Predecessor year ended December 2013.
Net new business awards were $218.1 million and $162.6 million for the Successor six months ended June 30, 2016 and June 30, 2015, respectively. Net new business awards were $359.5 million, $329.1 million (of which $231.9 million related to the Successor nine month period ended December 31, 2014 and $97.2 million related to the Predecessor three month period ended March 31, 2014), and $291.6 million for the Successor year ended December 31, 2015, the combined Successor nine month period ended December 31, 2014 and Predecessor three month period ended March 31, 2014, and the Predecessor year ended December 31, 2013, respectively.
Backlog represents anticipated future net service revenue from net new business awards that have not commenced or are currently in process but not complete. Reported backlog will fluctuate based on new business awards, changes in the scope of existing contracts, cancellations, revenue recognition on existing contracts and foreign exchange adjustments from non-U.S. dollar denominated backlog. As of June 30, 2016, our backlog increased by $65.1 million, or 16.3%, to $465.7 million compared to $400.6 million as of June 30, 2015. Our backlog increased by $35.6 million, or 9.0%, to $429.7 million as of December 31, 2015, compared to $394.0 million as of December 31, 2014. Our backlog increased by $34.7 million, or 9.7%, to $394.0 million as of December 31, 2014, compared to $359.3 million as of December 31, 2013. Included within backlog as of June 30, 2016 was approximately $170.1 million to $175.1 million that we expect to convert to net service revenue in 2016, with the remainder expected to convert to net service revenue in years after 2016.
The effect of foreign currency adjustments on backlog was as follows: unfavorable foreign currency adjustments of $1.4 million for the Successor six months ended June 30, 2016, unfavorable foreign currency adjustments of $2.9 million for the Successor six months ended June 30, 2015, unfavorable foreign currency adjustments of $3.6 million for the Successor year ended December 31, 2015; unfavorable foreign currency adjustments of $3.4 million for the Successor nine month period ended December 2014; no net currency adjustments for the Predecessor three month period ended March 2014; and foreign currency adjustments of $0.2 million for the Predecessor year ended December 2013.
Backlog and net new business award metrics may not be reliable indicators of our future period revenue as they are subject to a variety of factors that may cause material fluctuations from period to period. These factors include, but are not limited to, changes in the scope of projects, cancellations and duration and timing of services provided.
Exchange Rate Fluctuations
The majority of our contracts and operational transactions are U.S. dollar denominated. The Euro represents the largest foreign currency denomination of our contractual and operational exposure. As a result, a portion of our revenue and expenses are subject to exchange rate fluctuations. We have translated the Euro into U.S. dollars using the following average exchange rates based on data obtained from www.xe.com:
| SUCCESSOR | PREDECESSOR | |||||||||||||||||||||||||||
| SIX MONTHS ENDED JUNE 30, 2016 |
SIX MONTHS ENDED JUNE 30, 2015 |
YEAR ENDED DECEMBER 31, 2015 |
NINE MONTH PERIOD FROM APRIL 1, 2014 THROUGH DECEMBER 31, 2014 |
THREE MONTH PERIOD FROM JANUARY 1, 2014 THROUGH MARCH 31, 2014 |
YEAR ENDED DECEMBER 31, 2013 |
|||||||||||||||||||||||
| U.S. dollars per Euro |
1.11 | 1.11 | 1.10 | 1.31 | 1.37 | 1.33 | ||||||||||||||||||||||
61
Table of Contents
Results of Operations
Successor six months ended June 30, 2016 compared to the Successor six months ended June 30, 2015
| SUCCESSOR | ||||||||||||||||
| (In thousands, except percentages) | SIX MONTHS ENDED JUNE 30, 2016 |
SIX MONTHS ENDED JUNE 30, 2015 |
CHANGE | % CHANGE |
||||||||||||
| Service revenue, net |
$ | 180,433 | $ | 152,782 | $ | 27,651 | 18.1 | % | ||||||||
| Reimbursed out-of-pocket revenue |
25,107 | 18,105 | 7,002 | 38.7 | % | |||||||||||
|
|
|
|
|
|
|
|
|
|||||||||
| Total revenue |
205,540 | 170,887 | 34,653 | 20.3 | % | |||||||||||
| Direct costs, excluding depreciation and amortization |
96,215 | 77,725 | 18,490 | 23.8 | % | |||||||||||
| Reimbursed out-of-pocket expenses |
25,107 | 18,105 | 7,002 | 38.7 | % | |||||||||||
| Selling, general and administrative |
28,333 | 23,448 | 4,885 | 20.8 | % | |||||||||||
| Depreciation |
3,566 | 3,110 | 456 | 14.7 | % | |||||||||||
| Amortization |
25,336 | 34,243 | (8,907 | ) | (26.0 | %) | ||||||||||
|
|
|
|
|
|
|
|
|
|||||||||
| Total operating expenses |
178,557 | 156,631 | 21,926 | 14.0 | % | |||||||||||
|
|
|
|
|
|
|
|
|
|||||||||
| Income from operations |
26,983 | 14,256 | 12,727 | 89.3 | % | |||||||||||
| Miscellaneous (expense) income, net |
(941 | ) | (978 | ) | 37 | (3.8 | %) | |||||||||
| Interest expense, net |
(11,894 | ) | (13,975 | ) | 2,081 | (14.9 | %) | |||||||||
|
|
|
|
|
|
|
|
|
|||||||||
| Income (loss) before income taxes |
14,148 | (697 | ) | 14,845 | (2,129.8 | %) | ||||||||||
| Income tax provision (benefit) |
5,738 | (733 | ) | 6,471 | (882.8 | %) | ||||||||||
|
|
|
|
|
|
|
|
|
|||||||||
| Net income (loss) |
$ | 8,410 | $ | 36 | $ | 8,374 | 23,261.1 | % | ||||||||
|
|
|
|
|
|
|
|
|
|||||||||
Net service revenue and Reimbursed out-of-pocket revenue
Net service revenue was $180.4 million for the six months ended June 30, 2016, compared to $152.8 million for the six months ended June 30, 2015. Contributing to the $27.7 million growth in net service revenue was an increase in Phase II-IV study activity as measured by both number of active projects and employee time reporting. In addition, there was a higher concentration of active studies in phases that are generally attributed to higher levels of project activity, including patient enrollment and monitoring phases. Contract execution timing was also a factor in this increase, with a higher percentage of overall revenue driven from change in scope and task order executions in the six months ended June 30, 2016, compared to the six months ended June 30, 2015. On average, we converted 20.6% of our beginning of the period backlog to revenue in the six months ended June 30, 2016, compared to 19.1% of our beginning of the period backlog to revenue in the six months ended June 30, 2015.
Reimbursed out-of-pocket revenue was $25.1 million for the six months ended June 30, 2016, compared to $18.1 million for the six months ended June 30, 2015. Reimbursed out-of-pocket revenues fluctuate significantly from period to period based on the timing of program initiation or closeout, and these changes do not necessarily correlate to changes in net service revenue. The reimbursements were offset by an equal amount of reimbursed out-of-pocket expenses.
Direct costs, excluding depreciation and amortization and Reimbursed out-of-pocket expenses
Direct costs, excluding depreciation and amortization were $96.2 million for the six months ended June 30, 2016, compared to $77.7 million for the six months ended June 30, 2015. The $18.5 million increase was primarily attributed to increases in employee related costs of $12.1 million and increases in contracted services of $2.3 million related to growth in project volume.
Selling, general and administrative
Selling, general and administrative expenses were $28.3 million for the six months ended June 30, 2016, compared to $23.4 million for the six months ended June 30, 2015. The $4.9 million increase was primarily attributed to increases in employee related costs of $3.0 million related to additional headcount in business support functions.
62
Table of Contents
Depreciation and Amortization
Depreciation and amortization expense was $28.9 million for the six months ended June 30, 2016, compared to $37.4 for the six months ended June 30, 2015. The $8.5 million decrease in depreciation and amortization was primarily related to definite lived intangible assets acquired as part of the Transaction with relatively short useful lives.
Miscellaneous (expense) income, net
Miscellaneous (expense) income, net was ($0.9) million of expense for the six months ended June 30, 2016, compared to ($1.0) million of expense for the six months ended June 30, 2015. These changes were mainly attributable to foreign exchange gains or losses that arise in connection with the revaluation of short-term inter-company balances between our domestic and international subsidiaries, and gains or losses from foreign currency transactions, such as those resulting from the settlement of third-party accounts receivables and payables denominated in a currency other than the local currency of the entity making the payment.
Interest expense, net
Interest expense, net was $11.9 million for the six months ended June 30, 2016, compared to $14.0 for the six months ended June 30, 2015. The $2.1 million decrease in interest expense, net was related to the average lower outstanding balance under our Senior Secured Term Loan Facility (as defined below).
Income tax provision (benefit)
Income tax provision was $5.7 million for the six months ended June 30, 2016, compared to an income tax benefit of $0.7 million for the six months ended June 30, 2015. The overall effective tax rate for the six months ended June 30, 2016 was 40.6% compared to 105.2% for the six months ended June 30, 2015. The change in effective tax rate was primarily due to the notable increase in projected pre-tax book income for the six months ended June 30, 2016 coupled with relatively consistent year over year rate reconciliation drivers.
63
Table of Contents
Successor year ended December 31, 2015 compared to the Successor nine month period from April 1, 2014 through December 31, 2014 and Predecessor three month period from January 1, 2014 through March 31, 2014
| SUCCESSOR | PREDECESSOR | CHANGE | % CHANGE |
|||||||||||||||||
| (In thousands, except percentages) | YEAR ENDED DECEMBER 31, 2015 |
NINE MONTH PERIOD FROM APRIL 1, 2014 THROUGH DECEMBER 31, 2014 |
THREE MONTH PERIOD FROM JANUARY 1, 2014 THROUGH MARCH 31, 2014 |
|||||||||||||||||
| Service revenue, net |
$ | 320,101 | $ | 219,791 | $ | 70,250 | $ | 30,060 | 10.4 | % | ||||||||||
| Reimbursed out-of-pocket revenue |
38,958 | 28,708 | 7,679 | 2,571 | 7.1 | % | ||||||||||||||
|
|
|
|
|
|
|
|
|
|
|
|||||||||||
| Total revenue |
359,059 | 248,499 | 77,929 | 32,631 | 10.0 | % | ||||||||||||||
| Direct costs, excluding depreciation and amortization |
163,707 | 117,550 | 38,759 | 7,398 | 4.7 | % | ||||||||||||||
| Reimbursed out-of-pocket expenses |
38,958 | 28,708 | 7,679 | 2,571 | 7.1 | % | ||||||||||||||
| Selling, general and administrative |
56,998 | 29,465 | 10,203 | 17,330 | 43.7 | % | ||||||||||||||
| Acquisition and integration |
— | 9,297 | 12,420 | (21,717 | ) | -100.0 | % | |||||||||||||
| Impairment of goodwill |
9,313 | — | — | 9,313 | — | |||||||||||||||
| Depreciation |
6,379 | 4,610 | 1,832 | (63 | ) | -1.0 | % | |||||||||||||
| Amortization |
63,142 | 56,422 | 5,199 | 1,521 | 2.5 | % | ||||||||||||||
|
|
|
|
|
|
|
|
|
|
|
|||||||||||
| Total operating expenses |
338,497 | 246,052 | 76,092 | 16,353 | 5.1 | % | ||||||||||||||
|
|
|
|
|
|
|
|
|
|
|
|||||||||||
| Income from operations |
20,562 | 2,447 | 1,837 | 16,278 | 380.0 | % | ||||||||||||||
| Miscellaneous (expense) income, net |
(1,133 | ) | (301 | ) | 1,213 | (2,045 | ) | -224.2 | % | |||||||||||
| Interest expense, net |
(27,259 | ) | (23,185 | ) | (3,272 | ) | (802 | ) | 3.0 | % | ||||||||||
|
|
|
|
|
|
|
|
|
|
|
|||||||||||
| (Loss) income before income taxes |
(7,830 | ) | (21,039 | ) | (222 | ) | 13,431 | -63.2 | % | |||||||||||
| Income tax provision (benefit) |
843 | (6,703 | ) | 1,014 | 6,532 | -114.8 | % | |||||||||||||
|
|
|
|
|
|
|
|
|
|
|
|||||||||||
| Net (loss) income |
$ | (8,673 | ) | $ | (14,336 | ) | $ | (1,236 | ) | $ | 6,899 | -44.3 | % | |||||||
|
|
|
|
|
|
|
|
|
|
|
|||||||||||
Net service revenue and Reimbursed out-of-pocket revenue
Net service revenue was $320.1 million for the Successor year ended December 31, 2015, compared to $219.8 million for the Successor nine month period ended December 31, 2014, and $70.3 million for the Predecessor three month period ended March 31, 2014. Contributing to growth in net service revenue in the Successor year ended December 31, 2015 was a larger number of active projects. On average, we converted 19.7% of our beginning of the quarter backlog to revenue each quarter during the Successor year ended December 31, 2015. In comparison, we converted an average of 18.7% and 19.6% of our beginning of quarter backlog to revenue each quarter during the Successor nine month period ended December 31, 2014 and Predecessor three month period ended March 31, 2014, respectively.
Reimbursed out-of-pocket revenue was $39.0 million for the Successor year ended December 31, 2015, $28.7 million for the Successor nine month period ended December 31, 2014 and $7.7 million for the Predecessor three month period ended March 31, 2014. Reimbursed out-of-pocket revenues fluctuate significantly from period to period based on the timing of program initiation or closeout, and these changes do not necessarily correlate to changes in net service revenue. The reimbursements were offset by an equal amount of reimbursed out-of-pocket expenses.
64
Table of Contents
Direct costs, excluding depreciation and amortization and Reimbursed out-of-pocket expenses
Direct costs, excluding depreciation and amortization were $163.7 million for the Successor year ended December 31, 2015, compared to $117.6 million for the Successor nine month period ended December 31, 2014 and $38.8 million for the Predecessor three month period ended March 31, 2014. The increase for the Successor year ended December 31, 2015 was primarily the result of an increase in revenue generating headcount from December 31, 2014 to support our increased project activity and new business awards.
While direct costs, excluding depreciation and amortization, increased in the Successor year ended December 31, 2015 compared to the Successor nine month period ended December 31, 2014 and Predecessor three month period ended March 31, 2014, they decreased to 51.1% of net service revenue, from 53.5% of net service revenue in the Successor nine month period ended December 31, 2014 and 55.2% of net service revenue for the Predecessor three month period ended March 31, 2015. An increase in headcount drove salaries, wages and other employee related direct costs to $119.8 million, or 37.4%, of net service revenue, from $86.8 million, or 39.5% of net service revenue, in the Successor nine month period ended December 31, 2014, and $25.7 million, or 36.6% of net service revenue, in the Predecessor three month period ended March 31, 2014. In addition, stock based compensation expense recognized in direct costs, excluding depreciation and amortization, was $9.2 million, or 2.9% of net service revenue, in the Successor year ended 2015, compared to $4.4 million, or 2.0% of net service revenue, in the Successor nine month period ended December 31, 2014 and $5.4 million, or 7.7% of net service revenue, in the Predecessor three month period ended March 31, 2014. Stock based compensation expense was elevated in the Predecessor three month period ended March 31, 2014 as a result of the acceleration of stock option vesting that occurred in advance of the Transaction.
Selling, general and administrative
Selling, general and administrative expenses were $57.0 million for the Successor year ended December 31, 2015, compared to $29.5 million for the Successor nine month period ended December 31, 2014, and $10.2 million for the Predecessor three month period ended March 31, 2014. The increase for the Successor year ended December 31, 2015 was primarily due to $13.1 million of stock based compensation expense related to the issuance of new stock based awards granted to select management personnel, recurring and accelerated amortization of previously granted restricted share awards, and the impact of mark-to-market expense adjustments due to an increase in the fair value of liability classified stock based awards. Stock based compensation expense was $1.0 million and $1.9 million for the Successor nine month period ended December 31, 2014 and Predecessor three month period ended March 31, 2014, respectively.
Selling, general and administrative expenses increased to 17.8% of net service revenue for the Successor year ended December 31, 2015, compared to 13.4% of net service revenue for the Successor nine month period ended December 31, 2014, and 14.5% of net service revenue for the Predecessor three month period ended March 31, 2014. The increase in selling, general and administrative expense as a percentage of net service revenue was primarily related to the aforementioned increase in stock based compensation expense to 4.1% of net service revenue for the Successor year ended December 31, 2015 from 0.5% of net service revenue for the Successor nine month period ended December 31, 2014 and 2.7% of net service revenue for the Predecessor three month period ended March 31, 2014. Further contributing to this increase as a percentage of net service revenue were higher salaries and wages. Salaries and wages as a percentage of net service revenue were 7.4% for the Successor year ended December 31, 2015, compared to 5.6% and 5.5% of net service revenue for the Successor nine month period ended December 31, 2014 and the Predecessor three month period ended March 31, 2014, respectively. Salaries and wages grew at a higher percentage than net service revenue for the Successor year ended December 31, 2015 as we continued to hire both sales force and administrative personnel in anticipation of future growth. Offsetting the increase in selling, general and administrative expense as a percentage of net service revenue were bad debt recoveries and gains on litigation matters of $2.7 million, or 0.9% of net service revenue, for the Successor year ended December 31, 2015, compared to bad debt expense and litigation losses of $2.2 million, or 1.0% of net service revenue, for the Successor nine month period ended December 31, 2014.
65
Table of Contents
Acquisition and integration expenses
There were no acquisition and integration expenses for the Successor year ended December 31, 2015. Acquisition and integration expenses were $9.3 million for the Successor nine month period ended December 31, 2014 and $12.4 million for the Predecessor three month period ended March 31, 2014. These expenses included attorney fees, advisory fees and other professional service fees related to the Transaction.
Impairment of goodwill
During the Successor year ended December 31, 2015, we determined that the fair value of our Clinics reporting unit did not exceed its carrying value resulting in a $9.3 million impairment of goodwill. This impairment was identified during the annual impairment assessment in the fourth quarter of 2015 when we updated our forecasted discounted cash flows to reflect operating results that lagged prior forecasted results.
Depreciation and Amortization
Depreciation and amortization expense was $69.5 million for the Successor year ended December 31, 2015, compared to $61.0 million for the Successor nine month period ended December 31, 2014 and $7.0 million for the Predecessor three month period ended March 31, 2014. The increase in depreciation and amortization was primarily related to the amortization expense associated with the Transaction in which $274.7 million in finite-lived intangible assets that were identified and capitalized as part of the Transaction. Depreciation and amortization as a percentage of net service revenue, decreased to 21.7% in the Successor year ended 2015, compared to 27.8% for the Successor nine month period ended December 31, 2014. This decrease primarily related to the accelerated amortization methodology of our backlog and customer relationship intangibles. Within the Successor nine month period ended December 31, 2014 and the Predecessor three month period ended March 31, 2014, depreciation and amortization expense as a percentage of net service revenue increased to 27.8% from 10.0%, respectively. This increase was the result of the capitalization and amortization of the finite-lived intangible assets identified as part of the Transaction.
Miscellaneous (expense) income, net
Miscellaneous (expense) income, net was $1.1 million of expense for the Successor year ended December 31, 2015, compared to $0.3 million of expense for the Successor nine month period ended December 31, 2014 and $1.2 million of income for the Predecessor three month period ended March 31, 2014. Changes are mainly attributable to foreign exchange gains or losses that arise in connection with the revaluation of short-term inter-company balances between our domestic and international subsidiaries, and gains or losses from foreign currency transactions, such as those resulting from the settlement of third-party accounts receivables and payables denominated in a currency other than the local currency of the entity making the payment.
Interest expense, net
Interest expense, net was $27.3 million for the Successor year ended December 31, 2015, compared to $23.2 million for the Successor nine month period ended December 31, 2014 and $3.3 million for the Predecessor three month period ended March 31, 2014. Interest expense, net was 8.5% of net service revenue for the Successor year ended December 31, 2015, compared to 10.5% of net service revenue for the Successor nine month period ended December 31, 2014 and 4.7% of net service revenue for the Predecessor three month period ended March 31, 2014. The change in interest expense, net was primarily attributed to the average lower outstanding balance under our Senior Secured Term Loan Facility in the Successor year ended December 31, 2015, compared to the Successor nine month period ended December 31, 2014, as $116.1 million of principal payments were applied to the Senior Secured Term Loan Facility throughout the year. For the Successor nine month period ended December 31, 2014, compared to the Predecessor three month period ended March 31, 2014, the increase in interest expense, net was related to entering into the Senior Secured Credit Facilities (as defined below) to finance a portion of the Transaction, which increased outstanding debt, net from $143.7 million (that was paid in full at the Transaction date) to $530.0 million as of April 1, 2014.
Income tax provision (benefit)
Income tax provision was $0.8 million for the Successor year ended December 31, 2015, compared to a benefit of $6.7 million for the Successor nine month period ended December 31, 2014 and a provision of $1.0 million for the Predecessor three month period ended March 31, 2014.
66
Table of Contents
The effective tax rate for the Successor year ended December 31, 2015 was negative 10.8%, compared to 31.8% for the Successor nine month period ended December 31, 2014. This change in the effective tax rates was primarily the result of higher non-deductible expenses in the Successor year ended December 31, 2015. The nondeductible expenses for the Successor year ended December 31, 2015 included goodwill impairment and stock based compensation expense resulting from the vesting of stock based awards for foreign employees and an increase of domestic and foreign uncertain tax positions in the Successor year ended December 31, 2015. In the Successor nine month period ended December 31, 2014, the Company experienced significant nondeductible transaction costs resulting from the Transaction. Although both periods experienced high levels of nondeductible expenses, the total nondeductible expenses related to the Successor year ended December 31, 2015 exceeded nondeductible expenses incurred in the Successor nine month period ended December 31, 2014.
The effective tax rate for the Successor nine month period ended December 31, 2014 was 31.8%, compared to negative 456.1% for the Predecessor three month period ended March 31, 2014. The change in the effective tax rates between the Successor nine month period ended December 31, 2014 and the Predecessor three month period ended March 31, 2014 was primarily due to an increase in the valuation allowance on U.S. deferred tax assets relating to a capital loss that was recorded in the Predecessor three month period ended March 31, 2014 due to the sale of an investment. The valuation allowance was recorded in the Predecessor three month period ended March 31, 2014 because the Company did not anticipate generating capital gains that could be used to offset the capital loss. Another contributing factor was non-deductible stock based compensation expense recorded for the Predecessor three month period ended March 31, 2014 resulting from the acceleration of vesting of stock based awards for foreign employees that occurred prior to the Transaction.
Successor nine month period from April 1, 2014 through December 31, 2014 and Predecessor three month period from January 1, 2014 through March 31, 2014 compared to the Predecessor year ended December 31, 2013
| SUCCESSOR | PREDECESSOR | CHANGE | % CHANGE |
|||||||||||||||||
| (In thousands, except percentages) | NINE MONTH PERIOD FROM APRIL 1, 2014 THROUGH DECEMBER 31, 2014 |
THREE MONTH PERIOD FROM JANUARY 1, 2014 THROUGH MARCH 31, 2014 |
YEAR ENDED DECEMBER 31, 2013 |
|||||||||||||||||
| Service revenue, net |
$ | 219,791 | $ | 70,250 | $ | 244,270 | $ | 45,771 | 18.7 | % | ||||||||||
| Reimbursed out-of-pocket revenue |
28,708 | 7,679 | 28,620 | 7,767 | 27.1 | % | ||||||||||||||
|
|
|
|
|
|
|
|
|
|
|
|||||||||||
| Total revenue |
248,499 | 77,929 | 272,890 | 53,538 | 19.6 | % | ||||||||||||||
| Direct costs, excluding depreciation and amortization |
117,550 | 38,759 | 119,779 | 36,530 | 30.5 | % | ||||||||||||||
| Reimbursed out-of-pocket expenses |
28,708 | 7,679 | 28,620 | 7,767 | 27.1 | % | ||||||||||||||
| Selling, general and administrative |
29,465 | 10,203 | 35,109 | 4,559 | 13.0 | % | ||||||||||||||
| Acquisition and integration |
9,297 | 12,420 | — | 21,717 | — | |||||||||||||||
| Impairment of goodwill |
— | — | — | — | — | |||||||||||||||
| Depreciation |
4,610 | 1,832 | 6,665 | (223 | ) | -3.3 | % | |||||||||||||
| Amortization |
56,422 | 5,199 | 23,854 | 37,767 | 158.3 | % | ||||||||||||||
|
|
|
|
|
|
|
|
|
|
|
|||||||||||
| Total operating expenses |
246,052 | 76,092 | 214,027 | 108,117 | 50.5 | % | ||||||||||||||
|
|
|
|
|
|
|
|
|
|
|
|||||||||||
| Income from operations |
2,447 | 1,837 | 58,863 | (54,579 | ) | -92.7 | % | |||||||||||||
| Miscellaneous (expense) income, net |
(301 | ) | 1,213 | (1,718 | ) | 2,630 | -153.1 | % | ||||||||||||
| Interest expense, net |
(23,185 | ) | (3,272 | ) | (18,000 | ) | (8,457 | ) | 47.0 | % | ||||||||||
|
|
|
|
|
|
|
|
|
|
|
|||||||||||
| (Loss) income before income taxes |
(21,039 | ) | (222 | ) | 39,145 | (60,406 | ) | -154.3 | % | |||||||||||
| Income tax (benefit) provision |
(6,703 | ) | 1,014 | 14,301 | (19,990 | ) | -139.8 | % | ||||||||||||
|
|
|
|
|
|
|
|
|
|
|
|||||||||||
| Net (loss) income |
$ | (14,336 | ) | $ | (1,236 | ) | $ | 24,844 | $ | (40,146 | ) | -162.7 | % | |||||||
|
|
|
|
|
|
|
|
|
|
|
|||||||||||
67
Table of Contents
Net service revenue and Reimbursed out-of-pocket revenue
Net service revenue was $219.8 million for the Successor nine month period ended December 31, 2014 and $70.3 million for the Predecessor three month period ended March 31, 2014, compared to $244.3 million for the Predecessor year ended December 31, 2013. Results in the Successor nine month period ended December 31, 2014, compared to the Predecessor three month period ended March 31, 2014 benefitted from a larger number of overall active projects. Compared to the Predecessor year ended December 31, 2013, the Predecessor three month period ended March 31, 2014 also benefitted from more active projects, combined with relatively low project cancellations. Average quarterly backlog conversion was 18.7% for the Successor nine month period ended December 31, 2014 and 19.6% for the Predecessor three month period ended March 31, 2014, compared to 18.7% for the Predecessor year ended December 31, 2013.
Reimbursed out-of-pocket revenue was $28.7 million for the Successor nine month period ended December 31, 2014, $7.7 million for the Predecessor three month period ended March 31, 2014 and $28.6 million for the Predecessor year ended December 31, 2013. Reimbursed out-of-pocket revenues fluctuate significantly from period to period based on the timing of program initiation or closeout and these changes do not necessarily correlate to changes in net service revenue. The reimbursements were offset by an equal amount of reimbursed out-of-pocket expenses.
Direct costs, excluding depreciation and amortization and Reimbursed out-of-pocket expenses
Direct costs, excluding depreciation and amortization, were $117.6 million for the Successor nine month period ended December 31, 2014 and $38.8 million for the Predecessor three month period ended March 31, 2014, compared to $119.8 million for the Predecessor year ended December 31, 2013. The increase for the Successor nine month period ended December 31, 2014 and the Predecessor three month period ended March 31, 2014 was primarily due to an increase in revenue generating headcount from the Predecessor year ended December 31, 2013 to support higher project activity and new business awards. Additionally, stock based compensation increased to $4.4 million for the Successor nine month period ended December 31, 2014 and $5.4 million for the Predecessor three month period ended March 31, 2014, compared to $0.6 million for the Predecessor year ended December 31, 2013. The increase in stock based compensation was primarily driven by the acceleration of stock option vesting that occurred in advance of the Transaction and new stock based awards issued subsequent to the Transaction.
As a percentage of net service revenue, direct costs, excluding depreciation and amortization, increased to 53.5% of net service revenue for the Successor nine month period ended December 31, 2014 and 55.2% for the Predecessor three month period ended March 31, 2014, compared to 49.0% for the Predecessor year ended December 31, 2013. The primary driver of the increase as a percentage of net service revenue was the aforementioned higher stock based compensation. As a percentage of net service revenue stock based compensation was 2.0% and 7.7% for the Successor nine month period ended December 31, 2014 and Predecessor three month period ended March 31, 2014, respectively, compared to 0.3% for the Predecessor year ended December 31, 2013.
Selling, general and administrative
Selling, general and administrative expenses were $29.5 million for the Successor nine month period ended December 31, 2014 and $10.2 million for the Predecessor three month period ended March 31, 2014, compared to $35.1 for the Predecessor year ended December 31, 2013. The increase was primarily related to higher litigation costs resulting from a certain customer bad debt and an employee matter, representing $1.8 million for the Successor nine month period ended December 31, 2014 and $0.0 million for the Predecessor three month period ended March 31, 2014, compared to $0.0 million for the Predecessor year ended December 31, 2013. Further increasing selling, general and administrative expenses was higher employee stock based compensation expense of $1.0 million for the Successor nine month period ended December 31, 2014 for stock based awards issued after the Transaction and $1.9 million for the Predecessor three month period ended March 31, 2014 due to the aforementioned acceleration of stock option vesting that occurred immediately prior to the Transaction, compared to $1.4 million for the Predecessor year ended December 31, 2013.
Selling, general and administrative expenses as a percentage of net service revenue were 13.4% for the for the Successor nine month period ended December 31, 2014 and 14.5% for the Predecessor three month period ended March 31, 2014, compared to 14.4% for the Predecessor year ended December 31, 2013. Growth of net service
68
Table of Contents
revenue over for the Successor nine month period ended December 31, 2014 and Predecessor three month period ended March 31, 2014 outpaced the corresponding period increases to selling, general and administrative salary and wage growth, causing the decrease as a percent of net service revenue, compared to the Predecessor year ended December 31, 2013.
Acquisition and integration expenses
Acquisition and integration expenses were $9.3 million for the Successor nine month period ended December 31, 2014 and $12.4 million for the Predecessor three month period ended March 31, 2014 related to the Transaction. There were no acquisition and integration expenses for the Predecessor year ended December 31, 2013. The expenses in the Successor nine month period ended December 31, 2014 and Predecessor three month period ended March 31, 2014 include attorney fees, advisory fees and other professional service fees related to the Transaction.
Depreciation and Amortization
Depreciation and amortization expense was $61.0 million for the Successor nine month period ended December 31, 2014 and $7.0 million for the Predecessor three month period ended March 31, 2014, compared to $30.5 million for the Predecessor year ended December 31, 2013. The increase in depreciation and amortization was primarily related to the Transaction in which $274.7 million in finite-lived intangible assets were identified and capitalized as part of the purchase accounting adjustments as of April 1, 2014. The gross carrying value of finite-lived intangible assets prior to the transaction date was $181.7 million. The additional capitalized intangible assets caused depreciation and amortization expense to be 27.8% of net service revenue for the Successor nine month period ended December 31, 2014 and 10.0% of net service revenue for the Predecessor three month period ended March 31, 2014, compared to 12.5% of net service revenue for the Predecessor year ended December 31, 2013. The increase in depreciation and amortization expense in the Successor period ended December 31, 2014 is further driven by certain intangible assets, such as backlog and customer relationships that have an accelerated amortization that aligns to the time period over which cash flows of each respective intangible asset is generated.
Miscellaneous (expense) income, net
Miscellaneous (expense) income, net was $0.3 million of expense for the Successor nine month period and $1.2 million of income for the Predecessor three month period ended March 31, 2014, compared to $1.7 million of expense in the Predecessor year ended December 31, 2013. Changes in miscellaneous (expense) income, net were mainly attributed to foreign exchange gains or losses that arise in connection with the revaluation of short-term inter-company balances between our domestic and international subsidiaries, and gains or losses from foreign currency transactions, such as those resulting from the settlement of third-party accounts receivables and payables denominated in a currency other than the local currency of the entity making the payment.
Interest expense, net
Interest expense, net was $23.2 million for the Successor nine month period ended December 31, 2014 and $3.3 million for the Predecessor three month period ended March 31, 2014, compared to $18.0 million for the Predecessor year ended December 31, 2013. Interest expense, net was 10.5% of net service revenue for the Successor nine month period December 31, 2014 and 4.7% of net service revenue for the Predecessor three month period ended March 31, 2014, compared to 7.4% of net service revenue for the Predecessor year ended December 31, 2013. The increase in interest expense, net in the Successor nine month period ended December 31, 2014 was related to entering into the Senior Secured Credit Facilities to finance a portion of the Transaction, which increased outstanding debt, net from $143.7 million (that was paid in full at the Transaction date) in the Predecessor three month period ended March 31, 2014, to $530.0 million as of December 31, 2014.
Income tax provision (benefit)
We had an income tax benefit of $6.7 million for the Successor nine month period ended December 31, 2014, compared to a provision of $1.0 million for the Predecessor three month period ended March 31, 2014, and a provision of $14.3 million for the Predecessor year ended December 31, 2013.
The effective tax rate for the Successor nine month period ended December 31, 2014 was 31.8%, compared to negative 456.1% for the Predecessor three month period ended March 31, 2014. The change in the effective tax rates between the Successor nine month period ended December 31, 2014 and the Predecessor three month period ended March 31, 2014 was primarily due to an increase in the valuation allowance on U.S. deferred tax assets relating to a capital loss that was recorded in the Predecessor three month period ended March 31, 2014 due to the
69
Table of Contents
sale of an investment. The valuation allowance was recorded in the Predecessor three month period ended March 31, 2014 because the Company did not anticipate generating taxable gains that could be used to offset the capital loss. Another contributing factor was non-deductible stock based compensation expense recorded for the Predecessor three month period ended March 31, 2014 resulting from the acceleration of vesting of stock based awards for foreign employees that occurred prior to the Transaction.
The effective tax rate for the Predecessor three month period ended March 31, 2014 was negative 456.1%, compared to 36.5% for the Predecessor year ended December 31, 2013. The change in the effective tax rates between the Predecessor three month period ended March 31, 2014 and the Predecessor year ended December 31, 2013 was primarily due to an increase in our valuation allowance on U.S. deferred tax assets. The valuation allowance was recorded on a deferred tax asset resulting from a capital loss realized in March 2014 on the sale of an investment. The capital loss is limited to offset future taxable gains which the Company does not anticipate will be generated, resulting in a full valuation allowance. The change in the effective tax rate was also related to non-deductible stock based compensation expense related to foreign earnings due to the acceleration of stock based awards vesting in advance of the Transaction.
70
Table of Contents
Quarterly Results of Operations
The tables below present selected unaudited quarterly condensed consolidated statements of operations for our last eight completed fiscal quarters. The information for each of these quarters has been prepared on the same basis as our audited consolidated financial statements appearing elsewhere in this prospectus and, in the opinion of management, includes all adjustments of a normal recurring nature necessary for a fair presentation of the results of operations for these periods. The quarterly results of operations should be read in conjunction with our audited consolidated financial statements and related notes appearing elsewhere in this prospectus. The results for any interim period are not necessarily indicative of the results that may be expected for a full year. Additionally, our historical results are not necessarily indicative of future results.
| SUCCESSOR | ||||||||||||||||||||||||||||||||
| (In thousands, except per share data) |
THREE MONTHS ENDED JUNE 30, 2016 |
THREE MONTHS ENDED MARCH 31, 2016 |
THREE MONTHS ENDED DECEMBER 31, 2015 |
THREE MONTHS ENDED SEPTEMBER 30, 2015 |
THREE MONTHS ENDED JUNE 30, 2015 |
THREE MONTHS ENDED MARCH 31, 2015 |
THREE MONTHS ENDED DECEMBER 31, 2014 |
THREE MONTHS ENDED SEPTEMBER 30, 2014 |
||||||||||||||||||||||||
| Revenue: |
||||||||||||||||||||||||||||||||
| Service revenue, net |
$ | 92,633 | $ | 87,800 | $ | 85,681 | $ | 81,638 | $ | 76,752 | $ | 76,030 | $ | 74,476 | $ | 68,773 | ||||||||||||||||
| Reimbursed out-of-pocket revenue |
13,321 | 11,786 | 10,360 | 10,493 | 11,102 | 7,003 | 9,278 | 10,064 | ||||||||||||||||||||||||
|
|
|
|
|
|
|
|
|
|
|
|
|
|
|
|
|
|||||||||||||||||
| Total revenue |
105,954 | 99,586 | 96,041 | 92,131 | 87,854 | 83,033 | 83,754 | 78,837 | ||||||||||||||||||||||||
| Operating Expenses: |
||||||||||||||||||||||||||||||||
| Direct costs, excluding depreciation and amortization |
49,234 | 46,981 | 44,219 | 41,763 | 38,600 | 39,125 | 39,264 | 40,780 | ||||||||||||||||||||||||
| Reimbursed out-of-pocket expenses |
13,321 | 11,786 | 10,360 | 10,493 | 11,102 | 7,003 | 9,278 | 10,064 | ||||||||||||||||||||||||
| Selling, general and administrative |
14,824 | 13,509 | 18,255 | 15,295 | 11,706 | 11,742 | 10,247 | 10,382 | ||||||||||||||||||||||||
| Acquisition and integration |
— | — | — | — | — | — | (160 | ) | 50 | |||||||||||||||||||||||
| Impairment of goodwill |
— | — | 9,313 | — | — | — | — | — | ||||||||||||||||||||||||
| Depreciation |
1,793 | 1,773 | 1,658 | 1,611 | 1,537 | 1,573 | 1,753 | 1,395 | ||||||||||||||||||||||||
| Amortization |
12,668 | 12,668 | 13,125 | 15,774 | 17,042 | 17,201 | 18,879 | 18,771 | ||||||||||||||||||||||||
|
|
|
|
|
|
|
|
|
|
|
|
|
|
|
|
|
|||||||||||||||||
| Total operating expenses |
91,840 | 86,717 | 96,930 | 84,936 | 79,987 | 76,644 | 79,261 | 81,442 | ||||||||||||||||||||||||
|
|
|
|
|
|
|
|
|
|
|
|
|
|
|
|
|
|||||||||||||||||
| Income (loss) from operations |
14,114 | 12,869 | (889 | ) | 7,195 | 7,867 | 6,389 | 4,493 | (2,605 | ) | ||||||||||||||||||||||
| Other (Expense) Income, Net: |
||||||||||||||||||||||||||||||||
| Miscellaneous (expense) income, net |
(6 | ) | (935 | ) | (205 | ) | 50 | (2 | ) | (976 | ) | (240 | ) | (247 | ) | |||||||||||||||||
| Net interest (expense) income |
(5,921 | ) | (5,973 | ) | (6,547 | ) | (6,737 | ) | (6,902 | ) | (7,073 | ) | (7,184 | ) | (7,766 | ) | ||||||||||||||||
|
|
|
|
|
|
|
|
|
|
|
|
|
|
|
|
|
|||||||||||||||||
| Other (expense) income, net |
(5,927 | ) | (6,908 | ) | (6,752 | ) | (6,687 | ) | (6,904 | ) | (8,049 | ) | (7,424 | ) | (8,013 | ) | ||||||||||||||||
|
|
|
|
|
|
|
|
|
|
|
|
|
|
|
|
|
|||||||||||||||||
| Income (loss) before income taxes |
8,187 | 5,961 | (7,641 | ) | 508 | 963 | (1,660 | ) | (2,931 | ) | (10,618 | ) | ||||||||||||||||||||
| Income tax provision (benefit) |
3,225 | 2,513 | 935 | 641 | 868 | (1,601 | ) | (1,218 | ) | (3,277 | ) | |||||||||||||||||||||
|
|
|
|
|
|
|
|
|
|
|
|
|
|
|
|
|
|||||||||||||||||
| Net income (loss) |
$ | 4,962 | $ | 3,448 | $ | (8,576 | ) | $ | (133 | ) | $ | 95 | $ | (59 | ) | $ | (1,713 | ) | $ | (7,341 | ) | |||||||||||
|
|
|
|
|
|
|
|
|
|
|
|
|
|
|
|
|
|||||||||||||||||
| Per Share Data |
||||||||||||||||||||||||||||||||
| Net income (loss) per share attributable to common stockholders: |
||||||||||||||||||||||||||||||||
| Basic |
$ | 0.15 | $ | 0.11 | $ | (0.27 | ) | $ | (0.00 | ) | $ | 0.00 | $ | (0.00 | ) | $ | (0.06 | ) | $ | (0.24 | ) | |||||||||||
| Diluted |
$ | 0.15 | $ | 0.11 | $ | (0.27 | ) | $ | (0.00 | ) | $ | 0.00 | $ | (0.00 | ) | $ | (0.06 | ) | $ | (0.24 | ) | |||||||||||
| Weighted average common shares outstanding: |
||||||||||||||||||||||||||||||||
| Basic |
32,636 | 32,625 | 31,604 | 31,430 | 31,722 | 30,969 | 30,950 | 30,941 | ||||||||||||||||||||||||
| Diluted |
32,828 | 32,625 | 31,604 | 31,430 | 31,770 | 30,969 | 30,950 | 30,941 | ||||||||||||||||||||||||
71
Table of Contents
The following table presents the reconciliation of net income (loss) to EBITDA, Adjusted EBITDA, and Adjusted Net Income:
| SUCCESSOR | ||||||||||||||||||||||||||||||||
| (In thousands, except per share data) | THREE MONTHS ENDED JUNE 30, 2016 |
THREE MONTHS ENDED MARCH 31, 2016 |
THREE MONTHS ENDED DECEMBER 31, 2015 |
THREE MONTHS ENDED SEPTEMBER 30, 2015 |
THREE MONTHS ENDED JUNE 30, 2015 |
THREE MONTHS ENDED MARCH 31, 2015 |
THREE MONTHS ENDED DECEMBER 31, 2014 |
THREE MONTHS ENDED SEPTEMBER 30, 2014 |
||||||||||||||||||||||||
| EBITDA and Adjusted EBITDA: |
||||||||||||||||||||||||||||||||
| Net income (loss) as reported |
$ | 4,962 | $ | 3,448 | $ | (8,576 | ) | $ | (133 | ) | $ | 95 | $ | (59 | ) | $ | (1,713 | ) | $ | (7,341 | ) | |||||||||||
| Interest expense, net |
5,921 | 5,973 | 6,547 | 6,737 | 6,902 | 7,073 | 7,184 | 7,766 | ||||||||||||||||||||||||
| Income tax provision (benefit) |
3,225 | 2,513 | 935 | 641 | 868 | (1,601 | ) | (1,218 | ) | (3,277 | ) | |||||||||||||||||||||
| Depreciation |
1,793 | 1,773 | 1,658 | 1,611 | 1,537 | 1,573 | 1,753 | 1,395 | ||||||||||||||||||||||||
| Amortization |
12,668 | 12,668 | 13,125 | 15,774 | 17,042 | 17,201 | 18,879 | 18,771 | ||||||||||||||||||||||||
|
|
|
|
|
|
|
|
|
|
|
|
|
|
|
|
|
|||||||||||||||||
| EBITDA |
$ | 28,569 | $ | 26,375 | $ | 13,689 | $ | 24,630 | $ | 26,444 | $ | 24,187 | $ | 24,885 | $ | 17,314 | ||||||||||||||||
|
|
|
|
|
|
|
|
|
|
|
|
|
|
|
|
|
|||||||||||||||||
| Stock compensation expense: liability awards mark-to-market and CEO award(a) |
2,576 | — | 4,681 | 5,111 | (185 | ) | 173 | — | — | |||||||||||||||||||||||
| Private equity transaction related cost(b) |
— | — | — | — | — | — | (160 | ) | 50 | |||||||||||||||||||||||
| Corporate campus lease payments(c) |
(930 | ) | (930 | ) | (930 | ) | (930 | ) | (930 | ) | (930 | ) | (930 | ) | (925 | ) | ||||||||||||||||
| Litigation matters(d) |
— | — | 28 | (2,761 | ) | (391 | ) | 17 | 207 | 410 | ||||||||||||||||||||||
| Impairment of goodwill |
— | — | 9,313 | — | — | — | — | — | ||||||||||||||||||||||||
| Other transaction expenses(f) |
453 | 314 | — | — | — | — | — | — | ||||||||||||||||||||||||
|
|
|
|
|
|
|
|
|
|
|
|
|
|
|
|
|
|||||||||||||||||
| Adjusted EBITDA |
$ | 30,668 | $ | 25,759 | $ | 26,781 | $ | 26,050 | $ | 24,938 | $ | 23,447 | $ | 24,002 | $ | 16,849 | ||||||||||||||||
|
|
|
|
|
|
|
|
|
|
|
|
|
|
|
|
|
|||||||||||||||||
| Adjusted Net Income: |
||||||||||||||||||||||||||||||||
| Net income (loss) as reported |
$ | 4,962 | $ | 3,448 | $ | (8,576 | ) | $ | (133 | ) | $ | 95 | $ | (59 | ) | $ | (1,713 | ) | $ | (7,341 | ) | |||||||||||
| Amortization |
12,668 | 12,668 | 13,125 | 15,774 | 17,042 | 17,201 | 18,879 | 18,771 | ||||||||||||||||||||||||
| Stock compensation expense: liability awards mark-to-market and CEO award(a) |
2,576 | — | 4,681 | 5,111 | (185 | ) | 173 | — | — | |||||||||||||||||||||||
| Private equity transaction related cost(b) |
— | — | — | — | — | — | (160 | ) | 50 | |||||||||||||||||||||||
| Corporate campus lease payments—principal portion(c) |
(375 | ) | (369 | ) | (362 | ) | (354 | ) | (347 | ) | (229 | ) | (930 | ) | (201 | ) | ||||||||||||||||
| Litigation matters(d) |
— | — | 28 | (2,761 | ) | (391 | ) | 17 | 207 | 410 | ||||||||||||||||||||||
| Impairment of goodwill |
— | — | 9,313 | — | — | — | — | — | ||||||||||||||||||||||||
| Deferred financing fees(e) |
673 | 672 | 679 | 680 | 673 | 655 | 681 | 710 | ||||||||||||||||||||||||
| Other transaction expenses(f) |
453 | 314 | — | — | — | — | — | — | ||||||||||||||||||||||||
| Income tax effect of adjustments (39.0%) |
(6,238 | ) | (5,181 | ) | (10,711 | ) | (7,196 | ) | (6,549 | ) | (6,949 | ) | (7,284 | ) | (7,699 | ) | ||||||||||||||||
|
|
|
|
|
|
|
|
|
|
|
|
|
|
|
|
|
|||||||||||||||||
| Adjusted Net Income |
$ | 14,719 | $ | 11,552 | $ | 8,177 | $ | 11,121 | $ | 10,338 | $ | 10,809 | $ | 9,680 | $ | 4,700 | ||||||||||||||||
|
|
|
|
|
|
|
|
|
|
|
|
|
|
|
|
|
|||||||||||||||||
| Diluted Adjusted Net Income per share |
$ | 0.45 | $ | 0.35 | $ | 0.26 | $ | 0.35 | $ | 0.33 | $ | 0.35 | $ | 0.31 | $ | 0.15 | ||||||||||||||||
| Diluted average common shares outstanding |
32,828 | 32,625 | 31,604 | 31,430 | 31,770 | 30,969 | 30,950 | 30,941 | ||||||||||||||||||||||||
| (a) | Consists of period end mark-to-market fair value adjustments associated with liability classified awards and the impact of a one-time stock based compensation award to our Chief Executive Officer and founder. Future stock based awards activity are expected to be classified as equity for accounting purposes and will not be subject to period ending fair value adjustments. |
| (b) | Represents attorney fees, advisory fees and other professional service fees incurred in connection with the Transaction. |
| (c) | Represents cash rental payments on two corporate headquarter buildings that are accounted for as deemed assets and subject to depreciation expense over the life of the lease. Payments made for these leases are accounted for with a principal portion and an interest portion, consistent with deemed landlord liability accounting. For purposes of Free Cash Flow, the interest portion of these payments is included in net cash provided by operating activities in our statement of cash flows. The principal portion is reflected as a financing activity in our statement of cash flows. These adjustments for purposes of arriving at Adjusted EBITDA, Adjusted Net Income and Free Cash Flow have the effect of presenting these leases consistently with all other office lease rentals that we have globally. |
| (d) | Represents non-recurring costs and recovery related to a customer bad debt and non-recurring expenses related to the settlement of an employment related matter. |
| (e) | Represents amortization of the discount and issuance costs deferred on the consolidated balance sheet associated with the issuance of the Senior Secured Credit Facility. |
| (f) | Represents advisory costs and other fees related to this offering. |
72
Table of Contents
Liquidity and Capital Resources
We assess our liquidity in terms of our ability to generate cash to fund our operating, investing and financing activities. Our principal sources of liquidity are operating cash flows and funds available for borrowing under our Senior Secured Revolving Credit Facility (as defined below). As of June 30, 2016, we had cash and cash equivalents of $17.0 million, including approximately $3.4 million of restricted cash, primarily related to advanced payments received pursuant to certain sponsor contracts. Approximately $5.8 million of our cash and cash equivalents, none of which was restricted, was held by our foreign subsidiaries as of June 30, 2016. Additionally, as of June 30, 2016, we had $60.0 million available for borrowing under our Senior Secured Revolving Credit Facility.
Our expected primary cash needs on both a short and long-term basis are for investment in operational growth, capital expenditures, payment of debt and other general corporate purposes. We have historically funded our operations and growth, including acquisitions, with cash flow from operations and borrowings under our credit facilities. We expect to continue expanding our operations through organic growth and selective strategic bolt-on acquisitions and investments. We expect these activities will be funded from existing cash, cash flow from operations and, if necessary, borrowings under our existing or future credit facilities. We have deemed that foreign earnings will be indefinitely reinvested and therefore we have not provided taxes on these earnings. While we do not anticipate the need to repatriate these foreign earnings for liquidity purposes given our cash flows from operations and available borrowings under existing and future credit facilities, we would incur taxes on these earnings if the need for repatriation due to liquidity purposes arises.
We believe that our sources of liquidity and capital will be sufficient to finance our investment in operational growth, capital expenditures, payment of debt, selective strategic bolt-on acquisitions, other investments, additional expenses we expect to incur as a public company and other general corporate needs for the next 12 months and on a longer-term basis. However, we cannot assure you that our business will generate sufficient cash flow from operations, or that future borrowings will be available to us under our Senior Secured Credit Facilities or otherwise, in an amount sufficient to fund our liquidity needs. If our cash flows and capital resources are insufficient to service our indebtedness, we may be forced to reduce or delay capital expenditures, sell assets, seek additional capital or restructure or refinance our indebtedness. These alternative measures may not be successful and may not permit us to meet our scheduled debt service obligations. Our ability to restructure or refinance our debt will depend on the condition of the capital markets and our financial condition at such time. Any refinancing of our debt could be at higher interest rates and may require us to comply with more onerous covenants, which could further restrict our business operations. In addition, the terms of existing or future debt agreements may restrict us from adopting some of these alternatives. In the absence of such operating results and resources, we could face substantial liquidity problems and might be required to dispose of material assets or operations to meet our debt service and other obligations. We may not be able to consummate those dispositions for fair market value or at all, and any proceeds that we could realize from any such dispositions may not be adequate to meet our debt service obligations then due. See “Risk Factors—Risks Relating to our Indebtedness—We may not be able to generate sufficient cash to service all of our indebtedness, and may be forced to take other actions to satisfy our obligations under our indebtedness that may not be successful.”
73
Table of Contents
Discussion of Cash Flows
| SUCCESSOR | PREDECESSOR | |||||||||||||||||||||||
| Cash Flows (In thousands) | SIX MONTHS ENDED JUNE 30, 2016 |
SIX MONTHS ENDED JUNE 30, 2015 |
YEAR ENDED DECEMBER 31, 2015 |
NINE MONTH PERIOD FROM APRIL 1, 2014 THROUGH DECEMBER 31, 2014 |
THREE MONTH PERIOD FROM JANUARY 1, 2014 THROUGH MARCH 31, 2014 |
YEAR ENDED DECEMBER 31, 2013 |
||||||||||||||||||
| Net cash provided by operating activities |
$ | 19,982 | $ | 26,271 | $ | 84,117 | $ | 62,539 | $ | 12,807 | $ | 98,142 | ||||||||||||
| Net cash used in investing activities |
(5,653 | ) | (2,658 | ) | (6,432 | ) | (907,640 | ) | (827 | ) | (4,472 | ) | ||||||||||||
| Net cash (used in) provided by financing activities |
(15,678 | ) | (65,702 | ) | (116,489 | ) | 900,171 | (17,968 | ) | (95,851 | ) | |||||||||||||
| Effect of exchange rates on cash and cash equivalents |
143 | (95 | ) | (601 | ) | (785 | ) | (25 | ) | 159 | ||||||||||||||
| Increase (decrease) in cash and cash equivalents |
(1,206 | ) | (42,184 | ) | (39,405 | ) | 54,285 | (6,013 | ) | (2,022 | ) | |||||||||||||
Cash Flows from Operating Activities
Cash flows from operations are driven mainly by net income and net movement in accounts receivable and unbilled, net, advanced billings, pre-funded liabilities, accounts payable and accrued expenses. Accounts receivable and unbilled, net, advanced billings and pre-funded liabilities fluctuate on a regular basis as we perform our services, bill our customers and ultimately collect on those receivables. We attempt to negotiate payment terms in order to provide for payments prior to or soon after the provision of services, but this timing of collection can vary significantly on a period by period comparative basis.
Net cash provided by operating activities was $20.0 million for the six months ended June 30, 2016 consisting of net income of $8.4 million. Adjustments to reconcile net income to net cash provided by operating activities were $33.8 million, primarily related to amortization of intangibles of $25.3 million, depreciation of $3.6 million and stock based compensation expense of $4.3 million. Changes in operating assets and liabilities used $22.3 million in operating cash flows and were primarily driven by increased accounts receivable and unbilled, net of $24.8 million, increased prepaid expenses and other assets of $8.5 million primarily related to federal tax payments and decreased accounts payable of $2.1 million, offset by increased pre funded study costs of $2.4 million and advanced billings of $15.0 million.
Net cash provided by operating activities was $26.3 million for the six months ended June 30, 2015 consisting of net income of less than $0.1 million. Adjustments to reconcile net income to net cash provided by operating activities were $37.3 million, primarily related to amortization of intangibles of $34.2 million, depreciation of $3.1 million and stock based compensation expense of $4.9 million, offset by $6.5 million of benefit from deferred taxes. Changes in operating assets and liabilities used $11.0 million in operating cash flows and were primarily driven by lower accrued expenses of $2.8 million related to incentive compensation payments and $6.5 million from a decrease in advanced billings offset by a decrease in accounts receivable and unbilled, net of $6.7 million.
Net cash provided by operating activities was $84.1 million for the Successor year ended December 31, 2015, consisting of a net loss of $(8.7) million. Adjustments to reconcile net loss to net cash provided by operating activities were $90.9 million, primarily related to amortization of intangibles of $63.1 million, depreciation of $6.4 million, impairment of goodwill of $9.3 million and stock based compensation expense of $22.3 million, offset by a tax benefit of $12.7 million. Changes in operating assets and liabilities provided $1.9 million in operating cash flows and were driven primarily by an increase in pre-funded cash and a decrease in prepaid assets while being offset by a decrease in advanced billings and an increase in restricted cash.
74
Table of Contents
Net cash provided by operating activities was $62.5 million for the Successor nine month period ended December 31, 2014, consisting of a net loss of $(14.3) million. Adjustments to reconcile net loss to net cash provided by operating activities were $58.7 million, primarily related to amortization of intangibles of $56.4 million. Changes in operating assets and liabilities over the period provided $18.1 million in operating cash flows and were driven primarily by an increase in accrued expenses related to employee incentive compensation of $11.0 million and an increase in advanced billings of $6.0 million.
Net cash provided by operating activities was $12.8 million for the Predecessor three month period ended March 31, 2014, consisting of a net loss of $(1.2) million. Adjustments to reconcile net loss to net cash provided by operating activities were $14.3 million, primarily related to stock based compensation expense of $7.3 million as a result of accelerated vesting of stock awards during this period, along with amortization of $1.8 million and depreciation of $5.2 million in the period. Changes in operating assets and liabilities over the period used $0.3 million in operating cash flows and were driven primarily by increases in accounts receivable and prepaid expense balances and decreases in accrued expenses as a result of incentive compensation payments in the period offset by an increase in accounts payable.
Net cash provided by operations was $98.1 million for the Predecessor year ended December 31, 2013, consisting of net income of $24.8 million. Adjustments to reconcile net income to net cash provided by operating activities were $44.4 million, primarily related amortization of intangibles of $23.9 million, depreciation of $6.7 million, loss on the sale of an equity investment of $2.3 million and provision for taxes of $6.0 million. Changes in operating assets and liabilities over the Predecessor year ended December 31, 2013 provided $28.9 million in operating cash flows and were driven primarily by increases in advanced billings of $10.7 million, increases of accrued expenses of $8.3 million and decreases to prepaid expense balances of $4.8 million.
Cash Flows from Investing Activities
Net cash used in investing activities was $5.7 million for the Successor six months ended June 30, 2016, primarily consisting of property and equipment expenditures.
Net cash used in investing activities was $2.7 million for the Successor six months ended June 30, 2015, primarily consisting of property and equipment expenditures.
Net cash used in investing activities was $6.4 million for the Successor year ended December 31, 2015 primarily consisting of capital expenditures relating to property and equipment purchases.
Net cash used in investing activities was $907.6 million in the Successor nine month period ended December 31, 2014. The cash used in investing activities was primarily related to the Transaction, which we completed for $903.5 million net of cash received in the Successor nine month period ended December 31, 2014. Cash used in the period for property and equipment purchases was $4.2 million.
Net cash used in investing activities was $0.8 million in the Predecessor three month period ended March 31, 2014 consisting of property and equipment expenditures.
Net cash used in investing activities was $4.5 million in the Predecessor year ended December 31, 2013 consisting of property and equipment expenditures.
Cash Flows from Financing Activities
Net cash used in financing activities was $15.7 million for the Successor six months ended June 30, 2016, primarily consisting of a $15.0 million principal payment on our Senior Secured Term Loan Facility.
Net cash used in financing activities was $65.7 million for the Successor six month period ended June 30, 2015, primarily related to $65.0 million in principal payments on our Senior Secured Term Loan Facility.
Net cash used in financing activities was $116.5 million in the Successor year ended December 31, 2015, primarily related to $116.1 million in principal payments on our Senior Secured Term Loan Facility.
Net cash provided in financing activities was $900.2 million for the Successor nine month period ended December 31, 2014. The cash provided was primarily related to $414.0 million from the issuance of common stock and $511.8 million, net of debt issuance costs, from the issuance of debt under our Senior Secured Term Loan Facility on April 1, 2014 as part of the Transaction. Debt payments under the Senior Secured Term Loan Facility offset total cash provided by $25.2 million in the period.
75
Table of Contents
Net cash used in financing activities was $18.0 million in the Predecessor three month period ended March 31, 2014, primarily related to $23.1 million utilized to repay our then outstanding credit facility as of March 31, 2014. This amount was offset by $5.3 million of excess tax benefit received from the acceleration of vesting related to outstanding stock based compensation awards in conjunction with the Transaction.
Net cash used in financing activities was $95.9 million in the Predecessor year ended December 31, 2013, primarily related to the pay down of debt.
Indebtedness
In conjunction with the Transaction, on April 1, 2014, we entered into a new credit agreement, or the Senior Secured Credit Agreement, which provided for a $530.0 million term loan, or the Senior Secured Term Loan Facility, and a $60.0 million revolving credit facility, or the Senior Secured Revolving Credit Facility, and, together with the Senior Secured Term Loan Facility, the Senior Secured Credit Facilities. The Senior Secured Term Loan Facility expires in April 2021 and the Senior Secured Revolving Credit Facility expires in April 2019. The Senior Secured Credit Facilities proceeds were utilized to finance a portion of the Transaction, which upon consummation resulted in the extinguishment of our previously existing $335.0 million credit agreement that consisted of a $285.0 million term loan and a $50.0 million revolving credit agreement, of which $143.7 million was outstanding at the time of extinguishment. The Senior Secured Credit Facilities are guaranteed by the Company and certain of its subsidiaries.
From April 1, 2014 to the date on which the first compliance certificate accompanying financials was delivered under the Senior Secured Credit Facilities, borrowings under the Senior Secured Credit Facilities bore interest at our option, equal to a Eurocurrency rate plus a margin of 4.00% and 3.75%, or a base rate plus a margin of 3.00% and 2.75% for the Senior Secured Term Loan Facility and Senior Secured Revolving Credit Facility, respectively. The Eurocurrency rate is based on LIBOR for U.S. dollar deposits for loans denominated in dollars, EURIBOR for Euros deposits for loans denominated in Euros and the offer rate for any other currencies for loans denominated in such other currencies and, in each case, is subject to a 1.00% floor. The base rate is defined as the highest of (a) the Federal Funds Rate on such day plus 1⁄2 of 1.00%, (b) the Prime Lending Rate on such day, (c) the Adjusted Eurocurrency Rate for Loans denominated in U.S. dollars published on such day for an Interest Period of one month plus 1.00% and (d) 2.00%. At our discretion, we may choose interest periods of one, two, three or six months, or the Eurocurrency term, which determines the interest rate to be applied. Interest on the Eurocurrency rate loan continues to be payable at the end of the selected Eurocurrency term and interest on the base rate tranche of the Senior Secured Term Loan Facility is payable quarterly in conjunction with any required principal payments.
Since the delivery of the first compliance certificate accompanying financials under the Senior Secured Credit Facilities, the borrowings under the Senior Secured Credit Facilities bear interest at a rate per annum equal to an applicable spread, within two pricing tiers that are determined upon achievement towards a defined total net debt to consolidated EBITDA leverage ratio, plus a Eurocurrency or base rate. The first pricing tier lowers the Eurocurrency and base rate margin spreads to 3.75% and 2.75% and 3.50% and 2.50% for the Senior Secured Term Loan Facility and Senior Secured Revolving Credit Facility, respectively, while the second pricing tier retains the spreads applicable to the initial interest periods described in the previous paragraph. The Eurocurrency rate is subject to a minimum floor of 1.00% and the base rate is subject to a floor of 2.00%. As of June 30, 2016, we were subject to an interest rate of 4.75% for the Senior Secured Term Loan Facility, which represents the minimum 1.00% Eurocurrency floor plus the first tier pricing spread of 3.75%.
We also pay commitment fees on a quarterly basis at an annual rate of 0.50% of the unused borrowings under the Senior Secured Revolving Credit Facility, which is recorded as a component of interest expense, net in the consolidated statements of operations. The commitment fee is subject to a pricing level reduction to 0.375% when we achieve a funded first lien debt to consolidated EBITDA (as defined under the Senior Secured Credit Facilities) ratio of equal to or less than 4.25:1.00 on any given date. As of June 30, 2016, we achieved the targeted requirement.
The Senior Secured Term Loan Facility is subject to quarterly amortization equal to 0.25% of the initial aggregate principal amount, with the balance due at final maturity. The following amounts are required to be prepaid in addition to quarterly installment payments and will be applied to repay the Senior Secured Term Loan Facility, subject to certain thresholds, carve-outs, exceptions and reinvestment rights: (a) 50% of our annual Excess Cash
76
Table of Contents
Flow (as defined under the Senior Secured Credit Facilities) commencing with the fiscal year ended December 31, 2015 (or 25% or 0% of our annual Excess Cash Flow thereafter if we achieve a funded first lien debt to consolidated EBITDA ratio of equal to or less than 4.25:1.00 or 3.75:1.00, respectively); (b) 100% of the net cash proceeds of insurance proceeds of a condemnation award in respect of any equipment, fixed assets or real property subject to certain reinvestment rights; (c) 100% of the net cash proceeds of any occurrence of indebtedness by us or certain of our subsidiaries; and (d) 100% of the net cash proceeds of certain non-ordinary course asset sales or dispositions of property by us or certain subsidiaries subject to certain reinvestment rights. In addition to the mandatory payments above, we may voluntarily repay the outstanding Senior Secured Term Loan Facility without premium or penalty, subject to certain restrictions. As of June 30, 2016, we had made principal payments of $155.0 million, which was $144.4 million ahead of originally scheduled requirements. This amount has satisfied all required quarterly principal installment payments over the term of the Senior Secured Term Loan Facility.
The Senior Secured Credit Agreement details various covenants with which we are required to comply. These covenants, as defined in the Senior Secured Credit Agreement, among other things, limit our ability and the ability of our restricted subsidiaries to, with certain exceptions:
| n | create, incur or assume any lien upon any of our property, assets or revenue; |
| n | make or hold certain investments; |
| n | incur or assume any indebtedness; |
| n | merge, dissolve, liquidate or consolidate with or into another person; |
| n | make certain dispositions of property or other assets (including sale leaseback transactions); |
| n | declare or make certain restricted payments, including dividends; |
| n | enter into certain transactions with affiliates; |
| n | prepay subordinated debt; |
| n | enter into burdensome agreements; |
| n | engage in any material line of business substantially different from our currently conducted business; or |
| n | change our fiscal year. |
In addition, if we have drawn greater than 30% of the commitments under the Senior Secured Revolving Credit Facility as of the last date of any quarter, then we are required to report compliance with a financial covenant that is tested at the end of such quarter. This financial covenant requires us to maintain a funded first lien net debt to consolidated EBITDA leverage ratio of less than or equal to 8.00:1.00 for any fiscal quarter ending on or prior to March 31, 2016 and 7.50:1.00, thereafter. As of June 30, 2016, we maintained a net debt to consolidated EBITDA leverage ratio, as defined under the Senior Secured Credit Facilities, of 2.95:1.00. As of June 30, 2016, we were in compliance with all covenants under our Senior Secured Credit Agreement.
A breach of these covenants, or the occurrence of other Events of Default (as defined in the Senior Secured Credit Agreement) could result in an event of default, which would permit or require the principal outstanding under the Senior Secured Credit Facilities to become or to be declared due and payable. Occurrences other than the breach of covenants that are considered Events of Default include, but are not limited to, (a) non-payment of principal or interest, (b) certain bankruptcy related events, (c) cross defaults with certain other indebtedness, (d) defaults on monetary judgement orders, (e) certain ERISA events, (f) actual or asserted invalidity of any guarantee or security document and (g) change in control. Our ability to satisfy these covenant requirements or prevent Events of Default in future periods will depend on occurrences or events that may be beyond our control, and therefore, there is no guarantee that we will be able to prevent these occurrences.
All of our obligations under the Senior Secured Credit Facilities are guaranteed by us and our material, wholly owned subsidiaries, with certain exceptions, including where providing such guarantees is not permitted by law, regulation or contract or would result in adverse tax consequences. All of our obligations under the Senior Secured Credit Facilities are secured, subject to certain permitted liens and other exceptions, by substantially all of the assets of the borrower and each guarantor, included, but not limited to, a perfected pledge of all of the capital stock issued by us and each guarantor and, subject to certain exceptions, perfected security interests in substantially all other tangible and intangible assets of us and each guarantor.
77
Table of Contents
As of June 30, 2016, we had total indebtedness of $364.0 million, substantially all of which was attributed to outstanding borrowings on the Senior Secured Term Loan Facility. There were no outstanding borrowings under the Senior Secured Revolving Credit Facility as of June 30, 2016. In addition, as of June 30, 2016, we had less than $0.1 million in letters of credit outstanding related to certain operating lease obligations, which are secured by the Senior Secured Revolving Credit Facility.
Contractual Obligations and Commercial Commitments
We have various contractual obligations, which are recorded as liabilities in our consolidated financial statements. Other items, such as operating lease obligations, are not recognized as liabilities in our consolidated financial statements but are required to be disclosed. The following table summarizes our future payments for all contractual obligations and commercial commitments for the years subsequent to the Successor year ended December 31, 2015:
| PAYMENTS DUE BY PERIOD | ||||||||||||||||||||
| Contractual Obligations (In thousands) | TOTAL | LESS THAN 1 YEAR |
1-3 YEARS | 3-5 YEARS |
MORE THAN 5 YEARS |
|||||||||||||||
| Long-term debt obligations |
$ | 390,000 | $ | — | $ | — | $ | — | $ | 390,000 | ||||||||||
| Interest on long-term debt |
100,045 | 19,206 | 38,023 | 38,076 | 4,740 | |||||||||||||||
| Capital lease obligations |
62 | 62 | — | — | — | |||||||||||||||
| Operating lease obligations |
30,291 | 6,160 | 9,660 | 6,840 | 7,631 | |||||||||||||||
| Deemed landlord liabilities |
47,378 | 3,757 | 7,723 | 7,925 | 27,973 | |||||||||||||||
| Management fees |
250 | 250 | — | — | — | |||||||||||||||
|
|
|
|
|
|
|
|
|
|
|
|||||||||||
| Total |
$ | 568,026 | $ | 29,435 | $ | 55,406 | $ | 52,841 | $ | 430,344 | ||||||||||
|
|
|
|
|
|
|
|
|
|
|
|||||||||||
The interest payments on long-term debt in the above table are based on interest rates in effect as of December 31, 2015.
The management fee represents fees paid to Cinven. This fee is paid annually in equal quarterly installments. The management fee remains in effect through 2024, unless amended or terminated by mutual agreement. However, this agreement will terminate upon the consummation of this offering. Due to the uncertainty of the term, we have only included one year of management fees in the above table.
We have recorded a tax liability for unrecognized benefits for uncertain tax positions of $2.6 million, which has not been included in the above table due to the uncertainties in the timing of settlement of the income tax positions.
We are party to certain vendor contracts related to clinical services that if cancelled may require payment for services performed and potentially additional services required to protect safety of subjects. The value of these potential wind-down provisions is generally borne by our customers and is not practical to estimate.
Off-Balance Sheet Arrangements
Off balance sheet arrangements refer to any transaction, agreement or other contractual arrangement to which an entity not consolidated under our entity structure exists, where we have an obligation arising under a guarantee contract, derivative instrument or variable interest or a retained or contingent interest in assets transferred to such an entity or similar arrangement that serves as credit, liquidity or market risk support for such assets. We have no off balance sheet arrangements currently.
Critical Accounting Policies and Estimates
The preparation of financial statements in accordance with generally accepted accounting principles in the United States of America, or U.S. GAAP, requires us to make a variety of decisions which affect reported amounts and related disclosures, including the selection of appropriate accounting principles and the assumptions on which to
78
Table of Contents
base accounting estimates. In reaching such decisions, we apply judgment based on our understanding and analysis of the relevant circumstances, including our historical experience and other assumptions. Actual results could differ from our estimates. We are committed to incorporating accounting principles, assumptions and estimates that promote the representational faithfulness, verifiability, neutrality and transparency of the accounting information included in the financial statements.
Net Service Revenue Recognition
We generally enter into contracts with customers to provide services ranging in duration from a few months to several years. The contract terms generally provide for payments based on a fixed-fee or unit-of-service arrangement. Revenue on these arrangements is recognized when there is persuasive evidence of an arrangement, the service offering has been delivered to the customer, the arrangement consideration is determinable and the collection of the fees is reasonably assured.
A majority of our contracts provide for services based on a fixed-fee arrangement, in which revenue is recognized based on the proportional performance methodology. Under this methodology, revenue recognition is determined by assessing the proportion of performance completed or delivered to date compared to total specific measures to be delivered or completed under the terms of the arrangement. The measures utilized to assess performance are specific to the service provided, and the Company generally compares the ratio of hours completed to the total estimated hours necessary to complete the contract. A detailed project budget by hours is developed based on many factors, including, but not limited to, the scope of the work, the complexity of the study, the participating geographic locations and the Company’s historical experience. We believe the reporting and estimation of hours is the best available measure of progress on many of the services provided and best reflects the pattern in which obligations to customers are fulfilled. To assist with the estimation of hours expected to complete a project, regular contract reviews for each project are performed in which performance to date is compared to the most current estimate to complete assumptions. The reviews include an assessment of effort incurred to date compared to expectations based on budget assumptions and other circumstances specific to the project. The total estimated hours necessary to complete a fixed-fee contract, based on these reviews, is updated and any revisions to the existing hours budget result in cumulative adjustments to the amount of revenue recognized in the period in which the revisions are identified. Because of the uncertainties inherent in estimating the hours necessary to fulfill contractual obligations, it is possible that estimates may change in the near term, resulting in a material change in revenue reported.
Fixed-fee contracts provide for pricing modifications upon scope of work changes. We recognize revenue related to work performed in connection with scope changes when the underlying services are performed, a binding contractual commitment has been executed with the customer and collectability is reasonably assured. If our customers do not agree to price renegotiation upon changes in our scope of work, we could be exposed to cost overruns and reduced contract profitability. Costs are not deferred in anticipation of contracts being awarded or amendments being finalized, but are expensed as incurred.
For unit-of–service arrangements, we recognize revenue in the period in which the unit is delivered. Service unit elements largely consist of various project management, consulting and analytical testing services.
Many contractual arrangements combine multiple service elements. For these contracts, arrangement consideration is allocated to identified units of accounting based on the relative selling price of each unit of account. The best evidence of selling price of a unit of accounting is vendor specific objective evidence, or VSOE, which is the price charged when the deliverable is sold separately. When VSOE is not available to determine selling price, management uses relative third party evidence, if available. When neither VSOE nor third party evidence of selling price exists, we use the best estimate of selling price considering all relevant information that is available without undue cost and effort.
Most contracts are terminable by the customer, either immediately or according to advance notice terms specified within the contracts. These contracts require payment of fees to us for services rendered through the date of termination and may require payment for subsequent services necessary to conclude the study or close out the contract. Final settlement amounts are typically subject to negotiation with the customer. These amounts are included in net service revenue when realization is reasonably assured.
79
Table of Contents
We occasionally enter into volume rebate arrangements with customers that provide for rebates if certain specified spending thresholds are met. These rebate obligations are recorded as a reduction of revenue when it appears probable that the customer will earn the rebates and the related amount is estimable.
We record revenue net of any tax assessments by governmental authorities that are imposed and concurrent with specific revenue generating transactions.
Allowance for Doubtful Accounts
We grant credit terms to our customers prior to signing a service contract and monitor creditworthiness on an ongoing basis. We assess ongoing collectability by customer through a variety of performance indicators including age of billed receivable, billing type, knowledge of available funding and other information available through internal research. A large percentage of our customers are small biopharmaceutical companies that rely on funding from investors to finance their operations. This creates a heightened risk related to their creditworthiness. The Company maintains an allowance for doubtful accounts for accounts receivable specifically identified that are at risk of not being collected.
Uncollectible accounts receivable are written off only after all reasonable collection efforts have been exhausted. Moreover, in many cases the Company requires advance payment from its customers for a portion of the study contract price upon the signing of a service contract. These advance payments are deferred and recognized as revenue as services are performed.
Long-Lived Assets, Goodwill and Indefinite Lived Intangible Assets
Tangible Assets
Long-lived assets, primarily property and equipment and finite-lived intangible assets, are reviewed for impairment and the reasonableness of the estimated useful lives whenever events or changes in circumstances indicate that the carrying amounts of the assets may not be recoverable or that a change in useful life may be appropriate. Recoverability for long-lived assets is determined by comparing the forecasted undiscounted cash flows of the operation to which the assets relate to the carrying amount of the assets. If the undiscounted cash flows are less than the carrying amount of the assets, then the Company reduces the carrying value of the assets to estimated fair values, which are primarily based upon forecasted discounted cash flows. Fair value of long-lived assets is determined based on a combination of discounted cash flows and market multiples.
Goodwill
Goodwill represents the excess of purchase price over the fair value of net assets acquired in business combinations. As a result of the Transaction, we recognized $670.3 million of goodwill that was allocated to and recorded at the reporting unit level. Our reporting units are Phase II-IV clinical research services, or Phase II-IV, Laboratories and Clinics.
The carrying value of goodwill is reviewed at least annually for impairment, or as indicators of potential impairment are identified, at the reporting unit level. We perform our annual goodwill impairment test during the fourth quarter each year, utilizing the quantitative two step model defined by accounting guidance which governs such assessments. The first step involves the comparison of each of our reporting unit carrying values, inclusive of assigned goodwill, to their respective estimated fair values. If a reporting unit carrying value exceeds estimated fair value, a second step requiring us to calculate the implied reporting unit goodwill fair value is performed. The implied fair value of goodwill is determined by performing a hypothetical purchase price allocation of reporting unit fair value to the reporting units identified assets and liabilities. The resulting implied goodwill fair value is compared to carrying value to determine the extent of impairment, if any exists. Reporting unit fair value is estimated using a combination of the income approach, a discounted cash flow analysis, and the market approach, utilizing the guideline company method. The reporting unit’s discounted cash flow analysis requires significant management judgment with respect to net service revenue, direct costs, excluding depreciation and amortization, selling, general and administrative expenses, capital expenditures and the selection and use of an appropriate discount rate. The projected revenue and expense assumptions and capital expenditures are based on our annual and long-term business plans. Discount rates reflect market-based estimates of the risks associated with the projected cash flows directly resulting from the use of those assets in operations.
80
Table of Contents
In conjunction with the 2015 fourth quarter annual assessment of goodwill, we determined that goodwill related to our Clinics reporting unit was impaired and we recognized an impairment charge of $9.3 million, which represents 100% of the goodwill that had been allocated to this reporting unit. This impairment was identified during the annual impairment assessment in the fourth quarter of 2015 when we updated our forecasted discounted cash flows related to the reporting unit to reflect operating results that lagged prior forecasted results. For our Phase II-IV and Laboratories reporting units, the reporting units’ fair values significantly exceeded their respective carrying values including allocated goodwill.
This process is inherently subjective and dependent upon estimates and assumptions we make. In determining our expected future cash flows, we assume that we will continue to acquire and convert new business to contract, execute on these contracts with reasonable profit, collect customer receivables and thus generate positive cash flows. However, future declines in the operating results of these reporting units could indicate a need to reevaluate the fair value of these components under accounting guidance governing goodwill and may ultimately result in future impairment. We continue to monitor for any potential indicators of impairment.
Intangible Assets
The Company has an indefinite lived intangible asset related to its trade name valued at $31.6 million. The carrying value of the trade name asset is reviewed at least annually for impairment, or as indicators of potential impairment are identified. The Company performs its annual impairment test in the fourth quarter each year in conjunction with its annual assessment of goodwill. The assessment consists of comparing the carrying value of the indefinite lived intangible asset to its estimated fair value, utilizing the relief from royalty method, an income approach valuation. The relief from royalty method requires management judgment with respect to projected net service revenue, profitability and growth and the selection and use of an appropriate discount rate. There was no indication of impairment related to the trade name asset based on the fourth quarter 2015 assessment.
Our assessment of impairment charges on any assets classified currently as having indefinite lives could change in future periods if certain events were to occur, including, but not limited to, the following: a significant change in business results, an increase in our discount rates due to a change in our weighted average cost of capital, a decrease in growth rates, economic deterioration that is more severe or longer in duration than anticipated or another significant economic event.
Finite-lived intangible assets consist mainly of the value assigned to customer relationships, backlog and developed technologies. Finite-lived intangible assets are amortized straight-line or using an accelerated method over their estimated useful lives, which range in term from 17 months to 15 years. Amortization expense recognized related to finite lived intangible assets was $25.3 million for the Successor six months ended June 30, 2016, $34.2 million for the Successor six months ended June 30, 2015, $63.1 million for the Successor year ended 2015, $56.4 million for Successor nine month period ended December 31, 2014, $5.2 million for the Predecessor three month period ended March 31, 2014 and $23.9 million for the Predecessor year ended December 31, 2013.
Income Taxes
We are subject to income taxes in the United States and numerous foreign jurisdictions. Significant judgement is required in the forecasting of taxable income using historical and projected future operating results in determining our provision for income taxes and the related assets and liabilities. The provision for income taxes includes income taxes paid, currently payable and receivable, and deferred taxes.
We record deferred tax assets and liabilities based on temporary differences between the financial statement bases and tax bases of assets and liabilities. Deferred tax assets are recorded for tax benefit carryforwards using tax rates anticipated to be in effect in the year in which temporary differences are expected to reverse. If it does not appear more likely than not that the full value of a deferred tax asset will be realized, the Company records a valuation allowance against the deferred tax asset, with an offsetting charge to the Company’s income tax provision or benefit.
The recoverability of our deferred tax assets is estimated based on consideration of all available positive and negative evidence, including, but not limited to, our ability to generate a sufficient level of future taxable income, reversals of deferred tax liabilities (other than those with an indefinite reversal period), tax planning strategies and recent financial performance. The assessment of recoverability is performed on a jurisdiction by jurisdiction basis. Based on the analysis of the above factors, we determined that as of June 30, 2016 and December 31, 2015 a valuation
81
Table of Contents
allowance in the amount of $1.0 million was required relating to certain foreign operating loss carryforwards, a U.S. capital loss carryforward and U.S. state and local tax credits and carryforwards. Differences in actual results compared to our estimates and changes in our assumptions could result in an adjustment to the valuation allowance in the future and would generally impact earnings or other comprehensive income depending on the nature of the respective deferred asset for which the valuation allowance exists.
We have recognized certain liabilities, including penalties and interest in the amount of $2.6 million for the Successor year ended December 31, 2015, within other long-term liabilities on the consolidated balance sheets. These relate to uncertain tax positions that are subject to various assumptions and judgement. Liabilities for these uncertain tax positions are assessed on a position by position basis. The calculation of these liabilities involves dealing with uncertainties in the application of complex tax regulations in both domestic and foreign jurisdictions. These positions may be subject to audit and review by tax authorities, and may result in future taxes, interest and penalties if we are unsuccessful in defending our positions. If the calculation of liability related to uncertain tax positions proves to be more or less than the ultimate assessment, a tax expense or benefit to expense, respectively would result.
As of June 30, 2016 and December 31, 2015, as a result of an updated analysis of future cash needs in the United States and opportunities for investment outside the United States, we assert that all foreign earnings will be indefinitely reinvested and therefore we have not provided taxes on these earnings. These undistributed earnings of foreign subsidiaries will support future growth in foreign markets and maintain current operating needs of foreign locations. We will continue to monitor our assertion related to investment of foreign earnings.
Stock Based Compensation
We have stock based compensation plans in which we issue stock based awards to employees and directors in the form of vested common shares, stock options and restricted stock awards (RSAs and RSUs). Certain of our awards are subject to equity classification, while others are subject to liability classification pursuant to the terms of the award grants and based on accounting guidance which governs such transactions. Accounting guidance applicable to equity classified awards require all stock based compensation, including vested shares, grants of employee stock options and restricted stock to be recognized in the consolidated statements of operations based on their grant date fair values. Awards subject to liability classification are initially measured and recognized in the consolidated statements of operations at the grant date fair value, but are adjusted to fair value each period during the requisite service period, with changes in fair value recognized as compensation cost over the vesting period or in the period in which the change occurs for awards that have vested but have not yet settled.
The fair value of our common stock for vested common shares, restricted stock awards and underlying stock option grants is determined in accordance with guidelines outlined in the American Institute of Certified Public Accountants Practice Aid, Valuation of Privately-Held-Company Equity Securities Issued as Compensation, or AICPA Practice Aid. In the absence of a public market, we considered all relevant facts and circumstances known at the time of valuation, made certain assumptions based on future expectations and exercised significant judgment to determine the fair value of our common stock. The factors considered in determining fair value include, but are not limited to the following:
| n | Valuations of our common stock performed by an unrelated third-party specialist on a bi-annual basis; |
| n | Our results of operations and financial position and estimated trends and projections of our future operating and financial performance; |
| n | The market performance of publically traded companies in the clinical research industry; |
| n | The likelihood of achieving a liquidity event, such as an initial public offering or sale of our company, given prevailing market conditions; |
| n | The common shares underlying the awards involved illiquid securities in a private company; and |
| n | External market conditions affecting the pharmaceutical and biotechnology industries. |
An unrelated third-party specialist performs a common share valuation, under the guidelines outlined in the AICPA Practice Aid, each year as of April 1 and October 1 (in conjunction with our annual assessment of goodwill). These valuations are estimated using a combination of the income approach, a discounted cash flow analysis and the market approach, utilizing the guideline company method. The discounted cash flow method involves cash flow
82
Table of Contents
projections that are discounted at an appropriate rate while the guideline company method employs market multiples derived from market prices of stocks of companies that are engaged in the same or similar lines of business and that are actively traded on a free and open market and applies these selected multiples to our corresponding measures of financial performance. The estimates utilized in these fair value methodologies are highly complex and subjective. Management considers whether any events or circumstances have occurred between the date of valuation and the date of a grant or a period end fair value re-measurement that would indicate a significant change in the fair value of common shares during that period. Following the consummation of an initial public offering, vested common share awards, restricted stock awards and stock option awards fair value will be determined based on the quoted market price of our common stock.
Stock Options
We estimate the fair value of our stock options utilizing the Black-Scholes-Merton option pricing model, which requires the input of highly subjective assumptions including: the expected stock price volatility, the calculation of the expected holding period of the award, the risk free interest rate and expected dividends on the underlying common stock. Due to the lack of a public market for the trading of our common stock and the lack of Company specific historical and implied volatility data, we have based our estimate of expected volatility on the historical volatility of a group of peer companies that are most representative of our company. The historical volatility is calculated based on a period of time commensurate with the expected holding period assumption. The holding period represents the period that our option awards are expected to be outstanding. We use the simplified method as prescribed by accounting guidance governing such awards, to calculate the expected term for options granted to employees as we do not have sufficient historical evidence data to provide a reasonable basis upon which to estimate the expected holding period. This simplified method utilizes the mid-point between the vesting date and the date of the contractual term. The risk free rate is based on extrapolated rates of U.S. Treasury bonds whose terms are consistent with the expected holding period of the stock options. We have assumed a dividend yield of zero as we have not historically paid any dividends on our common stock.
All our stock based option awards are subject to service based vesting conditions. Compensation expense related to stock option awards to employees is recognized on a straight line basis based on the grant date fair value over the associated service period of the award, which is equal to the vesting term. We are also required to estimate forfeitures at the time of grant and revise those estimates in subsequent periods if actual forfeitures differ from our estimates.
Stock based option awards granted subsequent to the Transaction, which represent all outstanding and unexercised options as of June 30, 2016 and December 31, 2015, are subject to a Contribution and Subscription Agreement that provides that upon exercise, the shares received must be exchanged for incentive units in MPI. The incentive units are tied directly to ownership in Medpace Holdings, Inc. and entitle the incentive unit holder to participate in the risks and rewards of owning our common shares through ownership in MPI. As the shares received in the settlement of stock options exercised are settled in assets other than our common shares, accounting guidance governing stock based compensation require the awards to be classified as liabilities. This classification requires that we measure and record the stock compensation awards to fair value each period utilizing the same methodology for measuring stock options fair value at the grant date as described above. This re-measurement of period end fair value often results in a cumulative catch up recorded for the portion of the award already vested but unsettled with the unvested portion of the option fair value recognized on a straight line basis over the remaining service period of the award. Per the option award terms, the Contribution and Subscription Agreement is not required following an initial public offering. As such, this offering will trigger an award provision that will be accounted for as an award modification and will require an option fair value re-measurement that could potentially result in additional non-cash expense or income as of the initial public offering date. Stock option awards granted prior to the Transaction, all of which vested prior to or as of the Transaction date, qualified for equity classification and were not subject to fair value re-measurement on a period by period basis.
83
Table of Contents
The following table summarizes the key weighted average assumptions used in the Black-Scholes-Merton option pricing model to calculate the fair value of options during the periods:
| SUCCESSOR | PREDECESSOR | |||||||||||||||||||
| SIX MONTHS ENDED JUNE 30, 2016 |
YEAR ENDED DECEMBER 31, 2015 |
NINE MONTH PERIOD FROM APRIL 1, 2014 THROUGH DECEMBER 31, 2014 |
THREE MONTH PERIOD FROM JANUARY 1, 2014 THROUGH MARCH 31, 2014 |
YEAR ENDED DECEMBER 31, 2013 |
||||||||||||||||
| Expected holding period—years |
5.0 | 4.2 | 5.4 | N/A | 3.1 | |||||||||||||||
| Expected volatility |
36.80 | % | 36.40 | % | 41.80 | % | N/A | 37.40 | % | |||||||||||
| Risk-free interest rate |
1.73 | % | 1.20 | % | 1.70 | % | N/A | 0.30 | % | |||||||||||
| Expected dividend yield |
0.00 | % | 0.00 | % | 0.00 | % | N/A | 0.00 | % | |||||||||||
The assumptions used in the Successor portion of the table above represent those used for the Successor six months ended June 30, 2016, the Successor year ended December 31, 2015 and the period ended December 31, 2014 fair value calculation of the stock options as required for liability-classified stock compensation accounting. The assumptions used in the Predecessor portion of the table above reflect grant date inputs used to arrive at the grant date fair values as the Predecessor awards are subject to equity-classified stock compensation accounting.
The weighted average grant date fair value of employee stock options granted was $4.29 for the Successor six months ended June 30, 2016, $3.81 for the Successor year ended December 31, 2015, $4.33 for Successor nine month period ended December 31, 2014, not applicable for the Predecessor three month period ended March 31, 2014 and $1.66 for the Predecessor year ended December 31, 2013.
Recently Adopted and Issued Accounting Standards
In April 2015, the Financial Accounting Standards Board (“FASB”) issued Accounting Standards Update (“ASU”) 2015-05, “Customer’s Accounting for Fees Paid in a Cloud Computing Arrangement,” which provides guidance for a customer’s accounting for cloud computing costs. Under ASU 2015-05, if a software cloud computing arrangement contains a software license, customers should account for the license element of the arrangement in a manner consistent with the acquisition of other software licenses. If the arrangement does not contain a software license, customers should account for the arrangement as a service contract. This standard may be applied prospectively to all arrangements entered into or materially modified after the effective date, or retrospectively. The Company adopted ASU 2015-05 in the first quarter of 2016. There was no impact to the Company’s condensed consolidated statements of operations, comprehensive (loss) income, shareholders’ equity or cash flows.
In June 2016, the FASB issued ASU 2016-13, Financial Instruments-Credit Losses (Topic 326), Measurement of Credit Losses on Financial Instruments. The new guidance adds Topic 326 to the FASB Accounting Standards Codification and removes the thresholds that companies apply to measure credit losses on financial instruments measured at amortized cost, such as loans, receivables, and held-to-maturity debt securities. Under current U.S. GAAP, companies generally recognize credit losses when it is probable that the loss has been incurred. The revised guidance will remove all recognition thresholds and will require companies to recognize an allowance for credit losses for the difference between the amortized cost basis of a financial instrument and the amount of amortized cost that the company expects to collect over the instrument’s contractual life. ASU 2016-13 will be applied on a prospective basis for fiscal years and interim periods beginning after December 15, 2019, with early adoption permitted for fiscal years beginning and interim periods beginning after December 15, 2018. The Company is currently evaluating the effect this standard will have on its condensed consolidated financial statements.
In May 2016, the FASB issued ASU 2016-12, Narrow-Scope Improvements and Practical Expedients. In March 2016, the FASB issued ASU 2016-08, Revenue from Contracts with Customers (Topic 606): Principal versus Agent
84
Table of Contents
Considerations (Reporting Revenue Gross versus Net). In April 2016, the FASB issued ASU 2016-10, Revenue from Contracts with Customers (Topic 606): Identifying Performance Obligations and Licensing. ASUs 2016-12, 2016-10 and 2016-08 all clarify the interpretation guidance in ASU No. 2014-09, “Revenue from Contracts with Customers” specifically related to narrowing specific aspects of Topic 606 and adding illustrative examples to assist in the application of the guidance. The effective date and transition requirements in ASUs 2016-12, 2016-10 and 2016-08 are the same as the effective date and transition requirements of ASU 2014-09. ASU 2015-14, Revenue from Contracts with Customers (Topic 606): Deferral of the Effective Date, defers the effective date of ASU 2014-09 by one year. The Company will adopt the clarified guidance in ASUs 2016-12, 2016-10 and 2016-08 by January 1, 2018, as required. The Company is currently evaluating the impact of this new standard on its condensed consolidated financial statements.
In March 2016, the FASB issued ASU No. 2016-09, Improvements to Employee Share-Based Payment Accounting. The new guidance is intended to simplify certain aspects of accounting for share-based payments to employees including the accounting for income taxes, forfeitures, and statutory tax withholding requirements, as well as classification in the statement of cash flows. ASU 2016-09 is effective for fiscal years beginning after December 15, 2016, and for interim periods within those fiscal years. Early adoption is permitted, but all guidance must be adopted in the same period. The Company is currently evaluating the effect this standard will have on its consolidated financial statements.
In February 2016, the FASB issued ASU 2016-02, Leases (Topic 842). The guidance in ASU 2016-02 supersedes the lease recognition requirements in ASC Topic 840, Leases (FAS 13). ASU 2016-02 requires an entity to recognize assets and liabilities arising from a lease for both financing and operating leases, along with additional qualitative and quantitative disclosures. ASU 2016-02 will be applied on a modified retrospective basis and to each prior reporting period presented and is effective for fiscal years beginning after December 15, 2018, with early adoption permitted. The Company is currently evaluating the effect this standard will have on its consolidated financial statements.
In April 2015, the FASB issued ASU No. 2015-03, “Simplifying the Presentation of Debt Issuance Costs.” ASU No. 2015-03 requires debt issuance costs to be presented in the balance sheet as a direct deduction from the associated debt liability. ASU No. 2015-03 was to be effective for annual reporting periods beginning after December 15, 2015, and interim periods within those fiscal years. The Company early adopted ASU No. 2015-03 during 2015 and as a result, $12.1 million in debt issuance costs previously reported in other assets were reclassified to long-term debt, net, less current portion, in the consolidated balance sheet as of December 31, 2014. There was no impact to the Company’s consolidated statements of operations, comprehensive (loss) income, shareholders’ equity or cash flows.
In April 2015, the FASB issued ASU No. 2015-05, “Customer’s Accounting for Fees Paid in a Cloud Computing Arrangement,” which provides guidance for a customer’s accounting for cloud computing costs. Under ASU 2015-05, if a software cloud computing arrangement contains a software license, customers should account for the license element of the arrangement in a manner consistent with the acquisition of other software licenses. If the arrangement does not contain a software license, customers should account for the arrangement as a service contract. This standard may be applied either prospectively to all arrangements entered into or materially modified after the effective date, or retrospectively. The Company adopted ASU 2015-05 in the first quarter of 2016. There was no impact to the Company’s consolidated statements of operations, comprehensive (loss) income, shareholders’ equity or cash flows.
In November 2015, the FASB issued ASU No. 2015-17 ‘‘Balance Sheet Classification of Deferred Taxes.” ASU No. 2015-17 requires entities to present deferred tax assets and deferred tax liabilities as noncurrent in a classified balance sheet. ASU No. 2015-17 simplifies the current guidance, which requires entities to separately present deferred tax assets and deferred tax liabilities as current and noncurrent in a classified balance sheet. ASU No. 2015-17 was to be effective for annual reporting periods beginning after December 15, 2016, and interim periods within those annual periods. The Company early adopted ASU No. 2015-17 during 2015 and as a result, $3.3 million of current deferred income tax assets were reclassified in the consolidated balance sheet as of December 31, 2014. There was no impact to the Company’s consolidated statements of operations, comprehensive (loss) income, shareholders’ equity or cash flows.
85
Table of Contents
In May 2014, the FASB issued ASU No. 2014-09 ‘‘Revenue from Contracts with Customers,’’ to clarify the principles of recognizing revenue and create common revenue recognition guidance between U.S. GAAP and International Financial Reporting Standards. In July 2015, the FASB issued ASU 2015-14, “Revenue from Contracts with Customers: Deferral of the Effective Date,” which delayed the effective date of ASU 2014-09 by one year and modified the standard to allow early adoption. For public entities, the standard is now effective for reporting periods beginning after December 15, 2017. Earlier application is permitted only as of annual reporting periods beginning after December 15, 2016, including interim reporting periods within that reporting period. Entities can transition to the standard either retrospectively or as a cumulative effect adjustment as of the date of adoption. We are currently assessing the potential impact of ASU No. 2014-09 on the Company’s consolidated financial statements.
In April 2014, the FASB issued amendments to ASC 205, “Presentation of Financial Statements—Going Concern,” through issuance of ASU 2014-15, “Disclosure of Uncertainties about an Entity’s Ability to Continue as a Going Concern.” This ASU requires management to assess an entity’s ability to continue as a going concern by incorporating and expanding upon certain principles that are currently in U.S. auditing standards. The new guidance is effective for fiscal years ending after December 15, 2016, and for annual periods and interim periods thereafter, with early adoption permitted. We do not anticipate that this ASU will have any impact on our consolidated financial statements.
Quantitative and Qualitative Disclosures About Market Risk
Market risk is the potential loss arising from adverse changes in market rates and prices, such as foreign currency exchange rates, inflation, interest rates, and other relevant market rates or prices changes. We are exposed to market risk from changes in foreign currency exchange rates, interest rates, credit risk and risk of inflation and we regularly evaluate our exposure to such changes.
Foreign Currency Risk
We have business operations globally and accordingly, we are exposed to foreign currency fluctuations that can affect our financial results. For the Successor year ended December 31, 2015, approximately 8.4% of our revenue was derived from contracts denominated in currencies other than the U.S. dollar, whereas 24.9% of our operational costs, including, but not limited to, salaries, wages and other employee benefits, were derived in foreign currencies. Of these exposures, 94.9% of revenue denominated in foreign currencies and 46.8% of operational costs denominated in foreign currencies were Euro denominated. If the U.S. dollar were to appreciate against all other currencies by a hypothetical average of 10%, our pre-tax income for the Successor year ended December 31, 2015 would have been positively impacted by approximately $3.2 million, while a hypothetical depreciation of 10% against all other currencies would result in a negative earnings impact of approximately $3.2 million.
We are also subject to foreign currency transaction risk for fluctuations in exchange rates during the period of time between contract commencement and cash settlement for services that we provide in relation to the contract. This exposure may affect our contract and operational profitability. To mitigate this exposure we provide for exchange rate fluctuation adjustments subject to certain thresholds within our foreign currency denominated contracts.
Inflation
Our contracts that provide for services to be performed in excess of a year generally include inflation adjustments for the portion of the services to be performed beyond one year from the contract date. We do not have significant operations in countries where the economy is considered highly inflationary, and do not believe in the near term that inflation will have a material adverse impact on us. However, if actual rates are greater than our contractual inflation rates, inflation could have a material adverse effect on our operations or financial condition.
Interest Rates
We are primarily exposed to interest rate risk through our Senior Secured Credit Facilities. As of December 31, 2015 and 2014, we had outstanding amounts related to the Senior Secured Credit Facilities of $377.9 million (net of an unamortized discount of $2.0 million and unamortized debt issuance costs of $10.1 million) and $491.5 million (net of an unamortized discount of $2.4 million and unamortized debt issuance costs of $12.1 million), respectively, subject to variable interest rates. The applicable LIBOR interest rate, our primary interest rate exposure, for the Senior Secured Credit Facilities is subject to a 1.00% floor. As the applicable LIBOR interest rates as of December 31, 2015 and 2014 were less than the floor, the applicable interest rates would have had to rise by 57
86
Table of Contents
basis points and 83 basis points, respectively, to impact interest expense. Each quarter point increase in the applicable interest rate above the floor as of December 31, 2015 and 2014 would have changed our interest expense by approximately $1.1 million and $1.0 million, for the Successor year ended December 31, 2015 and the Successor nine month period ended December 31, 2014, respectively.
Credit Risk
Financial instruments that subject the Company to credit risk primarily consist of cash and cash equivalents, and accounts receivable and unbilled. The cash and cash equivalent balances are held and maintained with high-quality financial institutions with reputable credit ratings and, consequently, we believe that such funds are subject to minimal credit risk.
We generally do not require collateral or other securities to support customer receivables. In the Successor year ended December 31, 2015, the Successor nine month period ended December 31, 2014, the Predecessor three month period ended March 31, 2014 and the Predecessor year ended December 31, 2013, credit losses have been immaterial and within our expectations. Moreover, in many cases we require advance payment from our customers for a portion of the study contract price upon the signing of a service contract which helps to mitigate credit risk. As of December 31, 2015 and 2014, there were no major customers accounting for more than 10% of our accounts receivable and unbilled.
87
Table of Contents
Overview
We are one of the world’s leading clinical contract research organizations, or CROs, by revenue, solely focused on providing scientifically-driven outsourced clinical development services to the biotechnology, pharmaceutical and medical device industries. Our mission is to accelerate the global development of safe and effective medical therapeutics. We differentiate ourselves from our competitors by our disciplined operating model centered on providing full-service Phase I-IV clinical development services and our therapeutic expertise. We believe this combination results in timely and cost-effective delivery of clinical development services for our customers. We believe that we are a partner of choice for small and mid-sized biopharmaceutical companies based on our ability to consistently utilize our full-service, disciplined operating model to deliver timely and high-quality results for our customers. Accordingly, we believe we are well positioned to continue to expand our market share and sustain margins in the growing $23 billion overall Phase I-IV CRO market.
We were founded in 1992 by Dr. August J. Troendle, an industry pioneer, as a Phase II-IV-focused CRO with a strong, scientifically-driven and disciplined operating model, and we continue today as a founder-led enterprise with Dr. Troendle retaining a significant ownership stake in Medpace. Throughout our 24-year history, we have grown almost exclusively organically, with our core founding members having been integrally involved in developing and instilling our differentiated culture and operating philosophy across our company. We focus on conducting clinical trials across all major therapeutic areas, with particular strength in Cardiology, Metabolic Disease, Oncology, Endocrinology, CNS and AVAI, as well as therapeutic expertise in Medical Devices. Our global platform includes approximately 2,300 employees across 35 countries, providing our customers with broad access to diverse markets and patient populations as well as local regulatory expertise and market knowledge.
Our singular focus on executing our disciplined, full-service operating model is a core tenet of our differentiated approach. Our operating model entails partnering with our customers from the beginning of the clinical trial process and holistically navigating all subsequent components of the process. This approach differs from other leading CROs that provide functional or partial outsourcing services as a core component of their business. We believe our full-service approach allows us to deliver timely and high-quality results for our customers. By clearly communicating and aligning our expectations with those of our customers at the beginning of an engagement, we develop a trusted relationship where our customers typically grant us greater control over the clinical trial process. This results in greater accountability on our part and, we believe, more consistent delivery of our services. We believe our partnering approach, coupled with our full-service, scientifically-driven model, ensures efficient and high-quality trial execution, limits changes in the scope of trials and enables timely completion of trials.
We focus on providing clinical development solutions primarily to companies that recognize the benefits of utilizing our full-service outsourcing model. We believe our model is particularly attractive to small and mid-sized biopharmaceutical companies, which seek specialized capabilities and infrastructure required for complex and global clinical trials, including therapeutic expertise, insightful protocol design, project feasibility assessment and timely and high-quality trial execution. We expect that outsourced development expenditures for small and mid-sized biopharmaceutical companies will continue to outpace outsourced development expenditures for the broader biopharmaceutical market. We believe we can expand our market share with this customer segment given our continued strategic focus and the attractiveness of our model to these companies. Furthermore, as the clinical development and regulatory processes grow increasingly more global and complex, we believe large pharmaceutical companies will increasingly recognize the benefits of our disciplined, full-service operating model. For the Successor year ended December 31, 2015, we generated 55.7%, 29.3% and 15.0% of our net service revenue from small biopharmaceutical companies, mid-sized biopharmaceutical companies and large pharmaceutical companies, respectively.
We believe that our model, focused on full-service delivery, and our attractive customer mix have resulted in robust levels of historical revenue growth, Adjusted EBITDA margins and strong Free Cash Flow. For the Successor year ended December 31, 2015, we generated total net service revenue of $320.1 million and Adjusted EBITDA of $101.2 million, representing net service revenue and Adjusted EBITDA compound annual growth rates, or CAGRs, of 21.7% and 26.2%, respectively, since 2012. Our net (loss) income for the Successor year ended December 31,
88
Table of Contents
2015, the Successor nine month period ended December 31, 2014, the Predecessor three month period ended March 31, 2014 and the Predecessor year ended December 31, 2013 was $(8.7) million, $(14.3) million, $(1.2) million and $24.8 million, respectively, partially as a result of non-cash amortization expense associated with identified intangible assets acquired as part of the Transaction. Over the last 15 years, we have maintained average Adjusted EBITDA margins of approximately 34%, while significantly scaling our business organically and expanding globally. Additionally, we have consistently demonstrated an ability to convert Adjusted EBITDA into Free Cash Flow. Our annual Free Cash Flow conversion, defined as Free Cash Flow divided by Adjusted EBITDA, has averaged 81.7% since 2012. Net cash provided by operating activities for the Successor year ended December 31, 2015, the Successor nine month period ended December 31, 2014, the Predecessor three month period ended March 31, 2014 and the Predecessor year ended December 31, 2013 was $84.1 million, $62.5 million, $12.8 million and $98.1 million, respectively. For a reconciliation of Adjusted EBITDA, a non-GAAP measure, to net (loss) income, and for a reconciliation of Free Cash Flow, also a non-GAAP measure, to net cash provided by operating activities, see “Selected Historical Consolidated Financial and Other Data.” Additionally, as of June 30, 2016 and December 31, 2015, we had total long-term debt, net of $364.0 million and $377.9 million outstanding, respectively. We intend to use the net proceeds of this offering to repay a portion of this indebtedness. See “Use of Proceeds.”
Our Market
Clinical Development Process
Before a new drug can be commercialized, it often must undergo extensive pre-clinical and clinical testing and regulatory review to verify safety and efficacy. CROs provide a comprehensive range of product development services for Phase I-IV clinical trials. These clinical trials are separated into distinct phases in order to thoroughly evaluate the product. Pharmaceutical Research and Manufacturers of America, 2015 Biopharmaceutical Research Industry Profile, a trade group publication, indicates that from drug discovery through approval by the United States Food and Drug Administration, or FDA, developing a new medicine takes at least 10 years and costs approximately $2.6 billion.
The following graphic, based on data presented in the Pharmaceutical Research and Manufacturers of America, 2013 Biopharmaceutical Research Industry Profile and 2015 Biopharmaceutical Research Industry Profile, industry trade group publications, illustrates the various stages and typical timeline of the clinical development process:
Stages of Clinical Development
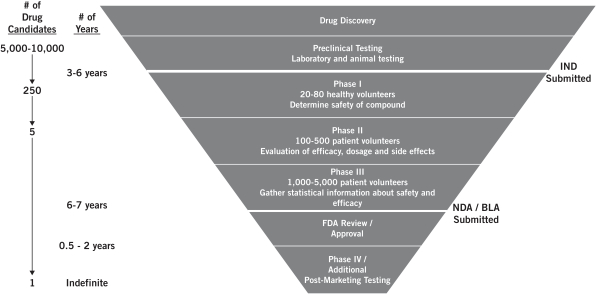
Pharmaceutical and biotechnology companies outsource product development services to CROs in order to efficiently and cost-effectively manage the clinical development process and obtain regulatory approval and reach the market in as timely a manner as possible. Historically, outsourcing was driven primarily by the need for pharmaceutical and
89
Table of Contents
biotechnology companies to reduce cost and maintain focus on core competencies, or to provide services or capabilities that these companies did not have internally. In recent years, the role of a CRO has evolved and CROs are now increasingly an integral component of the product development process, providing their customers with regulatory and therapeutic expertise, complex clinical trial design, broader geographic coverage, access to diverse population pools and consistent and reliable data systems and procedures.
CRO Market Size
We estimate, based on industry sources, including analyst reports and management’s knowledge, that total global biopharmaceutical clinical development expenditures were approximately $100 billion in 2014. We further estimate, based on these industry sources, that the portion of these expenditures attributable to Phase I-IV clinical development services was $44 billion, of which we estimate $23 billion was outsourced. In addition, based on these industry sources, we estimate the CRO market will experience a CAGR of approximately 6% from 2014 through 2019, growing to approximately $31 billion in 2019, as a result of increasing biopharmaceutical clinical development expenditures combined with increased outsourcing penetration.
CRO Market Trends
Increasing Development Expenditures. We estimate that biopharmaceutical development expenditures will grow from approximately $100 billion in 2014 to approximately $114 billion in 2019, representing a CAGR of approximately 3%. We believe that the growth in development expenditures is primarily attributed to the heightened pace of biopharmaceutical innovation, pressure on companies to replenish pipelines with new therapies, the favorable regulatory environment and the significant amount of capital raised by biotechnology and pharmaceutical companies during the last several years. There were 13,718 drugs in the development pipeline in January 2016, as identified by Citeline Pharma’s R&D Annual Review 2016, an industry publication, which was an increase of approximately 41% compared to the 9,737 that were in development in 2010. In line with the significant capital raised by biotechnology and pharmaceutical companies, based upon financial data available from FactSet Research Systems Inc., a provider of financial information, as of September 30, 2015, the companies comprising the NASDAQ Biotechnology Index, or NBI, had approximately $109.3 billion in cash available to support ongoing clinical development. This figure represents a 24.7% increase above the cash balance of approximately $87.6 billion held by the companies comprising the NBI as of December 31, 2014, and a 111.5% increase above the cash balance of approximately $51.7 billion held by companies comprising the NBI as of December 31, 2010.
Increasing Outsourcing Penetration. Outsourcing penetration is the percentage of biopharmaceutical clinical development costs that are outsourced to CROs. We estimate, based on industry sources, including analyst reports and management’s knowledge, that approximately 52% of Phase I-IV clinical development expenditures were outsourced in 2014. Driven by increased clinical trial complexity, the need for regulatory and therapeutic expertise and global access to patient populations, we expect outsourcing penetration will reach approximately 62% in 2019.
Pressures Facing Biopharmaceutical Industry. The biopharmaceutical industry continues to experience significant challenges, including regulatory and pricing pressures resulting from healthcare reform, intensifying generic competition, pipeline failures and the need for continued innovation. In order to combat these challenges and maintain revenue growth and operating margins, biopharmaceutical companies increasingly seek clinical expertise and seek to outsource clinical services to CROs to accelerate clinical development and maximize commercialization success.
Increasing Clinical Trial Complexity. Clinical trial design and structure have become increasingly complex based on regulatory agency sophistication, more complicated protocols and a growing focus by biopharmaceutical companies on developing new cutting-edge drug therapies. For example, based on the data available in the FDA’s Orphan Drug Product designation database, the number of orphan drug designations granted has increased by nearly 90% over the past three years from 190 in 2012 to 354 in 2015. This growing complexity brings new challenges in study feasibility, site selection, patient recruitment and retention due to the rarity of orphan diseases, which globally may only have hundreds or thousands of patients. Additionally, measures of clinical trial complexity significantly increased over the last decade, with the mean number of procedures per protocol increasing by 68% as indicated by the Tufts Center for the Study of Drug Development, an independent non-profit research group. We believe full-service CROs with noted therapeutic leadership, full-service clinical operations, a proprietary technology platform, strategic regulatory guidance and integrated laboratories are well suited to successfully support these types of studies.
90
Table of Contents
Small and Mid-Sized Biopharmaceutical Segment
We believe small and mid-sized biopharmaceutical companies are important to the continued growth of the CRO industry. These companies are primary centers of innovation, developing new, cutting-edge therapies for niche or previously untreatable diseases, which frequently require sophisticated clinical trials. These companies have limited ability to conduct global clinical trials independently, and as a result, they typically seek a strategic partner that can provide the therapeutic experience and infrastructure required to deliver timely completion of complex, global clinical trials. We estimate, based on industry sources, including analyst reports and management’s knowledge, that outsourced development expenditures for these companies will grow at a CAGR of 10% from 2014 to 2019, outpacing the estimated overall biopharmaceutical market CAGR of 6%. In 2014, we estimate, based on industry sources, including analyst reports and management’s knowledge, that small and mid-sized biopharmaceutical companies outsourced approximately 69% of their development expenditures, representing an estimated addressable CRO market of approximately $7 billion, which we estimate, based on these same sources, will increase to approximately 76%, representing an estimated addressable CRO market of approximately $11 billion in 2019.
Biopharmaceutical companies have a variety of options for raising money to support the funding of their drug development, including raising private equity, raising public equity and partnering with large biopharmaceutical companies to jointly develop drug candidates. Many of these companies are well-funded, having raised approximately $232 billion of capital in the aggregate, including funding from investments from corporate partners, in 2014 and 2015, representing a 110% increase over the approximately $110 billion raised in 2012 and 2013, as identified by BioWorld, a biopharmaceutical news source. We believe the level of capital raised for small and mid-sized biopharmaceutical companies over the last few years is sufficient to fund significant clinical trial activity for these companies going forward. We believe that companies that are progressing with good results through a clinical trial will be able to continue to fund those clinical trials with available cash and will have additional avenues to fund these programs as necessary, including partnerships with large biopharmaceutical companies.
Our Competitive Strengths
We believe we are well positioned to capitalize on positive trends in the CRO industry based on our key competitive strengths set forth below:
Disciplined and Integrated Full-Service Model. Since our founding in 1992, we have focused on building and executing our disciplined, full-service operating model to provide clinical development services to the biotechnology and pharmaceutical industries. At the center of our differentiated operating model is our full-service focused, end-to-end approach to delivering clinical development services. We partner with customers from the beginning of the clinical trial process and holistically navigate all subsequent components of the process. While many CROs engage in functional or partial outsourcing services as a significant component of their business model, we take a disciplined approach and do not typically provide such piecemeal services. We believe that a full-service approach delivers greater efficiency, better quality and, ultimately, higher value for our customers.
In executing our operating model, we have demonstrated durable success across multiple therapeutic areas. We embed therapeutic leads, each of whom holds a Doctor of Philosophy, or Ph.D., a Doctor of Medicine, or M.D., or other doctorate level degrees into every aspect of the project, and our customers rely on this expertise throughout the entire clinical process. By clearly communicating and aligning our expectations with those of our customers at the beginning of an engagement, we tend to develop a close working relationship that is built on a level of trust that results in us being granted greater control over the clinical trial process. We have developed and consistently utilize effective standard operating procedures, or SOPs, that we believe result in high-quality and timely clinical development outcomes for our customers. Our operating model utilizes our proprietary ClinTrak clinical trial management software, or ClinTrak, which is customized and streamlined to our SOPs. We house our key decision-makers, our internally-developed technology and our corporate infrastructure in our corporate headquarters in Cincinnati, Ohio. This centralization allows us to maintain highly integrated, standardized and flexible operations, while preserving our operating philosophy and extending our global reach, resulting in a disciplined business model and attractive EBITDA margins.
High-Science Approach with Deep Therapeutic Expertise. Customers generally seek a CRO with extensive therapeutic expertise in their focus areas. Our therapeutic expertise encompasses areas that are among the largest, most complex and fastest growing in pharmaceutical development, including Oncology, Cardiology, Metabolic Disease,
91
Table of Contents
Endocrinology, CNS and AVAI, as well as Medical Devices. Our core therapeutic expertise covers the therapeutic areas where a majority of all drugs are currently in development, as identified by Citeline Pharma R&D Annual Review 2016, an industry publication. Collectively, these areas constituted 81.6% of our backlog as of June 30, 2016.
We leverage the insights of our senior leaders who have specific therapeutic expertise to employ a high-science approach to our projects. Because we believe that therapeutic expertise plays a significant role in CRO selection, we focus heavily on hiring and training our therapeutic leads in order to maximize therapeutic insights to inform clinical trial design and execution. In clinical trial execution, our therapeutic leads are embedded into every aspect of the process from start to finish. Our scientific and medical staff is fundamental to delivering high-quality trial execution and enabling timely completion of complex processes.
Attractive and Diversified Customer Base. We have a strong track record of serving our core customer base of small and mid-sized biopharmaceutical companies, which we believe represents an attractive growth opportunity. We believe outsourced development expenditures in our core customer base will outpace the growth of the broader biopharmaceutical market. While we estimate, based on industry sources, including analyst reports and management’s knowledge, that the overall biopharmaceutical market will grow its outsourced development expenditures for Phase I-IV clinical development and laboratory services at a 6% CAGR from 2014 to 2019, we expect the small and mid-sized biopharmaceutical outsourced development expenditures will grow at a 10% CAGR during this period. Small and mid-sized biopharmaceutical companies, many of which are now well capitalized, have firmly established themselves at the forefront of medical innovation and the search for new therapies for previously untreatable diseases, which require increasingly complex clinical trials. CROs are integral to the clinical development process for these customers, providing regulatory and therapeutic expertise, complex clinical trial design, broader geographic coverage, access to diverse population pools and consistent and reliable data systems and procedures, since these customers often lack the infrastructure and global breadth required for efficient and high-quality trial execution.
In addition, we have a highly diversified customer base comprising many of the largest global biopharmaceutical companies, as well as high-growth small and mid-sized biopharmaceutical companies. For the Successor year ended December 31, 2015, we generated 55.7%, 29.3% and 15.0% of our net service revenue from small biopharmaceutical companies, mid-sized biopharmaceutical companies and large pharmaceutical companies, respectively. For the Successor six months ended June 30, 2016 and the Successor year ended December 31, 2015, our largest customer accounted for 6.3% and 6.9% of our net service revenue, respectively, and our top 10 customers represented 38.2% and 39.9% of our net service revenue, respectively.
Partner of Choice for Biopharmaceutical Customers. Based on our extensive operating history and therapeutic experience, we believe that we have established a reputation as a partner of choice to our core customer segment of small and mid-sized biopharmaceutical companies. Acting as incubators of pharmaceutical development, small and mid-sized biopharmaceutical companies are responsible for a number of innovative drug candidates currently being developed to address unmet medical needs. Many of these drug candidates are being developed for niche and severe indications with relatively small patient populations, which require increasingly complex clinical trials. These biopharmaceutical customers, sometimes new to the clinical development process, seek to partner with us based on our differentiated approach and expertise to execute trials in a timely and efficient manner. The Avoca Group’s 2011 Avoca Survey on Clinical Outsourcing Practices, a survey of over 100 biopharmaceutical companies, indicates that 48% of pharmaceutical companies with annual revenue over $1.5 billion, 51% of biopharmaceutical companies with annual revenue between $100 million and $1.5 billion, and 64% of biopharmaceutical companies with annual revenue under $100 million prefer medium-sized, full-service CROs, defined as the top 15 CROs by revenue excluding the top 5 CROs by revenue, based on service and outsourcing experience. Of this same group, only 40% of large pharmaceutical companies, 24% of mid-sized biopharmaceutical companies and 7% of small biopharmaceutical companies prefer large, full-service CROs, defined as the top 5 CROs by revenue. We do not believe that we are among the top 5 CROs by revenue based on publicly available information. We believe we are viewed as a strategic and trusted partner by these customers given our full-service approach, disciplined operating model and significant therapeutic expertise. As a result, our customers often grant us significant autonomy in executing clinical trials for their most valued assets.
Global Platform with Scalable Infrastructure. We believe that we are one of the leading CROs with the scale and therapeutic expertise necessary to effectively conduct global clinical trials. We began our disciplined international
92
Table of Contents
expansion in 2004 and have since increased the breadth and depth of our international footprint significantly, with approximately 45% of our clinical operations employees located outside of North America as of June 30, 2016. We now offer our services through a highly skilled staff of approximately 2,300 employees across 35 countries as of June 30, 2016. As clinical trials become increasingly global, our platform provides our customers with broad access to diverse markets and patient populations, as well as local regulatory expertise and market knowledge, which can reduce the time and cost of these trials, while also helping to optimize the commercialization potential for new therapies.
Strong Financial Performance. We have a proven track record of strong organic growth and achieved significant revenue and Adjusted EBITDA growth and robust Free Cash Flow over the past several years. For the Successor year ended December 31, 2015, we achieved net service revenue of $320.1 million and Adjusted EBITDA of $101.2 million, which represent a CAGR of 21.7% and 26.2%, respectively, since 2012. Our net (loss) income for the Successor year ended December 31, 2015, the Successor nine month period ended December 31, 2014, the Predecessor three month period ended March 31, 2014 and the Predecessor year ended December 31, 2013 was $(8.7) million, $(14.3) million, $(1.2) million and $24.8 million, respectively, partially as a result of non-cash amortization expense associated with identified intangible assets acquired as part of the Transaction. For the Successor year ended December 31, 2015, our Adjusted EBITDA margin was 31.6%. Our Adjusted EBITDA margins are driven by focusing on a full-service operating model and disciplined approach. We typically avoid functional or partial outsourcing services, which we believe are less efficient and lead to a lower margin profile. Over the last 15 years, we have maintained average Adjusted EBITDA margins of approximately 34%, while significantly scaling our business and expanding globally. Additionally, we have consistently demonstrated an ability to convert Adjusted EBITDA into Free Cash Flow. Our annual Free Cash Flow conversion, defined as Free Cash Flow divided by Adjusted EBITDA, has averaged 81.7% since 2012. Net cash provided by operating activities for the Successor year ended December 31, 2015, the Successor nine month period ended December 31, 2014, the Predecessor three month period ended March 31, 2014 and the Predecessor year ended December 31, 2013 was $84.1 million, $62.5 million, $12.8 million and $98.1 million, respectively. For a reconciliation of Adjusted EBITDA, a non-GAAP measure, to net (loss) income, and for a reconciliation of Free Cash Flow, also a non-GAAP measure, to net cash provided by operating activities, see “Selected Historical Consolidated Financial and Other Data.” Additionally, as of June 30, 2016 and December 31, 2015, we had total long-term debt, net of $364.0 million and $377.9 million outstanding, respectively. We intend to use the net proceeds of this offering to repay a portion of this indebtedness. See “Use of Proceeds.” We believe our strong financial profile demonstrates the quality and efficiency of the operating model we have built to position ourselves for continued future growth.
Highly Regarded, Experienced and Committed Management Team. We are led by a dedicated and experienced senior management team with significant industry experience and knowledge focused on clinical development. We were founded in 1992 by Dr. August J. Troendle, an industry pioneer, and we continue today as a founder-led enterprise with Dr. Troendle retaining a significant ownership stake in Medpace. Our management team has been responsible for developing our scientifically-driven, disciplined operating model, building our global platform and realizing our significant organic growth in revenue and earnings. Our senior management team has an average tenure with Medpace of 12 years, including four senior managers with over 20 years with us, and brings a healthy balance of significant experience with Medpace, regulators and other companies in the industry, including public companies.
Our Growth Strategy
Key elements of our growth strategy include:
Continued Focus on Organic Growth. Our strong organic growth has been the result of consistently reinvesting our positive cash flow to support our therapeutic capabilities, service offerings and global expansion. As a founder-led enterprise, we intend to continue to emphasize preserving our unique culture and operating philosophy as we grow our scientific capabilities and clinical trial expertise by further investing in human capital. In addition to leveraging our operating model, we intend to continue to selectively hire employees to strengthen and expand our expertise in high-growth therapeutic areas, including Oncology, CNS and AVAI. We methodically look to hire employees early in their careers and thoroughly train them to excel in our disciplined operating model, while instilling within them our corporate culture and philosophy. We apply this same training and standardization globally in order to maintain consistency and minimize inefficiencies in our operations. From 2012 through 2015, we successfully organically grew our business from approximately 1,000 employees to over 2,000 and organically grew our net service revenue from $177.4 million to $320.1 million, representing a CAGR of 21.7%. We intend to continue to utilize our disciplined organic growth model and robust cash flows to drive future revenue growth.
93
Table of Contents
Continue to Sustain Industry-Leading Margins. Over the last 15 years, we have maintained average Adjusted EBITDA margins of approximately 34%. We intend to continue to maintain industry-leading margins (compared to our public competitors) while growing organically. We believe the key to sustaining margins is through the execution of our disciplined operating philosophy and full-service business model. Furthermore, we intend to continue to develop our centralized operations at our corporate headquarters in order to maintain standardization and consistency across our global operations. We have a proven track record of achieving strong margins while significantly scaling our business and expanding globally.
Leverage our Experience and Reputation in the Attractive, High-Growth Clinical Development Market. Our customers value the knowledge and therapeutic expertise we have developed from a long history of successfully executing clinical trials. Given the rapid emergence of new therapies and resulting evolution of commercial priorities among many biopharmaceutical companies, we believe consistently maintaining the necessary infrastructure and human capital required to retain clinical and therapeutic expertise internally is not the most cost-effective solution for these companies. As the regulatory landscape adapts to greater clinical trial complexity, we believe that biopharmaceutical companies will increasingly engage CROs with the requisite global resources as well as therapeutic and regulatory expertise to assume full responsibility of the clinical trial process. We estimate, based on industry sources, including analyst reports and management’s knowledge that Phase I-IV clinical development outsourcing penetration for biopharmaceutical companies will increase from 52% in 2014 to 62% in 2019. Based on our successful execution of clinical trials across many therapeutic areas in multiple countries, as well as our focus on closely partnering with our customers through all aspects of the clinical trial process, we believe we have developed a strong reputation in the industry as a leading CRO. We believe that this reputation positions us to continue capturing additional share of the attractive, high-growth clinical development market as the industry increasingly recognizes the benefits of our operating model.
Deepen Existing and Develop New Relationships with Our Core Customer Segment. We look to continue to deepen our long-standing relationships with existing customers through new engagements and expand our relationships with new small and mid-sized biopharmaceutical customers. As a strategic partner of choice, we clearly communicate and align our expectations with our customers at the beginning of an engagement to develop a close working relationship that is built on trust. We believe this trust, supported by our high-quality execution and frequent dialogue with our customers’ key decision makers, positions us to be awarded additional business in existing and new therapies, allowing us to grow alongside our customers and leading to an increasingly significant, and growing, contribution from repeat business.
While our successes to date have built a substantial customer base, we believe that there is opportunity for continued growth and penetration in our core customer segment. We place our therapeutic leads alongside our sales team to actively participate in the procurement of new customers whose portfolios align with our therapeutic expertise, which we believe further differentiates us from our competitors. In 2015, we worked with approximately 350 small and mid-sized biopharmaceutical companies. 85.0% of our net service revenue for the Successor year ended December 31, 2015 was generated from small and mid-sized biopharmaceutical companies. In addition, our sales team actively manages a database which currently includes over 4,400 companies that represent potential customers. We regularly assess this database for opportunities that align with our growth strategies and develop plans to target and engage these potential customers. Based on this, we estimate that we have captured approximately 4% of the approximately $7 billion small and mid-sized biopharmaceutical CRO market, leaving us with significant opportunity for market share growth and new customer penetration expansion.
Pursue Selective and Complementary Bolt-On Acquisitions. We intend to augment our organic growth with targeted acquisitions to expand our current capabilities and service offerings that are complementary to our full-service model. Our acquisition strategy is driven by our comprehensive commitment to serve customer needs. While we are continuously assessing the market for attractive opportunities, we do so selectively with a focus on targeting opportunities to acquire and integrate complementary and strategic, non-transformative acquisitions within the CRO sector in order to strengthen our competitive position and provide enhanced value to our customers.
Position Ourselves to Increase Our Presence Among Large Pharmaceutical Companies as These Customers Adopt and Appreciate the Full-Service Approach. Given the growing pressures large pharmaceutical companies are facing, including complex clinical development and regulatory processes, these companies seek solutions beyond simply
94
Table of Contents
outsourcing clinical development. These companies are increasingly seeking strategic partnerships that provide more holistic clinical development services and also the expertise that CRO partners offer. We have witnessed a noticeable shift by large pharmaceutical companies away from lower-value, functional outsourcing service providers toward full-service CROs. Given our differentiated operating model, we believe larger pharmaceutical companies will be increasingly appreciative of our proven approach to clinical development and expertise, and we intend to actively market the strength and depth of our services to these companies.
Our Services
We provide a full suite of services supporting the entire clinical development process from Phase I to Phase IV. We offer these services across a wide range of therapeutic areas.
Our comprehensive suite of clinical development services includes, but is not limited to, the following:
Medical Affairs
The medical affairs group consists of therapeutic leads who provide strategic direction for study design and planning, train operational staff, work with primary investigators, provide medical monitoring and meet with regulatory agencies. Our customers rely on our expertise throughout the entire clinical trial process with therapeutically-focused physicians fully engaged throughout the study. We believe this depth of therapeutic leadership and engagement on each project results in a close working relationship with customers built on a level of trust that results in us being granted greater control over the clinical trial process.
Clinical Trial Management
Our team of clinical trial managers are responsible for leading all aspects of study execution. The clinical trial manager, or CTM, drives accountability across the functional team members and is responsible for successful operational execution. The CTM serves as the primary contact for the customer. Experience and therapeutic expertise are main factors when assigning CTMs to projects.
ClinTrak is integrated with our SOPs, allowing the CTMs to access real-time study metrics. ClinTrak is constantly evaluated and enhanced with our processes.
Study Feasibility
We have a dedicated feasibility team consisting of clinical experts who are an integrated part of the project team. Our feasibility team is able to analyze a specific protocol, using many data sources to determine countries and sites that are most appropriate for the study.
Study Start-Up
Our global Study Start-Up staff is well-versed in all aspects of clinical trial start up activities, including study documentation submission processes to independent Institutional Review Boards, or IRBs, ethics committees and to ex-US competent authorities. Our study start-up team includes fully dedicated budget and legal associates to ensure focused negotiations and execution of site contracts.
Clinical Monitoring
Our clinical monitoring group consists of highly experienced clinical research associates, or CRAs, who are based in 35 countries. With their experience and training, our CRAs are able to provide unparalleled site management services that includes both in-house and onsite monitoring. Their knowledge of local regulations and laws, in addition to Good Clinical Practice, or GCP, and International Council on Harmonisation of Technical Requirements for Registration of Pharmaceuticals for Human Use, or ICH, guidelines ensure compliance and data quality. Our CRAs report into a global matrix structure to ensure consistent training, oversight and management. Each CRA receives comprehensive, hands-on training in an individualized curriculum consisting of in-house and field-based training, supplemented with clinical research department core rotations and ongoing study-specific training.
Global Regulatory Affairs
Our Global Regulatory Affairs department has a strong track record of providing expert strategic, operational, and tactical regulatory guidance, as well as creating thorough, scientifically-grounded regulatory compliant documentation to regulatory agencies around the globe. Members of this team bring a long tenure of regulatory experience and scientific knowledge to each project. The group, led by former government officials and experienced drug development
95
Table of Contents
subject matter experts, provides comprehensive international support at each stage of the drug and biologics development processes. They have particular expertise within the areas of advanced therapeutics, accelerated development pathways, pediatrics, and rare diseases. The group also has a dedicated publishing function that has full electronic and paper publishing capabilities to support all types of international regulatory submissions.
Medical Writing
Medical writers work closely with Medpace’s medical experts, biostatisticians, and other members of the study team to develop study protocols, clinical and statistical study reports, and integrated submission documents according to regulatory guidelines. Members of Medpace’s medical writing group possess substantial scientific knowledge and experience as well as strong communication skills. This skill set and collaborative approach coupled with a thorough quality control document review process, allow Medpace to produce high-quality, submission-ready documents for each contracted project.
Biometrics
We provide customers with high-quality data collected during clinical trials that is the foundation of a successful clinical trial and forms the backbone of regulatory submissions, including New Drug Applications. We use global GCP-compliant SOPs, combined with continuous quality control, to ensure that data is consistent, efficient, and comprehensive.
Data Management: Our data management team develops detailed specifications for the collection, organization, validation, analysis and quality control of clinical trial data ensuring the most cost-effective, secure and regulatory compliant process.
Biostatistics: Our experienced team of biostatisticians provides trial design consulting, statistical methodology recommendations, programming expertise and reporting accuracy necessary to deliver clinical trials efficiently and on time. We offer comprehensive data analysis plans, thoroughly tested and validated customized programs, interpretation of study results, integrated efficacy and safety analysis for regulatory submissions, adaptive design and statistical support throughout the clinical trial.
Pharmacovigilance
Our safety and pharmacovigilance group collects, evaluates, analyzes and reports safety information. We provide global adverse event management, physician reviewed safety narrative writing and custom safety surveillance. Monitored by licensed physicians who are trained to provide oversight and to analyze and evaluate the emerging safety profile of the compound, we have designed our process to ensure safety and expedite approvals.
Core Laboratory
Our core laboratory services include both imaging services and cardiovascular core laboratory services. We partner with imaging experts from major academic and clinical institutions involved in research to provide image reading in a secure environment utilizing identical software and workstations integrated into ClinTrak allowing for prompt turnaround and oversight. Our imaging experts have clinical trial experience utilizing imaging modalities such as CT, MRI, PET/CT, 3D volumetric analysis, ultrasound, DEXA, angiography, endoscopy and photography. Our cardiovascular core laboratory provides state-of-the-art standardized electrocardiogram services and data analysis to support clinical trials.
Quality Assurance
Our quality assurance team works closely with study teams to ensure compliance with protocols, SOPs, and regulatory guidelines to ultimately protect research subject safety as well as the integrity and validity of study data. Our quality assurance team also provides services including regulatory training, internal system audits, SOP oversight, hosting of audits and regulatory inspections, as well as performs third party audits of critical vendors and investigative sites on behalf of our customers.
Laboratories
Central Laboratory. Through our Central Laboratory, we provide comprehensive, full-service capabilities globally in four locations, including Cincinnati, Ohio; Leuven, Belgium; Beijing, China; and Singapore. The Central Laboratory has longstanding core competency in specialized esoteric testing, including biomarkers for efficacy (approximately 60% of central lab revenue for the Successor year ended December 31, 2015) in addition to standard assay offerings. Data consistency and harmonization are maintained utilizing global SOPs and reference ranges, identical
96
Table of Contents
analytic platforms, methodologies, reagent systems, calibrator and quality control programs, within a strict framework compliant with GCP requirements and regulatory guidelines to ensure laboratory data reflect the impact of the investigational compound and not differences in testing practices.
Bioanalytical Laboratory. Through our Bioanalytical Laboratory we provide highly scientific and value-added testing of biological samples using proprietary methods. Working in a Good Laboratory Practice compliant setting following FDA and European Medicines Agency, or EMA, guidelines, the Bioanalytical Laboratory delivers method transfer, development, validation, sample analysis and metabolite screening and identification of pre-clinical and clinical biological samples with expertise in developing proprietary, highly scientific, esoteric and sensitive tests. Areas of specific bioanalytical expertise include advanced mass spectrometry and immunoassay technologies for bioanalytical analysis and all bioanalytical aspects for small and large molecules. Our Bioanalytical Laboratory is located on our clinical research campus in Cincinnati, Ohio.
The majority of our laboratory services are performed as a component of a full-service clinical development arrangement with our customers. We also offer our laboratory services on a stand-alone basis, although this has historically represented an immaterial amount of our net service revenue. Regardless of the nature of the arrangement, our laboratory services are delivered consistently to our customers as a component of their clinical development activities.
Clinics
Our Clinics offering conducts studies in normal healthy volunteers, special populations, and patient populations over a spectrum of diseases including endocrine, cardiovascular and metabolic. Experience includes, but is not limited to: first-in-human, bioavailability/bioequivalence, single and multiple ascending dose, drug to drug interaction, food effect and device studies. Our 60,000 square-foot, 84 bed facility is centrally located on our clinical research campus in Cincinnati, Ohio.
Customers
We have a well-diversified, attractively-positioned customer base that includes small biopharmaceutical companies, mid-sized biopharmaceutical companies and large pharmaceutical companies. We have conducted trials for many of the world’s leading pharmaceutical, biotechnology and medical device companies.
For the Successor year ended December 31, 2015, we generated 55.7%, 29.3% and 15.0% of our net service revenue from small biopharmaceutical companies, mid-sized biopharmaceutical companies and large pharmaceutical companies, respectively. Additionally, we serve customers in a variety of locations throughout the world, with approximately 55% of our clinical operations headcount based in North America, 39% in Europe, 4% in Asia/Pacific and 2% in South America and Africa as of June 30, 2016.
For the Successor six months ended June 30, 2016 and the Successor year ended December 31, 2015, our largest customer accounted for 6.3% and 6.9% of our net service revenue, respectively, and our top 10 customers represented 38.2% and 39.9% of our net service revenue, respectively. For more information about our largest customer see “Certain Relationships and Related Person Transactions—Service Agreements.”
Our net service revenue from our top 10 customers for the Successor year ended December 31, 2015 was diversified across approximately 57 compounds in 49 indications across 146 active projects. Our top 10 customers have worked with us for an average of 6.3 years as of December 31, 2015. Further, among the majority of our customers, net service revenue is diversified by multiple projects for a variety of compounds. For example, 54 of our customers have active projects in more than one therapeutic area, making up 56.8% of our total net service revenue for the Successor year ended December 31, 2015. We believe this ability to penetrate across multiple therapeutic areas demonstrates our strong relationships with our customers and the attractiveness of our full-service, disciplined operating model.
We have in the past and may in the future enter into arrangements with our customers or other drug, biologic or medical device companies in which we take on payment risk by making strategic investments in our customers or other drug companies, providing flexible payment terms or fee financing to customers or other companies, or entering into other risk sharing arrangements on trial execution. We expect that the use of such arrangements will be very limited, and they are not a part of our core growth strategy.
97
Table of Contents
New Business Awards, Cancellations and Backlog
New business awards represent the value of anticipated future net service revenue that has been awarded during the period that is recognized in backlog. This value is recognized upon the signing of a contract or receipt of a written pre-contract confirmation from a customer that confirms an agreement in principle on budget and scope. New business awards also include contract amendments, or changes in scope, where the customer has provided written authorization for changes in budget and scope or has approved us to perform additional work as of the measurement date. Awards may not be recognized as backlog after consideration of a number of factors, including whether (i) the relevant net service revenue is expected only after a pending regulatory hurdle, which might result in cancellation of the study, (ii) the customer funding needed for commencement of the study is not believed to have been secured or (iii) study timelines are uncertain or not well defined timeline. In addition, study amounts that extend beyond a three-year timeline are not included in backlog. The number and amount of new business awards can vary significantly from period to period, and an award’s contractual duration can range from several months to several years based on customer and project specifications.
Cancellations arise in the normal course of business and are reflected when we receive written confirmation from the customer to cease work on a contractual agreement. The majority of our customers can terminate our contracts without cause upon 30 days’ notice. Similar to new business awards, the number and amount of cancellations can vary significantly period over period due to timing of customer correspondence and study-specific circumstances. Total cancellations in a period are offset against gross new business awards received in a period to determine net new business awards in our backlog calculation.
Net new business awards were $218.1 million and $162.6 million for the Successor six months ended June 30, 2016 and June 30, 2015, respectively. Net new business awards were $359.5 million, $329.1 million (of which $231.9 million related to the Successor nine month period ended December 31, 2014 and $97.2 million related to the Predecessor three month period ended March 31, 2014) and $291.6 million for the Successor year ended December 31, 2015, the combined Successor nine month period ended December 31, 2014 and Predecessor three month period ended March 31, 2014, and the Predecessor year ended December 31, 2013, respectively. Our net new business awards for the Successor year ended December 31, 2015 grew at a CAGR of 18% since 2012.
Backlog represents anticipated future net service revenue from net new business awards that have not commenced or are currently in process but not complete. Reported backlog will fluctuate based on new business awards, changes in scope to existing contracts, cancellations, net service revenue recognition on existing contracts and foreign exchange adjustments from non-U.S. dollar denominated backlog. As of June 30, 2016, our backlog increased by $65.1 million, or 16.3%, to $465.7 million compared to $400.6 million as of June 30, 2015. Our backlog as of December 31, 2015, December 31, 2014 and December 31, 2013 was approximately $429.7 million, $394.0 million and $359.3 million, respectively. Included within backlog as of June 30, 2016 is approximately $170.1 million to $175.1 million that we expect to convert to net service revenue in 2016, with the remainder expected to convert to net service revenue in years after 2016. Our backlog as of December 31, 2015 grew at a CAGR of 11% since 2012.
Backlog and net new business award metrics may not be reliable indicators of our future period net service revenue as they are subject to a variety of factors that may cause material fluctuations from period to period. These factors include, but are not limited to, changes in the scope of projects, cancellations and duration and timing of services provided. No assurance can be given that we will be able to realize the net service revenue that is included in backlog. See “Risk Factors—Risks Relating to Our Business—Our backlog may not convert to net service revenue at our historical conversion rates,” and “Management’s Discussion and Analysis of Financial Condition and Results of Operations—New Business Awards, Cancellations and Backlog” for more information.
Sales and Marketing
We employ an integrated sales and marketing team to sell our services to biotechnology, pharmaceutical and medical device companies.
We have an experienced and highly trained global team of professional business development representatives and business development support staff focused on securing business from both new and existing customers, through a
98
Table of Contents
consultative and strategic sales approach. We embed our medical and scientific experts from the beginning of the sales process when we first engage potential customers, and they remain embedded across the lifecycle of the sale and throughout the life of the project, program or partnership.
As part of its sales strategy, our business development team focuses on a customer segmentation model. Our team targets and engages customers in our addressable market, matches customer characteristics with therapeutic fit and maintains a mindset of full-service outsourcing. Our structured and disciplined approach facilitates strong account evaluation, which results in increased focus by the sales team, the development of effective and productive territories, the management of sales force effectiveness and the creation of a process whereby both marketing and sales operate under the same guiding principles.
We are able to consult collaboratively with our customers and help optimize timely completion of their clinical trials and programs, in part, because we engage our therapeutic experts from the beginning of the sales process and involve our regulatory affairs experts and highly trained operations team throughout the clinical trial process. Our sales team is then able to take the study design, regulatory plan and execution plan discussed up front and carry that through to the proposal and provide a final concept during one-on-one customer discussions and final CRO evaluations.
Our marketing team supports the business development function in three key areas, generating brand awareness through customized campaigns and web-site development, conference planning and lead generation through market research and business intelligence analysis. The marketing team is set up in two mirrored teams, one team to address our therapeutic strategy and tactics, and the second team to monitor and address market environment across our lines of business. All of our sales and marketing data are housed within a third party customer relationship management tool that provides us the analytics we need to make sales planning and sales management decisions.
Competition
We compete primarily against other full-service CROs as well as services provided by in-house R&D departments of biopharmaceutical companies, universities and teaching hospitals. Our major CRO competitors include Covance Inc., ICON plc, INC Research Holdings, Inc., inVentiv Health, Inc., PAREXEL International Corporation, Pharmaceutical Product Development, LLC, PRA Health Sciences, Inc., Quintiles Transnational Holdings Inc. and numerous specialty and regional CROs.
We generally compete on the basis of a number of factors, including experience within specific therapeutic areas, quality of staff and services, reliability, range of provided services, ability to recruit principal investigators and patients into studies expeditiously, ability to organize and manage large-scale, global clinical trials, global presence with strategically located facilities, speed to completion, price and overall value. We believe we compete effectively with our competitors across these factors, particularly due to our full-service operating model, our deep therapeutic expertise in areas that are among the largest, most complex and fastest growing in pharmaceutical development, our global platform and our experienced and committed management team. However, some of our competitors have greater financial resources and a wider range of service offerings over a greater geographic area than we do, which could put us at a competitive disadvantage with respect to these competitors.
The CRO industry remains fragmented, with several hundred smaller, narrowly focused service providers and a small number of full-service companies with global capabilities. We believe there are significant barriers to others becoming a global provider offering a broad range of services and products including the cost and experience necessary to develop strong therapeutic areas, expertise to manage complex clinical programs, infrastructure to support large global programs, ability to deliver high-quality services and expertise required to prepare regulatory submissions in numerous jurisdictions.
Government Regulation
Development of Drugs, Biologics and Medical Devices
The development of drugs, biologics and medical devices is highly regulated in the United States and other countries. Our services are subject to varying regulatory requirements designed to ensure the quality and integrity of the pre-clinical and clinical trial process. In the United States, the FDA has primary authority to regulate these
99
Table of Contents
activities, in addition to the approval process, and the subsequent manufacturing, safety, labeling, storage, record keeping and marketing for these products, which are the responsibility of our customers. Before a marketing application for a drug is ready for submission to regulatory authorities, the candidate drug must often undergo rigorous testing in clinical trials. In the United States, these trials must be conducted in accordance with the Federal Food, Drug, and Cosmetic Act, its implementing regulations, and other federal and state requirements that require the drug to be tested and studied in certain ways prior to approval. The FDA has similar authority and requirements with respect to the clinical testing of biological products and medical devices. Before a human clinical trial may begin in the United States, the manufacturer or sponsor of the clinical product candidate must file an Investigational New Drug Application, or IND, with the FDA, which contains, among things, the results of pre-clinical tests, manufacturer information and other analytical data. A separate submission to an existing IND must also be made for each successive clinical trial conducted during product development. Each clinical trial must be conducted pursuant to, and in accordance with, an effective IND. Each human clinical trial we conduct is subject to the oversight of an IRB, which is an independent committee that has the regulatory authority to review, approve and monitor a clinical trial for which the IRB has responsibility. The FDA and IRB receive reports on the progress of each phase of clinical testing and may require the modification, suspension, or termination of clinical trials if, among other things, an unreasonable risk is presented to patients or if the design of the trial is insufficient to meet its stated objective. In addition, information about certain clinical trials must be made publicly available on the federal government website, www.clinicaltrials.gov.
In the United States, GCP regulations govern the design, conduct, performance, monitoring, auditing, recording, analysis, and reporting of clinical trials. In order to comply with GCP and other requirements, we must, among other things:
| n | comply with specific requirements governing the selection of qualified principal investigators and clinical research sites; |
| n | obtain specific written commitments from principal investigators; |
| n | obtain IRB review and approval and supervision of the clinical trials by an independent review board or ethics committee; |
| n | obtain a favorable opinion from regulatory agencies to commence a clinical trial; |
| n | verify that appropriate patient informed consents are obtained before the patient participates in a clinical trial; |
| n | ensure that adverse drug reactions resulting from the administration of a drug or biologic during a clinical trial are medically evaluated and reported in a timely manner; |
| n | monitor the validity and accuracy of data; |
| n | monitor drug or biologic accountability at clinical research sites; and |
| n | verify that principal investigators and clinical trial staff maintain records and reports and permit appropriate governmental authorities access to data for review. |
Clinical trials conducted outside the United States are subject to the laws and regulations of the country where the trials are conducted. These laws and regulations may or may not be similar to the laws and regulations administered by the FDA and other laws and regulations regarding the protection of patient safety and privacy and the control of clinical trial pharmaceuticals, medical devices or other clinical trial materials. Within the EU, these requirements are enforced by the EMA and requirements may vary slightly from one member state to another. In Canada, clinical trials are regulated by the Health Products and Food Branch of Health Canada as well as provincial regulations. Similar requirements also apply in other jurisdictions, including countries outside the EU and countries in Asia and Latin America where we operate or where our customers may intend to apply for marketing authorization. Clinical trials conducted outside the United States also may be subject to FDA regulation if the clinical trials are conducted pursuant to an IND or an Investigational Device Exemption for a product candidate that will seek FDA approval or clearance. In addition, clinical trial sponsors follow ICH E6 guidelines as a principle for good clinical practices.
The clinical trial customer and the parties conducting the clinical trials share in responsibilities to ensure that all applicable legal and regulatory requirements are fulfilled. Many of the functions we regularly perform in the conduct of clinical trials subject us directly to regulations (e.g., compliance with GCP), and in some circumstances, we will take on legal and regulatory responsibility either through a transfer of obligations to us from our clinical trial customers or our acting as local legal representative for certain of our clinical trial customers. We may be subject to
100
Table of Contents
regulatory action if we fail to comply with these requirements. Failure to comply with certain regulations may also result in the termination of ongoing research and disqualification of data collected during the clinical trials. For example, violations of GCP could result, depending on the nature of the violation and the type of product involved, in the issuance of a warning letter, suspension or termination of a clinical trial, refusal of the FDA to approve clinical trial or marketing applications or withdrawal of such applications, injunction, seizure of investigational products, civil penalties, criminal prosecutions or debarment from assisting in the submission of new drug applications. See “Risk Factors—Risks Relating to Our Business—If we fail to perform our services in accordance with contractual requirements, government regulations and ethical considerations, we could be subject to significant costs or liability and our reputation could be adversely affected.”
We monitor our clinical trials to test for compliance with applicable laws and regulations in the United States and the foreign jurisdictions in which we operate. We have adopted SOPs that are designed to satisfy regulatory requirements and serve as a mechanism for controlling and enhancing the quality of our clinical trials. In the United States, our procedures were developed to ensure compliance with GCP and associated requirements.
Health Information Privacy
The confidentiality of personal health information, including patient-specific information collected during clinical trials, is heavily regulated in the United States and other countries. The U.S. Department of Health and Human Services has promulgated rules under the Health Insurance Portability and Accountability Act of 1996, as amended by the Health Information Technology for Economic and Clinical Health Act of 2009 and their implementing regulations, including the Privacy and Security Rules, or collectively, HIPAA, that govern the use, handling and disclosure of personally identifiable medical information. These regulations also establish procedures for the exercise of an individual’s rights and the methods permissible for de-identification of health information. HIPAA applies to “covered entities,” which include certain types of health care providers, as well as service providers to covered entities which access protected health information, known as “business associates.” Two of our subsidiaries, Medpace Clinical Pharmacology, LLC and C-MARC, LLC, are covered entities under HIPAA. Further, many investigators with whom we are involved in clinical trials are also directly subject to HIPAA as covered entities. There are instances where we may be considered a business associate of a covered entity investigator, and we have signed business associate agreements with some investigators. If we are determined to be a business associate, we would be directly liable for any breaches of protected health information and other HIPAA violations. We are also liable contractually under any business associate agreements we have signed with covered entities. In addition, we are also subject to privacy legislation in Canada under the federal Personal Information Protection and Electronic Documents Act, the Act Respecting the Protection of Personal Information in the Private Sector and the Personal Health Information Protection Act and privacy legislation in the EU under the 95/46/EC Privacy Directive on the protection and free movement of personal data, as replaced by the General Data Protection Regulation from early 2018 onwards. See “Risk Factors—Risks Relating to Our Industry—Current and proposed laws and regulations regarding the protection of personal data could result in increased risks of liability or increased cost to us or could limit our service offerings.”
Health Industry Arrangements
The conduct of pre-clinical and clinical trials may be subject to laws and regulations that are intended to prevent the misuse of government health care program funding. In the United States, these laws include, among others, the False Claims Act, which prohibits submitting or causing the submission of false statements or improper claims for government health care program payments; and the Anti-Kickback statute, which prohibits paying, offering to pay or receiving payment with the intent to induce the referral of services or devices that are covered under a federal health care program. Violations of these laws and regulations may incur administrative, civil, and criminal penalties.
Employee Safety and Workplace Conditions
Most of our employees are office based and subject to health and safety regulations covering offices, with which we comply. In addition to its comprehensive regulation of safety in the workplace, the U.S. Occupational Safety and Health Administration has established extensive requirements relating to workplace safety for healthcare employers whose workers might be exposed to blood-borne pathogens such as HIV and the hepatitis B virus, which apply to our clinic and laboratories. Furthermore, certain employees might have to receive initial and periodic training to ensure compliance with applicable hazardous materials regulations and health and safety guidelines. We are subject to similar regulations with respect to our laboratories in Belgium, Singapore and China.
101
Table of Contents
Environmental Regulation and Liability
We are subject to various laws and regulations relating to the protection of the environment and human health and safety in the countries in which we do business, including laws and regulations governing the management and disposal of hazardous substances and wastes, the cleanup of contaminated sites and the maintenance of a safe workplace. Our operations include the use, generation and disposal of hazardous materials and medical wastes. We may, in the future, incur liability under environmental statutes and regulations for contamination of sites we own or operate (including contamination caused by prior owners or operators of such sites), the off-site disposal of hazardous substances and for personal injuries or property damage arising from exposure to hazardous materials from our operations. We believe that we have been and are in substantial compliance with all applicable environmental laws and regulations and that we currently have no liabilities under such environmental requirements that could reasonably be expected to materially harm our business, results of operations or financial condition.
Intellectual Property
We develop and use a number of proprietary methodologies, analytics, systems, technologies and other intellectual property in the conduct of our business. We rely upon a combination of confidentiality policies, nondisclosure agreements and other contractual arrangements to protect our trade secrets, and copyright and trademark laws to protect other intellectual property rights. We have obtained or applied for trademarks and copyright protection in the United States and in a number of foreign countries. Our material trademarks include Medpace and ClinTrak. Although the duration of trademark registrations varies from country to country, trademarks generally may be renewed indefinitely so long as they are in use and/or their registrations are properly maintained, and so long as they have not been found to have become generic. Although we believe the ownership of trademarks is an important factor in our business and that our success does depend in part on the ownership thereof, we rely primarily on the innovative skills, technical competence and marketing abilities of our employees. We do not have any material licenses, franchises or concessions.
Employees
As of June 30, 2016 we had approximately 2,300 employees worldwide, with approximately 66% in North America, 29% in Europe, 4% in Asia/Pacific and 1% in South America and Africa. None of our employees are currently covered by a collective bargaining agreement specific to our company. We believe our overall relations with our employees are good. As of December 31, 2015, December 31, 2014 and December 31, 2013, we had approximately 2,000, 1,700 and 1,400 employees, respectively.
The success of our business depends upon our ability to attract and retain qualified professional, scientific and technical staff. The level of competition among employers in the United States and overseas for skilled personnel, particularly for those with Ph.D., M.D. or equivalent degrees or training, is high. We believe that our brand recognition and our multinational presence are advantages in attracting qualified candidates. We also believe that the wide range of clinical trials in which we participate allows us to offer broad experience to clinical researchers. In addition, our disciplined and centralized approach to hiring and training has fostered, and we believe will continue to foster, strong employee loyalty and a low turnover rate.
Properties
As of June 30, 2016, we had 29 facilities located in 25 countries. Most of our facilities consist solely of office space; however, we have five laboratories located across four facilities. We lease all of our facilities, with the exception of office space owned in Leuven, Belgium and Prague, Czech Republic. Our principal executive offices are located on a corporate campus in Cincinnati, Ohio consisting of three buildings totaling approximately 332,000 square feet. The leases for the Cincinnati site expire in 2022, 2026 and 2027. None of our leases are individually material to our business model and all have either options to renew or are located in major markets with what we believe are adequate opportunities to continue business operations on terms satisfactory to us.
Liability and Insurance
We may be liable to our customers for any failure to conduct their clinical trials properly according to the agreed-upon protocol and contract. If we fail to conduct a clinical trial properly in accordance with the agreed-upon procedures, we may have to repeat a clinical trial or a particular portion of the services at our expense, reimburse the customer for the cost of the services and/or pay additional damages.
102
Table of Contents
At our Phase I clinic, we study the effects of drugs on healthy volunteers. In addition, in our clinical business we, on behalf of our customers, contract with physicians who render professional services, including the administration of the substance being tested to participants in clinical trials, many of whom are seriously ill and are at great risk of further illness or death as a result of factors other than their participation in a trial. As a result, we could be held liable for bodily injury, death, pain and suffering, loss of consortium or other personal injury claims and medical expenses arising from a clinical trial. In addition, we sometimes engage the services of vendors necessary for the conduct of a clinical trial, such as laboratories or medical diagnostic specialists. Because these vendors are engaged as subcontractors, we are responsible for their performance and may be held liable for damages if the subcontractors fail to perform in the manner specified in their contract.
To reduce our potential liability, and as a requirement of the GCP regulations, informed consent is required from each volunteer and patient. In addition, our customers provide us with contractual indemnification for all of our service related contracts. These indemnities generally do not, however, protect us against certain of our own actions such as those involving negligence or misconduct. Our business, financial condition and operating results could be harmed if we were required to pay damages or incur defense costs in connection with a claim that is not indemnified, that is outside the scope of an indemnity or where the indemnity, although applicable, is not honored in accordance with its terms.
We maintain errors, omissions and professional liability insurance in amounts we believe to be appropriate. This insurance provides coverage for vicarious liability due to negligence of the investigators who contract with us, as well as claims by our customers that a clinical trial was compromised due to an error or omission by us. If our insurance coverage is not adequate, or if insurance coverage does not continue to be available on terms acceptable to us, our business, financial condition and operating results could be materially harmed.
Legal Proceedings
We are currently party to legal proceedings incidental to our business and may become subject to additional legal proceedings in the future. We believe that the ultimate outcome of the proceedings to which we are currently a party, individually and in the aggregate, will not have a material adverse effect on our consolidated financial statements. Litigation is subject to inherent uncertainties. See Note 9 to our audited financial statements included in this prospectus for a discussion of legal proceedings.
103
Table of Contents
Executive Officers and Directors
The following table sets forth certain information concerning our executive officers and directors as of the date set forth on the cover page of this prospectus:
| NAME |
AGE | POSITION | ||||
| Dr. August J. Troendle |
59 | President, Chief Executive Officer and Chairman of the Board of Directors | ||||
| Jesse J. Geiger |
42 | Chief Financial Officer and Chief Operating Officer, Laboratory Operations | ||||
| Susan E. Burwig |
53 | Senior Vice President, Operations | ||||
| Stephen P. Ewald |
47 | General Counsel and Corporate Secretary | ||||
| Penelope J. Bucknell |
58 | Vice President, Human Resources | ||||
| Dr. Supraj R. Rajagopalan |
38 | Director | ||||
| Alexander F.S. Leslie |
36 | Director | ||||
| Matthew R. Norton |
31 | Director | ||||
| Robert O. Kraft |
46 | Director | ||||
| Brian T. Carley |
62 | Director | ||||
The following is a biographical summary of the experience of our executive officers and directors:
Executive Officers
Dr. August J. Troendle—President, Chief Executive Officer and Chairman of the Board of Directors
Dr. August J. Troendle has been the President, Chief Executive Officer and Chairman of the Board of Directors of Medpace since he founded the Company in July 1992. Before founding Medpace, Dr. Troendle served as Assistant Director, Associate Director and Senior Associate Director from 1987 to 1992 at Sandoz (Novartis), where he was responsible for the clinical development of lipid altering agents. From 1986 to 1987, Dr. Troendle worked as a Medical Review Officer in the Division of Metabolic and Endocrine Drug Products at the FDA. Dr. Troendle also has extensive experience serving as a director for a diverse group of public and private companies, including as a director of Coherus BioSciences, Inc. since 2012, as a director of Xenon Pharmaceuticals Inc. from 2007 to 2008, as a director of Symplmed Pharmaceuticals, LLC since 2013, as a director of LIB Therapeutics, LLC since 2015 and as a director of CinRx Pharma, LLC since 2015. Dr. Troendle received his Medical Degree from the University of Maryland, School of Medicine. We believe Dr. Troendle brings to our Board valuable perspective and experience as our Chief Executive Officer, and as a former member of a large pharmaceutical company and the FDA, as well as extensive knowledge of the CRO and biopharmaceutical industries, and his experience serving on public and private boards, all of which qualify him to serve as the Chairman of our Board.
Jesse J. Geiger—Chief Financial Officer and Chief Operating Officer, Laboratory Operations
Jesse J. Geiger joined Medpace in October 2007 as Corporate Controller, and he was appointed Chief Financial Officer in March 2011. Mr. Geiger became Chief Operating Officer, Laboratory Operations in November 2014. Prior to joining Medpace, Mr. Geiger worked for SENCORP from 2004 to 2007 as the Corporate Controller and Manager of Financial Planning and Analysis. Prior to SENCORP, Mr. Geiger served as the Director of Capital Markets for Cincinnati Bell from 2002 to 2004. Mr. Geiger started his career in the audit practice at Arthur Andersen LLP. Mr. Geiger has served as a director for several private companies, including as a director of Symplmed Pharmaceuticals, LLC since 2013, as a director of LIB Therapeutics, LLC since 2016 and as a director of CinRx Pharma, LLC since 2016. Mr. Geiger received his Bachelor of Business Administration in Accounting from the University of Cincinnati and is a Certified Public Accountant.
Susan E. Burwig—Senior Vice President, Operations
Susan E. Burwig joined Medpace in August 1993 and has served in various key leadership roles within the Clinical Operations department. From February 2003 to May 2015, Ms. Burwig served as Senior Vice President, Clinical Operations, overseeing clinical trial management, clinical monitoring, start-up, including feasibility, and new business proposals. In June 2015, Ms. Burwig was appointed Senior Vice President, Operations. Prior to joining Medpace, Ms. Burwig held several clinical roles, including leading heart failure clinical research studies at the University of Cincinnati. Ms. Burwig received her Bachelor of Science in Nursing as well as an MA in Sports Administration from Kent State University.
104
Table of Contents
Stephen P. Ewald—General Counsel and Corporate Secretary
Stephen P. Ewald joined Medpace as General Counsel and Corporate Secretary in June 2012. Prior to joining Medpace, Mr. Ewald served as the Managing Director and Chief Legal Officer of Brevet Capital Management from May 2011 to June 2012. From May 2009 to May 2011, he was a Managing Director and Assistant General Counsel for Cantor Fitzgerald Securities/Cantor Fitzgerald & Co. Mr. Ewald was employed with Bank of America from 1999 to 2009, serving in various roles within the legal department and the Global Markets Group, including Managing Director and Chief Operating Officer of the Principal Capital Group, a proprietary investing group within Bank of America Securities. Mr. Ewald has served as director for several private companies, including as a director of Symplmed Pharmaceuticals, LLC since 2013, as a director of LIB Therapeutics, LLC since 2016 and as a director of CinRx Pharma, LLC since 2016. Mr. Ewald received his Bachelor of Science in Political Sciences from the University of Cincinnati and his Juris Doctorate from the University of Cincinnati College of Law.
Penelope J. Bucknell—Vice President, Human Resources
Penelope J. Bucknell joined Medpace in February 2012 as Vice President, Human Resources. Ms. Bucknell has also led the Global Travel department since joining the Company, and the Facilities department since January 2015. Prior to joining Medpace, Ms. Bucknell was the Human Resources Director, Europe and Latin America for Underwriters Laboratories from August 2008 to February 2012. Before that, from 1998 to 2008, she served as Director and Executive Director, Human Resources, EMEA and Asia Pacific for Pharmaceutical Product Development. Ms. Bucknell received her Bachelor of Science in Social Sciences from Brunel University and a Postgraduate Diploma in Personnel Management from PCL (now the University of Westminster). She is a Member of the Chartered Institute of Personnel and Development.
Non-Employee Directors
Dr. Supraj R. Rajagopalan—Director
Dr. Supraj R. Rajagopalan has served as a member of our Board since February 2014. Dr. Rajagopalan joined Cinven in 2004 and has been a partner since 2011. He currently leads Cinven’s Healthcare sector team, sits on the firm’s Executive Committee and is a member of the UK and Ireland regional team. From 2003 to 2004, he worked for The Boston Consulting Group, where he focused on projects in the financial services and healthcare sectors. Prior to this, he was a doctor in the UK National Health Service from 2001 to 2002. Dr. Rajagopalan has extensive experience serving as a director for a diverse group of European private and public companies. Dr. Rajagopalan graduated from Cambridge University with undergraduate and postgraduate degrees in Medical Sciences. Dr. Rajagopalan was chosen as a director because of his significant financial, investment and operational experience from his background in private equity finance, along with his past practice as a doctor.
Alexander F.S. Leslie—Director
Alexander F.S. Leslie has served as a member of our Board since February 2014. Mr. Leslie joined Cinven in 2006, has been a partner since January 2016 and is a member of Cinven’s Healthcare sector team and its UK and Ireland regional team. Prior to this, he worked in the Investment Banking Division of Morgan Stanley in London from 2003 to 2006. Mr. Leslie has extensive experience serving as a director for a diverse group of European private companies. Mr. Leslie has an MA in History from the University of Edinburgh. Mr. Leslie was chosen as a director because of his significant financial, investment and operational experience from his background in banking and private equity finance.
Matthew R. Norton—Director
Matthew R. Norton has served as a member of our Board since October 2015. Mr. Norton joined Cinven in 2010 and is a member of Cinven’s Healthcare sector team and its UK and Ireland regional team. Prior to joining Cinven, Mr. Norton worked in the Investment Banking Division of Citigroup in London from 2007 to 2010. There, he advised on M&A and restructuring deals across a range of sectors, including consumer, real estate and healthcare. Mr. Norton graduated from Imperial College London with an MSc in Physics. Mr. Norton was chosen as a director because of his significant financial, investment and operational experience from his background in banking and private equity finance.
105
Table of Contents
Robert O. Kraft—Director
Robert O. Kraft has served as a member of our Board since July 1, 2016. Mr. Kraft has served as the Executive Vice President of CVS Health Corporation and the President of Omnicare, Inc., CVS’s long-term care business, since August 2015. From September 2012 to August 2015, Mr. Kraft served as Senior Vice President and Chief Financial Officer of Omnicare, Inc., and from November 2010 to September 2012, he served as Senior Vice President, Finance of Omnicare, Inc. Before joining Omnicare, Inc., Mr. Kraft was an audit partner at PricewaterhouseCoopers LLP, where he worked for 18 years. Mr. Kraft received his Bachelor’s Degree in Accounting from the University of Dayton. Mr. Kraft was chosen as a director because of his significant financial and accounting experience from his background as an audit partner at PricewaterhouseCoopers LLP and his experience as an executive of a public company.
Brian T. Carley—Director
Brian T. Carley has served as a member of our Board since July 1, 2016. Mr. Carley is currently the Senior Vice President and Chief Financial Officer of Clubessential, LLC, a privately held Software as a Service (SaaS) company providing member engagement software. He previously served as President and Chief Executive Officer of the Cincinnati USA Regional Chamber from 2014 to 2015. From 2002 to 2014, Mr. Carley worked at Deloitte & Touche LLP, where he served as regional and office audit division head and audit partner. Before joining Deloitte & Touche LLP, Mr. Carley was employed by Arthur Andersen LLP from 1976 to 2002. There, he served as office managing partner and audit partner. Mr. Carley also has extensive experience serving as a director for a diverse group of companies, including as a director of Assurex Health, Inc. since 2015, and as a director and officer of numerous civic and charitable organizations. Mr. Carley received his Bachelor of Science in Accountancy from the University of Illinois, and he is a retired Certified Public Accountant. Mr. Carley was chosen as a director because of his significant financial, accounting and directorship experience from his background as an audit partner at Deloitte & Touche LLP and Arthur Andersen LLP and his experience serving on boards.
Board of Directors
Our business and affairs are managed under the direction of our Board. When considering whether directors have the experience, qualifications, attributes or skills, taken as a whole, to enable our Board to satisfy its oversight responsibilities effectively in light of our business and structure, the Board focuses primarily on each person’s background and experience as reflected in the information discussed in each of the directors’ individual biographies set forth above. We believe that our directors provide an appropriate mix of experience and skills relevant to the size and nature of our business.
Our amended and restated certificate of incorporation will provide that our Board will initially consist of six directors, and that our Board will be divided into three classes, as nearly equal as possible, with one class being elected at each annual meeting of shareholders. Each director will serve a three-year term, with termination staggered according to class. Our directors will initially be divided among the three classes as follows:
| n | the Class I directors will be Robert O. Kraft and Brian T. Carley and their terms will expire at the annual meeting of shareholders to be held in 2017; |
| n | the Class II directors will be Alexander F.S. Leslie and Matthew R. Norton and their terms will expire at the annual meeting of shareholders to be held in 2018; and |
| n | the Class III directors will be Dr. Supraj R. Rajagopalan and Dr. August J. Troendle and their terms will expire at the annual meeting of shareholders to be held in 2019. |
The size of our Board may thereafter be fixed from time to time solely by resolution of at least a majority of the directors then in office. Any increase or decrease in the number of directors will be distributed among the three classes so that, as nearly as possible, each class will consist of one-third of the directors. This classification of our Board may have the effect of delaying or preventing changes in control of our company. See “Description of Capital Stock—Anti-Takeover Effects of Our Amended and Restated Certificate of Incorporation and Amended and Restated Bylaws and Certain Provisions of Delaware Law.”
106
Table of Contents
Selection Arrangements
Because Cinven will continue to control a majority of the voting power of our common stock upon the closing of this offering, we expect that Cinven will control the election of our directors. In addition, we understand that, substantially concurrently with the closing of this offering, Cinven and Dr. August J. Troendle, our Chief Executive Officer and founder, intend to enter into the Voting Agreement. See “Certain Relationships and Related Person Transactions—Voting Agreement,” for additional information.
Director Independence and Controlled Company Exemption
Because of the Voting Agreement and the aggregate voting power of Cinven and Dr. Troendle, we are considered a “controlled company” within the meaning of the corporate governance standards of NASDAQ. Accordingly, we will not be required to have a majority of “independent directors” on our Board nor will we be required to have a compensation committee and a corporate governance and nominating committee composed entirely of “independent directors” as defined under the rules of NASDAQ. Further, our director nominees will not be required to be selected or recommended to the Board by a majority of the “independent directors” as defined under the rules of NASDAQ and compensation for our executives will not be determined by a majority of “independent directors” as defined under the rules of NASDAQ. The “controlled company” exemption does not modify the independence requirements for the audit committee, and we intend to comply with the requirements of Sarbanes-Oxley and NASDAQ, which require that our audit committee be composed of at least three members, one of whom will be independent upon the listing of our common stock, a majority of whom will be independent within 90 days of listing and each of whom will be independent within one year of listing.
After the consummation of this offering, we intend to avail ourselves of certain of these exemptions. In particular, immediately following this offering we will not have a nominating and corporate governance committee. Therefore, for as long as we remain a “controlled company” you will not have the same protections afforded to shareholders of companies that are subject to all of these corporate governance requirements. If at any time we cease to be a “controlled company” under the rules of NASDAQ, our Board will take all action necessary to comply with the NASDAQ corporate governance rules, including establishing certain committees composed entirely of independent directors, subject to a permitted “phase-in” period.
Our Board has affirmatively determined that Brian T. Carley, Robert O. Kraft, Dr. Supraj R. Rajagopalan, Alexander F.S. Leslie and Matthew R. Norton are independent directors under the applicable rules of NASDAQ.
Board Committees
Upon the consummation of this offering, and prior to the listing of our common stock on NASDAQ, we will establish an audit committee and a compensation committee. Each committee will operate under a charter that will be approved by our Board. Each committee will have the composition and responsibilities described below. Members serve on these committees until their resignations or until otherwise determined by our Board. The charter and composition of each committee will be effective upon the consummation of this offering. The charter of each committee will be available on our website.
Audit Committee
The primary purposes of our audit committee will be to assist the Board’s oversight of:
| n | the integrity of our corporate accounting and financial reporting processes and financial information; |
| n | our systems of internal control over financial reporting and disclosure controls and procedures; |
| n | our process related to risk management; |
| n | procedures for receipt, retention and treatment of complaints and the confidential anonymous submission by our employees regarding accounting or auditing matters; |
| n | the qualifications, engagement, compensation, independence and performance of our independent registered public accounting firm; |
| n | our independent registered public accounting firm’s annual audit of our financial statements and any engagement to provide other services; |
107
Table of Contents
| n | our legal and regulatory compliance; |
| n | our related person transaction policy; and |
| n | the application of our codes of business conduct and ethics as established by management and the Board. |
Upon the consummation of this offering, and prior to the listing of our common stock, our audit committee will be composed of Robert O. Kraft, Alexander F. S. Leslie and Brian T. Carley. Brian T. Carley will serve as chair of the audit committee.
Brian T. Carley qualifies as an “audit committee financial expert” as such term has been defined by the SEC in Item 407(d)(5) of Regulation S-K. Our Board has affirmatively determined that Robert O. Kraft and Brian T. Carley meet the definition of an “independent director” for the purposes of serving on the audit committee under applicable NASDAQ rules and Rule 10A-3 under the Exchange Act. We intend to comply with these independence requirements for all members of the audit committee within one year of the date of the listing of our common stock. The audit committee will be governed by a charter that complies with the rules of NASDAQ.
Compensation Committee
The primary purposes of our compensation committee will be to assist the Board in overseeing our management compensation policies and practices, including:
| n | determining and approving the compensation of our Chief Executive Officer and our executive officers; |
| n | assessing our performance management process and updates to our succession plan for our Chief Executive Officer and other key executive positions; |
| n | reviewing and approving incentive compensation policies and programs, and exercising discretion in the administration of those policies and programs; |
| n | reviewing and approving equity and non-equity compensation, welfare, benefit and pension programs, other plans and policies related to compensation for our employees, directors and consultants and exercising discretion in the administration of those programs; and |
| n | preparing the annual report of the compensation committee required by the rules of the SEC to be included in our annual report. |
Upon the consummation of this offering, and prior to the listing of our common stock, our compensation committee will be composed of Dr. Supraj R. Rajagopalan, Alexander F.S. Leslie and Robert O. Kraft. Dr. Supraj R. Rajagopalan will serve as chair of the compensation committee. Prior to the consummation of this offering, we did not have a compensation committee. The compensation committee will be governed by a charter that complies with the rules of NASDAQ.
Risk Oversight
Our Board is responsible for overseeing our risk management process. Our Board focuses on our general risk management strategy, the most significant risks facing us, and oversees the implementation of risk mitigation strategies by management. Our Board is also apprised of particular risk management matters in connection with its general oversight and approval of corporate matters and significant transactions.
Risk Considerations in our Compensation Program
We conducted an assessment of our compensation policies and practices for our employees and concluded that these policies and practices are not reasonably likely to have a material adverse effect on our company.
Code of Business Conduct and Ethics
Prior to the completion of this offering, we will update our written code of ethical business conduct that applies to our directors, officers and employees, including our principal executive officer, principal financial officer, principal accounting officer or controller, and persons performing similar functions. A copy of the code will be posted on our corporate website, which will be located at www.medpace.com. Any amendments to or waivers from our code of ethical business conduct will be disclosed on our Internet website promptly following the date of such amendment or waiver. Our Internet website and the information contained therein or connected thereto shall not be deemed to be incorporated into this prospectus or the registration statement of which it forms a part.
108
Table of Contents
Disclosure Committee and Charter
We do not currently have a disclosure committee and disclosure committee charter. We plan to establish a disclosure committee following this offering and it will operate under a charter. The purpose of the disclosure committee will be to provide assistance to the principal executive officer and the principal financial officer in fulfilling their responsibilities regarding the identification and disclosure of material information about us and the accuracy, completeness and timeliness of our financial reports.
Compensation Committee Interlocks and Insider Participation
No interlocking relationships exist between the members of our Board or our compensation committee and the board of directors or compensation committee of any other company.
Leadership Structure of our Board of Directors
Our amended and restated bylaws provide our Board with flexibility to combine or separate the positions of Chairman of the Board and Chief Executive Officer in accordance with its determination that utilizing one or the other structure would be in the best interests of our company. Upon completion of this offering, Dr. Troendle will serve as Chairman of the Board, President and Chief Executive Officer.
Indemnification of Directors and Officers
Our amended and restated certificate of incorporation provides that we will indemnify our directors and officers to the fullest extent permitted by the DGCL.
Our amended and restated certificate of incorporation provides that our directors will not be liable for monetary damages for breach of fiduciary duty, except for liability relating to any breach of the director’s duty of loyalty, acts or omissions not in good faith or which involve intentional misconduct or a knowing violation of law, violations under Section 174 of the DGCL or any transaction from which the director derived an improper personal benefit.
We intend to enter into new indemnification agreements with each of our directors and executive officers. These agreements, among other things, will require us to indemnify each director and executive officer to the fullest extent permitted by Delaware law, including indemnification of expenses such as attorneys’ fees, judgments, fines and settlement amounts incurred by the director or executive officer in any action or proceeding, including any action or proceeding by or in right of us, arising out of the person’s services as a director or executive officer, as applicable.
We have customary directors’ and officers’ indemnity insurance in place for our directors and executive officers.
109
Table of Contents
EXECUTIVE AND DIRECTOR COMPENSATION
This section discusses the material components of the executive compensation program for our executive officers who are named in the “2015 Summary Compensation Table” below. In 2015, our “named executive officers”, or NEOs, and their positions were as follows:
| n | Dr. August J. Troendle, President and Chief Executive Officer; |
| n | Mr. Jesse J. Geiger, Chief Financial Officer and Chief Operating Officer, Laboratory Operations; |
| n | Ms. Susan E. Burwig, Senior Vice President, Operations; and |
| n | Mr. Kurt A. Brykman, Former Chief Operating Officer, CRO Operations. |
Mr. Brykman’s employment ended on July 14, 2015.
This discussion may contain forward-looking statements that are based on our current plans, considerations, expectations and determinations regarding future compensation programs. Actual compensation programs that we adopt following the completion of this offering may differ materially from the currently planned programs summarized in this discussion.
2015 Summary Compensation Table
The following table sets forth summary compensation information for our NEOs for the fiscal year ended December 31, 2015:
| NAME AND PRINCIPAL POSITION |
SALARY ($) | BONUS (2) ($) |
STOCK AWARDS (3) ($) |
OPTION AWARDS (4) ($) |
ALL OTHER COMPENSATION (5) ($) |
TOTAL | ||||||||||||||||||
| August J. Troendle |
$ | 270,417 | — | $ | 7,432,800 | — | $ | 113,537 | $ | 7,816,754 | ||||||||||||||
| President and Chief Executive Officer |
||||||||||||||||||||||||
| Jesse J. Geiger |
$ | 300,000 | $ | 71,750 | — | — | $ | 9,000 | $ | 380,750 | ||||||||||||||
| Chief Financial Officer and Chief Operating Officer, Laboratory Operations |
||||||||||||||||||||||||
| Susan E. Burwig |
$ | 350,432 | $ | 62,900 | — | — | $ | 20,600 | $ | 433,932 | ||||||||||||||
| Senior Vice President, Operations |
||||||||||||||||||||||||
| Kurt A. Brykman |
$ | 225,217 | — | $ | 336,400 | $ | 239,000 | $ | 525,508 | $ | 1,326,125 | |||||||||||||
| Former Chief Operating Officer, CRO Operations (1) |
||||||||||||||||||||||||
| (1) | Mr. Brykman’s employment ended on July 14, 2015. Mr. Brykman’s salary shown in the table is the salary he received from January 1, 2015 through his termination date. |
| (2) | The amounts shown in the table represent 2015 earned annual bonus paid to Mr. Geiger and Ms. Burwig of $71,750 and $62,900, respectively. |
| (3) | All stock awards granted to NEOs during 2015 are valued based on the aggregate grant date fair value of such stock awards, computed in accordance with FASB ASC Topic 718, “Compensation-Stock Compensation” (“ASC 718”), and do not represent amounts paid to or realized by the NEO. We provide information regarding the assumptions used to calculate the value of all stock awards made to executive officers in 2015 in Note 8 to our audited consolidated financial statements included elsewhere in this prospectus. As described below under “Narrative to Summary Compensation Table,” all stock awards, except Dr. Troendle’s July 31, 2015 grant of 351,851 vested shares, were, immediately upon grant (net of any shares surrendered in respect of tax withholding obligations), contributed by the NEO to MPI in exchange for incentive units of MPI. Upon Mr. Brykman’s termination of employment, his vested restricted shares (which had been exchanged for incentive units of MPI) were repurchased and his unvested restricted shares (which had been exchanged for incentive units of MPI) were forfeited. |
| (4) | All stock option awards granted to any NEOs have been valued based on the fair value of the option awards computed in accordance with ASC 718, and do not represent amounts realized by the NEO. We provide information regarding the assumptions used to calculate the value of all option awards made to executive officers in 2015 in Note 8 to our audited consolidated financial statements included elsewhere in this prospectus. Upon Mr. Brykman’s termination of employment, he forfeited all his stock options, as they had not yet vested. |
| (5) | This column shows the following amounts for Mr. Brykman: $37,359 in relocation reimbursement assistance, a $212,641 relocation balance payment, a lump sum severance payment of $268,715, $1,793 in assistance towards benefit continuation under COBRA |
110
Table of Contents
| and $5,000 in fees for service as a member of our Board following his employment end date. The amount shown in this column for Mr. Geiger consists exclusively of fully vested 401(k) matching contributions paid to his account by the Company. |
The amounts shown in this column for Dr. Troendle and Ms. Burwig consist of fully vested 401(k) matching contributions of $10,600 each paid to their respective accounts by the Company and incremental costs of $102,937 and $10,000, respectively, attributable to personal usage of Company provided aircraft paid for by the Company on their behalf. For multi-leg hybrid flights in which at least one leg consists of personal use, the incremental cost of personal use is calculated based on the difference between the actual cost of the personal and business legs of the flight and the hypothetical cost that would have been incurred if only the business legs of the flight occurred, using costs provided by the chartered jet service provider. Pursuant to Company policy, for personal use of Company provided aircraft in which both Dr. Troendle and Ms. Burwig are present, incremental cost is allocated to Dr. Troendle for purposes of the Summary Compensation Table unless the incremental cost specifically relates to Ms. Burwig. See “—Narrative to Summary Compensation Table—Aircraft Usage.”
Narrative to Summary Compensation Table
Base Salaries
The NEOs receive base salaries to compensate them for services rendered to our company. The base salary payable to each NEO is intended to provide a fixed component of compensation reflecting the executive’s skill set, experience, role and responsibilities.
Dr. Troendle was party to an employment agreement entered into in 2011, and has entered into an amended and restated agreement in connection with this offering. Both employment agreements provide for a base salary of $410,000 per annum. After entering into his prior employment agreement and prior to 2015, Dr. Troendle requested and received a lower base salary equal to $120,000 per annum. Effective on March 1, 2015 and consistent with our merit cycle, Dr. Troendle’s base salary was adjusted from $120,000 to $227,500 per annum. A second adjustment was confirmed and made effective on September 1, 2015, which adjusted Dr. Troendle’s base salary from $227,500 to $410,000 per annum to bring his base salary in line with his employment agreement.
Effective March 1, 2015 and consistent with our merit cycle, Ms. Burwig’s base salary was adjusted from $317,099 to $357,099 per annum.
During 2016, in addition to our normal merit cycle, we intend to perform a comprehensive market review of the compensation of the senior executives of the Company, including the NEOs (other than Mr. Brykman).
Discretionary Annual Bonuses
In 2015, each of our NEOs was eligible for an annual discretionary cash bonus determined by Dr. Troendle. Our discretionary bonuses have been intended to reward past performance as well as to provide incentives for future performance.
Dr. Troendle did not award himself an annual bonus in 2015. For 2015, each other NEO had a target annual bonus of 35% of his or her annual base salary. Dr. Troendle based his determination of such bonus amounts on a subjective evaluation of individual and Company performance for 2015. Mr. Brykman did not receive an annual bonus for 2015 because his employment ended prior to the end of the year.
The actual bonuses paid for 2015 are shown in the Summary Compensation Table in the column entitled “Bonus.”
Equity Compensation
We have granted equity awards to certain of our employees, including the NEOs, pursuant to the Medpace (formerly known as Scioto Holdings, Inc.) 2014 Equity Incentive Plan. The 2014 Equity Incentive Plan provides for the grant of stock options, restricted shares, fully vested shares and restricted stock units. Stock options have historically been granted at a premium exercise price exceeding fair market value on the date of grant. As a condition to exercising stock options and acceptance of certain restricted shares, employees must execute a Contribution and Subscription Agreement that provides for the exchange of the shares issued for incentive units in MPI upon the occurrence of certain events. The incentive units are tied directly to common stock ownership of Medpace and entitle the incentive unit holder to participate in the risks and rewards of owning Medpace stock (including any vesting risk) through ownership in MPI. Pursuant to the terms of the 2014 Equity Incentive Plan, the requirement to exchange shares received under the 2014 Equity Incentive Plan for incentive units in MPI will cease to be applicable upon consummation of this offering.
Dr. Troendle was awarded two equity grants on July 31, 2015. One grant was for 351,851 fully vested shares of common stock outside of the 2014 Equity Incentive Plan. The other grant was for 251,851 restricted shares under
111
Table of Contents
the 2014 Equity Incentive Plan, 50% of which were scheduled to vest on December 31, 2015 and the remaining 50% of which were scheduled to vest on December 31, 2016. The grant of 251,851 restricted shares was immediately exchanged for incentive units of MPI, as required by the 2014 Equity Incentive Plan.
Mr. Geiger and Ms. Burwig were granted shares in 2014 (which were immediately exchanged for incentive units of MPI), of which 40% were immediately vested shares and the remaining 60% were restricted shares originally scheduled to vest in equal annual installments on each of the first three anniversaries of the date of grant.
On December 31, 2015, the Company accelerated the vesting of all outstanding, restricted shares awarded pursuant to the 2014 Equity Incentive Plan, including Dr. Troendle’s, Mr. Geiger’s and Ms. Burwig’s restricted shares (which were previously exchanged for incentive units in MPI).
Mr. Brykman was granted 29,629 shares of the Company’s common stock on March 23, 2015 (which were immediately exchanged for incentive units of MPI), of which 40% were immediately vested shares and the remaining 60% were restricted shares originally scheduled to vest in equal annual installments on each of the first three anniversaries from the date of grant. Upon Mr. Brykman’s termination of employment in July 2015, his 11,852 vested shares (which had been exchanged for incentive units of MPI) were repurchased by MPI for cash in an amount equal to 80% of their fair market value ($102,400). Mr. Brykman’s 17,777 restricted shares (which were immediately exchanged for incentive units of MPI), were unvested and therefore forfeited upon Mr. Brykman’s termination of employment.
On March 23, 2015, Mr. Brykman was granted stock options with respect to 74,074 shares of our common stock under the 2014 Equity Incentive Plan, subject to vesting in substantially equal installments over a four-year period. All such options were unvested as of his termination of employment and, accordingly, he forfeited them in connection with his termination of employment.
We have adopted, and our shareholders have approved, the 2016 Incentive Award Plan, or the Plan, in order to facilitate the grant of cash and equity incentives to directors, employees (including our NEOs) and consultants of our company and certain of its affiliates and to enable our company and certain of its affiliates to obtain and retain services of these individuals, which is essential to our long-term success. For additional information about the Plan, please see the section titled “Equity Incentive Plans” below.
Offering Grants to Employees under the 2016 Incentive Award Plan
In connection with this offering, under the Plan, we intend to grant to certain of our employees and non-employee directors awards of stock options at an exercise price equal to the initial public offering price of our common stock with respect to an aggregate of up to 685,310 shares of common stock immediately following the completion of this offering.
On July 28, 2016, our Board approved awards of stock options pursuant to the Plan in connection with this offering, as described above, to our NEOs (in the amounts shown in the table below) to be granted on the effective date of this Registration Statement. The terms of the stock options provide for (i) an exercise price equal to the initial public offering price of our common stock, (ii) full vesting upon the fourth anniversary of the date of grant, subject to the NEO’s continued employment, and (iii) expiration upon the seventh anniversary of the date of grant.
| NAME |
STOCK OPTIONS (#) | |||
| August J. Troendle |
50,000 | |||
| Jesse J. Geiger |
18,510 | |||
| Susan E. Burwig |
7,400 | |||
Other Elements of Compensation
Retirement Plans
We currently maintain a 401(k) retirement savings plan for our U.S. employees, including our NEOs, who satisfy certain eligibility requirements. Our NEOs are eligible to participate in the 401(k) plan on the same terms as other full-time U.S. employees. The U.S. Internal Revenue Code of 1986, as amended, or the Code, allows eligible employees to defer a portion of their compensation, within prescribed limits, on a pre-tax basis through contributions to the 401(k) plan. Currently, we match contributions made by participants in the 401(k) plan up to a specified percentage of the employee contributions, beginning in the calendar year following the first anniversary of employment. Matching contributions cliff-vest on the employee’s third anniversary with the Company. We believe
112
Table of Contents
that providing a vehicle for tax-deferred retirement savings though our 401(k) plan and making matching contributions that vest over a defined period add to the overall desirability of our executive compensation package and further incentivize our employees, including our NEOs, in accordance with our compensation policies. We do not currently maintain any defined benefit pension plans or deferred compensation plans.
Employee Benefits and Perquisites
All of our full-time U.S. employees, including our NEOs, are eligible to participate in our health and welfare plans, including:
| n | medical, dental and vision benefits; |
| n | short-term and long-term disability insurance; and |
| n | life insurance. |
We also provided Mr. Brykman with a relocation package in order to facilitate his relocation to the Cincinnati area upon joining the Company.
We believe the benefits and perquisites described above are necessary and appropriate to provide a competitive compensation package to our NEOs.
Aircraft Usage
The Company utilizes Reynolds Jet Management, a chartered jet service provider, to arrange for use of a personal aircraft owned by ATSB Aviation, which is owned by Dr. Troendle and Ms. Burwig, to allow executive officers to safely and efficiently travel for business purposes. Company provided aircraft allow executive officers to be more productive than if commercial flights were utilized, as the aircraft provides a conducive business environment without the scheduling constraints imposed by commercial airline services.
Depending on availability, family members of executive officers are permitted to accompany the executive officers on the aircraft when it is already going to a specific destination for a business purpose. Because the aircraft is chartered based on flight hours regardless of the passenger load, the aggregate incremental cost to the Company for any additional personal use by passengers is de minimis.
In addition, executive officers periodically use Company provided aircraft for multi-leg hybrid flights in which at least one leg consists of personal use. The aggregate incremental cost to the Company of such personal usage in 2015 is shown in the Summary Compensation Table above. Any personal passenger(s) on board would result in imputed income to the executive officers using the IRS Standard Industry Fare Level calculation. The Company does not provide gross-ups with respect to any income taxes incurred by the executive officers in connection with the personal use of aircraft.
Severance Benefits
We do not maintain a formal severance policy, and any severance we provide to our NEOs is individually negotiated. In exchange for a release of claims, we provided Mr. Brykman with cash severance and reimbursement of COBRA benefits in connection with his termination of employment in July 2015 in the amounts shown in the Summary Compensation Table in the column entitled “All Other Compensation.”
No Tax Gross-Ups
We do not make gross-up payments to cover our NEOs’ personal income taxes that may pertain to any of the compensation or perquisites paid or provided by our company.
113
Table of Contents
Outstanding Equity Awards at Fiscal Year-End
The following table summarizes the number of shares of common stock underlying outstanding equity incentive plan awards for each NEO as of December 31, 2015.(1)
| NAME |
GRANT DATE |
NUMBER OF SECURITIES UNDERLYING UNEXERCISED OPTIONS (#) EXERCISABLE |
NUMBER OF SECURITIES UNDERLYING UNEXERCISED OPTIONS (#) UNEXERCISABLE |
OPTION EXERCISE PRICE ($) |
OPTION EXPIRATION DATE |
|||||||||||||||
| August J. Troendle |
— | — | — | — | — | |||||||||||||||
| Jesse J. Geiger (2) |
7/7/2014 | 6,481 | 41,666 | $ | 14.40 | 7/7/2021 | ||||||||||||||
| Susan E. Burwig (2) |
7/7/2014 | 9,259 | 27,777 | $ | 14.40 | 7/7/2021 | ||||||||||||||
| Kurt A. Brykman |
— | — | — | — | — | |||||||||||||||
| (1) | This table does not reflect any fully vested restricted shares (which had been exchanged for incentive units of MPI) held by the NEOs as of December 31, 2015. |
| (2) | Mr. Geiger and Ms. Burwig were each granted stock options that vest in equal annual installments over a four-year period (i.e., 25% vest on each grant date anniversary). On September 22, 2015, Mr. Geiger elected to exercise 7,407 of the 13,888 options that vested on July 7, 2015, leaving him with 6,481 vested but not exercised options. |
Employment Agreement
In 2015, Dr. August J. Troendle was party to an employment agreement with the Company, effective as of June 17, 2011, which provided for a three-year initial term followed by successive one-year terms, but it could have been terminated by either party at any time upon 30 days’ advance written notice.
Dr. Troendle’s employment agreement provided for Dr. Troendle’s position as our Chief Executive Officer. Under the agreement, Dr. Troendle’s annual base salary was $410,000. The agreement also provided that Dr. Troendle would be eligible to receive an annual cash bonus, provided that he remained employed by us at the time we paid annual bonuses generally, based upon achievement of performance objectives and individual goals established by our Board. The agreement also provided for Dr. Troendle’s participation in all employee benefit plans and programs made available by the Company to our executives and the reimbursement of all reasonable business expenses incurred by Dr. Troendle.
Dr. Troendle’s employment agreement did not provide for any severance benefits upon termination other than the payment of accrued and unpaid base salary, any reimbursement due for incurred business expenses and any benefits due under our 401(k) plan in accordance with the terms of that plan. Upon termination, the treatment of any stock-based awards was governed by the terms of the applicable plan and grant agreement.
The Company and Dr. Troendle entered into an amended and restated employment agreement in connection with this offering, which agreement has a three-year term beginning July 25, 2016 followed by successive one-year terms. The material terms of the amended and restated employment agreement are substantially the same as those of the existing employment agreement, as described above. The amended and restated employment agreement also provides that the Company will cause Dr. Troendle to be appointed to the Board as of the effective date and will nominate him for re-election during the term.
None of our other executive officers is party to an employment agreement.
Director Compensation
None of our directors received compensation as a director for the fiscal year ended December 31, 2015, except for Mr. Brykman, who received $5,000 in fees for service as a director as indicated in the Summary Compensation Table.
In connection with this offering, under the Plan, we intend to grant to certain of our employees and non-employee directors awards of stock options at an exercise price equal to the initial public offering price of our common stock with respect to an aggregate of up to 685,310 shares of common stock immediately following the completion of this offering.
114
Table of Contents
On July 28, 2016, our Board approved awards of stock options pursuant to the Plan in connection with this offering, as described above, to certain of our non-employee directors (in the amounts shown in the table below) to be granted on the effective date of this Registration Statement. The terms of the stock options provide for (i) an exercise price equal to the initial public offering price of our common stock, (ii) 1⁄3 of the stock option to vest on October 31, 2016 and the remaining 2⁄3 of the stock option to vest in eight equal installments on the first day of each calendar month following October 31, 2016, in each case subject to the non-employee director’s continued service on the Board, and (iii) expiration upon the seventh anniversary of the date of grant.
| NAME |
STOCK OPTIONS (#) | |||
| Robert O. Kraft |
9,630 | |||
| Brian T. Carley |
7,400 | |||
We have adopted a compensation policy that, effective upon the closing of this offering, will be applicable to all of our non-employee directors. Pursuant to this policy, each eligible non-employee director will receive an annual cash retainer of $40,000. Each compensation committee member will receive an additional annual cash retainer of $7,500. Each audit committee member other than the committee chairperson will receive an additional annual cash retainer of $7,500 and the committee chairperson will receive an additional annual cash retainer of $20,000. Each annual retainer will be paid quarterly in arrears. In the case of the non-employee directors affiliated with Cinven, such retainers will be paid directly to Cinven and not to the directors individually. The Board may, in its discretion, permit a non-employee director to elect to receive any portion of the annual retainer in the form of fully vested and unrestricted shares of common stock in lieu of cash.
Also, pursuant to the director compensation policy, on the date of any annual meeting of our shareholders, we intend to grant each non-employee director other than those affiliated with Cinven an award of an option to purchase the numbers of shares of common stock (at a per-share exercise price equal to the closing price per share of the common stock on the date of such annual meeting (or on the last preceding trading day)) that have a grant date fair value of $90,000. The terms of each such award will be set forth in a written award agreement between each director and us, which will generally provide for vesting after one year of continued service as a director. Any director elected or appointed mid-year will receive a pro-rated portion of the annual award adjusted to reflect his or her period of service. Restricted stock units may be granted in lieu of an option for the initial award.
All cash and equity awards granted under the non-employee director compensation policy will be granted under, and subject to the limits of, the Plan.
Equity Incentive Plans
2014 Equity Incentive Plan
We maintain the 2014 Equity Incentive Plan, as described above. On and after the closing of this offering and following the effectiveness of the Plan (as described below), no further grants will be made under the 2014 Equity Incentive Plan.
2016 Incentive Award Plan
We have adopted, and our shareholders have approved, the Plan, under which we may grant cash and equity incentive awards to eligible service providers in order to attract, motivate and retain the talent for which we compete. The material terms of the Plan are summarized below.
Eligibility and Administration. Our employees, consultants and directors, and employees, consultants and directors of our subsidiaries are eligible to receive awards under the Plan. The Plan is administered by our Board with respect to awards to non-employee directors and by our compensation committee with respect to other participants, each of which may delegate its duties and responsibilities to committees of our directors and/or officers (referred to collectively as the plan administrator below), subject to certain limitations that may be imposed under Section 162(m) of the Code, Section 16 of the Exchange Act and/or stock exchange rules, as applicable. The plan administrator has the authority to make all determinations and interpretations under, prescribe all forms for use with, and adopt rules for the administration of, the Plan, subject to its express terms and conditions. The plan administrator also sets the terms and conditions of all awards under the Plan, including any vesting and vesting acceleration conditions.
115
Table of Contents
Limitation on Awards and Shares Available. An aggregate of 6,000,000 shares of our common stock (including the 685,310 shares of common stock issuable pursuant to the awards of stock options intended to be granted in connection with this offering at an exercise price equal to the initial public offering price of our common stock) are available for issuance under awards granted pursuant to the Plan, which shares may be authorized but unissued shares, or shares purchased in the open market. If an award under the Plan is forfeited, expires, is converted to shares of another entity in connection with a change in capitalization or is settled for cash, any shares subject to such award may, to the extent of such forfeiture, expiration or cash settlement, be used again for new grants under the Plan. However, the following shares may not be used again for grant under the Plan: (1) shares tendered or withheld to satisfy grant or exercise price or tax withholding obligations associated with an award; (2) shares subject to a stock appreciation right, or SAR, that are not issued in connection with the stock settlement of the SAR on its exercise; and (3) shares purchased on the open market with the cash proceeds from the exercise of options.
Awards granted under the Plan upon the assumption of, or in substitution for, awards authorized or outstanding under a qualifying equity plan maintained by an entity with which we enter into a merger or similar corporate transaction will not reduce the shares available for grant under the Plan. The maximum number of shares of our common stock that may be subject to one or more awards granted to any participant pursuant to the Plan during any calendar year is 1,500,000 and the maximum amount that may be paid under a cash award pursuant to the Plan to any one participant during any calendar year period is $5,000,000; provided that these limitations will not apply until Section 162(m) applies to certain awards under the Plan (as described below). Further, the sum of the grant date fair value of equity-based awards and the amount of any cash compensation granted to a non-employee director during any calendar year shall be $400,000.
Awards. The Plan provides for the grant of stock options, including incentive stock options, or ISOs, and nonqualified stock options, or NSOs, stock appreciation rights, or SARS, restricted stock, restricted stock units, or RSUs, other stock or cash based awards and dividend equivalents. Certain awards under the Plan may constitute or provide for a deferral of compensation, subject to Section 409A of the Code, which may impose additional requirements on the terms and conditions of such awards. All awards under the Plan will be set forth in award agreements, which will detail all terms and conditions of the awards, including any applicable vesting and payment terms and post-termination exercise limitations. Awards other than cash awards generally will be settled in shares of our common stock, but the plan administrator may provide for cash settlement of any award. A brief description of each award type follows.
| n | Stock Options. Stock options provide for the purchase of shares of our common stock in the future at an exercise price set on the grant date. ISOs, by contrast to NSOs, may provide tax deferral beyond exercise and favorable capital gains tax treatment to their holders if certain holding period and other requirements of the Code are satisfied. The exercise price of a stock option may not be less than 100% of the fair market value of the underlying share on the date of grant (or 110% in the case of ISOs granted to certain significant stockholders), except with respect to certain substitute options granted in connection with a corporate transaction. The term of a stock option may not be longer than ten years (or five years in the case of ISOs granted to certain significant stockholders). Vesting conditions determined by the plan administrator may apply to stock options and may include continued service, performance and/or other conditions. |
| n | SARs. SARs entitle their holder, upon exercise, to receive from us an amount equal to the appreciation of the shares subject to the award between the grant date and the exercise date. The exercise price of a SAR may not be less than 100% of the fair market value of the underlying share on the date of grant (except with respect to certain substitute SARs granted in connection with a corporate transaction) and the term of a SAR may not be longer than ten years. Vesting conditions determined by the plan administrator may apply to SARs and may include continued service, performance and/or other conditions. |
| n | Restricted Stock and RSUs. Restricted stock is an award of nontransferable shares of our common stock that remain forfeitable unless and until specified conditions are met, and which may be subject to a purchase price. RSUs are contractual promises to deliver shares of our common stock in the future, which may also remain forfeitable unless and until specified conditions are met. Delivery of the shares underlying RSUs may be deferred under the terms of the award or at the election of the participant, if the plan administrator permits such a deferral. Conditions applicable to restricted stock and RSUs may be based on continuing service, the attainment of performance goals and/or such other conditions as the plan administrator may determine. |
116
Table of Contents
| n | Other Stock or Cash Based Awards. Other stock or cash awards are cash payments, cash bonus awards, stock payments, stock bonus awards or incentive awards paid in cash, shares of our common stock or a combination of both, and may include deferred stock, deferred stock units, performance awards, retainers, committee fees and meeting based fees. |
| n | Dividend Equivalents. Dividend equivalents represent the right to receive the equivalent value of dividends paid on shares of our common stock and may be granted alone or in tandem with awards other than stock options or SARs. Dividend equivalents are credited as of dividend record dates during the period between the date an award is granted and the date such award vests, is exercised, is distributed or expires, as determined by the plan administrator. Dividend equivalents may not be paid on awards granted under the Plan unless and until such awards have vested. |
The plan administrator will determine whether any awards are intended to constitute “qualified performance-based compensation,” or QPBC, within the meaning of Section 162(m) of the Code, in which case (unless the award is a stock option or SAR) the applicable performance criteria will be selected from the list below in accordance with the requirements of Section 162(m) of the Code.
Section 162(m) of the Code imposes a $1 million cap on the compensation deduction that a public company may take in respect of compensation paid to our “covered employees” (which should include our Chief Executive Officer and our next three most highly compensated employees other than our Chief Financial Officer), but excludes from the calculation of amounts subject to this limitation any amounts that constitute QPBC. Under current tax law, we do not expect Section 162(m) of the Code to apply to certain awards under the Plan until the earliest to occur of (1) our annual stockholders’ meeting at which members of our Board are to be elected that occurs after the close of the third calendar year following the calendar year in which occurred the first registration of our equity securities under Section 12 of the Exchange Act; (2) a material modification of the Plan; (3) an exhaustion of the share supply under the Plan; or (4) the expiration of the Plan. However, QPBC performance criteria may be used with respect to awards that are not intended to constitute QPBC. In addition, the Company may issue awards that are not intended to constitute QPBC even if such awards might be non-deductible as a result of Section 162(m) of the Code.
In order to constitute QPBC under Section 162(m) of the Code, in addition to certain other requirements, the relevant amounts must be payable only upon the attainment of pre-established, objective performance goals set by our compensation committee and linked to stockholder-approved performance criteria. For purposes of the Plan, one or more of the following performance criteria will be used in setting performance goals applicable to QPBC, and may be used in setting performance goals applicable to other awards: (i) net earnings or losses (either before or after one or more of the following: (A) interest, (B) taxes, (C) depreciation, (D) amortization and (E) non-cash equity-based compensation expense); (ii) gross or net sales or revenue or sales or revenue growth; (iii) net income (either before or after taxes); (iv) adjusted net income; (v) operating earnings or profit (either before or after taxes); (vi) cash flow (including, but not limited to, operating cash flow and free cash flow); (vii) return on assets; (viii) return on capital (or invested capital) and cost of capital; (ix) return on stockholders’ equity; (x) total stockholder return; (xi) return on sales; (xii) gross or net profit or operating margin; (xiii) costs, reductions in costs and cost control measures; (xiv) expenses; (xv) working capital; (xvi) earnings or loss per share; (xvii) adjusted earnings or loss per share; (xviii) price per share or dividends per share (or appreciation in and/or maintenance of such price or dividends); (xix) regulatory achievements or compliance; (xx) implementation or completion of critical projects; (xxi) market share; (xxii) economic value; (xxiii) productivity; (xxiv) operating efficiency; (xxv) economic value-added; (xxvi) cash flow return on capital; (xxvii) return on net assets; (xxviii) funds from operations; (xxix) funds available for distributions; (xxx) market penetration and geographic business expansion; (xxxi) customer satisfaction/growth; (xxxii) recruitment and retention of personnel; (xxxiii) human resources management; (xxxiv) supervision of litigation and other legal matters; (xxxv) strategic partnerships and transactions; (xxxvi) financial ratios (including those measuring liquidity, activity, profitability or leverage); (xxxvii) financing and other capital raising transactions; (xxxviii) year-end cash; and (xxxix) acquisition activity and marketing initiatives, any of which may be measured either in absolute terms or as compared to any incremental increase or decrease or as compared to results of a peer group or to market performance indicators or indices.The Plan also permits the plan administrator to provide for objectively determinable adjustments to the applicable performance criteria in setting performance goals for QPBC awards.
Certain Transactions. The plan administrator has broad discretion to take action under the Plan, as well as make adjustments to the terms and conditions of existing and future awards, to prevent the dilution or enlargement of
117
Table of Contents
intended benefits and facilitate necessary or desirable changes in the event of certain transactions and events affecting our common stock, such as stock dividends, stock splits, mergers, acquisitions, consolidations and other corporate transactions. In addition, in the event of certain non-reciprocal transactions with our stockholders known as “equity restructurings,” the plan administrator will make equitable adjustments to the Plan and outstanding awards. In the event of a change in control of our company (as defined in the Plan), to the extent that the surviving entity declines to continue, convert, assume or replace outstanding awards, then all such awards will become fully vested and exercisable in connection with the transaction. Upon or in anticipation of a change of control, the plan administrator may cause any outstanding awards to terminate at a specified time in the future and give the participant the right to exercise such awards during a period of time determined by the plan administrator in its sole discretion. Individual award agreements may provide for additional accelerated vesting and payment provisions.
Foreign Participants, Claw-Back Provisions, Transferability, and Participant Payments. The plan administrator may modify award terms, establish subplans and/or adjust other terms and conditions of awards, subject to the share limits described above, in order to facilitate grants of awards subject to the laws and/or stock exchange rules of countries outside of the United States. All awards will be subject to the provisions of any claw-back policy implemented by our company to the extent set forth in such claw-back policy and/or in the applicable award agreement. With limited exceptions for estate planning, domestic relations orders, certain beneficiary designations and the laws of descent and distribution, awards under the Plan are generally non-transferable prior to vesting, and are exercisable only by the participant. With regard to tax withholding, exercise price and purchase price obligations arising in connection with awards under the Plan, the plan administrator may, in its discretion, accept cash or check, shares of our common stock that meet specified conditions, a “market sell order” or such other consideration as it deems suitable.
Plan Amendment and Termination. Our Board may amend or terminate the Plan at any time; however, except in connection with certain changes in our capital structure, stockholder approval will be required for any amendment that increases the number of shares available under the Plan, “reprices” any stock option or SAR, or cancels any stock option or SAR in exchange for cash or another award when the option or SAR price per share exceeds the fair market value of the underlying shares. No award may be granted pursuant to the Plan after the tenth anniversary of the date on which our Board adopted the Plan.
Executive Bonus Plan
Executive Bonus Plan. We have adopted, and our stockholders have approved, a Senior Executive Incentive Bonus Plan, or the Executive Bonus Plan. The Executive Bonus Plan is designed to provide an incentive for superior work and to motivate covered key executives toward even greater achievement and business results, to tie their goals and interests to those of us and our stockholders and to enable us to attract and retain highly qualified executives. The principal anticipated features of the Executive Bonus Plan are summarized below.
The Executive Bonus Plan is an incentive bonus plan under which certain key executives, including our NEOs, will be eligible to receive bonus payments with respect to a specified period (for example, our fiscal year). Bonuses will generally be payable under the Executive Bonus Plan upon the attainment of pre-established performance goals. Notwithstanding the foregoing, we may pay bonuses (including, without limitation, discretionary bonuses) to participants under the Executive Bonus Plan based upon such other terms and conditions as the compensation committee may in its discretion determine.
The performance goals under the Executive Bonus Plan will relate to one or more financial, operational or other metrics with respect to individual or company performance with respect to us or any of our subsidiaries, including, but not limited to, the following possible performance goals: (i) net earnings or losses (either before or after one or more of the following: (A) interest, (B) taxes, (C) depreciation, (D) amortization and (E) non-cash equity-based compensation expense); (ii) gross or net sales or revenue or sales or revenue growth; (iii) net income (either before or after taxes); (iv) adjusted net income; (v) operating earnings or profit (either before or after taxes); (vi) cash flow (including, but not limited to, operating cash flow and free cash flow); (vii) return on assets; (viii) return on capital (or invested capital) and cost of capital; (ix) return on stockholders’ equity; (x) total stockholder return; (xi) return on sales; (xii) gross or net profit or operating margin; (xiii) costs, reductions in costs and cost control measures; (xiv) expenses; (xv) working capital; (xvi) earnings or loss per share; (xvii) adjusted earnings or loss per share; (xviii) price per share or dividends per share (or
118
Table of Contents
appreciation in and/or maintenance of such price or dividends); (xix) regulatory achievements or compliance; (xx) implementation or completion of critical projects; (xxi) market share; (xxii) economic value; (xxiii) productivity; (xxiv) operating efficiency; (xxv) economic value-added; (xxvi) cash flow return on capital; (xxvii) return on net assets; (xxviii) funds from operations; (xxix) funds available for distributions; (xxx) market penetration and geographic business expansion; (xxxi) customer satisfaction/growth; (xxxii) recruitment and retention of personnel; (xxxiii) human resources management; (xxxiv) supervision of litigation and other legal matters; (xxxv) strategic partnerships and transactions; (xxxvi) financial ratios (including those measuring liquidity, activity, profitability or leverage); (xxxvii) financing and other capital raising transactions; (xxxviii) year-end cash; and (xxxix) acquisition activity and marketing initiatives, any of which may be measured either in absolute terms or as compared to any incremental increase or decrease or as compared to results of a peer group or to market performance indicators or indices.
The Executive Bonus Plan will be administered by the compensation committee. The compensation committee will select the participants in the Executive Bonus Plan and any performance goals to be utilized with respect to the participants, establish the bonus formulas for each participant’s annual bonus, and certify whether any applicable performance goals have been met with respect to a given performance period. The Executive Bonus Plan provides that we may amend or terminate the Executive Bonus Plan at any time in our sole discretion. Any amendments to the Executive Bonus Plan will require stockholder approval only to the extent required by applicable law, rule or regulation. The Executive Bonus Plan will expire on the earlier of:
| n | the material modification of the Executive Bonus Plan; and |
| n | the first stockholders meeting at which members of our Board are elected during 2020. |
Equity Compensation Plan Information
The number of shares underlying outstanding stock options, the weighted-average exercise price of such outstanding options and the number of additional shares remaining available for future issuance under our equity plans, as of December 31, 2015, are as follows:
| PLAN |
NUMBER OF SECURITIES TO BE ISSUED UPON EXERCISE OF OUTSTANDING OPTIONS, WARRANTS AND RIGHTS(A) |
WEIGHTED- AVERAGE EXERCISE PRICE OF OUTSTANDING OPTIONS, WARRANTS AND RIGHTS(B) |
NUMBER OF SECURITIES REMAINING AVAILABLE FOR FUTURE ISSUANCE UNDER EQUITY COMPENSATION PLANS (EXCLUDING SECURITIES REFLECTED IN COLUMN(A))(C) (1) |
|||||||||
| Equity compensation plans approved by security holders |
||||||||||||
| 2014 Equity Incentive Plan |
1,794,709 | $ | 15.42 | 424,902 | ||||||||
| Equity compensation plans not approved by security holders |
— | — | — | |||||||||
| Total |
1,794,709 | $ | 15.42 | 424,902 | ||||||||
| (1) | Includes securities that may be issued as stock options, restricted shares and restricted stock units. |
119
Table of Contents
CERTAIN RELATIONSHIPS AND RELATED PERSON TRANSACTIONS
Set forth below is a description of certain relationships and related person transactions between us or our subsidiaries, and our directors, executive officers and holders of more than 5% of our voting securities since January 1, 2013. We believe that all of the following transactions were entered into with terms as favorable as could have been obtained from unaffiliated third parties.
The Transaction
In April 2014, an affiliate of Cinven acquired 100% of the outstanding shares of Medpace IntermediateCo for an aggregate purchase price of $921.3 million. In connection with the acquisition, certain employees of the Company, through MPI, agreed to contribute shares held in Medpace IntermediateCo in exchange for a percentage stake in Medpace Holdings, Inc. Immediately following the Transaction, Cinven and MPI owned approximately 75% and 25%, respectively, of Medpace Holdings, Inc. Upon the completion of this offering, Cinven will own approximately 58.0% of the outstanding shares of our common stock (or 56.5% if the underwriters exercise their option to purchase additional shares in full).
In addition, in connection with the Transaction and pursuant to the Agreement and Plan of Merger dated February 22, 2014, we agreed to indemnify former directors, officers, employees and certain other affiliates of our predecessor company with respect to all acts or omissions by them in their capacities as such.
Advisory Fees
After the consummation of the Transaction, we entered into the Advisory Services Agreement with an affiliate of Cinven. Under the Advisory Services Agreement, we owe $0.3 million annually to such affiliate of Cinven in exchange for advisory and consulting services. For the Successor six months ended June 30, 2016 and June 30, 2015, the Successor year ended December 31, 2015 and the Successor nine month period ended December 31, 2014 we incurred Advisory Service Agreement management fees of $0.2 million, $0.2 million, $0.3 million and $0.2 million, and $0.1 million, $0.1 million, $0.1 million and $0.1 million in related travel expenses, respectively. As of June 30, 2016, December 31, 2015 and December 31, 2014, we had outstanding accounts payable to Cinven of $0.1 million, $0.1 million and $0.1 million, respectively. We paid $21.7 million in expenses related to the Transaction on behalf of or to Cinven and CCMP.
We were obligated to pay management fees to a subsidiary of CCMP and incurred $0.1 million and $0.3 million in such fees for the Predecessor three month period ended March 31, 2014 and the Predecessor year ended December 31, 2013, respectively.
The Advisory Services Agreement will terminate in connection with the consummation of this offering.
Consulting Fees
In 2014, we paid $1.7 million in consulting fees to Fairmount Partners LP in connection with the Transaction. A managing director of this firm, Cornelius McCarthy, was a member of our Board at the time the fee was incurred.
Voting Agreement
We understand that, substantially concurrently with the closing of this offering, Cinven and Dr. August J. Troendle, our Chief Executive Officer and founder, intend to enter into the Voting Agreement. Pursuant to the terms of the Voting Agreement, for so long as Cinven and Dr. Troendle collectively hold at least 40% of our outstanding voting shares, or the Voting Agreement is otherwise terminated in accordance with its terms, Cinven will agree to vote its shares of our common stock in favor of the election of Dr. Troendle to our Board (so long as Dr. Troendle remains our Chief Executive Officer) upon his nomination by our Board and Dr. Troendle will agree to vote his shares of our common stock in favor of the election of the directors affiliated with Cinven upon their nomination by our Board; provided, that in the event that Cinven holds less than (a) 40% but greater than or equal to 25% of our voting shares then outstanding, Dr. Troendle shall be required to vote for two directors affiliated with Cinven, after giving effect to the directors then sitting on the Board, (b) 25% but greater than or equal to 10% of our voting shares then outstanding, Dr. Troendle shall be required to vote for one director affiliated with Cinven, after giving effect to the directors then sitting on the Board and (c) 10% of our voting shares then outstanding, Dr. Troendle shall not be required to vote for any directors affiliated with Cinven.
120
Table of Contents
Registration Rights Agreement
We intend to enter into a Registration Rights Agreement with Cinven and Dr. Troendle in connection with this offering. The Registration Rights Agreement will provide Cinven and Dr. Troendle certain registration rights whereby, at any time following our initial public offering and the expiration of any related lock-up period, Cinven and Dr. Troendle can require us to register under the Securities Act shares of our common stock held by them. When we become and for so long as we are eligible to use Form S-3 under the Securities Act, Cinven and Dr. Troendle will have shelf registration rights requiring us to file a shelf registration statement and to maintain the effectiveness of such registration statement so as to allow sales thereunder from time to time. Cinven and Dr. Troendle are also entitled to participate on a pro rata basis in any registration of our common stock under the Securities Act that we may undertake. The registration rights agreement also provides that we will pay certain expenses relating to such registrations and indemnify Cinven and Dr. Troendle and members of management participating in any offering against certain liabilities which may arise under the Securities Act.
Board Compensation
Our directors who are employed by us or our subsidiaries do not receive any compensation and will not receive compensation following this offering, except as limited to expense reimbursement. Our other directors will receive compensation for their service as members of our Board. See “Executive and Director Compensation—Director Compensation.”
Employment Agreements
We currently have an employment agreement with our Chief Executive Officer and founder, Dr. August J. Troendle. See “Executive and Director Compensation—Employment Agreement.”
Indemnification Agreements
We intend to enter into new indemnification agreements with each of our directors and executive officers. These agreements, among other things, will require us to indemnify each director and executive officer to the fullest extent permitted by Delaware law, including indemnification of expenses such as attorneys’ fees, judgments, fines and settlement amounts incurred by the director or executive officer in any action or proceeding, including any action or proceeding by or in right of us, arising out of the person’s services as a director or executive officer, as applicable.
Service Agreements
Symplmed Pharmaceuticals, LLC, or Symplmed
In 2013, we entered into a master services agreement, or the Symplmed MSA, with Symplmed, a private pharmaceutical development company that is majority owned by MPI. The Symplmed MSA provided that we would perform Symplmed’s clinical trials. In 2014, we entered into an amended master services agreement, or the Amended Symplmed MSA, with Symplmed. The Amended Symplmed MSA provides for a revised financing arrangement, which allows Symplmed to defer payments owed to us. In return, we can charge a premium for our services as consideration for the deferred payment concessions.
At its inception in 2013, Symplmed was majority owned by our Chief Executive Officer, who was elected to Symplmed’s board of directors that year along with our Chief Financial Officer and our General Counsel. In 2014 and 2015, our Chief Executive Officer and other executives made equity investments in Symplmed, which are now held through MPI.
For the Successor six months ended June 30, 2016 and June 30, 2015, the Successor year ended December 31, 2015, the Successor nine month period ended December 31, 2014, the Predecessor three month period ended March 31, 2014 and the Predecessor year ended December 31, 2013, we recognized related person transactions of $0.4 million, $0.5 million, $1.2 million, $1.2 million, less than $0.1 million and less than $0.1 million as net service revenue, respectively. As of June 30, 2016 and December 31, 2015, we had Symplmed related accounts receivable of $0.4 million and $0.3 million, respectively.
Symplmed leases office space from us at our corporate headquarters in Cincinnati.
121
Table of Contents
Coherus BioSciences, Inc., or Coherus, and MX II Associates, LLC, or MXII
In 2011, MXII, an entity of which our Chief Executive Officer is the managing member, made an equity investment in Coherus, a biosimilar therapeutics developer. In early 2012, we made a $2.5 million equity investment in Coherus. Concurrent with its initial investment, MXII secured the exclusive rights for us to perform Phase I–III clinical trial work for certain of Coherus’ bio-similar drug compounds through a master services agreement, or the Coherus MSA. In return, we entered into a commission agreement with MXII, which provided that we would pay a 10% sales commission to MXII for cash received from Coherus. The commission agreement between us and MXII was terminated in 2015. The Coherus MSA remains in place.
We paid $0.3 million in sales commissions to MXII in 2012 related to a $2.5 million advance payment received from Coherus. We also paid commissions of $1.1 million, $1.1 million, $0.6 million and $0.3 million for the Successor six months ended June 30, 2015, the Successor year ended December 31, 2015, the Successor nine month period ended December 31, 2014 and the Predecessor three month period ended March 31, 2014, respectively. For the Successor six months ended June 30, 2016 and June 30, 2015, the Successor year ended December 31, 2015, the Successor nine month period December 31, 2014, the Predecessor three month period ended March 31, 2014 and the Predecessor year ended December 31, 2013, we recognized net service revenue from Coherus of $11.4 million, $10.9 million, $22.1 million, $10.6 million, $2.0 million, and $3.3 million, respectively. In addition, we recognized reimbursed out-of-pocket revenue and reimbursed out-of-pocket expenses of $2.9 million, $4.2 million, $6.9 million, $2.0 million, $0.1 million and $0.1 million for the Successor six months ended June 30, 2016 and June 30, 2015, the Successor year ended December 31, 2015, the Successor nine month period ended December 31, 2014, the Predecessor three month period ended March 31, 2014 and the Predecessor year ended December 31, 2013, respectively. As of June 30, 2016, December 31, 2015 and December 31, 2014, we had recorded accounts receivable from Coherus of $2.6 million, $2.0 million and $0.7 million, respectively. We also reported advanced billings of $9.5 million, $8.4 million and $5.3 million and pre-funded study costs of $4.1 million, $3.5 million and $2.6 million from Coherus as of June 30, 2016, December 31, 2015 and 2014, respectively. Coherus was our largest customer for Successor six months ended June 30, 2016 and the Successor year ended December 31, 2015, accounting for 6.3% and 6.9% of our net service revenue, respectively.
As of December 31, 2013, we recorded an impairment loss of $2.3 million on our equity investment in Coherus in contemplation of the ultimate liquidation of this investment prior to the Transaction. In March 2014, the investment was sold to MPI for $0.3 million.
Dr. Troendle directly and indirectly beneficially owns 5.4% of the outstanding common stock of Coherus according to public filings of Coherus. Such shares consist of 29,994 shares held directly by Dr. Troendle, 1,642,492 shares held by MXII, an entity for which Dr. Troendle serves as managing member, and 268,428 shares held by MPI, an entity for which Dr. Troendle serves as the manager. Dr. Troendle disclaims beneficial ownership of the shares held by MXII and MPI, except to the extent of his pecuniary interest therein. Additionally, MXII also holds $4.0 million in aggregate principal amount of Coherus’ 8.2% senior convertible notes due 2022.
Xenon Pharmaceuticals, Inc., or Xenon
Our Chief Executive Officer has an equity investment in Xenon, a clinical-stage biopharmaceutical company. Dr. Troendle was also a member of Xenon’s board of directors from 2007 to 2008. In June 2006, we entered into a master services agreement with Xenon. In July 2015, we entered into an amended master services agreement with Xenon to provide certain clinical development services to Xenon. For the Successor six months ended June 30, 2016 and June 30, 2015, and the Successor year ended December 31, 2015, we recognized net service revenue of $0.4 million, $0.1 million and $0.7 million related to Xenon, respectively. As of June 30, 2016 and December 31, 2015, we had $1.9 million and $1.8 million and $0.2 million and $0.2 million of advanced billings and pre-funded study costs, respectively, related to Xenon.
Medpace Investors, LLC
MPI is a noncontrolling shareholder of the Company that is owned by employees of the Company. Our Chief Executive Officer is the sole manager and holder of a majority of the units of MPI and our other executive officers and certain other employees are unit holders of MPI. Upon a distribution of our common stock held by MPI, our Chief Executive Officer would receive approximately 73% of such shares. We act as a paying agent for MPI with taxing authorities principally in instances when employee tax payments or remittance of withholdings related to
122
Table of Contents
equity compensation are required. For the Successor six months ended June 30, 2016 and June 30, 2015, the Successor year ended December 31, 2015 and the Successor nine month period ended December 31, 2014, we paid $0.8 million, $0.9 million, $0.9 million and $1.4 million to various taxing authorities on behalf of MPI, respectively. No payments were made by the Company to various taxing authorities on behalf of MPI in the Predecessor three month period ended March 31, 2014 or the Predecessor year ended December 31, 2013.
Leased Real Estate
In October 2010, we entered into an operating lease with 100 Medpace Way, LLC, or 100 MW, which is wholly owned by our Chief Executive Officer. The lease has an initial term of 12 years with a renewal option for one 10-year term at prevailing market rates. We pay rent, taxes, insurance and maintenance expenses that arise from use of the property. The annual base rent in effect as of December 31, 2015 was $2.1 million. The lease allows for adjustments to the rental rate annually for increases in the consumer price index. For the Successor six months ended June 30, 2016 and June 30, 2015, the Successor year ended December 31, 2015, the Successor nine month period ended December 31, 2014, the Predecessor three month period ended March 31, 2014 and the Predecessor year ended December 31, 2013, lease expense for 100 MW of $1.1 million, $1.1 million, $2.1 million, $1.6 million, $0.5 million and $2.1 million, respectively, were recorded. Additionally, we prepaid $0.2 million in lease payments to 100 MW, which was recorded as a component of prepaid expenses and other current assets as of December 31, 2014.
We entered into two leases of office space, commencing in July 2012 and September 2012, with 200 Medpace Way, LLC, or 200 MW, and 300 Medpace Way, LLC, or 300 MW, respectively. 200 MW and 300 MW are wholly owned by our Chief Executive Officer and certain of his immediate family members. Each lease has an initial term of 15 years with a renewal option for one 10-year term at prevailing market rates. The annual base rent in effect as of December 31, 2015 for the 200 MW lease and the 300 MW lease was $2.6 million and $1.1 million, respectively. The obligation was initially recorded by us at its net present value using the notional rates implicit in the lease agreements. We revalued the liability by calculating the net present value using our incremental borrowing rate at the time of the Transaction. For the Successor six months ended June 30, 2016 and June 30, 2015, the Successor year ended December 31, 2015, the Successor nine month period ended December 31, 2014, the Predecessor three month period ended March 31, 2014 and the year ended December 31, 2013, we recorded lease payments of $1.9 million, $1.6 million, $3.4 million, $3.1 million, $0.9 million and $2.7 million, respectively.
From time to time in the past we have entered into, and in the future we may enter into, lease arrangements with entities directly or indirectly controlled by our executive officers, including our Chief Executive Officer and founder.
Travel Services
We incur expenses for travel services for company executives provided by a private aviation charter company, or ATSB Aviation, which is owned by our Chief Executive Officer and our Senior Vice President of Operations. We may contract directly with ATSB Aviation for the use of its aircraft or indirectly through a third party aircraft management and jet charter company, or Reynolds Jet Management. The travel services provided are primarily for business purposes, with any personal travel paid for as part of the executives’ compensation arrangements. Reynolds Jet Management also makes the ATSB Aviation aircraft available to other third parties. Medpace incurred travel expenses of $0.5 million, $0.5 million, $0.9 million, $0.5 million and $0.1 million for the Successor six months ended June 30, 2016 and June 30, 2015, the Successor year ended December 31, 2015, the Successor nine month period ended December 31, 2014 and the Predecessor three month period ended March 31, 2014, respectively, related to these travel services. For more information, see “Executive and Director Compensation—Narrative to Summary Compensation Table—Aircraft Usage.”
Common Stock Purchases
In 2013, our Chief Executive Officer entered into a stock purchase agreement with the Company that permitted him to purchase 120,000 shares of our common stock at the then-current market value for those shares. In exchange, our Chief Executive Officer agreed to forfeit his ownership of 80,000 unvested stock options that were originally scheduled to vest at various dates through 2016. Proceeds of $1.2 million from this stock purchase were reflected as stock issued and proceeds from sale of common stock for the Predecessor year ended December 31, 2013.
123
Table of Contents
Assets and Obligations Related to Former Owners
As part of the stock purchase agreement dated June 17, 2011, or the Predecessor Purchase Agreement, for the purchase of Medpace, Inc. by CCMP, the sellers (a group led by our current Chief Executive Officer, referred to as the “Former Owners”) and the buyers (led by CCMP) agreed to certain tax indemnifications regarding contingencies that could arise after the June 17, 2011 acquisition, and tax payments or refunds that were finalized after June 17, 2011, but which related to periods prior to that date. In February 2015, a settlement was reached with a local taxing authority regarding the refund of income tax payments made by the Company prior to June 17, 2011. As of June 30, 2016, December 31, 2015 and December 31, 2014, Medpace had $0.2 million, $0.4 million and $0.6 million in prepaid expenses and other current assets and other assets related to the tax refund due from the local taxing authority, and $0.2 million, $0.4 million and $0.6 million in other current liabilities and other long-term liabilities, representing an obligation to the Former Owners. We had $0.0 million, $0.1 million and $0.1 million in prepaid expenses and other current assets, and $0.0 million, $0.1 million and $0.3 million in other current liabilities as of June 30, 2016, December 31, 2015 and December 31, 2014, respectively, associated with refunds from various other taxing authorities that were generated prior to June 17, 2011.
Other
Our Chief Executive Officer and founder, Dr. August J. Troendle and our Senior Vice President of Operations, Susan E. Burwig, each of whom is an executive officer, cohabitate. For information regarding each of their compensation arrangements, see “Executive and Director Compensation.”
We provided our former Chief Operating Officer, Kurt A. Brykman, with a cash severance and reimbursement of COBRA benefits of approximately $0.3 million in connection with his termination of employment in July 2015. For additional information, see “Executive and Director Compensation.”
Our Chief Executive Officer and founder, Dr. August J. Troendle, has indicated an interest to purchase up to $20.0 million in shares of our common stock in this offering at the initial public offering price. Assuming an initial public offering price of $21.50 per share, which is the midpoint of the price range set forth on the cover page of this prospectus, Dr. Troendle would purchase an aggregate of up to approximately 930,233 of the 7,000,000 shares in this offering based on this indication of interest. However, because indications of interest are not binding agreements or commitments to purchase, Dr. Troendle may determine to increase or reduce the amount of his indication of interest, or otherwise elect not to purchase any shares. It is also possible that the number of shares, if any, allocated to Dr. Troendle in the offering may be smaller than the amount of his indication of interest.
Policies for Approval of Related Person Transactions
In connection with this offering, we will adopt a written policy relating to the approval of related person transactions. Our audit committee will review and approve or ratify all relationships and related person transactions between us and (i) our directors, executive officers or their immediate family members, (ii) any 5% record or beneficial owner of our common stock, or (iii) any immediate family member of any person specified in (i) and (ii) above. The audit committee will review all such related person transactions and, where the audit committee determines that such transactions are in our best interests, approve such transactions in advance of such related person transaction being given effect. As set forth in the related person transaction policy, in the course of its review and approval or ratification of a related person transaction, the audit committee will, in its judgment, consider in light of the relevant facts and circumstances whether the related person transaction is, or is not inconsistent with, our best interests, whether the transaction is on terms comparable to those that could be obtained in an arm’s length transaction with an unrelated person, the extent of the related person’s interest in the transaction and various factors enumerated in the policy.
Any member of the audit committee who is a related person with respect to a related person transaction under review or is otherwise not disinterested will not be permitted to participate in the discussions or approval or ratification of the related person transaction. Our policy also includes certain exemptions for related person transactions that need not be reported and provides the audit committee with the discretion to pre-approve certain related person transactions.
124
Table of Contents
The following table sets forth the beneficial ownership of our common stock as of July 29, 2016 and immediately after the completion of this offering by (1) each person, or group of affiliated persons, known by us to be the beneficial owner of 5% or more of our outstanding common stock, (2) each of our directors, (3) each of our executive officers and (4) all of our directors and executive officers as a group.
To our knowledge, each person named in the table has sole voting and investment power with respect to all of the securities shown as beneficially owned by such person, except as otherwise set forth in the notes to the table. The number of securities shown represents the number of securities the person “beneficially owns,” as determined by the rules of the SEC. The SEC has defined “beneficial” ownership of a security to mean the possession, directly or indirectly, of voting power and/or investment power. A security holder is also deemed to be, as of any date, the beneficial owner of all securities that such security holder has the right to acquire within 60 days after that date through (1) the exercise of any option, warrant or right, (2) the conversion of a security, (3) the power to revoke a trust, discretionary account or similar arrangement, or (4) the automatic termination of a trust, discretionary account or similar arrangement.
The percentages reflect beneficial ownership immediately prior to and immediately after the completion of this offering as determined in accordance with Rule 13d-3 under the Exchange Act and are based on 32,650,854 shares of our common stock outstanding as of July 29, 2016 and assumes there are 39,650,854 shares of our common stock outstanding as of the date immediately following the completion of this offering, assuming no exercise by the underwriters of their option to purchase additional shares of our common stock, and there are 40,700,854 shares of our common stock outstanding as of the date immediately following the completion of this offering, assuming full exercise by the underwriters of their option to purchase additional shares of our common stock. Except as noted below, the address for all beneficial owners in the table below is c/o Medpace Holdings, Inc. at 5375 Medpace Way, Cincinnati, Ohio 45227.
Our Chief Executive Officer and founder, Dr. August J. Troendle, has indicated an interest in purchasing shares of our common stock in this offering at the initial public offering price. The following table does not reflect any such potential purchases. If any shares are purchased by Dr. Troendle, the number of shares of common stock beneficially owned after this offering and the percentage of common stock beneficially owned after this offering may differ from that set forth in the table below.
| SHARES BENEFICIALLY OWNED PRIOR TO OFFERING |
SHARES BENEFICIALLY OWNED AFTER OFFERING (ASSUMING NO EXERCISE OF THE OPTION TO PURCHASE ADDITIONAL SHARES) |
SHARES BENEFICIALLY OWNED AFTER OFFERING (ASSUMING FULL EXERCISE OF THE OPTION TO PURCHASE ADDITIONAL SHARES) |
||||||||||||||||||||||
| NAME OF BENEFICIAL OWNER |
NUMBER | PERCENTAGE | NUMBER | PERCENTAGE | NUMBER | PERCENTAGE | ||||||||||||||||||
| 5% Shareholders |
||||||||||||||||||||||||
| Investment funds affiliated with Cinven Capital Management (1) |
22,999,997 | 70.4 | % | 22,999,997 | 58.0 | % | 22,999,997 | 56.5 | % | |||||||||||||||
| Medpace Investors, LLC (2) |
9,210,118 | 28.2 | % | 9,210,118 | 23.2 | % | 9,210,118 | 22.6 | % | |||||||||||||||
| Named Executive Officers |
||||||||||||||||||||||||
| Dr. August J. Troendle (3) |
9,561,969 | 29.3 | % | 9,561,969 | 24.1 | % | 9,561,969 | 23.5 | % | |||||||||||||||
| Jesse J. Geiger (4) |
20,370 | * | 20,370 | * | 20,370 | * | ||||||||||||||||||
| Susan E. Burwig (5) |
18,518 | * | 18,518 | * | 18,518 | * | ||||||||||||||||||
| Non-Employee Directors |
||||||||||||||||||||||||
| Dr. Supraj R. Rajagopalan |
— | — | — | — | — | — | ||||||||||||||||||
| Alexander F.S. Leslie |
— | — | — | — | — | — | ||||||||||||||||||
| Matthew R. Norton |
— | — | — | — | — | — | ||||||||||||||||||
| Robert O. Kraft |
— | — | — | — | — | — | ||||||||||||||||||
| Brian T. Carley |
— | — | — | — | — | — | ||||||||||||||||||
| All executive officers and directors as a group (10 persons) (6) |
9,617,520 | 29.5 | % | 9,617,520 | 24.3 | % | 9,617,520 | 23.6 | % | |||||||||||||||
125
Table of Contents
| * | Represents beneficial ownership of less than 1% of our outstanding common stock. |
| (1) | Includes 3,641,240 shares held by Fifth Cinven Fund (No. 1) Limited Partnership (“LP1”), 3,229,699 shares held by Fifth Cinven Fund (No. 2) Limited Partnership (“LP2”), 3,889,854 shares held by Fifth Cinven Fund (No. 3) Limited Partnership (“LP3”), 3,379,103 shares held by Fifth Cinven Fund (No. 4) Limited Partnership (“LP4”), 1,403,731 shares held by Fifth Cinven Fund (No. 5) Limited Partnership (“LP5”), 3,284,802 shares held by Fifth Cinven Fund (No. 6) Limited Partnership (“LP6” and, together with LP1, LP2, LP3, LP4 and LP5, the “Limited Partnerships”), 3,758,169 shares held by Fifth Cinven Fund FCP-SIF (“FCP”) and 413,399 shares held by Fifth Cinven Fund Co-Investment Partnership (“CIP”). Each of the Limited Partnerships is managed and controlled by Cinven Capital Management (V) Limited Partnership Incorporated (“GPLP”), their Managing General Partner. Cinven Capital Management (V) General Partner Limited (“Cinven MGP” and together with GPLP, CIP, FCP and the Limited Partnerships, the “Cinven Entities) is the Managing General Partner of GPLP. FCP is managed and controlled by Cinven Manco S.A.R.L. (“Manco”). Cinven MGP also exercises investment discretion and control over the shares held by each of FCP and CIP, which are subject to contractual commitments that each invest and divest side-by-side with the Limited Partnerships. Voting and investment determinations with respect to the shares held by the Cinven Entities are made by the majority vote of the board of directors of Cinven MGP, comprised of Brian Linden, Hayley Tanguy, John Boothman, Robin Hall, Rupert Dorey and William Scott. Each such director disclaims beneficial ownership of such shares. |
The principal business address for each of Cinven MGP, GPLP and the Limited Partnerships is East Wing, Trafalgar Court, Les Banques, St. Peter Port, Guernsey, GY1 3PP. The principal business address of CIP is Warwick Court, Paternoster Square, London, EC4M 7AG. The principal business address of each of Manco and FCP is 7, rue Lou Hemmer, L-1748, Luxembourg.
| (2) | Dr. August J. Troendle, as the sole manager of MPI, has sole voting and investment power with respect to these shares. |
| (3) | Consists of 351,851 shares of common stock directly held by the August J. Troendle Revocable Trust and 9,210,118 shares of common stock directly held by MPI. Dr. Troendle is the sole trustee, sole beneficiary and settlor of the August J. Troendle Revocable Trust and has sole voting and investment power over the shares held by such trust. Dr. Troendle, as the sole manager of MPI, has sole voting and dispositive power with respect to the shares held by MPI. |
| (4) | Includes 20,370 shares of common stock which may be acquired upon the exercise of stock options which have vested or will vest within 60 days of the filing of this prospectus. |
| (5) | Includes 18,518 shares of common stock which may be acquired upon the exercise of stock options which have vested or will vest within 60 days of the filing of this prospectus. |
| (6) | Includes 55,551 shares of common stock which may be acquired upon the exercise of stock options which have vested or will vest within 60 days of the filing of this prospectus. |
126
Table of Contents
General
The following is a description of the material terms of, and is qualified in its entirety by, our amended and restated certificate of incorporation and amended and restated bylaws, each of which will be in effect prior to the consummation of this offering, copies of which are filed as exhibits to the registration statement of which this prospectus is a part.
Authorized Capital
As of the consummation of this offering, our authorized capital stock will consist of:
| n | 250,000,000 shares of common stock, par value $0.01 per share, of which 39,642,113 shares will be issued and outstanding, and; |
| n | 5,000,000 shares of preferred stock, par value $0.01 per share, of which no shares are issued and outstanding. |
Unless our Board determines otherwise, we will issue all shares of our capital stock in uncertificated form.
Common Stock
Voting Rights
Holders of our common stock are entitled to one vote for each share held of record on all matters to which shareholders are entitled to vote generally, including the election or removal of directors. The holders of our common stock do not have cumulative voting rights in the election of directors. Accordingly, a holder or group of holders of a majority of the shares of our common stock are able to elect all of the directors.
Dividends
Subject to preferences that may be applicable to any then outstanding preferred stock, holders of our common stock are entitled to receive dividends, if any, as may be declared from time to time by our Board out of legally available funds.
Liquidation
Upon our liquidation, dissolution or winding up and after payment in full of all amounts required to be paid to creditors and to the holders of preferred stock having liquidation preferences, if any, the holders of our common stock will be entitled to receive pro rata our remaining assets available for distribution.
Rights and Preferences
Holders of our common stock do not have preemptive, subscription, redemption or conversion rights. The common stock will not be subject to further calls or assessment by us. There will be no redemption or sinking fund provisions applicable to the common stock. All shares of our common stock that will be outstanding at the time of the consummation of the offering will be fully paid and non-assessable. The rights, powers, preferences and privileges of holders of our common stock will be subject to and may be adversely affected by the rights of the holders of any shares of our preferred stock we may authorize and issue in the future.
Preferred Stock
Our amended and restated certificate of incorporation provides that our Board has the authority, without action by the shareholders, to designate and issue up to 5,000,000 shares of preferred stock in one or more classes or series and to fix the powers, rights, preferences, and privileges of each class or series of preferred stock, including dividend rights, conversion rights, voting rights, terms of redemption, liquidation preferences and the number of shares constituting any class or series, which may be greater than the rights of the holders of the common stock. There will be no shares of preferred stock outstanding immediately after this offering.
The purpose of authorizing our Board to issue preferred stock and determine its rights and preferences is to eliminate delays associated with a shareholder vote on specific issuances. The issuance of preferred stock, while
127
Table of Contents
providing flexibility in connection with possible acquisitions, future financings and other corporate purposes, could have the effect of making it more difficult for a third party to acquire, or could discourage a third party from seeking to acquire, a majority of our outstanding voting stock. Additionally, the issuance of preferred stock may adversely affect the holders of our common stock by restricting dividends on our common stock, diluting the voting power of our common stock or subordinating the liquidation rights of our common stock. As a result of these or other factors, the issuance of preferred stock could have an adverse impact on the market price of our common stock.
Exclusive Venue
Our amended and restated certificate of incorporation, as it will be in effect upon the closing of this offering, will require, to the fullest extent permitted by law, that (i) any derivative action or proceeding brought on our behalf, (ii) any action asserting a claim of breach of a fiduciary duty owed by any of our directors, officers or other employees to us or our shareholders, (iii) any action asserting a claim against us arising pursuant to any provision of the DGCL or our amended and restated certificate of incorporation or our amended and restated bylaws or (iv) any action asserting a claim against us governed by the internal affairs doctrine will have to be brought only in the Court of Chancery in the State of Delaware. Although we believe this provision benefits us by providing increased consistency in the application of Delaware law in the types of lawsuits to which it applies, the provision may have the effect of discouraging lawsuits against our directors and officers. Any person or entity purchasing or otherwise acquiring any interest in shares of our capital stock shall be deemed to have notice of and consented to the forum provisions in our amended and restated certificate of incorporation. However, the enforceability of similar forum provisions in other companies’ certificates of incorporation has been challenged in legal proceedings, and it is possible that a court could find these types of provisions to be unenforceable.
Anti-Takeover Effects of Our Amended and Restated Certificate of Incorporation and Amended and Restated Bylaws and Certain Provisions of Delaware Law
Our amended and restated certificate of incorporation, amended and restated bylaws and the DGCL, which are summarized in the following paragraphs, contain provisions that are intended to enhance the likelihood of continuity and stability in the composition of our Board. These provisions are intended to avoid costly takeover battles, reduce our vulnerability to a hostile change of control and enhance the ability of our Board to maximize shareholder value in connection with any unsolicited offer to acquire us. However, these provisions may have an anti-takeover effect and may delay, deter or prevent a merger or acquisition of our company by means of a tender offer, a proxy contest or other takeover attempt that a shareholder might consider in its best interest, including those attempts that might result in a premium over the prevailing market price for the shares of common stock held by shareholders.
Authorized but Unissued Capital Stock
The authorized but unissued shares of common stock and preferred stock are available for future issuance without shareholder approval, subject to any limitations imposed by the listing standards of NASDAQ. These additional shares may be used for a variety of corporate finance transactions, acquisitions and employee benefit plans. The existence of authorized but unissued and unreserved common stock and preferred stock could make more difficult or discourage an attempt to obtain control of us by means of a proxy contest, tender offer, merger or otherwise.
Classified Board
Our amended and restated certificate of incorporation provides that our Board will be divided into three classes of directors, with the classes to be as nearly equal in number as possible, and with the directors serving three-year terms. As a result, approximately one-third of our Board is elected each year. In addition, our amended and restated certificate of incorporation will provide that directors may only be removed from our Board for cause by the affirmative vote of at least a majority of our common stock. See “Management—Board of Directors.” The classification of directors will have the effect of making it more difficult for shareholders to change the composition of our Board. Our amended and restated certificate of incorporation and amended and restated bylaws provide that, subject to any rights of holders of preferred stock to elect additional directors under specified circumstances, the number of directors are fixed from time to time exclusively pursuant to a resolution adopted by the Board.
128
Table of Contents
Business Combinations
We are subject to Section 203 of the DGCL. Subject to certain exceptions, Section 203 prevents a publicly held Delaware corporation from engaging in a “business combination” with any “interested stockholder” for three years following the date that the person became an interested stockholder, unless the interested stockholder attained such status with the approval of our board of directors or unless the business combination is approved in a prescribed manner. A “business combination” includes, among other things, a merger or consolidation involving us and the “interested stockholder” and the sale of more than 10% of our assets. In general, an “interested stockholder” is any entity or person beneficially owning 15% or more of our outstanding voting stock and any entity or person affiliated with or controlling or controlled by such entity or person.
No Cumulative Voting
Under Delaware law, the right to vote cumulatively does not exist unless the certificate of incorporation specifically authorizes cumulative voting. Our amended and restated certificate of incorporation does not authorize cumulative voting. Accordingly, a holder or group of holders of a majority of the shares of our common stock are able to elect all of the directors.
Requirements for Advance Notification of Shareholder Meetings, Director Nominations and Shareholder Proposals
Our amended and restated certificate of incorporation will provide that shareholders at an annual meeting may only consider proposals or nominations specified in the notice of meeting or brought before the meeting by or at the direction of our Board or by a qualified shareholder of record on the record date for the meeting, who is entitled to vote at the meeting and who has delivered timely written notice in proper form to our secretary of the shareholder’s intention to bring such business before the meeting. Our amended and restated certificate of incorporation will provide that, subject to applicable law, special meetings of the shareholders may be called only by a resolution adopted by the affirmative vote of the majority of the directors then in office. Our bylaws will prohibit the conduct of any business at a special meeting other than as specified in the notice for such meeting. In addition, any shareholder who wishes to bring business before an annual meeting or nominate directors must comply with the advance notice and duration of ownership requirements set forth in our bylaws and provide us with certain information. These provisions may have the effect of deferring, delaying or discouraging hostile takeovers or changes in control of us or our management.
Our amended and restated bylaws establish advance notice procedures with respect to shareholder proposals and the nomination of candidates for election as directors, other than nominations made by or at the direction of the Board or a committee of the Board. In order for any matter to be “properly brought” before a meeting, a shareholder will have to comply with advance notice requirements and provide us with certain information. Our amended and restated bylaws allow the chairman of the meeting at a meeting of the shareholders to adopt rules and regulations for the conduct of meetings which may have the effect of precluding the conduct of certain business at a meeting if the rules and regulations are not followed. These provisions may also defer, delay or discourage a potential acquirer from conducting a solicitation of proxies to elect the acquirer’s own slate of directors or otherwise attempting to influence or obtain control of our company.
Shareholder Action by Written Consent
Pursuant to Section 228 of the DGCL, any action required to be taken at any annual or special meeting of the shareholders may be taken without a meeting, without prior notice and without a vote if a consent or consents in writing, setting forth the action so taken, is signed by the holders of outstanding stock having not less than the minimum number of votes that would be necessary to authorize or take such action at a meeting at which all shares of our stock entitled to vote thereon were present and voted, unless our amended and restated certificate of incorporation provides otherwise. Our amended and restated certificate of incorporation will provide that shareholder action by written consent will be permitted only if the action to be effected by such written consent and the taking of such action by such written consent have been previously approved by the board of directors.
Amendment of Amended and Restated Certificate of Incorporation or Amended and Restated Bylaws
The DGCL provides generally that the affirmative vote of a majority of the shares entitled to vote on any matter is required to amend a corporation’s certificate of incorporation or bylaws, unless a corporation’s certificate of incorporation or bylaws, as the case may be, requires a greater percentage. Upon consummation of this offering, our
129
Table of Contents
amended and restated bylaws may be amended or repealed by a majority vote of our Board or by the affirmative vote of the holders of at least 66-2/3% of the votes which all our shareholders would be entitled to cast in any annual election of directors. In addition, the affirmative vote of the holders of at least 66-2/3% of the votes which all our shareholders would be entitled to cast in any election of directors will be required to amend or repeal or to adopt any provisions inconsistent with any of the provisions of our certificate described above.
The foregoing provisions of our amended and restated certificate of incorporation and amended and restated bylaws could discourage potential acquisition proposals and could delay or prevent a change in control. These provisions are intended to enhance the likelihood of continuity and stability in the composition of our Board and in the policies formulated by our Board and to discourage certain types of transactions that may involve an actual or threatened change of control. These provisions are designed to reduce our vulnerability to an unsolicited acquisition proposal. The provisions also are intended to discourage certain tactics that may be used in proxy fights. However, such provisions could have the effect of discouraging others from making tender offers for shares of our common stock and, as a consequence, they also may inhibit fluctuations in the market price of our common stock that could result from actual or rumored takeover attempts. Such provisions also may have the effect of preventing changes in our management or delaying or preventing a transaction that might benefit you or other minority shareholders.
Dissenters’ Rights of Appraisal and Payment
Under the DGCL, with certain exceptions, our shareholders have appraisal rights in connection with a merger or consolidation of us. Pursuant to the DGCL, shareholders who properly request and perfect appraisal rights in connection with such merger or consolidation will have the right to receive payment of the fair value of their shares as determined by the Delaware Court of Chancery.
Shareholders’ Derivative Actions
Under the DGCL, any of our shareholders may bring an action in our name to procure a judgment in our favor, also known as a derivative action, provided that the shareholder bringing the action is a holder of shares of our common stock at the time of the transaction to which the action relates or such shareholder’s stock thereafter devolved by operation of law and such suit is brought in the Court of Chancery in the State of Delaware. See “—Exclusive Venue” above.
Conflicts of Interest
Delaware law permits corporations to adopt provisions renouncing any interest or expectancy in certain opportunities that are presented to the corporation or its officers, directors or shareholders. Our amended and restated certificate of incorporation, to the maximum extent permitted from time to time by Delaware law, renounces any interest or expectancy that we have in, or right to be offered an opportunity to participate in, specified business opportunities that are from time to time presented to our officers, directors or shareholders or their respective affiliates, other than those officers, directors, shareholders or affiliates who are our or our subsidiaries’ employees. Our amended and restated certificate of incorporation provides that, to the fullest extent permitted by law, each of Cinven or any of its affiliates or any director who is not employed by us (including any non-employee director who serves as one of our officers in both his director and officer capacities) or his or her affiliates has no duty to refrain from (i) engaging in a corporate opportunity in the same or similar lines of business in which we or our affiliates now engage or propose to engage or (ii) otherwise competing with us or our affiliates. In addition, to the fullest extent permitted by law, in the event that Cinven or any non-employee director acquires knowledge of a potential transaction or other business opportunity which may be a corporate opportunity for itself or himself or its or his affiliates or for us or our affiliates, such person will have no duty to communicate or offer such transaction or business opportunity to us or any of our affiliates and they may take any such opportunity for themselves or offer it to another person or entity. Our amended and restated certificate of incorporation does not renounce our interest in any business opportunity that is expressly offered to a non-employee director solely in his or her capacity as a director or officer of the Company. To the fullest extent permitted by law, no business opportunity will be deemed to be a potential corporate opportunity for us unless we would be permitted to undertake the opportunity under our amended and restated certificate of incorporation, we have sufficient financial resources to undertake the opportunity and the opportunity would be in line with our business.
130
Table of Contents
Limitations on Liability and Indemnification of Officers and Directors
Our amended and restated certificate of incorporation and amended and restated bylaws will provide indemnification for our directors and officers to the fullest extent permitted by the DGCL. Prior to the completion of this offering, we intend to enter into indemnification agreements with each of our directors that may, in some cases, be broader than the specific indemnification provisions contained under Delaware law. In addition, as permitted by Delaware law, our amended and restated certificate of incorporation includes provisions that eliminate the personal liability of our directors for monetary damages resulting from breaches of certain fiduciary duties as a director. The effect of this provision is to restrict our rights and the rights of our shareholders in derivative suits to recover monetary damages against a director for breach of fiduciary duties as a director, except that a director will be personally liable for:
| n | any breach of his duty of loyalty to us or our shareholders; |
| n | acts or omissions not in good faith or which involve intentional misconduct or a knowing violation of law; |
| n | any transaction from which the director derived an improper personal benefit; or |
| n | improper distributions to shareholders. |
These provisions may be held not to be enforceable for violations of the federal securities laws of the United States.
Voting Agreement
We understand that, substantially concurrently with the closing of this offering, Cinven and Dr. August J. Troendle, our Chief Executive Officer and founder, intend to enter into the Voting Agreement. Pursuant to the terms of the Voting Agreement, for so long as Cinven and Dr. Troendle collectively hold at least 40% of our outstanding voting shares, or the Voting Agreement is otherwise terminated in accordance with its terms, Cinven will agree to vote its shares of our common stock in favor of the election of Dr. Troendle to our Board (so long as Dr. Troendle remains our Chief Executive Officer) upon his nomination by our Board and Dr. Troendle will agree to vote his shares of our common stock in favor of the election of the directors affiliated with Cinven upon their nomination by our Board; provided, that in the event that Cinven holds less than (a) 40% but greater than or equal to 25% of our voting shares then outstanding, Dr. Troendle shall be required to vote for two directors affiliated with Cinven, after giving effect to the directors then sitting on the Board, (b) 25% but greater than or equal to 10% of our voting shares then outstanding, Dr. Troendle shall be required to vote for one director affiliated with Cinven, after giving effect to the directors then sitting on the Board and (c) 10% of our voting shares then outstanding, Dr. Troendle shall not be required to vote for any directors affiliated with Cinven. See “Certain Relationships and Related Person Transactions—Voting Agreement.”
Registration Rights Agreement
In connection with this offering, we will enter into the Registration Rights Agreement with Cinven and Dr. August J. Troendle, our Chief Executive Officer and founder, pursuant to which such holders will have specified rights to require us to register all or any portion of their shares under the Securities Act. See “Certain Relationships and Related Person Transactions—Registration Rights Agreement.”
Transfer Agent and Registrar
The transfer agent and registrar for our common stock will be American Stock Transfer & Trust Company, LLC.
Listing
We have applied to list our common stock on NASDAQ under the symbol “MEDP.”
131
Table of Contents
SHARES ELIGIBLE FOR FUTURE SALE
Immediately prior to this offering, there was no public market for our common stock. Future sales of substantial amounts of common stock in the public market, or the perception that such sales may occur, could adversely affect the market price of our common stock. Although we have applied to have our common stock listed on NASDAQ, we cannot assure you that there will be an active public market for our common stock.
Upon the closing of this offering, we will have outstanding an aggregate of 39,642,113 shares of common stock, assuming the issuance of 7,000,000 shares of common stock offered by us in this offering. Of these shares, all shares sold in this offering will be freely tradable without restriction or further registration under the Securities Act, except for any shares purchased by our “affiliates,” as that term is defined in Rule 144 under the Securities Act, whose sales would be subject to the Rule 144 resale restrictions described below, other than the holding period requirement.
The remaining 32,642,113 shares of common stock will be “restricted securities,” as that term is defined in Rule 144 under the Securities Act. These restricted securities are eligible for public sale only if they are registered under the Securities Act or if they qualify for an exemption from registration under Rules 144 or 701 under the Securities Act, which are summarized below.
In addition, of the 1,779,637 shares of our common stock that will be subject to stock options outstanding immediately after this offering, options to purchase 596,134 shares of common stock will be vested immediately after this offering and, upon exercise, these shares will be eligible for sale subject to the lock–up agreements described below and the holding requirements of Rules 144 and 701 under the Securities Act.
In addition, under the Plan, we intend to grant to certain of our employees and non-employee directors in connection with this offering awards of stock options at an exercise price equal to the initial public offering price of our common stock with respect to an aggregate of up to 685,310 shares of common stock immediately following the completion of the offering. We have not yet determined the allocation of such awards of stock options among the individuals, except for the executive officers and certain non-employee directors. The shares issuable with respect to these awards not held by our affiliates will be freely tradable without restriction under the Securities Act, however, they will be subject to the 180-day lock-up arrangements described under “—Lock-Up Agreements.” See “Executive and Director Compensation—Narrative to Summary Compensation Table—Offering Grants to Employees under the 2016 Incentive Award Plan” and “Executive and Director Compensation—Director Compensation.”
Lock-Up Agreements
We, our officers, directors and holders of substantially all of our outstanding capital stock have agreed, subject to specified exceptions, not to directly or indirectly:
| n | sell, offer, contract or grant any option to sell (including any short sale), pledge, transfer, establish an open “put equivalent position” within the meaning of Rule 16a-l(h) under the Exchange Act; |
| n | otherwise dispose of any shares of common stock, options or warrants to acquire shares of common stock, or securities exchangeable or exercisable for or convertible into shares of common stock currently or hereafter owned either of record or beneficially; or |
| n | publicly announce an intention to do any of the foregoing for a period of 180 days after the date of this prospectus without the prior written consent of Jefferies LLC. |
This restriction terminates after the close of trading of the common stock on and including the 180th day after the date of this prospectus.
Jefferies LLC may, in its sole discretion and at any time or from time to time before the termination of the 180-day period release all or any portion of the securities subject to lock-up agreements. There are no existing agreements between the underwriters and any of our shareholders who will execute a lock-up agreement, providing consent to the sale of shares prior to the expiration of the lock-up period.
Upon the expiration of the applicable lock-up periods, substantially all of the shares subject to such lock-up restrictions will become eligible for sale, subject to the limitations discussed above.
132
Table of Contents
Rule 144
Affiliate Resales of Restricted Securities
In general, beginning 90 days after the effective date of the registration statement of which this prospectus is a part, a person who is an affiliate of ours, or who was an affiliate at any time during the 90 days before a sale, who has beneficially owned shares of our common stock for at least six months would be entitled to sell in “broker’s transactions” or certain “riskless principal transactions” or to market makers, a number of shares within any three-month period that does not exceed the greater of:
| n | 1% of the number of shares of our common stock then outstanding, which will equal approximately 396,421 shares immediately after this offering; or |
| n | the average weekly trading volume in our common stock on NASDAQ during the four calendar weeks preceding the filing of a notice on Form 144 with respect to such sale. |
Affiliate resales under Rule 144 are also subject to the availability of current public information about us. In addition, if the number of shares being sold under Rule 144 by an affiliate during any three-month period exceeds 5,000 shares or has an aggregate sale price in excess of $50,000, the seller must file a notice on Form 144 with the SEC and NASDAQ concurrently with either the placing of a sale order with the broker or the execution directly with a market maker.
Non-Affiliate Resales of Restricted Securities
In general, beginning 90 days after the effective date of the registration statement of which this prospectus is a part, a person who is not an affiliate of ours at the time of sale, and has not been an affiliate at any time during the three months preceding a sale, and who has beneficially owned shares of our common stock for at least six months but less than a year, is entitled to sell such shares subject only to the availability of current public information about us. If such person has held shares of our common stock for at least one year, such person can resell under Rule 144(b)(1) without regard to any Rule 144 restrictions, including the 90-day public company requirement and the current public information requirement.
Non-affiliate resales are not subject to the manner of sale, volume limitation or notice filing provisions of Rule 144.
Rule 701
In general, under Rule 701, any of an issuer’s employees, directors, officers, consultants or advisors who purchases shares from the issuer in connection with a compensatory stock or option plan or other written agreement before the effective date of a registration statement under the Securities Act is entitled to sell such shares 90 days after such effective date in reliance on Rule 144. An affiliate of the issuer can resell shares in reliance on Rule 144 without having to comply with the holding period requirement, and non-affiliates of the issuer can resell shares in reliance on Rule 144 without having to comply with the current public information and holding period requirements.
The SEC has indicated that Rule 701 will apply to typical stock options granted by an issuer before it becomes subject to the reporting requirements of the Exchange Act, along with the shares acquired upon exercise of such options, including exercises after an issuer becomes subject to the reporting requirements of the Exchange Act.
Equity Plans
We intend to file one or more registration statements on Form S-8 under the Securities Act to register all shares of common stock subject to outstanding stock options and common stock issued or issuable under the Plan. We expect to file the registration statement covering shares offered pursuant to the Plan shortly after the date of this prospectus, permitting the resale of such shares by nonaffiliates in the public market without restriction under the Securities Act and the sale by affiliates in the public market subject to compliance with the resale provisions of Rule 144.
Registration Rights
Upon the closing of this offering, the holders of 30,068,853 shares of common stock or their transferees will be entitled to various rights with respect to the registration of these shares under the Securities Act. Registration of these shares under the Securities Act would result in these shares becoming fully tradable without restriction under the Securities Act immediately upon the effectiveness of the registration. See “Certain Relationships and Related Person Transactions—Registration Rights Agreement” for additional information. Shares covered by a registration statement will be eligible for sale in the public market upon the expiration or release from the terms of the lock-up agreement.
133
Table of Contents
MATERIAL U.S. FEDERAL INCOME TAX CONSEQUENCES TO NON-U.S. HOLDERS
The following discussion is a summary of the material U.S. federal income tax consequences to Non-U.S. Holders (as defined below) of the purchase, ownership and disposition of our common stock issued pursuant to this offering, but does not purport to be a complete analysis of all potential tax effects. The effects of other U.S. federal tax laws, such as estate and gift tax laws, and any applicable state, local or non-U.S. tax laws are not discussed. This discussion is based on the U.S. Internal Revenue Code of 1986, as amended, or the Code, Treasury Regulations promulgated thereunder, judicial decisions, and published rulings and administrative pronouncements of the U.S. Internal Revenue Service, or the IRS, in each case in effect as of the date hereof. These authorities may change or be subject to differing interpretations. Any such change or differing interpretation may be applied retroactively in a manner that could adversely affect a Non-U.S. Holder of our common stock. We have not sought and will not seek any rulings from the IRS regarding the matters discussed below. There can be no assurance the IRS or a court will not take a contrary position to that discussed below regarding the tax consequences of the purchase, ownership and disposition of our common stock.
This discussion is limited to Non-U.S. Holders that hold our common stock as a “capital asset” within the meaning of Section 1221 of the Code (generally, property held for investment). This discussion does not address all U.S. federal income tax consequences relevant to a Non-U.S. Holder’s particular circumstances, including the impact of the Medicare contribution tax on net investment income. In addition, it does not address consequences relevant to Non-U.S. Holders subject to special rules, including, without limitation:
| n | U.S. expatriates and former citizens or long-term residents of the United States; |
| n | persons subject to the alternative minimum tax; |
| n | persons holding our common stock as part of a hedge, straddle or other risk reduction strategy or as part of a conversion transaction or other integrated investment; |
| n | banks, insurance companies, and other financial institutions; |
| n | brokers, dealers or traders in securities; |
| n | “controlled foreign corporations,” “passive foreign investment companies,” and corporations that accumulate earnings to avoid U.S. federal income tax; |
| n | partnerships or other entities or arrangements treated as partnerships for U.S. federal income tax purposes (and investors therein); |
| n | tax-exempt organizations or governmental organizations; |
| n | persons deemed to sell our common stock under the constructive sale provisions of the Code; |
| n | persons who hold or receive our common stock pursuant to the exercise of any employee stock option or otherwise as compensation; and |
| n | tax-qualified retirement plans. |
If an entity treated as a partnership for U.S. federal income tax purposes holds our common stock, the tax treatment of a partner in the partnership will depend on the status of the partner, the activities of the partnership and certain determinations made at the partner level. Accordingly, partnerships holding our common stock and the partners in such partnerships should consult their tax advisors regarding the U.S. federal income tax consequences to them.
THIS DISCUSSION IS FOR INFORMATIONAL PURPOSES ONLY AND IS NOT TAX ADVICE. INVESTORS SHOULD CONSULT THEIR TAX ADVISORS WITH RESPECT TO THE APPLICATION OF THE U.S. FEDERAL INCOME TAX LAWS TO THEIR PARTICULAR SITUATIONS AS WELL AS ANY TAX CONSEQUENCES OF THE PURCHASE, OWNERSHIP AND DISPOSITION OF OUR COMMON STOCK ARISING UNDER THE U.S. FEDERAL ESTATE OR GIFT TAX LAWS OR UNDER THE LAWS OF ANY STATE, LOCAL OR NON-U.S. TAXING JURISDICTION OR UNDER ANY APPLICABLE INCOME TAX TREATY.
134
Table of Contents
Definition of a Non-U.S. Holder
For purposes of this discussion, a “Non-U.S. Holder” is any beneficial owner of our common stock that is neither a “U.S. person” nor an entity or arrangement treated as a partnership for U.S. federal income tax purposes. A U.S. person is any person that, for U.S. federal income tax purposes, is or is treated as any of the following:
| n | an individual who is a citizen or resident of the United States; |
| n | a corporation created or organized under the laws of the United States, any state thereof, or the District of Columbia; |
| n | an estate, the income of which is subject to U.S. federal income tax regardless of its source; or |
| n | a trust that (1) is subject to the primary supervision of a U.S. court and the control of one or more “United States persons” (within the meaning of Section 7701(a)(30) of the Code), or (2) has a valid election in effect to be treated as a United States person for U.S. federal income tax purposes. |
Distributions
As described in the section entitled “Dividend Policy,” we do not anticipate declaring or paying dividends to holders of our common stock in the foreseeable future. However, if we do make distributions of cash or property on our common stock, such distributions will constitute dividends for U.S. federal income tax purposes to the extent paid from our current or accumulated earnings and profits, as determined under U.S. federal income tax principles. Amounts not treated as dividends for U.S. federal income tax purposes will constitute a return of capital and first be applied against and reduce a Non-U.S. Holder’s adjusted tax basis in its common stock, but not below zero. Any excess will be treated as capital gain and will be treated as described below under “—Sale or Other Taxable Disposition.”
Subject to the discussion below on effectively connected income, dividends paid to a Non-U.S. Holder of our common stock will be subject to U.S. federal withholding tax at a rate of 30% of the gross amount of the dividends (or such lower rate specified by an applicable income tax treaty, provided the Non-U.S. Holder furnishes a valid IRS Form W-8BEN or W-8BEN-E (or other applicable documentation) certifying qualification for the lower treaty rate). A Non-U.S. Holder that does not timely furnish the required documentation, but that qualifies for a reduced treaty rate, may obtain a refund of any excess amounts withheld by timely filing an appropriate claim for refund with the IRS. Non-U.S. Holders should consult their tax advisors regarding their entitlement to benefits under any applicable income tax treaty.
If dividends paid to a Non-U.S. Holder are effectively connected with the Non-U.S. Holder’s conduct of a trade or business within the United States (and, if required by an applicable income tax treaty, the Non-U.S. Holder maintains a permanent establishment in the United States to which such dividends are attributable), the Non-U.S. Holder will be exempt from the U.S. federal withholding tax described above. To claim the exemption, the Non-U.S. Holder must furnish to the applicable withholding agent a valid IRS Form W-8ECI, certifying that the dividends are effectively connected with the Non-U.S. Holder’s conduct of a trade or business within the United States.
Any such effectively connected dividends will be subject to U.S. federal income tax on a net income basis at the regular graduated rates applicable to U.S. persons. A Non-U.S. Holder that is a corporation also may be subject to a branch profits tax at a rate of 30% (or such lower rate specified by an applicable income tax treaty) on such effectively connected dividends, as adjusted for certain items. Non-U.S. Holders should consult their tax advisors regarding any applicable tax treaties that may provide for different rules.
Sale or Other Taxable Disposition
Subject to the discussion below regarding FATCA, a Non-U.S. Holder will not be subject to U.S. federal income tax on any gain realized upon the sale or other taxable disposition of our common stock unless:
| n | the gain is effectively connected with the Non-U.S. Holder’s conduct of a trade or business within the United States (and, if required by an applicable income tax treaty, the Non-U.S. Holder maintains a permanent establishment in the United States to which such gain is attributable); |
| n | the Non-U.S. Holder is a nonresident alien individual present in the United States for 183 days or more during the taxable year of the disposition and certain other requirements are met; or |
135
Table of Contents
| n | our common stock constitutes a U.S. real property interest, or USRPI, by reason of our status as a U.S. real property holding corporation, or USRPHC, for U.S. federal income tax purposes. |
Gain described in the first bullet point above generally will be subject to U.S. federal income tax on a net income basis at the regular graduated rates applicable to U.S. persons. A Non-U.S. Holder that is a corporation also may be subject to a branch profits tax at a rate of 30% (or such lower rate specified by an applicable income tax treaty) on such effectively connected gain, as adjusted for certain items.
Gain described in the second bullet point above will be subject to U.S. federal income tax at a rate of 30% (or such lower rate specified by an applicable income tax treaty), which may be offset by U.S. source capital losses of the Non-U.S. Holder (even though the individual is not considered a resident of the United States), provided the Non-U.S. Holder has timely filed U.S. federal income tax returns with respect to such losses.
With respect to the third bullet point above, we believe we currently are not, and do not anticipate becoming, a USRPHC. Because the determination of whether we are a USRPHC depends, however, on the fair market value of our USRPIs relative to the fair market value of our non-U.S. real property interests and our other business assets, there can be no assurance we currently are not a USRPHC or will not become one in the future. Even if we are or were to become a USRPHC, gain arising from the sale or other taxable disposition by a Non-U.S. Holder of our common stock will not be subject to U.S. federal income tax if our common stock is “regularly traded,” as defined by applicable Treasury Regulations, on an established securities market, and such Non-U.S. Holder owned, actually and/or constructively, 5% or less of our common stock throughout the shorter of the five-year period ending on the date of the sale or other taxable disposition or the Non-U.S. Holder’s holding period.
Non-U.S. Holders should consult their tax advisors regarding potentially applicable income tax treaties that may provide for different rules.
Information Reporting and Backup Withholding
Payments of dividends on our common stock will not be subject to backup withholding, provided the applicable withholding agent does not have actual knowledge or reason to know the holder is a United States person and the holder either certifies its non-U.S. status, such as by furnishing a valid IRS Form W-8BEN, W-8BEN-E or W-8ECI, or otherwise establishes an exemption. However, information returns are required to be filed with the IRS in connection with any dividends on our common stock paid to the Non-U.S. Holder, regardless of whether any tax was actually withheld. In addition, proceeds of the sale or other taxable disposition of our common stock within the United States or conducted through certain U.S.-related brokers generally will not be subject to backup withholding or information reporting, if the applicable withholding agent receives the certification described above and does not have actual knowledge or reason to know that such holder is a United States person, or the holder otherwise establishes an exemption. Proceeds of a disposition of our common stock conducted through a non-U.S. office of a non-U.S. broker generally will not be subject to backup withholding or information reporting.
Copies of information returns that are filed with the IRS may also be made available under the provisions of an applicable treaty or agreement to the tax authorities of the country in which the Non-U.S. Holder resides or is established.
Backup withholding is not an additional tax. Any amounts withheld under the backup withholding rules may be allowed as a refund or a credit against a Non-U.S. Holder’s U.S. federal income tax liability, provided the required information is timely furnished to the IRS.
Additional Withholding Tax on Payments Made to Foreign Accounts
Withholding taxes may be imposed under Sections 1471 to 1474 of the Code (such Sections commonly referred to as the Foreign Account Tax Compliance Act, or “FATCA”) on certain types of payments made to non-U.S. financial institutions and certain other non-U.S. entities. Specifically, a 30% withholding tax may be imposed on dividends on, or gross proceeds from the sale or other disposition of, our common stock paid to a “foreign financial institution” or a “non-financial foreign entity” (each as defined in the Code), unless (1) the foreign financial institution undertakes certain diligence and reporting obligations, (2) the non-financial foreign entity either certifies it does not
136
Table of Contents
have any “substantial United States owners” (as defined in the Code) or furnishes identifying information regarding each substantial United States owner, or (3) the foreign financial institution or non-financial foreign entity otherwise qualifies for an exemption from these rules. If the payee is a foreign financial institution and is subject to the diligence and reporting requirements in (1) above, it must enter into an agreement with the U.S. Department of the Treasury requiring, among other things, that it undertake to identify accounts held by certain “specified United States persons” or “United States-owned foreign entities” (each as defined in the Code), annually report certain information about such accounts, and withhold 30% on certain payments to non-compliant foreign financial institutions and certain other account holders. Foreign financial institutions located in jurisdictions that have an intergovernmental agreement with the United States governing FATCA may be subject to different rules.
Under the applicable Treasury Regulations and administrative guidance, withholding under FATCA generally applies to payments of dividends on our common stock, and will apply to payments of gross proceeds from the sale or other disposition of such stock on or after January 1, 2019.
Prospective investors should consult their tax advisors regarding the potential application of withholding tax under FATCA to their investment in our common stock.
137
Table of Contents
Subject to the terms and conditions set forth in the underwriting agreement, dated , 2016, among us and Jefferies LLC and Credit Suisse Securities (USA) LLC, as the representatives of the underwriters named below, we have agreed to sell to the underwriters, and each of the underwriters has agreed, severally and not jointly, to purchase from us, the respective number of shares of common stock shown opposite its name below:
| UNDERWRITERS |
NUMBER OF SHARES |
|||
| Jefferies LLC |
||||
| Credit Suisse Securities (USA) LLC |
||||
| UBS Securities LLC |
||||
| Wells Fargo Securities, LLC |
||||
| Robert W. Baird & Co. Incorporated |
||||
| William Blair & Company, L.L.C. |
||||
|
|
|
|||
| Total |
||||
|
|
|
|||
The underwriting agreement provides that the obligations of the several underwriters are subject to certain conditions precedent such as the receipt by the underwriters of officers’ certificates and legal opinions and approval of certain legal matters by their counsel. The underwriting agreement provides that the underwriters will purchase all of the shares of common stock if any of them are purchased. If an underwriter defaults, the underwriting agreement provides that the purchase commitments of the nondefaulting underwriters may be increased or the underwriting agreement may be terminated. We have agreed to indemnify the underwriters and certain of their controlling persons against certain liabilities, including liabilities under the Securities Act, and to contribute to payments that the underwriters may be required to make in respect of those liabilities.
The shares of common stock will constitute a new class of securities with no established trading market. The underwriters have advised us that, following the completion of this offering, they currently intend to make a market in the common stock as permitted by applicable laws and regulations. However, the underwriters are not obligated to do so, and the underwriters may discontinue any market-making activities at any time without notice in their sole discretion. Accordingly, no assurance can be given as to the liquidity of the trading market for the common stock, that you will be able to sell any of the common stock held by you at a particular time or that the prices that you receive when you sell will be favorable.
The underwriters are offering the shares of common stock subject to their acceptance of the shares of common stock from us and subject to prior sale. The underwriters reserve the right to withdraw, cancel or modify offers to the public and to reject orders in whole or in part. In addition, the underwriters have advised us that they do not intend to confirm sales to any account over which they exercise discretionary authority.
Commission and Expenses
The underwriters have advised us that they propose to offer the shares of common stock to the public at the initial public offering price set forth on the cover page of this prospectus and to certain dealers, which may include the underwriters, at that price less a concession not in excess of $ per share of common stock. The underwriters may allow, and certain dealers may reallow, a discount from the concession not in excess of $ per share of common stock to certain brokers and dealers. After the offering, the initial public offering price, concession and reallowance to dealers may be reduced by the representatives. No such reduction will change the amount of proceeds to be received by us as set forth on the cover page of this prospectus.
138
Table of Contents
The following table shows the public offering price, the underwriting discounts and commissions that we are to pay the underwriters and the proceeds, before expenses, to us in connection with this offering. Such amounts are shown assuming both no exercise and full exercise of the underwriters’ option to purchase additional shares.
| PER SHARE | TOTAL | |||||||||||||||
| WITHOUT OPTION TO PURCHASE ADDITIONAL SHARES |
WITH OPTION TO PURCHASE ADDITIONAL SHARES |
WITHOUT OPTION TO PURCHASE ADDITIONAL SHARES |
WITH OPTION TO PURCHASE ADDITIONAL SHARES |
|||||||||||||
| Public offering price |
$ | $ | $ | $ | ||||||||||||
| Underwriting discounts and commissions paid by us |
$ | $ | $ | $ | ||||||||||||
| Proceeds to us, before expenses |
$ | $ | $ | $ | ||||||||||||
We estimate expenses payable by us in connection with this offering, other than the underwriting discounts and commissions referred to above, will be approximately $2.8 million. We have also agreed to reimburse the underwriters for certain expenses, including up to an aggregate of $30,000 in connection with the clearance of this offering with the Financial Industry Regulatory Authority, as set forth in the underwriting agreement.
Determination of Offering Price
Prior to this offering, there has not been a public market for our common stock. Consequently, the initial public offering price for our common stock will be determined by negotiations between us and the representatives. Among the factors to be considered in these negotiations will be prevailing market conditions, our financial information, market valuations of other companies that we and the underwriters believe to be comparable to us, estimates of our business potential, the present state of our development and other factors deemed relevant.
We offer no assurances that the initial public offering price will correspond to the price at which the common stock will trade in the public market subsequent to the offering or that an active trading market for the common stock will develop and continue after the offering.
Listing
We have applied to have our common stock listed on NASDAQ under the trading symbol “MEDP.”
Stamp Taxes
If you purchase shares of common stock offered in this prospectus, you may be required to pay stamp taxes and other charges under the laws and practices of the country of purchase, in addition to the offering price listed on the cover page of this prospectus.
Option to Purchase Additional Shares
We have granted to the underwriters an option, exercisable for 30 days from the date of this prospectus, to purchase, from time to time, in whole or in part, up to an aggregate of shares from us at the public offering price set forth on the cover page of this prospectus, less underwriting discounts and commissions. If the underwriters exercise this option, each underwriter will be obligated, subject to specified conditions, to purchase a number of additional shares proportionate to that underwriter’s initial purchase commitment as indicated in the table above. This option may be exercised only if the underwriters sell more shares than the total number set forth on the cover page of this prospectus.
No Sales of Similar Securities
We, our officers, directors and holders of all or substantially all our outstanding capital stock and other securities have agreed, subject to specified exceptions, not to directly or indirectly:
| n | sell, offer, contract or grant any option to sell (including any short sale), pledge, transfer, establish an open “put equivalent position” within the meaning of Rule 16a-l(h) under the Exchange Act; |
139
Table of Contents
| n | otherwise dispose of any shares of common stock, options or warrants to acquire shares of common stock, or securities exchangeable or exercisable for or convertible into shares of common stock currently or hereafter owned either of record or beneficially; or |
| n | publicly announce an intention to do any of the foregoing for a period of 180 days after the date of this prospectus without the prior written consent of Jefferies LLC. |
This restriction terminates after the close of trading of the common stock on and including the 180th day after the date of this prospectus.
Jefferies LLC may, in its sole discretion and at any time or from time to time before the termination of the 180-day period release all or any portion of the securities subject to lock-up agreements. There are no existing agreements between the underwriters and any of our shareholders who will execute a lock-up agreement, providing consent to the sale of shares prior to the expiration of the lock-up period.
Stabilization
The underwriters have advised us that they, pursuant to Regulation M under the Exchange Act, certain persons participating in the offering may engage in short sale transactions, stabilizing transactions, syndicate covering transactions or the imposition of penalty bids in connection with this offering. These activities may have the effect of stabilizing or maintaining the market price of the common stock at a level above that which might otherwise prevail in the open market. Establishing short sales positions may involve either “covered” short sales or “naked” short sales.
“Covered” short sales are sales made in an amount not greater than the underwriters’ option to purchase additional shares of our common stock in this offering. The underwriters may close out any covered short position by either exercising their option to purchase additional shares of our common stock or purchasing shares of our common stock in the open market. In determining the source of shares to close out the covered short position, the underwriters will consider, among other things, the price of shares available for purchase in the open market as compared to the price at which they may purchase shares through the option to purchase additional shares.
“Naked” short sales are sales in excess of the option to purchase additional shares of our common stock. The underwriters must close out any naked short position by purchasing shares in the open market. A naked short position is more likely to be created if the underwriters are concerned that there may be downward pressure on the price of the shares of our common stock in the open market after pricing that could adversely affect investors who purchase in this offering.
A stabilizing bid is a bid for the purchase of shares of common stock on behalf of the underwriters for the purpose of fixing or maintaining the price of the common stock. A syndicate covering transaction is the bid for or the purchase of shares of common stock on behalf of the underwriters to reduce a short position incurred by the underwriters in connection with the offering. Similar to other purchase transactions, the underwriter’s purchases to cover the syndicate short sales may have the effect of raising or maintaining the market price of our common stock or preventing or retarding a decline in the market price of our common stock. As a result, the price of our common stock may be higher than the price that might otherwise exist in the open market. A penalty bid is an arrangement permitting the underwriters to reclaim the selling concession otherwise accruing to a syndicate member in connection with the offering if the common stock originally sold by such syndicate member are purchased in a syndicate covering transaction and therefore have not been effectively placed by such syndicate member.
Neither we, nor any of the underwriters make any representation or prediction as to the direction or magnitude of any effect that the transactions described above may have on the price of our common stock. The underwriters are not obligated to engage in these activities and, if commenced, any of the activities may be discontinued at any time.
The underwriters may also engage in passive market making transactions in our common stock on NASDAQ in accordance with Rule 103 of Regulation M during a period before the commencement of offers or sales of shares of our common stock in this offering and extending through the completion of distribution. A passive market maker must display its bid at a price not in excess of the highest independent bid of that security. However, if all independent bids are lowered below the passive market maker’s bid, that bid must then be lowered when specified purchase limits are exceeded.
140
Table of Contents
Electronic Distribution
A prospectus in electronic format may be made available by e-mail or on the web sites or through online services maintained by one or more of the underwriters or their affiliates. In those cases, prospective investors may view offering terms online and may be allowed to place orders online. The underwriters may agree with us to allocate a specific number of shares of common stock for sale to online brokerage account holders. Any such allocation for online distributions will be made by the underwriters on the same basis as other allocations. Other than the prospectus in electronic format, the information on the underwriters’ web sites and any information contained in any other web site maintained by any of the underwriters is not part of this prospectus, has not been approved and/or endorsed by us or the underwriters and should not be relied upon by investors.
Other Activities and Relationships
The underwriter and certain of its affiliates are full-service financial institutions engaged in various activities, which may include securities trading, commercial and investment banking, financial advisory, investment management, investment research, principal investment, hedging, financing and brokerage activities. The underwriter and certain of its affiliates have, from time to time, performed, and may in the future perform, various commercial and investment banking and financial advisory services for us and our affiliates, for which they received or will receive customary fees and expenses.
In particular, an affiliate of Jefferies LLC serves as the administrative agent, swingline lender and co-documentation agent of our Senior Secured Credit Facilities and certain affiliates of Jefferies LLC, Credit Suisse Securities (USA) LLC, UBS Securities LLC and Wells Fargo Securities, LLC serve as joint lead arrangers, joint bookrunners and syndication agents of our Senior Secured Credit Facilities and certain affiliates of Jefferies LLC, Credit Suisse Securities (USA) LLC and Wells Fargo Securities, LLC serve as lenders under our Senior Secured Credit Facilities. As described in “Use of Proceeds” we intend to use the net proceeds of this offering to repay $138.3 million in aggregate principal amount of outstanding borrowings under our Senior Secured Term Loan Facility. Because of their affiliates’ lending relationships Jefferies LLC and Wells Fargo Securities, LLC will receive some of the net proceeds of this offering.
In the ordinary course of their various business activities, the underwriter and certain of its affiliates may make or hold a broad array of investments and actively trade debt and equity securities (or related derivative securities) and financial instruments (including bank loans) for their own account and for the accounts of their customers, and such investment and securities activities may involve securities and/or instruments issued by us and our affiliates. If the underwriters or their respective affiliates have a lending relationship with us, they routinely hedge their credit exposure to us consistent with their customary risk management policies. The underwriters and their respective affiliates may hedge such exposure by entering into transactions which consist of either the purchase of credit default swaps or the creation of short positions in our securities or the securities of our affiliates, including potentially the common stock offered hereby. Any such short positions could adversely affect future trading prices of the common stock offered hereby. The underwriters and certain of their respective affiliates may also communicate independent investment recommendations, market color or trading ideas and/or publish or express independent research views in respect of such securities or instruments and may at any time hold, or recommend to customers that they acquire, long and/or short positions in such securities and instruments.
Selling Restrictions
This prospectus does not constitute an offer to sell to, or a solicitation of an offer to buy from, anyone in any country or jurisdiction (i) in which such an offer or solicitation is not authorized, (ii) in which any person making such offer or solicitation is not qualified to do so or (iii) in which any such offer or solicitation would otherwise be unlawful. No action has been taken that would, or is intended to, permit a public offer of the shares of common stock or possession or distribution of this prospectus or any other offering or publicity material relating to the shares of common stock in any country or jurisdiction (other than the United States) where any such action for that purpose is required. Accordingly, each underwriter has undertaken that it will not, directly or indirectly, offer or sell any shares of common stock or have in its possession, distribute or publish any prospectus, form of application, advertisement or other document or information in any country or jurisdiction except under circumstances that will, to the best of
141
Table of Contents
its knowledge and belief, result in compliance with any applicable laws and regulations and all offers and sales of the shares of common stock by it will be made on the same terms.
European Economic Area
In relation to each member state of the European Economic Area which has implemented the Prospectus Directive (each, a “Relevant Member State”), an offer to the public of any common shares which are the subject of the offering contemplated by this prospectus may not be made in that Relevant Member State except that an offer to the public in that Relevant Member State of any common shares may be made at any time under the following exemptions under the Prospectus Directive, if they have been implemented in that Relevant Member State:
| n | to any legal entity which is a “qualified investor” as defined in the Prospectus Directive; |
| n | to fewer than 100 or, if the Relevant Member State has implemented the relevant provision of the 2010 PD Amending Directive, 150, natural or legal persons (other than qualified investors as defined in the Prospectus Directive), as permitted under the Prospectus Directive, subject to obtaining the prior consent of the underwriters or the underwriters nominated by us for any such offer; or |
| n | in any other circumstances falling within Article 3(2) of the Prospectus Directive, |
provided that no such offer of common shares shall require us or any of the underwriters to publish a prospectus pursuant to Article 3 of the Prospectus Directive or supplement a prospectus pursuant to Article 16 of the Prospectus Directive. For the purposes of this provision, the expression an “offer common shares to the public” in relation to the common shares in any Relevant Member State means the communication in any form and by any means of sufficient information on the terms of the offer and the common shares to be offered so as to enable an investor to decide to purchase or subscribe to the common shares, as the same may be varied in that Relevant Member State by any measure implementing the Prospectus Directive in that Relevant Member State and the expression “Prospectus Directive” means Directive 2003/71/EC (and amendments thereto, including the 2010 PD Amending Directive, to the extent implemented in the Relevant Member State), and includes any relevant implementing measure in the Relevant Member State and the expression “2010 PD Amending Directive” means Directive 2010/73/EU.
United Kingdom
This prospectus is only being distributed to, and is only directed at, persons in the United Kingdom that are qualified investors within the meaning of Article 2(1)(e) of the Prospectus Directive that are also (i) investment professionals falling within Article 19(5) of the Financial Services and Markets Act 2000 (Financial Promotion) Order 2005, as amended, or the Order, and/or (ii) high net worth entities falling within Article 49(2)(a) to (d) of the Order and other persons to whom it may lawfully be communicated (each such person being referred to as a “relevant person”). This prospectus and its contents are confidential and should not be distributed, published or reproduced (in whole or in part) or disclosed by recipients to any other persons in the United Kingdom. Any person in the United Kingdom that is not a relevant person should not act or rely on this document or any of its contents.
Australia
This prospectus is not a disclosure document for the purposes of Australia’s Corporations Act 2001 (Cth) of Australia, or the Corporations Act, has not been lodged with the Australian Securities & Investments Commission and is only directed to the categories of exempt persons set out below. Accordingly, if you receive this prospectus in Australia:
You confirm and warrant that you are either:
| n | a “sophisticated investor” under section 708(8)(a) or (b) of the Corporations Act; |
| n | a “sophisticated investor” under section 708(8)(c) or (d) of the Corporations Act and that you have provided an accountant’s certificate to the Company which complies with the requirements of section 708(8)(c)(i) or (ii) of the Corporations Act and related regulations before the offer has been made; |
| n | a person associated with the Company under Section 708(12) of the Corporations Act; or |
| n | a “professional investor” within the meaning of section 708(11)(a) or (b) of the Corporations Act. |
To the extent that you are unable to confirm or warrant that you are an exempt sophisticated investor, associated person or professional investor under the Corporations Act any offer made to you under this prospectus is void and incapable of acceptance.
142
Table of Contents
You warrant and agree that you will not offer any of the securities issued to you pursuant to this prospectus for resale in Australia within 12 months of those securities being issued unless any such resale offer is exempt from the requirement to issue a disclosure document under section 708 of the Corporations Act.
Hong Kong
No securities have been offered or sold, and no securities may be offered or sold, in Hong Kong, by means of any document, other than to persons whose ordinary business is to buy or sell shares or debentures, whether as principal or agent; or to “professional investors” as defined in the Securities and Futures Ordinance (Cap. 571) of Hong Kong, or SFO, and any rules made under that Ordinance; or in other circumstances which do not result in the document being a “prospectus” as defined in the Companies Ordinance (Cap. 32) of Hong Kong, or CO, or which do not constitute an offer or invitation to the public for the purpose of the CO or the SFO. No document, invitation or advertisement relating to the securities has been issued or may be issued or may be in the possession of any person for the purpose of issue (in each case whether in Hong Kong or elsewhere), which is directed at, or the contents of which are likely to be accessed or read by, the public of Hong Kong (except if permitted under the securities laws of Hong Kong) other than with respect to securities which are or are intended to be disposed of only to persons outside Hong Kong or only to “professional investors” as defined in the SFO and any rules made under that Ordinance.
This prospectus has not been registered with the Registrar of Companies in Hong Kong. Accordingly, this prospectus may not be issued, circulated or distributed in Hong Kong, and the securities may not be offered for subscription to members of the public in Hong Kong. Each person acquiring the securities will be required, and is deemed by the acquisition of the securities, to confirm that he is aware of the restriction on offers of the securities described in this prospectus and the relevant offering documents and that he is not acquiring, and has not been offered any securities in circumstances that contravene any such restrictions.
Japan
The offering has not been and will not be registered under the Financial Instruments and Exchange Law of Japan (Law No. 25 of 1948 of Japan, as amended), or FIEL, and the underwriters will not offer or sell any securities, directly or indirectly, in Japan or to, or for the benefit of, any resident of Japan (which term as used herein means any person resident in Japan, including any corporation or other entity organized under the laws of Japan), or to others for re-offering or resale, directly or indirectly, in Japan or to, or for the benefit of, any resident of Japan, except pursuant to an exemption from the registration requirements of, and otherwise in compliance with, the FIEL and any other applicable laws, regulations and ministerial guidelines of Japan.
Singapore
This prospectus has not been and will not be lodged or registered as a prospectus with the Monetary Authority of Singapore. Accordingly, this prospectus and any other document or material in connection with the offer or sale, or invitation for subscription or purchase, of the common stock may not be circulated or distributed, nor may the common stock be offered or sold, or be made the subject of an invitation for subscription or purchase, whether directly or indirectly, to persons in Singapore other than (i) to an institutional investor under Section 274 of the Securities and Futures Act, Chapter 289 of Singapore, or the SFA, (ii) to a relevant person pursuant to Section 275(1), or any person pursuant to Section 275(1A), and in accordance with the conditions specified in Section 275, of the SFA, or (iii) otherwise pursuant to, and in accordance with the conditions of, any other applicable provision of the SFA.
Where the common stock is subscribed or purchased under Section 275 of the SFA by a relevant person which is:
| n | a corporation (which is not an accredited investor (as defined in Section 4A of the SFA)) the sole business of which is to hold investments and the entire share capital of which is owned by one or more individuals, each of whom is an accredited investor; or |
| n | a trust (where the trustee is not an accredited investor) whose sole purpose is to hold investments and each beneficiary of the trust is an individual who is an accredited investor, |
securities (as defined in Section 239(1) of the SFA) of that corporation or the beneficiaries’ rights and interest (howsoever described) in that trust shall not be transferred within six months after that corporation or that trust has acquired the common stock pursuant to an offer made under Section 275 of the SFA except:
| n | to an institutional investor or to a relevant person defined in Section 275(2) of the SFA, or to any person arising from an offer referred to in Section 275(1A) or Section 276(4)(i)(B) of the SFA; |
143
Table of Contents
| n | where no consideration is or will be given for the transfer; |
| n | where the transfer is by operation of law; |
| n | as specified in Section 276(7) of the SFA; or |
| n | as specified in Regulation 32 of the Securities and Futures (Offers of Investments) (Shares and Debentures) Regulations 2005 of Singapore. |
Switzerland
The securities may not be publicly offered in Switzerland and will not be listed on the SIX Swiss Exchange, or SIX, or on any other stock exchange or regulated trading facility in Switzerland. This prospectus has been prepared without regard to the disclosure standards for issuance prospectuses under art. 652a or art. 1156 of the Swiss Code of Obligations or the disclosure standards for listing prospectuses under art. 27 ff. of the SIX Listing Rules or the listing rules of any other stock exchange or regulated trading facility in Switzerland. Neither this prospectus nor any other offering or marketing material relating to the securities or the offering may be publicly distributed or otherwise made publicly available in Switzerland.
Neither this prospectus nor any other offering or marketing material relating to the offering, the Company or the securities have been or will be filed with or approved by any Swiss regulatory authority. In particular, this prospectus will not be filed with, and the offer of securities will not be supervised by, the Swiss Financial Market Supervisory Authority FINMA, and the offer of securities has not been and will not be authorized under the Swiss Federal Act on Collective Investment Schemes, or CISA. The investor protection afforded to acquirers of interests in collective investment schemes under the CISA does not extend to acquirers of securities.
Canada
The securities may be sold only to purchasers purchasing, or deemed to be purchasing, as principal that are accredited investors, as defined in National Instrument 45-106 Prospectus Exemptions or subsection 73.3(1) of the Securities Act (Ontario), and are permitted clients, as defined in National Instrument 31-103 Registration Requirements, Exemptions and Ongoing Registrant Obligations. Any resale of the securities must be made in accordance with an exemption from, or in a transaction not subject to, the prospectus requirements of applicable securities laws.
Securities legislation in certain provinces or territories of Canada may provide a purchaser with remedies for rescission or damages if this prospectus (including any amendment thereto) contains a misrepresentation, provided that the remedies for rescission or damages are exercised by the purchaser within the time limit prescribed by the securities legislation of the purchaser’s province or territory. The purchaser should refer to any applicable provisions of the securities legislation of the purchaser’s province or territory for particulars of these rights or consult with a legal advisor.
Pursuant to section 3A.3 (or, in the case of securities issued or guaranteed by the government of a non-Canadian jurisdiction, section 3A.4) of National Instrument 33-105 Underwriting Conflicts (“NI 33-105”), the underwriters are not required to comply with the disclosure requirements of NI 33-105 regarding underwriter conflicts of interest in connection with this offering.
144
Table of Contents
Certain legal matters in connection with this offering, including the validity of the shares of our common stock offered hereby, will be passed upon for us by Latham & Watkins LLP, New York, New York. The underwriters are being represented by Gibson, Dunn & Crutcher LLP, New York, New York.
The consolidated financial statements of Medpace Holdings, Inc. and subsidiaries as of December 31, 2015 and 2014 (Successor) and for the year ended December 31, 2015 (Successor), and the periods from April 1, 2014 through December 31, 2014 (Successor), January 1, 2014 through March 31, 2014 (Predecessor), and the year ended December 31, 2013 (Predecessor) included in this prospectus have been audited by Deloitte & Touche LLP, an independent registered public accounting firm, as stated in their report appearing herein. Such financial statements have been so included in reliance upon the report of such firm given upon their authority as experts in accounting and auditing.
WHERE YOU CAN FIND MORE INFORMATION
We have filed with the SEC a registration statement on Form S-1 under the Securities Act with respect to the shares of common stock offered hereby. This prospectus does not contain all of the information set forth in the registration statement and the exhibits and schedules thereto. For further information with respect to us and the shares of common stock offered hereby, you should refer to the registration statement and to the exhibits and schedules filed therewith. Statements contained in this prospectus regarding the contents of any contract or any other document that is filed as an exhibit to the registration statement are not necessarily complete, and each such statement is qualified in all respects by reference to the full text of such contract or other document filed as an exhibit to the registration statement. When we complete this offering, we will be required to file annual, quarterly and current reports, proxy statements and other information with the SEC. Our SEC filings, including our registration statement and the exhibits and schedules thereto, may be inspected without charge at the public reference room maintained by the SEC located at 100 F Street, N.E., Room 1580, Washington, D.C. 20549. Copies of all or any portion of the registration statements and the filings may be obtained from such offices upon payment of prescribed fees. The public may obtain information on the operation of the public reference room by calling the SEC at 1-800-SEC-0330 or (202) 551-8090. The SEC maintains a website at www.sec.gov that contains reports, proxy and information statements and other information regarding registrants that file electronically with the SEC.
You may also obtain a copy of any of our filings, at no cost, by writing or telephoning us at:
Medpace Holdings, Inc.
5375 Medpace Way
Cincinnati, Ohio 45227
(513) 579-9911
145
Table of Contents
INDEX TO CONSOLIDATED FINANCIAL STATEMENTS
Audited Consolidated Financial Statements
| PAGE | ||||
| F-2 | ||||
| Consolidated Balance Sheets as of December 31, 2015 and 2014 |
F-3 | |||
| F-4 | ||||
| F-5 | ||||
| F-6 | ||||
| F-7 | ||||
| F-8 | ||||
Unaudited Condensed Consolidated Financial Statements
F-1
Table of Contents
REPORT OF INDEPENDENT REGISTERED PUBLIC ACCOUNTING FIRM
To the Shareholders and Board of Directors of
Medpace Holdings, Inc. and subsidiaries:
We have audited the accompanying consolidated balance sheets of Medpace Holdings, Inc. and its subsidiaries (the “Company”) as of December 31, 2015 and 2014 (Successor), and the related consolidated statements of operations, comprehensive (loss) income, shareholders’ equity, and cash flows for the year ended December 31, 2015 (Successor), and the periods from April 1, 2014 through December 31, 2014 (Successor), January 1, 2014 through March 31, 2014 (Predecessor), and the year ended December 31, 2013 (Predecessor). These consolidated financial statements are the responsibility of the Company’s management. Our responsibility is to express an opinion on these financial statements based on our audits.
We conducted our audits in accordance with the standards of the Public Company Accounting Oversight Board (United States). Those standards require that we plan and perform the audit to obtain reasonable assurance about whether the financial statements are free of material misstatement. The Company is not required to have, nor were we engaged to perform, an audit of its internal control over financial reporting. Our audits included consideration of internal control over financial reporting as a basis for designing audit procedures that are appropriate in the circumstances, but not for the purpose of expressing an opinion on the effectiveness of the Company’s internal control over financial reporting. Accordingly, we express no such opinion. An audit also includes examining, on a test basis, evidence supporting the amounts and disclosures in the financial statements, assessing the accounting principles used and significant estimates made by management, as well as evaluating the overall financial statement presentation. We believe that our audits provide a reasonable basis for our opinion.
In our opinion, such consolidated financial statements present fairly, in all material respects, the financial position of Medpace Holdings, Inc. and subsidiaries at as of December 31, 2015 and 2014 (Successor), and the results of their operations and their cash flows for the year ended December 31, 2015 (Successor), and the periods from April 1, 2014 through December 31, 2014 (Successor), January 1, 2014 through March 31, 2014 (Predecessor), and the year ended December 31, 2013 (Predecessor), in conformity with accounting principles generally accepted in the United States of America.
/s/ Deloitte & Touche LLP
Cincinnati, Ohio
March 1, 2016 (July 26, 2016 as to the effects of the reverse stock split described in Notes 3 and 17)
F-2
Table of Contents
MEDPACE HOLDINGS, INC. AND SUBSIDIARIES
(Amounts in thousands except share amounts)
| SUCCESSOR | ||||||||
| DECEMBER 31, 2015 |
DECEMBER 31, 2014 |
|||||||
| ASSETS |
||||||||
| Current assets: |
||||||||
| Cash and cash equivalents |
$ | 14,880 | $ | 54,285 | ||||
| Restricted cash |
2,857 | 1,104 | ||||||
| Accounts receivable: |
||||||||
| Billed, net (includes $2.3 million and $0.7 million with related parties at December 31, 2015 and 2014, respectively) |
46,352 | 52,468 | ||||||
| Unbilled Services (includes $0.6 million and $0.2 million with related parties at December 31, 2015 and 2014, respectively) |
18,736 | 12,780 | ||||||
| Prepaid expenses and other current assets |
11,896 | 12,684 | ||||||
|
|
|
|
|
|||||
| Total current assets |
94,721 | 133,321 | ||||||
| Property and equipment, net |
37,512 | 38,084 | ||||||
| Goodwill |
660,981 | 670,294 | ||||||
| Intangible assets, net |
186,743 | 249,885 | ||||||
| Deferred income taxes |
157 | 138 | ||||||
| Other assets |
3,927 | 5,190 | ||||||
|
|
|
|
|
|||||
| Total assets |
$ | 984,041 | $ | 1,096,912 | ||||
|
|
|
|
|
|||||
| LIABILITIES AND SHAREHOLDERS’ EQUITY |
||||||||
| Current liabilities: |
||||||||
| Accounts payable |
$ | 8,728 | $ | 6,252 | ||||
| Accrued expenses |
20,111 | 20,307 | ||||||
| Pre-funded study costs (includes $3.7 million and $2.4 million with related parties at December 31, 2015 and 2014, respectively) |
46,599 | 36,686 | ||||||
| Advanced billings (includes $10.2 million and $5.3 million with related parties at December 31, 2015 and 2014, respectively) |
51,051 | 58,139 | ||||||
| Other current liabilities |
7,528 | 12,256 | ||||||
|
|
|
|
|
|||||
| Total current liabilities |
134,017 | 133,640 | ||||||
| Long-term debt, net, less current portion |
377,882 | 491,518 | ||||||
| Deemed landlord liability, less current portion |
30,273 | 31,852 | ||||||
| Deferred income tax liability |
21,104 | 33,768 | ||||||
| Other long-term liabilities |
7,291 | 4,164 | ||||||
|
|
|
|
|
|||||
| Total liabilities |
570,567 | 694,942 | ||||||
| Commitments and contingencies (see Note 9) |
||||||||
| Shareholders’ equity: |
||||||||
| Successor common stock—$0.01 par value; 60,000,000 shares authorized; 32,624,461 and 31,286,989 shares issued and outstanding at December 31, 2015 and 2014, respectively |
326 | 313 | ||||||
| Additional paid-in capital |
438,716 | 417,553 | ||||||
| Accumulated deficit |
(23,009 | ) | (14,336 | ) | ||||
| Accumulated other comprehensive loss |
(2,559 | ) | (1,560 | ) | ||||
|
|
|
|
|
|||||
| Total shareholders’ equity |
413,474 | 401,970 | ||||||
|
|
|
|
|
|||||
| Total liabilities and shareholders’ equity |
$ | 984,041 | $ | 1,096,912 | ||||
|
|
|
|
|
|||||
See notes to consolidated financial statements.
F-3
Table of Contents
MEDPACE HOLDINGS, INC. AND SUBSIDIARIES
CONSOLIDATED STATEMENTS OF OPERATIONS
(Amounts in thousands except share and per share amounts)
| SUCCESSOR | PREDECESSOR | |||||||||||||||
| YEAR ENDED DECEMBER 31, 2015 |
PERIOD FROM APRIL 1, 2014 THROUGH DECEMBER 31, 2014 |
PERIOD FROM JANUARY 1, 2014 THROUGH MARCH 31, 2014 |
YEAR ENDED DECEMBER 31, 2013 |
|||||||||||||
| Service revenue, net (includes $24.0 million, $11.8 million, $2.0 million and $3.3 million with related parties for the Successor year ended December 31, 2015 and Period ended December 31, 2014, and the Predecessor Period ended March 31, 2014 and year ended December 31, 2013, respectively) |
$ | 320,101 | $ | 219,791 | $ | 70,250 | $ | 244,270 | ||||||||
| Reimbursed out-of-pocket revenue (includes $6.9 million, $2.0 million, $0.1 million and $0.1 million with related parties for the Successor year ended December 31, 2015 and Period ended December 31, 2014, and the Predecessor Period ended March 31, 2014 and year ended December 31, 2013, respectively) |
38,958 | 28,708 | 7,679 | 28,620 | ||||||||||||
|
|
|
|
|
|
|
|
|
|||||||||
| Total revenue |
359,059 | 248,499 | 77,929 | 272,890 | ||||||||||||
| Operating Expenses: |
||||||||||||||||
| Direct costs, excluding depreciation and amortization |
163,707 | 117,550 | 38,759 | 119,779 | ||||||||||||
| Reimbursed out-of-pocket expenses (includes $6.9 million, $2.0 million, $0.1 million and $0.1 million with related parties for the Successor year ended December 31, 2015 and Period ended December 31, 2014, and the Predecessor Period ended March 31, 2014 and year ended December 31, 2013, respectively) |
38,958 | 28,708 | 7,679 | 28,620 | ||||||||||||
| Selling, general and administrative |
56,998 | 29,465 | 10,203 | 35,109 | ||||||||||||
| Acquisition and integration |
— | 9,297 | 12,420 | — | ||||||||||||
| Impairment of goodwill |
9,313 | — | — | — | ||||||||||||
| Depreciation |
6,379 | 4,610 | 1,832 | 6,665 | ||||||||||||
| Amortization |
63,142 | 56,422 | 5,199 | 23,854 | ||||||||||||
|
|
|
|
|
|
|
|
|
|||||||||
| Total operating expenses |
338,497 | 246,052 | 76,092 | 214,027 | ||||||||||||
|
|
|
|
|
|
|
|
|
|||||||||
| Income from operations |
20,562 | 2,447 | 1,837 | 58,863 | ||||||||||||
| Other (expense) income, net: |
||||||||||||||||
| Miscellaneous (expense) income, net |
(1,133 | ) | (301 | ) | 1,213 | (1,718 | ) | |||||||||
| Interest expense, net |
(27,259 | ) | (23,185 | ) | (3,272 | ) | (18,000 | ) | ||||||||
|
|
|
|
|
|
|
|
|
|||||||||
| Total other expense, net |
(28,392 | ) | (23,486 | ) | (2,059 | ) | (19,718 | ) | ||||||||
|
|
|
|
|
|
|
|
|
|||||||||
| (Loss) income before income taxes |
(7,830 | ) | (21,039 | ) | (222 | ) | 39,145 | |||||||||
| Income tax provision (benefit) |
843 | (6,703 | ) | 1,014 | 14,301 | |||||||||||
|
|
|
|
|
|
|
|
|
|||||||||
| Net (loss) income |
$ | (8,673 | ) | $ | (14,336 | ) | $ | (1,236 | ) | $ | 24,844 | |||||
|
|
|
|
|
|
|
|
|
|||||||||
| Net (loss) income per share attributable to common shareholders: |
||||||||||||||||
| Basic |
$ | (0.28 | ) | $ | (0.46 | ) | $ | (0.05 | ) | $ | 0.99 | |||||
| Diluted |
$ | (0.28 | ) | $ | (0.46 | ) | $ | (0.05 | ) | $ | 0.95 | |||||
| Weighted average common shares outstanding: |
||||||||||||||||
| Basic |
31,346,019 | 30,869,244 | 25,047,188 | 25,204,079 | ||||||||||||
| Diluted |
31,346,019 | 30,869,244 | 25,047,188 | 26,150,149 | ||||||||||||
See notes to consolidated financial statements.
F-4
Table of Contents
MEDPACE HOLDINGS, INC. AND SUBSIDIARIES
CONSOLIDATED STATEMENTS OF COMPREHENSIVE (LOSS) INCOME
(Amounts in thousands)
| SUCCESSOR | PREDECESSOR | |||||||||||||||
| YEAR ENDED DECEMBER 31, 2015 |
PERIOD FROM APRIL 1, 2014 THROUGH DECEMBER 31, 2014 |
PERIOD FROM JANUARY 1, 2014 THROUGH MARCH 31, 2014 |
YEAR ENDED DECEMBER 31, 2013 |
|||||||||||||
| Net (loss) income |
$ | (8,673 | ) | $ | (14,336 | ) | $ | (1,236 | ) | $ | 24,844 | |||||
| Other comprehensive loss: |
||||||||||||||||
| Foreign currency translation adjustments, net of taxes |
(999 | ) | (1,560 | ) | (11 | ) | (32 | ) | ||||||||
|
|
|
|
|
|
|
|
|
|||||||||
| Comprehensive (loss) income |
$ | (9,672 | ) | $ | (15,896 | ) | $ | (1,247 | ) | $ | 24,812 | |||||
|
|
|
|
|
|
|
|
|
|||||||||
See notes to consolidated financial statements.
F-5
Table of Contents
MEDPACE HOLDINGS, INC. AND SUBSIDIARIES
CONSOLIDATED STATEMENTS OF SHAREHOLDERS’ EQUITY
(Amounts in thousands)
| COMMON STOCK |
ADDITIONAL PAID-IN CAPITAL |
(ACCUMULATED DEFICIT) RETAINED EARNINGS |
ACCUMULATED OTHER COMPREHENSIVE INCOME (LOSS) |
TOTAL | ||||||||||||||||
| BALANCE—January 1, 2013—Predecessor |
$ | 25 | $ | 250,843 | $ | (28,721 | ) | $ | (1,331 | ) | $ | 220,816 | ||||||||
| Net income |
24,844 | 24,844 | ||||||||||||||||||
| Foreign currency translation |
(32 | ) | (32 | ) | ||||||||||||||||
| Stock issued |
1,177 | 1,177 | ||||||||||||||||||
| Stock options exercised |
452 | 452 | ||||||||||||||||||
| Stock-based compensation expense |
1,958 | 1,958 | ||||||||||||||||||
| Excess tax benefit from stock-based compensation |
16 | 16 | ||||||||||||||||||
|
|
|
|
|
|
|
|
|
|
|
|||||||||||
| BALANCE—December 31, 2013—Predecessor |
$ | 25 | $ | 254,446 | $ | (3,877 | ) | $ | (1,363 | ) | $ | 249,231 | ||||||||
| Net loss |
(1,236 | ) | (1,236 | ) | ||||||||||||||||
| Foreign currency translation |
(11 | ) | (11 | ) | ||||||||||||||||
| Stock options exercised |
2 | 15,219 | 15,221 | |||||||||||||||||
| Stock-based compensation expense |
7,340 | 7,340 | ||||||||||||||||||
| Excess tax benefit from stock-based compensation |
5,270 | 5,270 | ||||||||||||||||||
|
|
|
|
|
|
|
|
|
|
|
|||||||||||
| BALANCE—March 31, 2014—Predecessor |
$ | 27 | $ | 282,275 | $ | (5,113 | ) | $ | (1,374 | ) | $ | 275,815 | ||||||||
| Close Predecessor shareholders’ equity at the acquisition date |
(27 | ) | (282,275 | ) | 5,113 | 1,374 | (275,815 | ) | ||||||||||||
| Stock issued |
307 | 413,693 | 414,000 | |||||||||||||||||
|
|
|
|
|
|
|
|
|
|
|
|||||||||||
| BALANCE—April 1, 2014—Successor |
$ | 307 | $ | 413,693 | $ | — | $ | — | $ | 414,000 | ||||||||||
| Net loss |
(14,336 | ) | (14,336 | ) | ||||||||||||||||
| Foreign currency translation |
(1,560 | ) | (1,560 | ) | ||||||||||||||||
| Stock-based compensation expense |
6 | 3,051 | 3,057 | |||||||||||||||||
| Excess tax benefit from stock-based compensation |
809 | 809 | ||||||||||||||||||
|
|
|
|
|
|
|
|
|
|
|
|||||||||||
| BALANCE—December 31, 2014—Successor |
$ | 313 | $ | 417,553 | $ | (14,336 | ) | $ | (1,560 | ) | $ | 401,970 | ||||||||
| Net loss |
(8,673 | ) | (8,673 | ) | ||||||||||||||||
| Stock issued |
1 | 607 | 608 | |||||||||||||||||
| Foreign currency translation |
(999 | ) | (999 | ) | ||||||||||||||||
| Stock-based compensation expense |
12 | 21,115 | 21,127 | |||||||||||||||||
| Stock options exercised |
250 | 250 | ||||||||||||||||||
| Tax benefit deficiency from stock-based compensation |
(809 | ) | (809 | ) | ||||||||||||||||
|
|
|
|
|
|
|
|
|
|
|
|||||||||||
| BALANCE—December 31, 2015—Successor |
$ | 326 | $ | 438,716 | $ | (23,009 | ) | $ | (2,559 | ) | $ | 413,474 | ||||||||
|
|
|
|
|
|
|
|
|
|
|
|||||||||||
See notes to consolidated financial statements.
F-6
Table of Contents
MEDPACE HOLDINGS, INC. AND SUBSIDIARIES
CONSOLIDATED STATEMENTS OF CASH FLOWS
(Amounts in thousands)
| SUCCESSOR | PREDECESSOR | |||||||||||||||
| YEAR ENDED DECEMBER 31, 2015 |
PERIOD FROM APRIL 1, 2014 THROUGH DECEMBER 31, 2014 |
PERIOD FROM JANUARY 1, 2014 THROUGH MARCH 31, 2014 |
YEAR ENDED DECEMBER 31, 2013 |
|||||||||||||
| CASH FLOWS FROM OPERATING ACTIVITIES: |
||||||||||||||||
| Net (loss) income |
$ | (8,673 | ) | $ | (14,336 | ) | $ | (1,236 | ) | $ | 24,844 | |||||
| Adjustments to reconcile net (loss) income to net cash provided by operating activities: |
||||||||||||||||
| Depreciation |
6,379 | 4,610 | 1,832 | 6,665 | ||||||||||||
| Amortization |
63,142 | 56,422 | 5,199 | 23,854 | ||||||||||||
| Stock-based compensation expense |
22,324 | 5,423 | 7,340 | 1,958 | ||||||||||||
| Amortization of debt issuance costs and discount |
2,687 | 2,064 | 371 | 1,918 | ||||||||||||
| Loss on extinguishment of debt |
— | — | — | 1,523 | ||||||||||||
| Deferred income tax (benefit) provision |
(12,690 | ) | (9,557 | ) | 300 | 5,982 | ||||||||||
| Impairment of goodwill |
9,313 | — | — | — | ||||||||||||
| Loss on the sale of cost method investment |
— | — | — | 2,250 | ||||||||||||
| Other |
(242 | ) | (225 | ) | (721 | ) | 209 | |||||||||
| Changes in assets and liabilities: |
||||||||||||||||
| Restricted cash |
(1,753 | ) | 544 | (400 | ) | 438 | ||||||||||
| Accounts receivable, net and unbilled services |
337 | (1,103 | ) | (10,543 | ) | 1,604 | ||||||||||
| Prepaid expenses and other current assets |
(181 | ) | (846 | ) | (4,617 | ) | 4,760 | |||||||||
| Accounts payable |
2,481 | 558 | 13,708 | 628 | ||||||||||||
| Accrued expenses |
320 | 10,987 | (4,957 | ) | 8,335 | |||||||||||
| Pre-funded study costs |
9,981 | 299 | 1,561 | 1,691 | ||||||||||||
| Advanced billings |
(7,002 | ) | 5,995 | 6,330 | 10,651 | |||||||||||
| Other assets and liabilities, net |
(2,306 | ) | 1,704 | (1,360 | ) | 832 | ||||||||||
|
|
|
|
|
|
|
|
|
|||||||||
| Net cash provided by operating activities |
84,117 | 62,539 | 12,807 | 98,142 | ||||||||||||
|
|
|
|
|
|
|
|
|
|||||||||
| CASH FLOWS FROM INVESTING ACTIVITIES: |
||||||||||||||||
| Property and equipment expenditures |
(6,465 | ) | (4,225 | ) | (1,090 | ) | (4,561 | ) | ||||||||
| Acquisition of Predecessor, net of cash received |
— | (903,453 | ) | — | — | |||||||||||
| Other |
33 | 38 | 263 | 89 | ||||||||||||
|
|
|
|
|
|
|
|
|
|||||||||
| Net cash used in investing activities |
(6,432 | ) | (907,640 | ) | (827 | ) | (4,472 | ) | ||||||||
|
|
|
|
|
|
|
|
|
|||||||||
| CASH FLOWS FROM FINANCING ACTIVITIES: |
||||||||||||||||
| Proceeds from sale of common stock |
608 | 414,000 | — | 1,177 | ||||||||||||
| Proceeds from stock option exercises |
250 | — | — | 452 | ||||||||||||
| Excess tax benefit from stock-based compensation |
— | 809 | 5,270 | 16 | ||||||||||||
| Proceeds from issuance of debt, net of original issue discount |
— | 527,350 | — | — | ||||||||||||
| Payment of debt |
(116,055 | ) | (25,217 | ) | (23,073 | ) | (96,431 | ) | ||||||||
| Proceeds from revolving loan |
— | 1,575 | — | — | ||||||||||||
| Payment of revolving loan |
— | (1,575 | ) | — | — | |||||||||||
| Debt issuance costs |
— | (15,487 | ) | — | (1,065 | ) | ||||||||||
| Payment of deemed landlord liability |
(1,292 | ) | (1,284 | ) | (165 | ) | — | |||||||||
|
|
|
|
|
|
|
|
|
|||||||||
| Net cash (used in) provided by financing activities |
(116,489 | ) | 900,171 | (17,968 | ) | (95,851 | ) | |||||||||
|
|
|
|
|
|
|
|
|
|||||||||
| EFFECTS OF EXCHANGE RATES ON CASH AND CASH EQUIVALENTS |
(601 | ) | (785 | ) | (25 | ) | 159 | |||||||||
| (DECREASE) INCREASE IN CASH AND CASH EQUIVALENTS |
(39,405 | ) | 54,285 | (6,013 | ) | (2,022 | ) | |||||||||
| CASH AND CASH EQUIVALENTS—Beginning of period |
54,285 | — | 23,858 | 25,880 | ||||||||||||
|
|
|
|
|
|
|
|
|
|||||||||
| CASH AND CASH EQUIVALENTS—End of period |
$ | 14,880 | $ | 54,285 | $ | 17,845 | $ | 23,858 | ||||||||
|
|
|
|
|
|
|
|
|
|||||||||
| SUPPLEMENTAL DISCLOSURE OF CASH FLOW INFORMATION— |
||||||||||||||||
| Cash paid during the period for income taxes |
$ | 10,552 | $ | 4,513 | $ | 125 | $ | 5,784 | ||||||||
|
|
|
|
|
|
|
|
|
|||||||||
| Cash paid during the period for interest |
$ | 24,435 | $ | 21,060 | $ | 2,961 | $ | 16,223 | ||||||||
|
|
|
|
|
|
|
|
|
|||||||||
| Acquisition of property and equipment—non-cash |
$ | 176 | $ | 153 | $ | 312 | $ | 376 | ||||||||
|
|
|
|
|
|
|
|
|
|||||||||
See notes to consolidated financial statements.
F-7
Table of Contents
MEDPACE HOLDINGS, INC. AND SUBSIDIARIES
NOTES TO CONSOLIDATED FINANCIAL STATEMENTS
As of December 31, 2015 and 2014, and for the Year Ended December 31, 2015, the Periods April 1, 2014 through December 31, 2014 and January 1, 2014 through March 31, 2014, and the Year Ended December 31, 2013.
1. DESCRIPTION OF BUSINESS
Medpace Holdings, Inc. together with its subsidiaries, (the “Company” or “Medpace”), a Delaware Corporation, is a global provider of clinical research-based drug and medical device development services. The Company partners with pharmaceutical, biotechnology, and medical device companies in the development and execution of clinical trials. The Company’s drug development services focus on full service Phase I-IV clinical development services and include development plan design, central laboratory, project management, regulatory affairs, clinical monitoring, data management and analysis, pharmacovigilance new drug application submissions, and post-marketing clinical support. The Company also provides coordinated central laboratory services, bio-analytical laboratory services, clinical human pharmacology, imaging services, and electrocardiography reading support for clinical trials.
The Company’s operations are principally based in North America, Europe, and Asia.
2. CHANGE IN CONTROL
In February 2014, investment funds managed by Cinven Capital Management (V) General Partner Limited (“Cinven”), a private equity firm, incorporated Scioto Holdings, Inc. in the first of multiple steps that would result in a change of control for the Company. Pursuant to the terms and conditions of the Agreement and Plan of Merger (the “Merger Agreement”) dated February 22, 2014, Scioto Holdings, Inc. (the “Successor”), through its wholly owned subsidiary Scioto Acquisition, Inc. (the “Purchaser”) and the Purchaser’s wholly owned subsidiary Scioto Merger Sub, Inc. (the “Merger Sub”), purchased 100% of the outstanding shares of Medpace Holdings, Inc. (“Predecessor”) for an aggregate purchase price of $921.3 million on April 1, 2014 (the “Transaction”). Per the terms of a Contribution and Subscription Agreement, Medpace Investors, LLC (“Medpace Investors” or “MPI”), owned by certain employees of the Company, agreed to contribute shares held in the Predecessor in exchange for a percentage stake in the Successor. The Transaction was financed through the sale of the Successor’s equity and debt financing under a new credit facility entered into by Merger Sub as the initial borrower. Upon Transaction consummation, Merger Sub ceased to exist and Medpace Holdings, Inc. became the borrower under the credit facility. The proceeds from the transaction were used to purchase Predecessor’s equity interests, extinguish debt which had immediately come due as a result of the change in control, and pay Predecessor’s acquisition-related selling expenses. The Predecessor’s acquisition-related selling expenses of $12.4 million, including $10.1 million related to success based advisory fees, are reflected in the Acquisition and integration expense line in the consolidated statement of operations for the Predecessor January 1 through March 31, 2014 period. The Successor’s acquisition-related buying expenses of $9.3 million, including $3.3 million related to success based advisory fees, are reflected in the Acquisition and integration expense line in the consolidated statement of operations for the Successor April 1, 2014 through December 31, 2014 period.
Prior to the Transaction, CCMP Capital (“CCMP”), a private equity firm, held 80% of the Predecessor’s equity interests and the noncontrolling interests were held by certain current and former members of management, along with former members of the Board of Directors of Medpace, Inc., a wholly owned subsidiary of Medpace Holdings, Inc.
F-8
Table of Contents
The sources and uses of the purchase price consideration were as follows (in thousands):
| Sources of cash consideration: |
||||
| Sale of Successor common Stock |
$ | 414,000 | ||
| Long-term debt issuance |
530,000 | |||
| Revolving loan |
1,575 | |||
| Original issue discount |
(2,650 | ) | ||
| Loan origination fees |
(15,487 | ) | ||
|
|
|
|||
| Debt proceeds, net |
513,438 | |||
|
|
|
|||
| Total sources of consideration paid |
$ | 927,438 | ||
|
|
|
|||
| Uses of cash consideration: |
||||
| Purchase of Predecessor common stock |
$ | 780,829 | ||
| Proceeds from stock option exercise |
(15,221 | ) | ||
| Payment of Predecessor debt |
143,728 | |||
| Payment of Predecessor’s selling expenses |
11,962 | |||
|
|
|
|||
| Total uses of consideration paid |
$ | 921,298 | ||
|
|
|
The excess cash generated from the transaction of $6.1 million is not considered purchase price consideration as the funds were used to pay a portion of the Successor’s acquisition related expenses. The Successor’s acquisition related expenses are reflected in the Acquisition and integration expense line in the consolidated statements of operations for the period ended December 31, 2014.
In May 2014, Scioto Holdings, Inc. was renamed Medpace Holdings, Inc. (“Successor”). Furthermore, the Predecessor Medpace Holdings, Inc. was merged with another wholly owned subsidiary and renamed Medpace IntermediateCo, Inc. For the avoidance of doubt and for purposes of these consolidated financial statements, Successor refers to the consolidated Medpace Holdings reporting entity after the Transaction and Predecessor refers to the consolidated Medpace Holdings reporting entity prior to the Transaction.
Immediately following the Transaction, Cinven and Medpace Investors owned approximately 75% and 25%, respectively, of the Successor entity.
F-9
Table of Contents
The following table reconciles the fair value of the assets acquired and liabilities assumed to the total purchase price (in thousands):
| Assets acquired: |
||||
| Cash and cash equivalents |
$ | 17,845 | ||
| Restricted cash |
1,648 | |||
| Accounts receivable |
39,311 | |||
| Unbilled services |
13,065 | |||
| Reimbursable pass-through expenses |
12,184 | |||
| Prepaid expenses and other current assets |
12,205 | |||
| Property and equipment |
39,661 | |||
| Goodwill |
670,294 | |||
| Intangible assets |
306,307 | |||
| Deferred income taxes |
26,246 | |||
| Other assets |
3,237 | |||
|
|
|
|||
| Total assets acquired |
1,142,003 | |||
| Liabilities assumed: |
||||
| Accounts payable and accrued expenses |
16,608 | |||
| Pre-funded study costs |
36,483 | |||
| Advanced billings |
52,475 | |||
| Deemed landlord liability |
34,251 | |||
| Debt |
1,551 | |||
| Deferred income taxes |
69,448 | |||
| Other liabilities |
9,889 | |||
|
|
|
|||
| Total liabilities assumed |
220,705 | |||
|
|
|
|||
| Net assets acquired |
$ | 921,298 | ||
|
|
|
The Company accounts for acquisitions using the acquisition method of accounting. The Successor consolidated financial statements reflect the final allocation of the aggregate purchase price of $921.3 million to the assets acquired and liabilities assumed based on fair values at the date of the Transaction. The fair values assigned to identifiable intangible assets acquired were determined primarily by using an income approach which was based on assumptions and estimates made by management. Significant assumptions utilized in the income approach were based on company-specific information and projections, which are not observable in the market and are thus considered Level 3 measurements by authoritative guidance. The excess of the purchase price over the fair value of the assets acquired and liabilities assumed has been recorded as goodwill and represents the estimated future economic benefits arising from other assets acquired that could not be individually identified and separately recognized such as assembled workforce and growth opportunities.
The Merger Agreement includes certain indemnifications between the sellers (led by CCMP) and the buyers (led by Cinven) with regards to Predecessor contingencies that arise after the Transaction and through April 1, 2015, as well as tax payments or refunds that are finalized after April 1, 2014 but which relate to periods prior to the Transaction. The Successor had $0.3 and $0.9 million in Prepaid expenses and other current assets and $0.5 and $0.8 million in Other assets on the consolidated balance sheets at December 31, 2015 and 2014, respectively, associated with refunds due from various taxing authorities that were generated in a Predecessor period. The Successor had $1.4 and $5.2 million in Other current liabilities and $0.5 and $0.9 million in Other long-term liabilities on the consolidated balance sheets at December 31, 2015 and 2014, associated with the anticipated settlement of these items, net of consulting fees and related tax, and other tax refunds received by the Successor Company prior to December 31, 2015 and 2014, respectively.
Immediately prior to the Transaction, the Predecessor Company’s Board of Directors approved a plan to accelerate the vesting on unvested stock options and restricted share awards.
F-10
Table of Contents
3. SUMMARY OF SIGNIFICANT ACCOUNTING POLICIES
Principles of Consolidation and Presentation
The accompanying consolidated financial statements have been prepared in accordance with generally accepted accounting principles in the United States of America (“US GAAP”) and include the accounts and operations of the Company and its subsidiaries. All intercompany accounts and transactions have been eliminated in consolidation.
The Company’s consolidated balance sheets as of December 31, 2015 and 2014 and its related statements of operations, comprehensive (loss) income, shareholders’ equity, and cash flows presented subsequent to the Transaction for the year ended December 31, 2015 and the period from April 1 through December 31, 2014 are referenced herein as the successor financial statements (the “Successor” or “Successor Financial Statements”). The period April 1 through December 31, 2014 is referenced herein as the “Successor Period ended December 31, 2014.” The Company’s consolidated statements of operations, comprehensive (loss) income, shareholders’ equity and cash flows for the period from January 1 through March 31, 2014 and the year ended December 31, 2013 are referenced herein as the predecessor financial statements (the “Predecessor” or “Predecessor Financial Statements”). The January 1 through March 31, 2014 period is referenced herein as the “Predecessor Period ended March 31, 2014.”
Reclassifications
The Company reclassified certain expenses from Miscellaneous (expense) income, net to Selling, general and administrative in the consolidated statements of operations to more appropriately reflect the nature of the expense items in the Successor Period ended December 31, 2014, the Predecessor period ended March 31, 2014 and the Predecessor year ended December 31, 2013, respectively. These changes have no impact on previously reported total revenue, net (loss) income, total comprehensive (loss) income, total assets, total liabilities, and shareholders’ equity.
Use of Estimates
The preparation of financial statements in conformity with US GAAP requires management to make estimates and assumptions that affect the amounts reported in the consolidated financial statements and accompanying notes. Actual results could differ from these estimates.
Significant items that are subject to management estimates and assumptions include service revenue, net, allowances for doubtful accounts, acquisition purchase price allocations, long-lived asset impairment and useful lives, exit liabilities, the valuation of share-based compensation, uncertain income tax positions and contingencies.
Stock Split
On July 25, 2016, the Board of Directors of the Company approved, and made legally effective, a 1-for-1.35 reverse stock split of the Company’s common stock. All share, stock option and per share information presented in the Successor consolidated financial statements have been adjusted to reflect the reverse stock split on a retroactive basis for all periods presented. The Company will make a cash payment to shareholders for all fractional shares which would have otherwise been required to be issued as a result of the reverse stock split. There was no change in number of authorized shares or the par value of the Company’s common stock.
Reportable Segments
The Company emphasizes its full service outsourcing model, providing services focused on the development, management and execution of clinical trials. As part of this full service approach, the Company utilizes centralized systems, customer interface technology, support functions and processes that cross service offerings and align resources to deliver efficient clinical trial services. Given the full service approach, the chief executive officer, who is the chief operating decision maker (“CODM”) assesses the allocation of resources based on key metrics including revenue, backlog, and net awards by service offering and consolidated profitability and consolidated cash flows. Based on the Company’s full service model, internal management and reporting structure, and key metrics used by the CODM to make resource allocation decisions, management has determined that the Company’s operations consist of a single operating segment. Therefore, results of operations are presented as a single reportable segment.
Foreign Currencies
Assets and liabilities recorded in foreign currencies on foreign subsidiary financial statements are translated at the exchange rate on the balance sheet date, while equity accounts are translated at historical exchange rates. Revenue
F-11
Table of Contents
and expenses are recorded at average rates of exchange during the year. Translation adjustments are recorded to Accumulated other comprehensive loss in the consolidated statements of shareholders’ equity and consolidated statements of comprehensive (loss) income.
Separately, net realized gains and losses on foreign currency transactions are included in Miscellaneous (expense) income, net, on the consolidated statements of operations. Foreign currency transactions resulted in net losses of $1.3 million, $1.2 million, $0.1 million and $0.3 million during the Successor year ended December 31, 2015, the Successor Period ended December 31, 2014, the Predecessor Period ended March 31, 2014 and the Predecessor year ended December 31, 2013, respectively.
Revenue Recognition
The Company generally enters into contracts with customers to provide services ranging in duration from a few months to several years. The contract terms generally provide for payments based on a fixed fee or unit-of-service arrangement. Revenue on these arrangements is recognized when there is persuasive evidence of an arrangement, the service offering has been delivered to the customer, the arrangement consideration is determinable and the collection of the fees is reasonably assured.
The Company recognizes revenue for services provided on fixed fee arrangements based on the proportional performance methodology, which is determined by assessing the proportion of performance completed or delivered to date compared to total specific measures to be delivered or completed under the terms of the arrangement. The measures utilized to assess performance are specific to the service provided, and the Company generally compares the ratio of hours completed to the total estimated hours necessary to complete the contract. A detailed project budget by hours is developed based on many factors, including but not limited to the scope of the work, the complexity of the study, the participating geographic locations, and the Company’s historical experience. Management believes the reporting and estimation of hours is the best available measure of progress on many of the services provided and best reflects the pattern in which obligations to customers are fulfilled. To assist with the estimation of hours expected to complete a project, regular contract reviews for each project are performed in which performance to date is compared to the most current estimate to complete assumptions. The reviews include an assessment of effort incurred to date compared to expectations based on budget assumptions and other circumstances specific to the project. The total estimated hours necessary to complete a fixed-fee contract, based on these reviews, are updated and any revisions to the existing hours budget result in cumulative adjustments to the amount of revenue recognized in the period in which the revisions are identified.
Fixed-fee contracts provide for pricing modifications upon scope of work changes. The Company recognizes revenue related to work performed in connection with scope changes when the underlying services are performed, a binding contractual commitment has been executed with the customer and collectability is reasonably assured. Costs are not deferred in anticipation of contracts being awarded or amendments being finalized, but are expensed as incurred.
For unit-of-service arrangements, the Company recognizes revenue in the period in which the unit is delivered. Service unit elements largely consist of various project management, consulting and analytical testing services.
Many contractual arrangements combine multiple service elements. For these contracts, arrangement consideration is allocated to identified units of account based on the relative selling price of each unit of account. The best evidence of selling price of a unit of account is vendor specific objective evidence (“VSOE”), which is the price charged when the deliverable is sold separately. When VSOE is not available to determine selling price, management uses relative third party evidence, if available. When neither VSOE nor third party evidence of selling price exists, management uses its best estimate of selling price considering all relevant information that is available.
Most contracts are terminable by the customer, either immediately or according to advance notice terms specified within the contracts. These contracts require payment of fees to the Company for services rendered through the date of termination and may require payment for subsequent services necessary to conclude the study or close out the contract. Final settlement amounts are typically subject to negotiation with the customer. These amounts are included in Service revenue, net when realization is reasonably assured.
The Company occasionally enters into volume rebate arrangements with customers that provide for rebates if certain specified spending thresholds are met. These rebate obligations are recorded as a reduction of revenue when it
F-12
Table of Contents
appears probable that the customer will earn the rebates and the related amount is estimable. Service revenue is presented net of rebates of $0.1 million, $0.4 million, $0.1 million and $0.7 million in the consolidated statements of operations during the Successor year ended December 31, 2015, the Successor Period ended December 31, 2014, the Predecessor Period ended March 31, 2014 and the Predecessor year ended December 31, 2013.
The Company records revenue net of any tax assessments by governmental authorities that are imposed and concurrent with specific revenue generating transactions.
Concentration of Credit Risk
Financial instruments that subject the Company to credit risk primarily consist of cash and cash equivalents and accounts receivable. The cash and cash equivalent balances are held and maintained with financial institutions with reputable credit ratings and, consequently, the Company believes that such funds are subject to minimal credit risk.
The Company generally does not require collateral or other securities to support customer receivables. In the Successor year ended December 31, 2015, the Successor Period ended December 31, 2014, the Predecessor Period ended March 31, 2014 and the Predecessor year ended December 31, 2013, credit losses have been immaterial and within management’s expectations. At December 31, 2015 and 2014, there were no customers accounting for more than 10% of the Company’s accounts receivable.
Costs and Expenses
Direct costs, excluding depreciation and amortization, include direct labor and related employee benefits, laboratory supplies, and other expenses contributing to service delivery. Direct costs, excluding depreciation and amortization, are expensed as incurred and are not deferred in anticipation of contracts being awarded or finalization of changes in scope. Selling, general and administrative includes administrative payroll and related employee benefits, sales and marketing expenses, administrative travel, and other expenses not directly related to service delivery. Rent, utilities, supplies, and software license expenses are allocated between Direct costs, excluding depreciation and amortization, and Selling, general and administrative based on the estimated contribution among service delivery and support function efforts on a percentage basis. Depreciation and amortization is reported separately in the accompanying consolidated statements of operations. Costs of sales and marketing activities not subject to recovery pursuant to customer contracts, such as feasibility assessments and negotiation of contracts, are expensed as incurred and recorded as a component of Selling, general and administrative in the accompanying consolidated statements of operations.
Advertising expenses are recorded as a component of Selling, general and administrative in the accompanying consolidated statements of operations. Total advertising expenses of $0.4 million, $0.2 million, $0.1 million, and $0.3 million were incurred during the Successor year ended December 31, 2015, the Successor Period ended December 31, 2014, the Predecessor Period ended March 31, 2014, and the Predecessor year ended December 31, 2013, respectively.
Reimbursed Out-of-Pocket Expenses
The Company incurs on behalf of its clients various out-of-pocket expenditures including, but not limited to, travel, meetings, printing, and shipping and handling fees, which are reflected as a separate component of operating expenses and recorded in Reimbursed out-of-pocket expenses in the accompanying consolidated statements of operations. Reimbursements received are reflected in Reimbursed out-of-pocket revenue without mark-up or profit in the consolidated statements of operations.
Fees paid to investigators and other disbursements in which the Company acts as an agent on behalf of the client are recorded net in the consolidated statements of operations with no impact on the Company’s revenue or expenses. Funds received in advance of study expenditures are recorded as Pre-funded study cost liabilities on the consolidated balance sheets. Any pre-funded amounts remaining at the conclusion of a study are returned to the client. Pre-funded study cost disbursements of $114.4 million, $92.5 million, $30.9 million, and $104.6 million were made during the Successor year ended December 31, 2015, the Successor Period ended December 31, 2014, the Predecessor Period ended March 31, 2014, and the Predecessor year ended December 31, 2013, respectively.
Income Taxes
The Company’s consolidated U.S. federal income tax return is comprised of its U.S. subsidiaries and a small number of its foreign subsidiaries. All foreign subsidiaries of the Company file tax returns in their local jurisdictions.
F-13
Table of Contents
The Company provides for income taxes on all transactions that have been recognized in the consolidated financial statements in accordance with accounting guidance governing income tax accounting. Accordingly, the impact of changes in income tax laws on deferred tax assets and deferred tax liabilities are recognized in net earnings in the period during which such changes are enacted.
The Company records deferred tax assets and liabilities based on temporary differences between the financial statement bases and tax bases of assets and liabilities. Deferred tax assets are recorded for tax benefit carryforwards using tax rates anticipated to be in effect in the year in which the temporary differences are expected to reverse. If it does not appear more likely than not that the full value of a deferred tax asset will be realized, the Company records a valuation allowance against the deferred tax asset, with an offsetting charge to the Company’s income tax provision or benefit. The value of the Company’s deferred tax assets is estimated based on, among other things, the Company’s ability to generate a sufficient level of future taxable income. In estimating future taxable income, the Company has considered both positive and negative evidence, such as historical and forecasted results of operations, and has considered the implementation of prudent and feasible tax planning strategies.
A provision has not been made for U.S. or additional foreign taxes on the undistributed portion of earnings of foreign subsidiaries as those earnings of $10.4 million as of December 31, 2015, have been permanently reinvested.
The Company follows accounting guidance related to accounting for uncertainty in income taxes which requires significant judgment in determining what constitutes an individual tax position as well as assessing the possible outcome of each tax position. Changes in judgments as to recognition or measurement of tax positions can materially affect the estimate of the effective tax rate, and, consequently, the Company’s consolidated financial results. The Company considers many factors when evaluating and estimating tax positions and tax benefits, which may require periodic adjustments and which may not accurately anticipate actual outcomes. In addition, the calculation of tax liabilities involves dealing with uncertainties in the application of complex tax regulations in a multitude of jurisdictions. The Company determines its liability for uncertain tax positions globally. If the payment of these amounts ultimately proves to be unnecessary, the reversal of liabilities would result in tax benefits being recognized in the period when it is determined the liabilities are no longer necessary. If the calculation of the liability related to uncertain tax positions proves to be more or less than the ultimate assessment, a tax expense or tax benefit would result. Interest and penalties associated with uncertain tax positions are recognized as components of the Company’s Income tax provision (benefit).
Research and Development Credits
Research and development credits are available to the Company under tax laws in certain jurisdictions, based on qualifying research and development spend as defined under those tax laws. Certain tax jurisdictions provide refundable credits that are not wholly dependent on the Company’s income tax status or income tax position. In these circumstances the benefit of the credits is recorded as a reduction of operating expense. When they are wholly dependent upon the Company’s income tax position, research and development credits are recognized as a reduction of income tax expense.
Stock-Based Compensation
The Company has stock-based employee compensation plans for which it incurs compensation expense.
Successor Equity Awards
The Successor, coinciding with the Transaction, created an equity incentive plan for employees (the “Successor Plan”), providing for the future issuance of vested shares, stock options, restricted stock awards (“RSAs”) and restricted stock units (“RSUs”) in Medpace Holdings, Inc.’s common stock (the “Successor Awards”). The Successor Awards are subject to either equity or liability-classification pursuant to the terms of the participant’s award agreement and the Successor Plan based on accounting guidance which governs such transactions.
Stock-based compensation expense is calculated using the fair value method on the grant date. The Successor expenses stock-based compensation using a graded vesting schedule. For liability-classified awards, the Company records fair value adjustments up to and including the settlement date. Changes in the fair value of the stock compensation liability that occur during the requisite service period are recognized as compensation cost over the vesting period. Changes in the fair value of the stock compensation liability that occur after the end of the requisite service period but before settlement, are compensation cost of the period in which the change occurs.
F-14
Table of Contents
Stock-based compensation expense is allocated between Direct costs, excluding depreciation and amortization, and Selling, general and administrative in the consolidated statements of operations based on the underlying classification and scope of work for the employees receiving the Successor Awards. The stock-based compensation expense represents awards ultimately expected to vest and, as such, has been reduced for estimated forfeitures.
Predecessor Equity Awards
The Predecessor awards, consisting of stock options and restricted share awards, are equity-classified instruments based on the terms of the Predecessor’s equity incentive plans and on accounting guidance which governs such transactions.
The Predecessor determined the fair value of stock options and restricted shares on the grant date and recognized the associated compensation expense, net of assumed forfeitures, according to a graded vesting schedule as the requisite services were rendered. Restricted shares and stock options vested ratably over three and four years, respectively, from the date of grant.
Net Income (Loss) Per Share
Basic and diluted earnings or loss per share (“EPS”) are computed using the two-class method, which is an earnings allocation that determines EPS for each class of common stock and participating securities according to dividends declared and participation rights in undistributed earnings. The Successor Company’s RSAs are considered participating securities because they are legally issued at the date of grant and holders are entitled to receive non-forfeitable dividends during the vesting term. Basic EPS is computed by dividing the Company’s net income or loss available to common shareholders by the weighted average number of common shares outstanding and, if appropriate, participating securities outstanding during the period. Participating securities are included in the basic EPS denominator during periods when there is consolidated net income but excluded from the denominator during periods of a consolidated net loss as the shares have no contractual obligation to share in the Company’s losses. The computation of diluted EPS includes additional common shares, such as unvested RSUs and stock options with exercise prices less than the average market price of the Company’s common stock during the period (“in-the-money options”), which would be considered outstanding under the treasury stock method. The treasury stock method assumes that additional shares would have to be issued in cases where the exercise price of stock options is less than the value of the common stock being acquired because the cash proceeds received from the stock option holder would not be sufficient to acquire that same number of shares. The Company does not compute diluted EPS in cases where the inclusion of such additional shares would be anti-dilutive in effect.
F-15
Table of Contents
The following table provides a reconciliation of the denominators for the EPS calculations as well as additional share data that was excluded from the denominators when the additional shares had an anti-dilutive effect caused by the consolidated net loss during the Successor year ended December 31, 2015, the Successor Period ended December 31, 2014 and the Predecessor Period ended March 31, 2014 (in thousands):
| SUCCESSOR | PREDECESSOR | |||||||||||||||
| YEAR ENDED DECEMBER 31, 2015 |
PERIOD ENDED DECEMBER 31, 2014 |
PERIOD ENDED MARCH 31, 2014 |
YEAR ENDED DECEMBER 31, 2013 |
|||||||||||||
| Basic, weighted average shares: |
||||||||||||||||
| Common Shares |
31,346 | 30,869 | 25,047 | 24,987 | ||||||||||||
| RSAs |
— | — | — | 217 | ||||||||||||
|
|
|
|
|
|
|
|
|
|||||||||
| Weighted average shares—basic |
31,346 | 30,869 | 25,047 | 25,204 | ||||||||||||
|
|
|
|
|
|
|
|
|
|||||||||
| Diluted, weighted average shares: |
||||||||||||||||
| RSUs, unvested |
— | — | — | 55 | ||||||||||||
| In-the-money options |
— | — | — | 891 | ||||||||||||
|
|
|
|
|
|
|
|
|
|||||||||
| Weighted average shares—diluted |
31,346 | 30,869 | 25,047 | 26,150 | ||||||||||||
|
|
|
|
|
|
|
|
|
|||||||||
| Exclusions from EPS denominator: |
||||||||||||||||
| Exclusions from basic, weighted average shares: |
||||||||||||||||
| RSAs (no obligation to share in losses) |
574 | 250 | 237 | — | ||||||||||||
|
|
|
|
|
|
|
|
|
|||||||||
| Additional exclusions from diluted, weighted average shares: |
||||||||||||||||
| RSUs, unvested |
86 | 52 | — | — | ||||||||||||
|
|
|
|
|
|
|
|
|
|||||||||
| Total anti-dilutive shares |
86 | 52 | — | — | ||||||||||||
|
|
|
|
|
|
|
|
|
|||||||||
| Total shares excluded from diluted EPS denominator |
660 | 302 | 237 | — | ||||||||||||
|
|
|
|
|
|
|
|
|
|||||||||
For the Successor year ended December 31, 2015 and Successor Period ended December 31, 2014, the computation of diluted EPS also excludes the effect of 1,794,709 and 1,091,048 stock options, respectively, due to the Company’s net loss positions as well as the respective period’s average fair value of the Company’s common stock exceeded the exercise prices. During the Predecessor Period ended March 31, 2014, there are no additional dilutive shares as all stock options and restricted shares were vested, exercised, or terminated, as applicable, at period end.
Fair Value Measurements
The Company follows accounting guidance related to fair value measurements that defines fair value, establishes a framework for measuring fair value, and establishes a hierarchy for inputs used in measuring fair value. This hierarchy maximizes the use of “observable” inputs and minimizes the use of unobservable inputs by requiring that the most observable inputs be used when available. The hierarchy specifies three levels based on the inputs, as follows:
Level 1: Valuations based on quoted prices in active markets for identical assets or liabilities.
Level 2: Valuations based on directly observable inputs or unobservable inputs corroborated by market data.
Level 3: Valuations based on unobservable inputs supported by little or no market activity representing management’s determination of assumptions of how market participants would price the assets or liabilities.
The fair value of financial instruments such as cash and cash equivalents, billed accounts receivable, net, unbilled services, accounts payable, accrued expenses, and advanced billings approximate their carrying amounts due to their short term maturities.
F-16
Table of Contents
The Company does not have any recurring fair value measurements as of December 31, 2015. There were no transfers between Level 1, Level 2, or Level 3 during the Successor year ended December 31, 2015, the Successor Period ended December 31, 2014, the Predecessor Period ended March 31, 2014, or the Predecessor year ended 2013.
Non-Recurring Fair Value Measurements
Certain assets are measured on the accompanying consolidated balance sheets at cost and are not remeasured to fair value on a recurring basis. Total assets carried on the balance sheet and not remeasured to fair value on a recurring basis, identified as Level 3 measurements, as of December 31, 2015 are $693 million, comprised of $661 million of goodwill and $32 million of identified indefinite-lived intangible assets. During 2015, the Company recognized approximately $9.3 million of impairment related to goodwill.
Cash and Cash Equivalents, including Restricted Cash
Cash and cash equivalents, including restricted cash, are invested in demand deposits, all of which have an original maturity of three months or less. Restricted cash consists of customer funds received in advance and subject to specific restrictions, as well as amounts placed in escrow for contingent payments resulting from acquisitions or other contractual arrangements. The Company includes changes in restricted cash balances as part of operating activities in the consolidated statements of cash flows.
In addition, Prepaid expenses and other current assets and Other assets in the consolidated balance sheets include $0.7 million and $0.8 million of cash held as collateral in support of a property mortgage in Leuven, Belgium at December 31, 2015 and 2014, respectively. The property mortgage was fully repaid during 2015 and the Company received a full refund during the first quarter of 2016.
Accounts Receivable and Unbilled Services
Accounts receivable represent amounts due from the Company’s customers who are concentrated primarily in the pharmaceutical, biotechnology, and medical device industries. Unbilled services represent service revenue recognized to date that is currently not billable to the customer pursuant to contractual terms. In general, amounts become billable upon the achievement of negotiated contractual events or in accordance with predetermined payment schedules. Amounts classified to Unbilled services are those billable to customers within one year from the respective balance sheet date.
The Company grants credit terms to its customers prior to signing a service contract and monitors the creditworthiness of its customers on an ongoing basis. The Company maintains an allowance for doubtful accounts based on specific identification of accounts receivable that are at risk of not being collected. Uncollectible accounts receivable are written off only after all reasonable collection efforts have been exhausted. Moreover, in some cases the Company requires advance payment from its customers for a portion of the study contract price upon the signing of a service contract. These advance payments are deferred and recognized as revenue as services are performed.
Inventory
Inventory, which consists primarily of laboratory supplies, is valued at the lower of cost or market. Inventory is stated at purchased cost using the first-in, first out (FIFO) cost method. The inventory balance is included in Prepaid expenses and other current assets in the consolidated balance sheets.
Property and Equipment
Property and equipment is recorded at cost. Depreciation is provided on the straight-line method at rates adequate to allocate the cost of the applicable assets over their estimated useful lives, which is three to five years for computer hardware, software, phone, and medical imaging equipment, five to seven years for furniture and fixtures and other equipment, and thirty to forty years for buildings. The Company capitalizes costs of computer software developed for internal use and amortizes these costs on a straight-line basis over the estimated useful life, not to exceed three years. Leasehold improvements and deemed assets from landlord building construction are capitalized and amortized on a straight-line basis over the shorter of the estimated useful life of the improvement or the associated remaining lease term. Repairs and maintenance are expensed as incurred.
Leases
The Company leases facilities and equipment to be used in its operations, some of which require capitalization in accordance with US GAAP. Upon the execution of new leases, the Company determines the appropriate
F-17
Table of Contents
classification of the lease as operating or capital and reflects the impact of this classification in its consolidated financial statements.
Goodwill and Intangible Assets
Goodwill
Goodwill represents the excess of purchase price over the fair value of net assets acquired in business combinations. The carrying value of goodwill is reviewed at least annually for impairment, or as indicators of potential impairment are identified, at the reporting unit level. The reporting units are Phase II-IV clinical research services, Laboratories, and Clinics as of December 31, 2015.
The Company performs its annual impairment tests during the fourth quarter each year, utilizing the quantitative two step model defined by accounting guidance which governs such assessments. The first step involves the Company comparing each of its reporting unit carrying values, inclusive of assigned goodwill, to their respective estimated fair values. Fair value is estimated using a combination of the income approach, a discounted cash flow analysis, and the market approach, utilizing the guideline company method.
If the calculation in the first step results in any of the reporting units’ carrying values exceeding their respective estimated fair values, a second step is performed. The second step requires the Company to allocate the fair value of the reporting unit derived in the first step to the fair value of the reporting unit’s net assets. Any fair value in excess of amounts allocated to such net assets represent the implied fair value of goodwill for that reporting unit. Any excess of reporting unit carrying value of goodwill over the implied fair value of goodwill results in an impairment. The annual impairment test of goodwill performed in the fourth quarter of 2015 resulted in an impairment charge of $9.3 million related to the Company’s Clinics reporting unit.
Intangible Assets
The Company has an indefinite lived intangible asset related to its trade name. The carrying value of the trade name asset is reviewed at least annually for impairment, or as indicators of potential impairment are identified. The Company performs its annual impairment test in the fourth quarter each year in conjunction with its annual assessment of goodwill. The assessment consists of comparing the carrying value of the indefinite lived intangible asset to its estimated fair value, utilizing the relief from royalty method, an income approach valuation. There was no indication of impairment related to the trade name asset based on the fourth quarter 2015 assessment.
Finite-lived intangible assets consist mainly of the value assigned to customer relationships, backlog and developed technologies. Finite-lived intangible assets are amortized straight-line or using an accelerated method over their estimated useful lives, which range in term from seventeen months to fifteen years.
Impairment of Long-Lived Assets
Long-lived assets, primarily property and equipment and finite-lived intangible assets, are reviewed for impairment and the reasonableness of the estimated useful lives whenever events or changes in circumstances indicate that the carrying amounts of the assets may not be recoverable or that a change in useful life may be appropriate. Recoverability for long-lived assets is determined by comparing the forecasted undiscounted cash flows of the operation to which the assets relate to the carrying amount of the assets. If the undiscounted cash flows are less than the carrying amount of the assets, then the Company reduces the carrying value of the assets to estimated fair values, which are primarily based upon forecasted discounted cash flows. Fair value of long-lived assets is determined based on a combination of discounted cash flows and market multiples.
Advanced Billings
Advanced billings represents cash received from customers or billed amounts per an agreed upon payment schedule where cash has not been received in advance of services being performed or revenue being recognized.
Deemed Landlord Liabilities
Deemed landlord liabilities are recorded at their net present value when the Company enters into qualifying leases and are reduced as the Company makes periodic lease payments on the properties.
Other Current Liabilities and Other Long-Term Liabilities
Deferred rent represents the cumulative additional portion of rent expense recognized on a straight line basis in conjunction with the Company’s current leases at the balance sheet date. The Company defers incentives received
F-18
Table of Contents
from landlords for the purpose of making leasehold improvements. These liabilities are amortized as a component of rent expense over the term of the respective lease.
Exit liabilities, if any exist, are recorded at their net present value to the extent the Company no longer receives any benefit from the related property and when the Company has ceased all use of the property.
Asset retirement obligations, to the extent they exist, are recorded at their net present value and accreted to the Company’s estimate of liability at the time the obligation would be required to be satisfied.
Recently Adopted Accounting Standards
In April 2015, the Financial Accounting Standards Board (“FASB”) issued an Accounting Standards Update (“ASU”), ASU No. 2015-03, “Simplifying the Presentation of Debt Issuance Costs.” ASU No. 2015-03 requires debt issuance costs to be presented in the balance sheet as a direct deduction from the associated debt liability. ASU No. 2015-03 was to be effective for annual reporting periods beginning after December 15, 2015, and interim periods within those fiscal years. The Company early adopted ASU No. 2015-03 during 2015 and as a result, $12.1 million in debt issuance costs previously reported in Other Assets were reclassified to Long-term Debt, net, less current portion, in the consolidated balance sheet at December 31, 2014. There was no impact to the Company’s consolidated statements of operations, comprehensive (loss) income, shareholders’ equity or cash flows.
In November 2015, the FASB issued ASU No. 2015-17 “Balance Sheet Classification of Deferred Taxes.” ASU No. 2015-17 requires entities to present deferred tax assets and deferred tax liabilities as noncurrent in a classified balance sheet. ASU No. 2015-17 simplifies the current guidance, which requires entities to separately present deferred tax assets and deferred tax liabilities as current and noncurrent in a classified balance sheet. ASU No. 2015-17 was to be effective for annual reporting periods beginning after December 15, 2016, and interim periods within those annual periods. The Company early adopted ASU No. 2015-17 during 2015 and as a result, $3.3 million of Current deferred income tax assets were reclassified in the consolidated balance sheet at December 31, 2014. There was no impact to the Company’s consolidated statements of operations, comprehensive (loss) income, shareholders’ equity or cash flows.
Recently Issued Accounting Standards
In May 2014, the FASB issued ASU No. 2014-09 ‘‘Revenue from Contracts with Customers,’’ to clarify the principles of recognizing revenue and create common revenue recognition guidance between GAAP and International Financial Reporting Standards. In July 2015, the FASB issued ASU 2015-14, “Revenue from Contracts with Customers: Deferral of the Effective Date,” which delayed the effective date of ASU 2014-09 by one year and modified the standard to allow early adoption. For public entities, the standard is now effective for reporting periods beginning after December 15, 2017. Earlier application is permitted only as of annual reporting periods beginning after December 15, 2016, including interim reporting periods within that reporting period. Entities can transition to the standard either retrospectively or as a cumulative-effect adjustment as of the date of adoption. The Company is currently assessing the potential impact of ASU No. 2014-09 on the Company’s consolidated financial statements.
In April 2014, the FASB issued amendments to ASC 205, “Presentation of Financial Statements—Going Concern,” through issuance of ASU 2014-15, “Disclosure of Uncertainties about an Entity’s Ability to Continue as a Going Concern.” This ASU requires management to assess an entity’s ability to continue as a going concern by incorporating and expanding upon certain principles that are currently in U.S. auditing standards. The new guidance is effective for fiscal years ending after December 15, 2016, and for annual periods and interim periods thereafter, with early adoption permitted. The Company does not anticipate that this ASU will have any impact on the consolidated financial statements.
In April 2015, the FASB issued ASU No. 2015-05, “Customer’s Accounting for Fees Paid in a Cloud Computing Arrangement,” which provides guidance for a customer’s accounting for cloud computing costs. Under ASU 2015-05, if a software cloud computing arrangement contains a software license, customers should account for the license element of the arrangement in a manner consistent with the acquisition of other software licenses. If the arrangement does not contain a software license, customers should account for the arrangement as a service contract. This standard may be applied either prospectively to all arrangements entered into or materially modified after the effective date, or retrospectively. ASU 2015-05 is effective for fiscal years, and interim periods within
F-19
Table of Contents
those fiscal years, beginning after December 15, 2015, and early adoption is permitted. The Company is currently evaluating the impact of the adoption of this standard on its consolidated financial statements.
4. ACCOUNTS RECEIVABLE BILLED, NET
Accounts receivable billed, net of allowance for doubtful accounts, consisted of the following at December 31 (in thousands):
| SUCCESSOR | ||||||||
| 2015 | 2014 | |||||||
| Accounts receivable, billed |
$ | 40,721 | $ | 52,733 | ||||
| Reimbursable out-of-pocket expenses |
7,355 | 5,590 | ||||||
| Less allowance for doubtful accounts |
(1,724 | ) | (5,855 | ) | ||||
|
|
|
|
|
|||||
| Accounts receivable billed, net |
$ | 46,352 | $ | 52,468 | ||||
|
|
|
|
|
|||||
A rollforward of allowance for doubtful account activity is as follows:
| SUCCESSOR | PREDECESSOR | |||||||||||
| YEAR ENDED DECEMBER 31, 2015 |
PERIOD ENDED DECEMBER 31, 2014 |
PERIOD ENDED MARCH 31, 2014 |
||||||||||
| Allowance for doubtful accounts—beginning balance |
$ | (5,855 | ) | $ | (5,595 | ) | $ | (5,573 | ) | |||
| Current year provision |
(642 | ) | (624 | ) | (49 | ) | ||||||
| Write-offs and recoveries |
4,773 | 364 | 27 | |||||||||
|
|
|
|
|
|
|
|||||||
| Allowance for doubtful accounts—ending balance |
$ | (1,724 | ) | $ | (5,855 | ) | $ | (5,595 | ) | |||
|
|
|
|
|
|
|
|||||||
5. PROPERTY AND EQUIPMENT, NET
Property and equipment, net consisted of the following at December 31 (in thousands):
| SUCCESSOR | ||||||||
| 2015 | 2014 | |||||||
| Land |
$ | 940 | $ | 1,036 | ||||
| Equipment |
8,218 | 6,773 | ||||||
| Furniture, fixtures, and leasehold improvements |
8,563 | 6,515 | ||||||
| Computer hardware, software, and phone equipment |
4,569 | 2,090 | ||||||
| Buildings |
2,839 | 3,147 | ||||||
| Deemed assets from landlord building construction |
22,752 | 22,752 | ||||||
| Construction-in-progress |
304 | 292 | ||||||
|
|
|
|
|
|||||
| Property and equipment at cost |
48,185 | 42,605 | ||||||
| Less: Accumulated depreciation |
(10,673 | ) | (4,521 | ) | ||||
|
|
|
|
|
|||||
| Property and equipment, net |
$ | 37,512 | $ | 38,084 | ||||
|
|
|
|
|
|||||
Depreciation expense, which includes amortization from capital leases, was $6.4 million for the year ended 2015, $4.6 million for Successor Period ended December 31, 2014, $1.8 million for the Predecessor Period ended March 31, 2014, and $6.7 million for the Predecessor year ended December 31, 2013.
In 2011, Medpace, Inc. entered into two multi-year lease agreements governing the future occupancy of additional office space in Cincinnati, Ohio. The Company assumed occupancy of both spaces during 2012 and began making
F-20
Table of Contents
lease payments at that time. The leases expire in 2027 and the Company has one 10-year option to extend the term of the leases.
In accordance with the accounting guidance related to leases, the Company was deemed in substance to be the owner of the property during the construction phase. The accounting guidance requires that a lessee be considered the owner of a real estate project during the construction period if a related party of the lessee is an owner of the real estate. Given that a related party of Medpace made an equity investment in the lessor, Medpace was considered the owner of the property for accounting purposes during the buildings’ construction. Accordingly, the Company reflected the building and related liabilities as Deemed assets from landlord building construction (“Deemed Assets”) and Deemed landlord liabilities, respectively in the consolidated balance sheets. The Deemed Assets are being fully depreciated, on a straight line basis, over the 15-year term of the lease.
6. GOODWILL AND INTANGIBLE ASSETS
Goodwill
The changes in the carrying amount of goodwill are as follows (in thousands):
| Balance as of December 31, 2013—Predecessor |
$ | 322,692 | ||
|
|
|
|||
| Balance as of March 31, 2014—Predecessor |
322,692 | |||
| Elimination of Predecessor Goodwill |
(322,692 | ) | ||
| Goodwill from Transaction |
670,294 | |||
|
|
|
|||
| Balance as of December 31, 2014—Successor |
670,294 | |||
|
|
|
|||
| Impairment of Goodwill |
(9,313 | ) | ||
|
|
|
|||
| Balance as of December 31, 2015—Successor |
$ | 660,981 | ||
|
|
|
The annual impairment test performed in the fourth quarter of 2015 resulted in an impairment charge of $9.3 million related to the Company’s Clinics reporting unit. The current year goodwill impairment charge represents the total accumulated goodwill impairment losses as of December 31, 2015.
In 2014, the Company eliminated its Predecessor goodwill and recorded $670.3 million of Successor goodwill based on the purchase price allocation resulting from the Transaction.
Accumulated impairment charges for the Predecessor as of December 31, 2013 were $0.3 million.
F-21
Table of Contents
Intangible Assets, Net
The Company’s intangible assets consisted of the following (in thousands):
| GROSS CARRYING AMOUNT |
ACCUMULATED AMORTIZATION |
NET | ||||||||||
| Balances as of December 31, 2015—Successor: |
||||||||||||
| Backlog |
$ | 72,630 | $ | 72,630 | $ | — | ||||||
| Customer relationships |
145,051 | 26,991 | 118,060 | |||||||||
| Developed technologies |
54,475 | 19,066 | 35,409 | |||||||||
| Trade name (indefinite-lived) |
31,646 | — | 31,646 | |||||||||
| Other |
2,505 | 877 | 1,628 | |||||||||
|
|
|
|
|
|
|
|||||||
| $ | 306,307 | $ | 119,564 | $ | 186,743 | |||||||
|
|
|
|
|
|
|
|||||||
| Balances as of December 31, 2014—Successor: |
||||||||||||
| Backlog |
$ | 72,630 | $ | 39,777 | $ | 32,853 | ||||||
| Customer relationships |
145,051 | 8,099 | 136,952 | |||||||||
| Developed technologies |
54,475 | 8,171 | 46,304 | |||||||||
| Trade name (indefinite-lived) |
31,646 | — | 31,646 | |||||||||
| Other |
2,505 | 375 | 2,130 | |||||||||
|
|
|
|
|
|
|
|||||||
| $ | 306,307 | $ | 56,422 | $ | 249,885 | |||||||
|
|
|
|
|
|
|
|||||||
As of December 31, 2015, estimated amortization expense of the Company’s intangible assets for each of the next five years and thereafter is as follows (in thousands):
| 2016 |
$ | 50,672 | ||
| 2017 |
37,790 | |||
| 2018 |
29,371 | |||
| 2019 |
14,639 | |||
| 2020 |
7,797 | |||
| Thereafter |
14,828 | |||
|
|
|
|||
| Total future amortization expense |
$ | 155,097 | ||
|
|
|
7. ACCRUED EXPENSES
Accrued expenses consisted of the following at December 31 (in thousands):
| SUCCESSOR | ||||||||
| 2015 | 2014 | |||||||
| Employee compensation and benefits |
$ | 17,195 | $ | 18,216 | ||||
| Other |
2,916 | 2,091 | ||||||
|
|
|
|
|
|||||
| Total accrued expenses |
$ | 20,111 | $ | 20,307 | ||||
|
|
|
|
|
|||||
F-22
Table of Contents
8. DEBT
Debt consisted of the following at December 31 (in thousands):
| SUCCESSOR | ||||||||
| 2015 | 2014 | |||||||
| Term loan |
$ | 390,000 | $ | 505,000 | ||||
| Mortgage notes payable |
— | 1,051 | ||||||
| Capital lease |
59 | 138 | ||||||
|
|
|
|
|
|||||
| 390,059 | 506,189 | |||||||
| Less unamortized discount |
(1,984 | ) | (2,360 | ) | ||||
| Less unamortized debt issuance costs |
(10,134 | ) | (12,056 | ) | ||||
| Less current portion of long-term debt |
(59 | ) | (255 | ) | ||||
|
|
|
|
|
|||||
| Long-term debt, net, less current portion |
$ | 377,882 | $ | 491,518 | ||||
|
|
|
|
|
|||||
Principal payments on debt are due as follows (in thousands):
| 2016 |
$ | 59 | ||
| 2017 |
— | |||
| 2018 |
— | |||
| 2019 |
— | |||
| 2020 |
— | |||
| Thereafter |
390,000 | |||
|
|
|
|||
| Total |
$ | 390,059 | ||
|
|
|
Successor Company Credit Facilities
On April 1, 2014, in connection with the Transaction, the Successor entered into a $530.0 million credit agreement (the “Credit Agreement”), consisting of a $530.0 million term loan issued at 99.50% and a $60.0 million revolving credit facility (“Revolver”) issued at 99.00%. The term loan portion of the Credit Agreement has a seven year term and the Revolver has a five year term.
The Credit Agreement provides for the Company’s option, interest at the Eurocurrency rate or Base rate for term loan and Revolver borrowings. Base rate is the higher of several published customary market rates, including Federal Funds rate or Prime at time of borrowing. The Company, at its discretion, may choose interest periods of 1, 2, 3 or 6 months, which determines the interest rate to be applied. Interest on Eurocurrency loans continues to be payable at the end of the selected Eurocurrency term and interest on Base rate loans are payable quarterly in conjunction with any required principal payments.
The Credit Agreement initially provided for Eurocurrency loans at interest rates of 4.00% and 3.75% and interest rates of 3.00% and 2.75% with respect to Base rate for term loans and Revolver borrowings, respectively. Upon expiration of initial interest periods, term loan and Revolver borrowings under the Credit Agreement bear interest at a rate per annum equal to an applicable spread, with pricing levels providing for an interest rate reduction of 25 basis points upon achievement of a defined financial net debt leverage ratio, plus a Eurocurrency or Base rate. The defined net debt leverage ratio required for the reduced interest level was achieved in the second quarter of 2015 and has subsequently maintained. Term loan Eurocurrency rates are subject to a minimum floor of 1.00% or a Base rate which is subject to a floor of 2.00%. However, Revolver borrowings are not subject to minimum floor rates. The applicable spread for the term loan is 3.75% or 4.00% for the Eurocurrency rate and 2.75% or 3.00% with respect to the Base rate. The applicable spread for the Revolver is 3.50% or 3.75% for the Eurocurrency rate and 2.50% or 2.75% with respect to the Base rate.
F-23
Table of Contents
Medpace pays commitment fees on a quarterly basis at an annual rate of 0.50% of the unused borrowings under the Revolver, which is recorded as a component of Interest expense, net in the consolidated statements of operations. The commitment fee is subject to a pricing level reduction to 0.375% upon achievement of a defined financial net debt leverage. As of December 31, 2015, the Company had met the requirements for the pricing level reduction.
The original issue discount of $2.7 million related to the issuance of the term loan was recorded as a reduction of the underlying debt issuances and is being amortized over the life of the debt using the effective-interest method. Per the terms of the Credit Agreement, principal is scheduled to be paid quarterly on the last business day of March, June, September and December of each year, beginning September 2014. However, the Company is no longer subject to the quarterly term loan amortization as a result of voluntary prepayments in term loan principal during 2015 and 2014.
Origination fees of $15.5 million were originally capitalized related to the issuance of the Credit Agreement and are being amortized over the life of the debt using the effective-interest method. The unamortized portion of these fees related to the term loan were $10.1 million and $12.1 million at December 31, 2015 and 2014, respectively, and are recorded within Long-term debt, net, less current portion. The unamortized portion of the origination fees attributable to the Revolver were $1.3 million and $1.7 million at December 31, 2015 and 2014, respectively, and were recorded as a component of Other assets in the consolidated balance sheets.
The Credit Agreement is guaranteed by the Company and its subsidiaries and is subject to customary covenants relating to financial ratios and restrictions on certain types of transactions including restricting the Company’s ability to incur additional indebtedness, acquire and dispose of assets, make investments, pay dividends, or engage in mergers and acquisitions. The Successor was in compliance with all financial covenants as of December 31, 2015 and 2014.
As of December 31, 2015 the Company did not have any outstanding letters of credit under the Credit Agreement resulting in $60.0 million in undrawn capacity available under the Revolver. As of December 31, 2014, the Company had $2.2 million in outstanding letters of credit under the Credit Agreement resulting in $57.8 million in undrawn capacity available under the Revolver. The gross term loan balance as of December 31, 2015 and 2014 was $390.0 million and $505.0 million, respectively, and is currently at the Eurocurrency minimum floor interest rate of 4.75%.
The estimated fair value of the Successor’s term loan at December 31, 2015 and 2014, based on Level 1 quoted market prices, approximates $386.3 million and $500.9 million compared to the carrying value of $388.0 million and $502.6 million.
Predecessor Company Credit Facilities
On June 17, 2011, the Predecessor Company entered into a $335.0 million credit agreement (the “Predecessor Credit Agreement”), consisting of a $285.0 million term loan issued at 98.50% and a $50.0 million revolving credit facility (“Predecessor Revolver”). The Predecessor Credit Agreement, which was terminated in 2014 in connection with the Transaction, was guaranteed by the Company and its subsidiaries and was subject to covenants relating to financial ratios and restrictions on certain types of transactions. The Predecessor was in compliance with all financial covenants as of December 31, 2013.
The Predecessor Credit Agreement initially provided borrowings at interest rates based on a EuroDollar rate plus a margin of 5.00%, or a base rate plus a margin of 4.00%. Prior to the amendment discussed below, the EuroDollar rate was subject to a minimum floor of 1.50% and the base rate was subject to a minimum floor of 2.50%. Interest on the EuroDollar margin tranche of the loan was payable at the end of the selected EuroDollar term, which was typically a 30-day term or a 60-day term. Interest on the base rate tranche of the loan was payable quarterly in conjunction with any required principal payments. The Predecessor paid commitment fees on a quarterly basis at an annual rate of 0.50% of the unused amount of borrowings, which was recorded as a component of Interest expense, net in the consolidated statements of operations. The term loan portion of the Predecessor Credit Agreement had a six year term and the Predecessor Revolver had a five year term.
The original issue discount of $4.3 million from the issuance of the term loan was recorded as a reduction of the underlying debt balance and was being amortized over the life of the debt using a method which approximated the
F-24
Table of Contents
effective-interest method. Per the terms of the Predecessor Credit Agreement, principal was scheduled to be paid quarterly on the last business day of March, June, September and December of each year. However, as a result of voluntary prepayments in term loan principal during 2013, the Predecessor was not subject to the quarterly term loan amortization from that point forward.
A total of $5.9 million in loan origination fees were initially capitalized in conjunction with the issuance of the Predecessor Credit Agreement and those fees, net of the adjustment discussed below, were amortized over the life of the debt using a method which approximated the effective-interest method.
The gross term loan balance was $166.7 million at December 31, 2013 and was subject to interest at the EuroDollar minimum floor rate of 5.25%.
Amendment of the Predecessor Company Credit Facilities
On April 11, 2013, the Predecessor amended its credit facilities, primarily to modify the borrowing rate. The Predecessor Credit Agreement, as amended, provided for borrowings at interest rates that were based on a EuroDollar rate plus a margin of 4.25%, or a base rate plus a margin of 3.25%. The EuroDollar rate was subject to a minimum floor of 1.25% and the base rate was subject to a minimum floor of 2.25%.
In connection with amendment of the Predecessor Credit Agreement, three of the Predecessor’s previous lenders exited the credit facility. Pursuant to the accounting guidance governing such transactions, the Predecessor recorded a $1.5 million loss on the extinguishment of debt for the pro-rata share of unamortized debt issuance costs and original issue discount associated with those lenders. The loss on extinguishment was recorded in Miscellaneous (expense) income, net on the consolidated statement of operations for the year ended December 31, 2013. The original unamortized costs associated with the remaining lenders, in addition to the $1.1 million in new loan origination fees incurred in connection with the refinancing, were being amortized over the remaining term of the debt using a method which approximated the effective-interest method.
The outstanding term loan balance of $143.7 million as of March 31, 2014 was paid in full in connection with the Transaction and the Predecessor Credit Agreement was terminated.
Mortgage Notes Payable
Medpace entered into a mortgage contract with a European bank in 2006 related to the purchase of a laboratory facility in Leuven, Belgium. The Euro-denominated mortgage bears a fixed annual interest rate of 4.90%, requires monthly payments of principal and interest, and has a final maturity of December 2021. The mortgage is secured by building and land and also requires that Medpace maintain a cash balance held as collateral with the bank. During 2015, the mortgage was fully repaid and the Company received a full refund of cash collateral during the first quarter of 2016.
F-25
Table of Contents
9. COMMITMENTS, CONTINGENCIES, AND GUARANTEES
Lease Obligations
The Company has payment obligations under non-cancellable operating and capital leases, primarily for office space and furniture and fixtures to support its global operations. These leases often contain customary scheduled rent increases or escalation clauses and renewal options. Rent expense is recorded on a straight line basis. As of December 31, 2015, minimum future lease payments required under these leases are as follows for the years ending December 31 (in thousands):
| RELATED PARTY CAPITAL LEASE |
RELATED PARTY OPERATING LEASE |
NON-RELATED PARTIES OPERATING LEASES |
TOTAL OPERATING LEASES |
|||||||||||||
| 2016 |
$ | 62 | $ | 2,112 | $ | 4,048 | $ | 6,160 | ||||||||
| 2017 |
— | 2,112 | 2,786 | 4,898 | ||||||||||||
| 2018 |
— | 2,112 | 2,650 | 4,762 | ||||||||||||
| 2019 |
— | 2,112 | 1,482 | 3,594 | ||||||||||||
| 2020 |
— | 2,112 | 1,134 | 3,246 | ||||||||||||
| Thereafter |
— | 3,872 | 3,759 | 7,631 | ||||||||||||
|
|
|
|
|
|
|
|
|
|||||||||
| Total minimum lease payments |
$ | 62 | $ | 14,432 | $ | 15,859 | $ | 30,291 | ||||||||
|
|
|
|
|
|
|
|
|
|||||||||
| Less amounts representing interest |
3 | |||||||||||||||
|
|
|
|||||||||||||||
| Present value of net minimum lease payments (including $59 classified to other current liabilities) |
$ | 59 | ||||||||||||||
|
|
|
|||||||||||||||
The related party capital lease relates to assets utilized in the Company’s medical device operations. The related party operating lease is for one of the Company’s three buildings within its corporate headquarters. The non-related party operating leases are for the Company’s remaining leases throughout the world consisting primarily of office space, fixtures and vehicles.
Rental expense under operating leases totaled $5.8 million, $4.3 million, $1.4 million and $7.4 million for the Successor year ended December 31, 2015, the Successor Period ended December 31, 2014, the Predecessor Period ended March 31, 2014 and for the Predecessor year ended December 31, 2013, respectively, and is allocated between Direct costs, excluding depreciation and amortization, and Selling, general and administrative in the consolidated statements of operations.
Deemed Landlord Liabilities
As of December 31, 2015, minimum annual payments required in conjunction with the Deemed landlord liabilities are as follows (in thousands):
| RELATED PARTY MINIMUM LEASE PAYMENTS |
LESS: INTEREST |
PRINCIPAL AMOUNTS DUE |
||||||||||
| 2016 |
$ | 3,757 | $ | 2,207 | $ | 1,550 | ||||||
| 2017 |
3,837 | 2,091 | 1,746 | |||||||||
| 2018 |
3,886 | 1,961 | 1,925 | |||||||||
| 2019 |
3,937 | 1,819 | 2,118 | |||||||||
| 2020 |
3,988 | 1,662 | 2,326 | |||||||||
| Thereafter |
27,973 | 5,815 | 22,158 | |||||||||
|
|
|
|
|
|
|
|||||||
| Total |
$ | 47,378 | $ | 15,555 | $ | 31,823 | ||||||
|
|
|
|
|
|
|
|||||||
F-26
Table of Contents
Purchase Commitments
In May 2013, Medpace committed to the aggregate purchase of $2.0 million of software services from a vendor during the period from June 1, 2013 through May 31, 2016. In return for the commitment, Medpace receives preferential fixed rate pricing and a 5% discount on all purchases made pursuant to this agreement during its three-year term. As of December 31, 2014, the Company had met the aggregate purchase commitment.
Legal Proceedings
Medpace periodically becomes involved in various claims and lawsuits that are incidental to its business. Management believes, after consultation with counsel, that no matters currently pending would, in the event of an adverse outcome, have a material impact on the Company’s consolidated balance sheets, statements of operations, or cash flows.
In March 2012, the Company filed a legal claim against one of its customers, citing as a basis for its claim the customer’s non-payment of more than $6.5 million in outstanding invoices. In response, the customer filed a counterclaim against the Company for compensatory damages, asserting that the Company had willfully and wrongly withheld clinical study data alleged to be owned by the customer. The Company objected to these allegations and believed it had meritorious defenses against these claims and also believed that it would ultimately prevail in this matter. During 2015, a Settlement and Mutual Release Agreement (the “Agreement”) was entered into whereas the Company agreed to settle all outstanding claims for payment of $2.0 million from the customer and both parties waived the right to file any future suits. The customer paid the $2.0 million settlement during 2015 and the Company recorded a bad debt recovery of $2.0 million in Selling, general and administrative in the consolidated statements of operations.
10. SHAREHOLDERS’ EQUITY
Successor Company
Successor Awards
The Successor Plan for employees and directors provides for the issuance of vested shares, stock options, RSAs and RSUs in Medpace Holdings, Inc.’s common stock. The Successor Plan has reserved 3,790,262 shares for issuance of restricted awards or stock options, of which approximately 425,000 awards were available for future grants as of December 31, 2015. The Successor Plan expires in 2024, except for awards then outstanding and is administered by the Board of Directors.
The Awards are granted to key employees as additional compensation for services rendered and as a means of retention over the vesting period, typically three to four years. RSAs awarded under the plan are subject to automatic forfeiture upon departure until vested and entitle the shareholder to all rights of common stock ownership except that they may not be sold, transferred, pledged or otherwise disposed of during the restriction period, except as noted in the following paragraph. The Successor Plan also allows for the issuance of non-qualified stock options to employees, officers, and directors under this plan (collectively, “the Participants”). Under the Successor Plan, options may be granted with an exercise price equal to or greater than the fair value of common stock at the grant date as determined by the Board of Directors. The stock options, if unexercised, expire seven years from the date of grant.
As a condition to exercising stock options and acceptance of certain restricted shares, employees must execute a Contribution and Subscription Agreement (the “Subscription Agreement”) that provides for the exchange of the shares issued for incentive units (the “Incentive Units”) in Medpace Investors upon the occurrence of certain events. The Incentive Units are tied directly to common stock ownership in Medpace Holdings, Inc. and entitle the Incentive Unit holder to participate in the risks and rewards of owning the Successor Company’s stock through ownership in Medpace Investors. The Successor Awards containing this condition are liability-classified instruments as they are inevitably settled in the equity of a non-consolidated related party. Restricted share awards excluding the requirement to execute a Contribution and Subscription Agreement and settlement in common shares of Medpace Holdings, Inc. are equity-classified instruments.
At the grant date for RSAs that are liability-classified, restricted shares are legally issued and exchanged for MPI Incentive Units on behalf of the employee. If the RSAs are not yet vested and an employee leaves the Successor Company’s employment, the restricted shares of Medpace Holdings, Inc. revert back to the Successor Company and
F-27
Table of Contents
are available for re-issuance under the Successor Plan. Upon the vesting of RSAs and RSUs and upon the exercise of stock options, the stock-based compensation liability is settled by exchanging the Successor Company’s stock for MPI Incentive Units. If an employee leaves the Successor Company’s employment after they vest in the Awards and the exchange for Incentive Units has been made, Medpace Investors may exercise a call option to repurchase an employee’s Incentive Units at a price determined by the manager and majority unit holder of Medpace Investors, who is also the chief executive officer of Medpace. If Medpace Investors exercises the call right, it may do so up to the later of twelve months following the employee’s departure date or six months following the determination that the former employee is directly or indirectly engaged in competitive business activities.
Pursuant to the Successor Company’s Shareholder Agreement (the “Successor Shareholder Agreement”), in the event Medpace Investors dissolves or distributes any common stock of Medpace Holdings, Inc. to the Medpace Investors’ members prior to a public offering, the Successor Company has a call right to repurchase the common stock at a price equal to the fair market value of the stock as determined by the Board of Directors, provided that in no case shall any shares held by the chief executive officer or his affiliates be subject to the call rights.
Restricted Awards Modification
On December 17, 2015, the Board of Directors approved a resolution to accelerate the vesting period for all issued, outstanding and unvested RSAs and RSUs to vest on December 31, 2015, so long as the recipient of each restricted share or unit is in good standing, has not provided notice of resignation and continues to be employed by the Company as of December 31, 2015. In total, 688,599 unvested restricted awards held by 158 current employees were modified resulting in settlement of 688,599 shares.
According to the authoritative guidance for stock-based compensation, under these circumstances a company should recognize additional stock-based compensation expense in the amount of the incremental fair value of the modified award. Because the restricted awards that were modified are liability-classified, the awards are at fair value at the time of the modification and no incremental cost was recognized. While there is no incremental cost related to fair value of the awards, $5.7 million of stock-based compensation expense was recorded in 2015 related to previously unrecognized stock-based compensation cost for awards expected to vest in 2016, 2017 and 2018.
Predecessor Company
Predecessor Awards
In 2011, the Predecessor Company adopted a stock option plan (the “2011 Stock Option Plan”) and was authorized to issue non-qualified stock options to employees, officers, and directors under this plan (collectively “the Participants”). Under the 2011 Stock Option Plan, options may be granted with an exercise price equal to or greater than the fair value of common stock at the date of the grant as determined by the Board of Directors. In April 2012, the Board of Directors amended the 2011 Stock Option Plan to increase the maximum number of shares available for issuance as options to the Participants. Options granted under the plans may be exercised at certain times subsequent to certain events, as set forth in the grant. The stock options, if unexercised, expire ten years from the date of grant.
In December 2012, the Predecessor Company’s Board of Directors established a restricted stock plan (the “2012 Restricted Stock Plan”) and approved the issuance of RSAs and RSUs (collectively, the “Restricted Shares”) up to an authorized amount of 350,000 total Restricted Shares. These shares are subject to certain restrictions, and are issued to key employees of the Company as a means of retention. RSAs awarded under the plan entitle the shareholder to all rights of common stock ownership except that they may not be sold, transferred, pledged, exchanged or otherwise disposed of during the restriction period.
The terms of the 2011 Stock Option Plan and the 2012 Restricted Stock Plan (collectively, the “Predecessor Equity Plans”) permitted, but did not require, the acceleration of vesting for awards upon a change in control. On March 24, 2014, the Predecessor’s Board of Directors approved the acceleration of vesting for outstanding Restricted Share awards and stock options, the effect of which took place immediately prior to the April 1, 2014 Transaction. The Predecessor’s Board of Directors, at the same time, also approved the cancellation of any remaining unvested equity awards and terminated the Predecessor Equity Plans. The acceleration of vesting was determined to be a modification of the Predecessor Equity Plans and, pursuant to accounting guidance governing such transactions, the Predecessor Company recorded incremental stock-based compensation expense of $7.1 million. The modification of the Predecessor Equity Plans resulted in accelerated vesting for 172,492 Restricted Shares and
F-28
Table of Contents
992,412 stock options. This change impacted 266 employees. In connection with the Transaction, all Participants exercised their options, resulting in exercise proceeds aggregating $15.2 million.
Treasury Shares
The Predecessor Company’s Shareholder Agreement (the “Predecessor Shareholder Agreement”) permitted the Company to directly purchase the shares of employee shareholders that separated from the Company. The Predecessor Company did not exercise its option to repurchase shares from separated employees during any Predecessor period covered by the Predecessor’s Financial Statements.
Successor and Predecessor Equity Awards
Valuation Assumptions
The Company determines the fair value of stock options using the Black-Scholes-Merten option pricing model (the “BSM Model”). The BSM Model is primarily affected by the fair value of the Successor’s common stock (see restricted share valuation discussion below), the expected holding period for the option, expected stock price volatility over the term of the awards, the risk-free interest rate, and expected dividends.
The following table sets forth the key weighted-average assumptions used in the BSM Model to calculate the fair value of options:
| SUCCESSOR | PREDECESSOR | |||||||||||||||||||
| YEAR ENDED DECEMBER 31, 2015 |
PERIOD ENDED DECEMBER 31, 2014 |
PERIOD ENDED MARCH 31, 2014 |
YEAR ENDED DECEMBER 31, 2013 |
|||||||||||||||||
| Expected holding period—years |
4.2 | 5.4 | N/A | 3.1 | ||||||||||||||||
| Expected volatility |
36.4% | 41.8% | N/A | 37.4% | ||||||||||||||||
| Risk-free interest rate |
1.2% | 1.7% | N/A | 0.3% | ||||||||||||||||
| Expected dividend yield |
0.0% | 0.0% | N/A | 0.0% | ||||||||||||||||
The Successor’s assumptions in the table above represent those used during the Successor year ended December 31, 2015 and the Successor Period ended December 31, 2014, for the fair value calculations of the stock options as required for liability-classified stock compensation accounting. The assumptions used by the Predecessor reflect grant date inputs used to arrive at the grant date fair values as the Predecessor awards are subject to equity-classified stock compensation accounting.
The expected holding period represents the period of time the grants are expected to be outstanding. The Company uses the simplified method, as prescribed by accounting guidance governing such awards, to calculate the expected holding period for options granted to employees as we do not have sufficient historical evidence data to provide a reasonable basis upon which to estimate the expected holding period. For options valued by the Successor for the year ended December 31, 2015 and the Successor Period ended December 31, 2014, the expected holding period is based on an average between the midpoint of the vesting date and the expiration date of the options and the estimated time expected until a change in control. For options issued during the Predecessor year ended December 31, 2013, the expected holding period was based on a probability-weighted assessment of an anticipated liquidity event.
The Company estimates expected volatility primarily by using the historical volatility of a publicly traded peer group that operates in the clinical research and development industry. The Company does not have adequate data to calculate its own volatility and believes the Company’s expected volatility will approximate the historical experience of the peer group. The risk-free interest rate is based on the yield on U.S. Treasury obligations with remaining durations equal to the expected holding period of the options. The expected dividend yield is assumed to be zero based on recent and anticipated dividend activity.
The Company determines the fair value of restricted shares by obtaining an independent valuation of the fair value of the Company’s equity, applying a discount for lack of marketability, and then calculating the implied share price. The fair value of the Company is estimated primarily using an income approach which is based on assumptions and estimates made by management and, secondarily, using other market-related factors in current industry trends as well as observed transaction values. In determining the estimated future cash flows used in the income approach,
F-29
Table of Contents
the Company developed and applied certain estimates and judgments, including current and projected future levels of income based on management’s plans, business trends, prospects and market and economic conditions, including market-participant considerations. Significant assumptions utilized in the income approach were based on company specific information and projections, which are not observable in the market and are thus considered Level 3 measurements by authoritative guidance (see discussion of fair value measurements). The discount for lack of marketability (the “Marketability Discount”) was applied to reflect what a market participant would consider in relation to the post-vesting restrictions imposed regarding the inability to sell, transfer, or pledge the shares during the restriction period. The Marketability Discount was estimated by using the BSM Model to calculate the cost of a theoretical put option to hedge the fluctuation in value of the investment between the valuation date and an anticipated liquidity date.
The following table summarizes the grant date fair values of stock options and restricted shares issued during the period as well as the allocation of stock-based compensation expense to Direct costs, excluding depreciation and amortization, and Selling, general and administrative reported in the consolidated statements of operations:
| SUCCESSOR | PREDECESSOR | |||||||||||||||||||
| YEAR ENDED DECEMBER 31, 2015 |
PERIOD ENDED DECEMBER 31, 2014 |
PERIOD ENDED MARCH 31, 2014 |
YEAR ENDED DECEMBER 31, 2013 |
|||||||||||||||||
| Weighted average, grant date fair value |
||||||||||||||||||||
| Stock options |
$ | 3.81 | $ | 4.33 | N/A | $ | 1.66 | |||||||||||||
|
|
|
|
|
|
|
|
|
|||||||||||||
| Restricted shares (RSAs and RSUs) |
$ | 12.53 | $ | 10.80 | N/A | $ | 8.50 | |||||||||||||
|
|
|
|
|
|
|
|
|
|||||||||||||
| Stock-based compensation expense allocated to: |
||||||||||||||||||||
| Direct costs, excluding depreciation and amortization |
$ | 9,243 | $ | 4,399 | $ | 5,422 | $ | 601 | ||||||||||||
| Selling, general and administrative |
13,081 | 1,024 | 1,918 | 1,357 | ||||||||||||||||
|
|
|
|
|
|
|
|
|
|||||||||||||
| Total stock-based compensation expense |
$ | 22,324 | $ | 5,423 | $ | 7,340 | $ | 1,958 | ||||||||||||
|
|
|
|
|
|
|
|
|
|||||||||||||
Award Activity
The following table sets forth the Successor’s and Predecessor’s stock option activity:
| SUCCESSOR | PREDECESSOR | |||||||||||||||||||||||||||||||||||
| YEAR ENDED DECEMBER 31, 2015 |
PERIOD ENDED DECEMBER 31, 2014 |
PERIOD ENDED MARCH 31, 2014 |
YEAR ENDED DECEMBER 31, 2013 |
|||||||||||||||||||||||||||||||||
| OPTIONS | WEIGHTED AVERAGE EXERCISE PRICE |
SHARES | WEIGHTED AVERAGE EXERCISE PRICE |
SHARES | WEIGHTED AVERAGE EXERCISE PRICE |
SHARES | WEIGHTED AVERAGE EXERCISE PRICE |
|||||||||||||||||||||||||||||
| Outstanding—Beginning of period |
1,091,048 | $ | 14.40 | — | $ | — | 1,438,800 | $ | 11.03 | 1,267,900 | $ | 10.00 | ||||||||||||||||||||||||
| Granted |
889,849 | $ | 16.67 | 1,131,895 | $ | 14.40 | — | $ | — | 378,300 | $ | 14.00 | ||||||||||||||||||||||||
| Exercised |
(17,404 | ) | $ | — | — | $ | — | (1,388,000 | ) | $ | 10.97 | (45,200 | ) | $ | 10.00 | |||||||||||||||||||||
| Forfeited |
(168,784 | ) | $ | 15.53 | (40,847 | ) | $ | 14.40 | (32,200 | ) | $ | 12.53 | (162,200 | ) | $ | 10.18 | ||||||||||||||||||||
| Expired |
— | $ | — | — | $ | — | (18,600 | ) | $ | 11.27 | — | $ | — | |||||||||||||||||||||||
|
|
|
|
|
|
|
|
|
|||||||||||||||||||||||||||||
| Outstanding—end of period |
1,794,709 | $ | 15.42 | 1,091,048 | $ | 14.40 | — | $ | — | 1,438,800 | $ | 11.03 | ||||||||||||||||||||||||
|
|
|
|
|
|
|
|
|
|||||||||||||||||||||||||||||
| Exercisable—end of period |
242,777 | $ | 14.40 | — | $ | — | — | $ | — | 395,588 | $ | 10.00 | ||||||||||||||||||||||||
|
|
|
|
|
|
|
|
|
|||||||||||||||||||||||||||||
F-30
Table of Contents
The following table sets forth the Successor and Predecessor’s Restricted Share activity:
| SUCCESSOR | PREDECESSOR | |||||||||||||||||||
| YEAR ENDED DECEMBER 31, 2015 |
PERIOD ENDED DECEMBER 31, 2014 |
PERIOD ENDED MARCH 31, 2014 |
YEAR ENDED DECEMBER 31, 2013 |
|||||||||||||||||
| SHARES | SHARES | SHARES | SHARES | |||||||||||||||||
| Outstanding and unvested—beginning of period |
407,171 | — | 176,643 | 216,898 | ||||||||||||||||
| Granted |
1,253,924 | 707,721 | — | 59,990 | ||||||||||||||||
| Vested |
(1,530,547 | ) | (283,042 | ) | (172,492 | ) | (90,998 | ) | ||||||||||||
| Forfeited |
(39,851 | ) | (17,508 | ) | (4,151 | ) | (9,247 | ) | ||||||||||||
|
|
|
|
|
|
|
|
|
|||||||||||||
| Outstanding and unvested—end of period |
90,697 | 407,171 | — | 176,643 | ||||||||||||||||
|
|
|
|
|
|
|
|
|
|||||||||||||
| Cumulative vested shares—end of period |
1,813,589 | 283,042 | 263,490 | 90,998 | ||||||||||||||||
During the Successor year ended December 31, 2015 and the Successor Period ended December 31, 2014, 583,021 and 283,042 Restricted Shares were granted and immediately vested upon issuance (the “Vested Shares”), respectively. The stock-based compensation liability related to 231,229 and 283,042 Vested Shares granted during the Successor year ended December 31, 2015 and the Successor Period ended December 31, 2014, respectively, were settled by exchanging the awards for Medpace Investors’ Incentive Units. The stock-based liability related to the residual 351,851 Vested Shares granted during the Successor year ended December 31, 2015 were settled by exchanging the awards for the Company’s common stock.
The following table summarizes information about stock options expected to vest, stock options exercisable, and unvested restricted share awards expected to vest at December 31, 2015:
| ISSUED IN SUCCESSOR YEAR ENDED |
WEIGHTED AVERAGE EXERCISE PRICE |
STOCK OPTIONS |
RESTRICTED SHARES |
WEIGHTED AVERAGE REMAINING LIFE (YEARS) |
||||||||||||
| December 31, 2015 |
||||||||||||||||
| Number of stock options expected to vest |
$ | 15.58 | 1,472,818 | — | 6.0 | |||||||||||
| Number of Restricted Shares expected to vest |
— | 85,847 | ||||||||||||||
|
|
|
|
|
|||||||||||||
| Total expected to vest—December 31, 2015 |
1,472,818 | 85,847 | ||||||||||||||
|
|
|
|
|
|||||||||||||
| Total stock options exercisable—December 31, 2015 |
$ | 14.40 | 242,777 | 5.5 | ||||||||||||
|
|
|
|||||||||||||||
| Unrecognized compensation cost—December 31, 2015 (in thousands) |
$ | 3,653 | $ | 1,254 | ||||||||||||
|
|
|
|
|
|||||||||||||
| Weighted average years over which unrecognized compensation cost will be recognized |
1.7 | 3.0 | ||||||||||||||
|
|
|
|
|
|||||||||||||
F-31
Table of Contents
The following table sets forth the aggregate intrinsic value of stock options exercised, the fair values of awards vested, and share based liabilities settled during the respective periods (in thousands):
| SUCCESSOR | PREDECESSOR | |||||||||||||||||||
| YEAR ENDED DECEMBER 31, 2015 |
PERIOD ENDED DECEMBER 31, 2014 |
PERIOD ENDED MARCH 31, 2014 |
YEAR ENDED DECEMBER 31, 2013 |
|||||||||||||||||
| Total intrinsic value of stock options exercised |
$ | (36 | ) | $ | — | $ | 25,378 | $ | 181 | |||||||||||
| Total grant-date fair value of stock options vested |
$ | 1,168 | $ | — | $ | 3,446 | $ | 1,034 | ||||||||||||
| Total grant-date fair value of restricted shares vested |
$ | 18,284 | $ | 3,057 | $ | 1,466 | $ | 773 | ||||||||||||
| Total settlement date fair value of restricted shares vested |
$ | 21,134 | $ | 3,057 | N/A | N/A | ||||||||||||||
| Total share-based liabilities settled |
$ | 16,858 | $ | 3,057 | N/A | N/A | ||||||||||||||
The stock-based compensation liability of $3.6 million at December 31, 2015 is related to outstanding stock options. The stock-based compensation liability of $2.4 million at December 31, 2014 is related to outstanding stock options and unvested Restricted Awards. Further, $1.7 million and $1.3 million is included in Other current liabilities and $1.9 million and $1.1 million is included in Other long-term liabilities in the consolidated balance sheets at December 31, 2015 and 2014, respectively.
The actual tax benefits recognized related to stock-based compensation totaled $4.6 million, $3.3 million, $8.2 million, and $0.1 million for the Successor year ended December 31, 2015, the Successor Period ended December 31, 2014, the Predecessor Period ended March 31, 2014, and the Predecessor year ended December 31, 2013, respectively.
11. EMPLOYEE BENEFIT PLANS
The Company provides a 401(k) plan that covers substantially all U.S. employees. Participants can elect to contribute up to 50% of their eligible earnings on a pre-tax basis, subject to Internal Revenue Service annual limitations.
The U.S.-based plan offers a year-end employer matching contribution, requiring the participant to be an employee at year-end to qualify for the match. Participants with one year or more of service are eligible for the matching contribution. Participants fully vest in the employer contributions after three years of service. The employer contribution represents a percentage of a participant’s eligible compensation. The Company’s 401(k) Plan costs were $1.7 million, $1.1 million, $0.3 million, and $1.2 million during the Successor year ended December 31, 2015, the Successor Period ended December 31, 2014, the Predecessor Period ended March 31, 2014, and the Predecessor year ended December 31, 2013 respectively, and were allocated between Direct costs, excluding depreciation and amortization, and Selling, general and administrative in the consolidated statements of operations.
The Company has various defined contribution arrangements for eligible employees of non-U.S. entities. These defined contribution arrangements provide employees with retirement savings and life insurance benefits. The Company incurred expenses related to these arrangements of $0.7 million, $0.5 million, $0.2 million, and $0.5 million in the Successor year ended December 31, 2015, the Successor Period ended December 31, 2014, the Predecessor Period ended March 31, 2014, and the Predecessor year ended December 31, 2013, respectively, and were allocated between Direct costs, excluding depreciation and amortization, and Selling, general and administrative in the consolidated statements of operations.
The Company is also required to pay certain minimum statutory post-employment benefits. The Company recognizes a liability and the associated expense for these benefits when it is probable that employees are entitled to the benefit.
F-32
Table of Contents
12. INCOME TAXES
The Company files income tax returns for U.S. federal and various U.S. states, as well as various foreign jurisdictions. The liabilities for unrecognized tax benefits are carried in Other long-term liabilities on the consolidated balance sheets because the payment of cash is not anticipated within one year of the balance sheet date.
The components of (loss) income before income taxes consisted of the following (in thousands):
| SUCCESSOR | PREDECESSOR | |||||||||||||||||||
| YEAR ENDED DECEMBER 31, 2015 |
PERIOD ENDED DECEMBER 31, 2014 |
PERIOD ENDED MARCH 31, 2014 |
YEAR ENDED DECEMBER 31, 2013 |
|||||||||||||||||
| Domestic |
$ | (12,294 | ) | $ | (23,893 | ) | $ | (1,069 | ) | $ | 37,046 | |||||||||
| Foreign jurisdictions |
4,464 | 2,854 | 847 | 2,099 | ||||||||||||||||
|
|
|
|
|
|
|
|
|
|||||||||||||
| (Loss) income before income taxes |
$ | (7,830 | ) | $ | (21,039 | ) | $ | (222 | ) | $ | 39,145 | |||||||||
|
|
|
|
|
|
|
|
|
|||||||||||||
Income tax provision (benefit) consisted of the following (in thousands):
| CURRENT | DEFERRED | TOTAL | ||||||||||
| Successor Year ended December 31, 2015: |
||||||||||||
| U.S. Federal |
$ | 11,067 | $ | (11,995 | ) | $ | (928 | ) | ||||
| U.S. state and local |
1,119 | (761 | ) | 358 | ||||||||
| Foreign jurisdictions |
1,372 | 41 | 1,413 | |||||||||
|
|
|
|
|
|
|
|||||||
| $ | 13,558 | $ | (12,715 | ) | $ | 843 | ||||||
|
|
|
|
|
|
|
|||||||
| Successor Period ended December 31, 2014: |
||||||||||||
| U.S. Federal |
$ | 1,817 | $ | (8,941 | ) | $ | (7,124 | ) | ||||
| U.S. state and local |
245 | (606 | ) | (361 | ) | |||||||
| Foreign jurisdictions |
853 | (71 | ) | 782 | ||||||||
|
|
|
|
|
|
|
|||||||
| $ | 2,915 | $ | (9,618 | ) | $ | (6,703 | ) | |||||
|
|
|
|
|
|
|
|||||||
| Predecessor Period ended March 31, 2014: |
||||||||||||
| U.S. Federal |
$ | 342 | $ | 659 | $ | 1,001 | ||||||
| U.S. state and local |
52 | (38 | ) | 14 | ||||||||
| Foreign jurisdictions |
320 | (321 | ) | (1 | ) | |||||||
|
|
|
|
|
|
|
|||||||
| $ | 714 | $ | 300 | $ | 1,014 | |||||||
|
|
|
|
|
|
|
|||||||
| Predecessor Year ended December 31, 2013: |
||||||||||||
| U.S. Federal |
$ | 6,165 | $ | 6,352 | $ | 12,517 | ||||||
| U.S. state and local |
1,011 | 784 | 1,795 | |||||||||
| Foreign jurisdictions |
860 | (871 | ) | (11 | ) | |||||||
|
|
|
|
|
|
|
|||||||
| $ | 8,036 | $ | 6,265 | $ | 14,301 | |||||||
|
|
|
|
|
|
|
|||||||
F-33
Table of Contents
The difference between the statutory rate for federal income tax and the effective income tax rate was as follows (in thousands):
| SUCCESSOR | PREDECESSOR | |||||||||||||||||||||||||||||||||||
| YEAR ENDED DECEMBER 31, 2015 |
PERIOD ENDED DECEMBER 31, 2014 |
PERIOD ENDED MARCH 31, 2014 |
YEAR ENDED DECEMBER 31, 2013 |
|||||||||||||||||||||||||||||||||
| Income tax expense calculated at the federal statutory rate |
$ | (2,740 | ) | 35.0% | $ | (7,363 | ) | 35.0% | $ | (78 | ) | 35.0% | $ | 13,701 | 35.0% | |||||||||||||||||||||
| Effect of: |
||||||||||||||||||||||||||||||||||||
| State and local taxes, net of federal benefit |
487 | (6.2 | ) | 219 | (1.0 | ) | 208 | (93.8 | ) | 1,189 | 3.0 | |||||||||||||||||||||||||
| Tax on foreign earnings, net of tax credits and deductions |
(330 | ) | 4.2 | (261 | ) | 1.2 | (440 | ) | 197.8 | (746 | ) | (1.9 | ) | |||||||||||||||||||||||
| Change in valuation allowance |
— | — | — | — | 789 | (354.3 | ) | — | — | |||||||||||||||||||||||||||
| Permanent items: |
||||||||||||||||||||||||||||||||||||
| Goodwill impairment |
2,106 | (26.9 | ) | — | — | — | — | — | — | |||||||||||||||||||||||||||
| Stock-based awards |
778 | (9.9 | ) | 332 | (1.6 | ) | 278 | (125.2 | ) | — | — | |||||||||||||||||||||||||
| Other |
185 | (2.4 | ) | 730 | (3.5 | ) | 296 | (133.1 | ) | (22 | ) | (0.1 | ) | |||||||||||||||||||||||
| State tax credits |
(931 | ) | 11.9 | (573 | ) | 2.7 | (208 | ) | 93.6 | (554 | ) | (1.4 | ) | |||||||||||||||||||||||
| Change in liability for uncertain tax positions |
1,250 | (16.0 | ) | 249 | (1.2 | ) | 169 | (76.1 | ) | 985 | 2.5 | |||||||||||||||||||||||||
| Other |
38 | (0.5 | ) | (36 | ) | 0.2 | — | — | (252 | ) | (0.6 | ) | ||||||||||||||||||||||||
|
|
|
|
|
|
|
|
|
|
|
|
|
|
|
|
|
|||||||||||||||||||||
| $ | 843 | (10.8% | ) | $ | (6,703 | ) | 31.8% | $ | 1,014 | (456.1% | ) | 14,301 | 36.5% | |||||||||||||||||||||||
|
|
|
|
|
|
|
|
|
|
|
|
|
|
|
|
|
|||||||||||||||||||||
The undistributed earnings of foreign subsidiaries at December 31, 2015 and 2014 were approximately $10.4 million and $8.2 million, respectively, and have been permanently reinvested. It is not practicable to determine the amount of the additional taxes that would result if these earnings were repatriated.
Components of the Company’s net deferred tax liability included in the consolidated balance sheets consisted of the following (in thousands):
| SUCCESSOR | ||||||||
| 2015 | 2014 | |||||||
| Deferred tax assets: |
||||||||
| Accrued liabilities |
$ | 15,746 | $ | 16,802 | ||||
| Depreciation and amortization |
1,995 | 2,241 | ||||||
| Foreign operating loss carryforward |
250 | 274 | ||||||
| Foreign tax credit carryforward |
4 | 5 | ||||||
| U.S. state and local tax credits and carryforward |
153 | 421 | ||||||
| Other |
1,128 | 1,396 | ||||||
| Valuation allowance |
(1,021 | ) | (1,086 | ) | ||||
|
|
|
|
|
|||||
| Total deferred tax assets |
18,255 | 20,053 | ||||||
|
|
|
|
|
|||||
| Deferred tax liabilities: |
||||||||
| Depreciation and amortization |
(38,970 | ) | (52,791 | ) | ||||
| Prepaid expenses |
(161 | ) | (153 | ) | ||||
| Other |
(71 | ) | (739 | ) | ||||
|
|
|
|
|
|||||
| Total deferred tax liabilities |
(39,202 | ) | (53,683 | ) | ||||
|
|
|
|
|
|||||
| Net deferred tax liability |
$ | (20,947 | ) | $ | (33,630 | ) | ||
|
|
|
|
|
|||||
F-34
Table of Contents
The deferred tax asset attributable to U.S. state and local tax credits and carryforwards above includes $0.1 million for U.S. state and local operating loss carryforwards that expire at various times from 2015 to 2029.
The Company has foreign operating loss carryforwards for which a deferred tax asset of $0.3 million has been established. The Company has a valuation allowance of $0.2 million against this deferred tax asset based upon its assessment that it is more likely than not that this amount will not be realized. The ultimate realization of this tax benefit is dependent upon the generation of sufficient operating income in the respective tax jurisdictions. Approximately 92% of the foreign net operating loss carryforwards can be utilized over an indefinite period whereas the remainder will expire in 2020 if not utilized.
In December 2013, the Company recorded an impairment loss of $2.3 million and an associated deferred tax asset of $0.8 million on its cost method investment in a related party. In March 2014, the investment was sold and the company incurred a capital loss. This loss is limited to offset future capital gains which the Company does not anticipate will be generated, thus a valuation allowance of $0.8 million has been recorded as it is more likely than not that realization cannot be assured.
Annual activity related to the Company’s valuation allowance is as follows (in thousands):
| SUCCESSOR | PREDECESSOR | |||||||||||||||||||
| YEAR ENDED DECEMBER 31, 2015 |
PERIOD ENDED DECEMBER 31, 2014 |
PERIOD ENDED MARCH 31, 2014 |
YEAR ENDED DECEMBER 31, 2013 |
|||||||||||||||||
| Beginning Balance |
$ | 1,086 | $ | 1,103 | $ | 305 | $ | 510 | ||||||||||||
| Additions charged to expense |
— | — | 798 | — | ||||||||||||||||
| Reductions from utilization, reassessments and expirations |
(65 | ) | (17 | ) | — | (205 | ) | |||||||||||||
|
|
|
|
|
|
|
|
|
|||||||||||||
| Ending Balance |
$ | 1,021 | $ | 1,086 | $ | 1,103 | $ | 305 | ||||||||||||
|
|
|
|
|
|
|
|
|
|||||||||||||
A reconciliation of the beginning and ending balances of the total amounts of gross unrecognized tax benefits is as follows (in thousands):
| SUCCESSOR | PREDECESSOR | |||||||||||||||||||
| YEAR ENDED DECEMBER 31, 2015 |
PERIOD ENDED DECEMBER 31, 2014 |
PERIOD ENDED MARCH 31, 2014 |
YEAR ENDED DECEMBER 31, 2013 |
|||||||||||||||||
| Beginning Balance |
$ | 1,353 | $ | 1,092 | $ | 938 | $ | 162 | ||||||||||||
| Increases in tax positions for prior years |
— | 31 | 134 | — | ||||||||||||||||
| Decreases in tax positions for prior years |
(14 | ) | (8 | ) | — | — | ||||||||||||||
| Increases in tax positions for current year |
1,265 | 238 | 20 | 776 | ||||||||||||||||
|
|
|
|
|
|
|
|
|
|||||||||||||
| Ending Balance |
$ | 2,604 | $ | 1,353 | $ | 1,092 | $ | 938 | ||||||||||||
|
|
|
|
|
|
|
|
|
|||||||||||||
Interest and penalties associated with uncertain tax positions are recognized as components of Income tax provision (benefit) in the consolidated statements of operations. There was no material change to tax-related interest and penalties during the Successor year ended December 31, 2015, the Successor Period ended December 31, 2014, the Predecessor Period ended March 31, 2014 and the Predecessor year ended December 31, 2013. As of December 31, 2015 and 2014, respectively, the Company has a liability for interest and penalties of $0.6 million and $0.3 million that is associated with related tax liabilities of $1.8 million and $0.8 million for uncertain tax positions.
The Company operates in various foreign, state and local jurisdictions. The number of tax years for which the statute of limitations remains open for foreign, state and local jurisdictions varies by jurisdiction and is approximately four years (2012 through 2015). For federal tax purposes, the Company’s open tax years are 2012, 2013, 2014 and 2015.
F-35
Table of Contents
13. MISCELLANEOUS (EXPENSE) INCOME, NET
Miscellaneous (expense) income, net consisted of the following (in thousands):
| SUCCESSOR | PREDECESSOR | |||||||||||||||||||
| YEAR ENDED DECEMBER 31, 2015 |
PERIOD ENDED DECEMBER 31, 2014 |
PERIOD ENDED MARCH 31, 2014 |
YEAR ENDED DECEMBER 31, 2013 |
|||||||||||||||||
| Net loss on foreign-currency transactions |
$ | (1,307 | ) | $ | (1,156 | ) | $ | (114 | ) | $ | (338 | ) | ||||||||
| Impairment loss on equity investment |
— | — | — | (2,250 | ) | |||||||||||||||
| Loss on extinguishment of debt |
— | — | — | (1,523 | ) | |||||||||||||||
| Other income |
174 | 855 | 1,327 | 2,393 | ||||||||||||||||
|
|
|
|
|
|
|
|
|
|||||||||||||
| Miscellaneous (expense) income, net |
$ | (1,133 | ) | $ | (301 | ) | $ | 1,213 | $ | (1,718 | ) | |||||||||
|
|
|
|
|
|
|
|
|
|||||||||||||
14. RELATED PARTY TRANSACTIONS
Employee Loans
The Company periodically extends short term loans or advances to employees, typically upon commencement of employment. Total receivables as a result of these employee advances of $0.2 million and $0.3 million existed at December 31, 2015 and December 31, 2014, respectively and are included in the Prepaid expenses and other current assets line item of the consolidated balance sheets.
Management Fees
During the Successor year ended December 31, 2015 and the Successor Period ended December 31, 2014, the Successor Company incurred management fees to Cinven of $0.3 million and $0.2 million and $0.1 million and $0.1 million in related travel expenses, respectively. As of the Successor year ended December 31, 2015 and the Successor Period ended December 31, 2014, respectively, the Company had outstanding accounts payable to Cinven of $0.1 million and $0.1 million. The Successor and Predecessor paid Transaction-related expenses on behalf of or to Cinven and CCMP.
The Predecessor Company was obligated to pay management fees to a subsidiary of CCMP and incurred $0.1 million and $0.3 million in such fees during the Predecessor Period ended March 31, 2014 and the Predecessor year ended December 31, 2013, respectively.
Consulting Fees
In 2014, the Successor Company paid $1.7 million in consulting fees to an investment banking firm in connection with the Transaction. A managing member of this firm was previously a Medpace board member.
Related Party Capital Lease
The Company assumed a capital lease with a former employee associated with the Company’s medical device operations. The capital lease liability is $0.1 million and $0.1 million as of December 31, 2015 and 2014, respectively. The Company made lease payments that were inclusive of interest expense totaling $0.1 million, $0.1 million and $0.1 million during the Successor year ended December 31, 2015, the Successor Period ended December 31, 2014 and the Predecessor year ended December 31, 2013, respectively.
Service Agreements
Symplmed Pharmaceuticals, LLC (“Symplmed”)
During 2013, the chief executive officer of Medpace acquired a majority ownership interest in Symplmed, a new pharmaceutical development company, and was elected to the board of directors along with two other executives. Also in 2013, Medpace entered into a Master Services Agreement (“MSA”) with Symplmed to perform clinical trials.
In 2013, the Predecessor Company evaluated its relationship with Symplmed and concluded that Symplmed was not a variable interest entity. As the Company has no direct ownership interest or relationship other than the MSA, there were no other factors that required consolidation of Symplmed’s financial results.
F-36
Table of Contents
During 2014 and 2015, the chief executive officer and other executives of Medpace made equity investments in Symplmed. Also in 2014, Symplmed entered into an Amended Master Services Agreement (the “Amended MSA”) with Medpace. The Amended MSA provides for a revised financing arrangement which allows for Symplmed to defer payments of the services provided by the Company while incurring premium service charges as consideration for the deferred payment concessions.
The equity contributions made by the Medpace executives prompted the Successor Company to reassess whether Symplmed is a variable interest entity. Based on the evaluation performed, Symplmed is not a variable interest entity and no other direct ownership interests exist that would require consolidation of Symplmed’s financial results.
During the Successor year ended December 31, 2015 and the Successor Period ended December 31, 2014 the Company recognized related party transactions of $1.2 million and $1.2 million as service revenue in the consolidated statements of operations, respectively. As of December 31, 2015 the Company had accounts receivable from Symplmed of $0.3 million recorded in the consolidated balance sheet.
Coherus BioSciences, Inc. (“Coherus”) and MX II Associates, LLC (“MXII”)
During 2011 a related party of the Company in which the Company’s chief executive officer is the managing member, MXII, made an investment in Coherus. In early 2012 the Company made a $2.5 million investment in Coherus. Concurrent with the initial investment, MXII secured the exclusive rights for Medpace to perform Phase I through Phase III clinical trial work for certain Coherus’ “bio-similar” drug compounds executed through a MSA. In return, Medpace agreed to pay a 10% sales commission to MXII on cash received from Coherus. The commission agreement between the Company and MXII was terminated during 2015 but did not impact the MSA between the Company and Coherus. Accordingly, Medpace paid a $0.3 million sales commission during 2012 pursuant to a $2.5 million advance payment received from Coherus for the aforementioned clinical trial work. In addition, Medpace paid commissions of $1.1 million, $0.6 million and $0.3 million during the Successor year ended December 31, 2015, the Successor Period ended December 31, 2014 and the Predecessor Period ended March 31, 2014, respectively, and were recorded in Selling, general and administrative in the consolidated statements of operations. During the Successor year ended December 31, 2015, the Successor Period ended December 31, 2014, the Predecessor Period ended March 31, 2014 and the Predecessor year ended December 31, 2013, the Company recognized service revenue of $22.1 million, $10.6 million, $2.0 million, and $3.3 million from Coherus in the Company’s consolidated statements of operations, respectively. In addition, the company recognized Reimbursed out-of-pocket revenue and Reimbursed out-of-pocket expenses with Coherus in the consolidated statements of operations of $6.9 million, $2.0 million, $0.1 million and $0.1 million during the Successor year ended December 31, 2015, the Successor Period ended December 31, 2014, the Predecessor Period ended March 31, 2014 and the Predecessor year ended December 31, 2013, respectively. As of December 31, 2015 and December 31, 2014 the Company had accounts receivable from Coherus of $2.0 million and $0.7 million recorded in the consolidated balance sheets, respectively. In addition, the Company had Advanced billings of $8.4 million and $5.3 million and Pre-funded study costs of $3.5 million and $2.4 million with Coherus recorded in the consolidated balance sheets at December 31, 2015 and 2014, respectively.
As of December 31, 2013, the Predecessor Company recorded an impairment loss of $2.3 million on its cost method investment in Coherus in contemplation of the ultimate liquidation of this investment prior to the Transaction. The impairment loss is reflected as a component of Miscellaneous (expense) income, net in the consolidated statements of operations. In March 2014, the investment was sold to Medpace Investors for $0.3 million and was reflected in the other income component of Miscellaneous (expense) income, net in the consolidated statements of operations for the Predecessor Period ended March 31, 2014.
Xenon Pharmaceuticals, Inc. (“Xenon”)
Certain executives and employees of the Company, including the chief executive officer, have equity investments in Xenon, a clinical-stage biopharmaceutical company. In addition, a Medpace employee was a director of Xenon until May 2015. During July 2015 the Company and Xenon entered into an amended MSA agreement for the Company to provide certain clinical development services. During the Successor year ended December 31, 2015 the Company recognized service revenue of $0.7 million in the Company’s consolidated statements of operations. As of December 31, 2015, the Company had $1.8 million and $0.2 million of Advanced billings and Pre-funded study costs, respectively, in the consolidated balance sheets.
F-37
Table of Contents
Medpace Investors, LLC
Medpace Investors is a noncontrolling shareholder and related party of Medpace Holdings, Inc. Medpace Investors is owned and managed by employees of the Company. The chief executive officer of Medpace is also the manager and majority unit holder of Medpace Investors. The Successor Company acts as a paying agent for Medpace Investors with taxing authorities principally in instances when employee tax payments or remittance of withholdings related to equity compensation are required. During the Successor year ended December 31, 2015 and the Successor Period ended December 31, 2014, the Successor Company paid $0.9 million and $1.4 million to various taxing authorities on behalf of Medpace Investors.
Leased Real Estate
Headquarters Lease
The Predecessor Company entered into an operating lease with 100 Medpace Way, LLC (“100 MW”), which is wholly owned by the chief executive officer of the Company, for an initial term of twelve years with a renewal option for one 10-year term at prevailing market rates. The Company pays rent, taxes, insurance, and maintenance expenses that arise from the use of the property. Annual base rent in effect at December 31, 2015 under the lease agreement is $2.1 million. The lease allows for adjustments to the rental rate annually for increases in the consumer price index.
For the Successor year ended December 31, 2015, the Successor Period ended December 31, 2014, the Predecessor Period ended March 31, 2014 and the Predecessor year ended December 31, 2013, lease expense for 100 MW of $2.1 million, $1.6 million, $0.5 million and $2.1 million, respectively, was allocated between Direct costs, excluding depreciation and amortization, and Selling, general and administrative in the consolidated statements of operations. Additionally, the Successor Company prepaid $0.2 million in lease payments to 100 MW which is recorded as a component of Prepaid expenses and other current assets on the consolidated balance sheet at December 31, 2014.
Deemed Assets and Deemed Landlord Liabilities
The Predecessor Company entered into two multi-year leases of office space commencing in July 2012 and September 2012 with 200 Medpace Way, LLC (“200 MW”) and 300 Medpace Way, LLC (“300 MW”), respectively. Both 200 MW and 300 MW are wholly owned by the Company’s chief executive officer and certain of his immediate family. The Company recognizes Deemed landlord liabilities according to their term in the consolidated balance sheets. The obligation was initially recorded by the Predecessor Company at its net present value using the notional rates implicit in the lease agreements. The Successor Company revalued the liability by calculating the net present value using the Company’s incremental borrowing rate at the time of the Transaction. Accretion expense is being recorded over the term of the lease as a component of Interest expense, net in the Company’s consolidated statements of operations. During the Successor year ended December 31, 2015, the Successor Period ended December 31, 2014, the Predecessor Period ended March 31, 2014 and the Predecessor year ended December 31, 2013, the Company paid $3.4 million, $3.1 million, $0.9 million and $2.7 million, respectively, in rents, which are accounted for as principal and interest payments on the Deemed landlord liability in accordance with the accounting guidance governing such transactions.
Travel Services
ATSB Aviation
The Company incurs expenses for travel services for company executives provided by a private aviation charter company which is owned by the chief executive officer and another executive of the Company (“Private Aviation Charter”). The Company may contract directly with the private aviation charter for the use of its aircraft or indirectly through a third party aircraft management and jet charter company (the “Aircraft Management Company”). The travel services provided are primarily for business purposes, with any personal travel paid for as part of the executives’ compensation arrangements. The Aircraft Management Company also makes the Private Aviation Charter aircraft available to other third parties. The Company incurred travel expenses of $0.9 million, $0.5 million and $0.1 million during the Successor year ended December 31, 2015, the Successor Period ended December 31, 2014 and the Predecessor Period ended March 31, 2014, respectively, related to these travel services, and are recorded in Selling, general and administrative in the Company’s consolidated statements of operations.
F-38
Table of Contents
Common Stock Purchases
During 2015, an employee of the Company entered into a stock purchase agreement (“SPA”) with the Company that permitted the purchase of 37,037 shares of the Company’s common stock at the then-current value for those shares. There was no stock-based compensation expense recognized in relation to the SPA due to no required services to be rendered in exchange for shares. The proceeds from this SPA are reflected as Proceeds from sale of common stock in the consolidated statement of cash flows for the Successor year ended 2015.
During 2013, the chief executive officer of the Company entered into a SPA with the Company that permitted him to purchase 120,000 shares of the Company’s common stock at the then-current market value for those shares. In exchange, the chief executive officer agreed to forfeit his ownership of 80,000 unvested stock options that were originally scheduled to vest at various dates through 2016. The proceeds from this stock purchase are reflected as Stock issued and Proceeds from sale of common stock, respectively, in the Predecessor Company’s consolidated statement of shareholders’ equity and consolidated statement of cash flows for the Predecessor year ended December 31, 2013.
Assets and Obligations Related to Former Owners
Pursuant to the Medpace, Inc. Stock Purchase Agreement dated June 17, 2011 (the “Predecessor Purchase Agreement”), certain tax indemnifications between the sellers (a group led by the former majority shareholder who is the current chief executive officer, the “Former Owners”) and the buyers (led by CCMP) were entered into regarding contingencies that could arise after the June 17, 2011 transaction, as well as tax payments or refunds that were finalized after June 17, 2011 but which relate to periods prior to the Predecessor Purchase Agreement date. In February 2015, a settlement was reached with a local taxing authority regarding the refund of income tax payments made by the Company prior to June 17, 2011. On the consolidated balance sheets at December 31, 2015 and 2014, the Successor has $0.4 million and $0.6 million in Prepaid expenses and other current assets and Other assets related to the tax refund due from the local taxing authority and $0.4 million and $0.6 million in Other current liabilities and Other long-term liabilities representing the obligation to the Former Owners. The Successor has $0.1 million and $0.1 million in Prepaid expenses and other current assets and $0.1 million and $0.3 million in Other current liabilities on the consolidated balance sheets at December 31, 2015 and 2014, associated with refunds from various other taxing authorities that were generated prior to June 17, 2011.
15. ACQUISITION AND INTEGRATION EXPENSES
The Successor Company and the Predecessor Company incurred $9.3 million and $12.4 million of one-time Acquisition and integration expenses related to the Transaction during the Successor Period ended December 31, 2014 and the Predecessor Period ended March 31, 2014, respectively, primarily for investment banking, legal, accounting, consulting and other advisory fees.
16. ENTITY WIDE DISCLOSURES
Operations By Geographic Location
The Company conducts operations in North America, Europe, Africa, Asia-Pacific and Latin America through wholly-owned subsidiaries and representative sales offices. The Company attributes service revenue to geographical locations based upon the location of the contracting entity. Service revenue attributable to the U.S. represent approximately 98% of total consolidated service revenue, net. No other country or region represents more than 5% of service revenue, net.
F-39
Table of Contents
The following table summarizes property and equipment, net by geographic region and is further broken down to show countries which account for 10% or more of total as of December 31, (in thousands):
| SUCCESSOR | ||||||||
| 2015 | 2014 | |||||||
| Property and equipment, net: |
||||||||
| United States |
$ | 28,152 | $ | 29,928 | ||||
| Europe: |
||||||||
| Belgium |
3,896 | 3,947 | ||||||
| Other |
3,968 | 2,719 | ||||||
|
|
|
|
|
|||||
| Total Europe |
7,864 | 6,666 | ||||||
| Other |
1,496 | 1,490 | ||||||
|
|
|
|
|
|||||
| Total property and equipment, net |
$ | 37,512 | $ | 38,084 | ||||
|
|
|
|
|
|||||
Products & Services
Clinical research services and laboratory services represented approximately 87% and 13%, 85% and 15%, 85% and 15%, and 86% and 14% of consolidated service revenue, net for the Successor year ended December 31, 2015 and period ended December 31, 2014 and the Predecessor Period ended March 31, 2014 and year ended December 31, 2013, respectively.
17. SUBSEQUENT EVENTS
The Company has evaluated subsequent events through March 1, 2016, the date the consolidated financial statements were available to be issued, and July 25, 2016, the date on which the retrospectively revised Successor consolidated financial statements were issued (as to the reverse stock split described in Note 3), and determined that the following event required recognition or disclosure in the financial statements:
As disclosed in Note 3, on July 25, 2016, the Board of Directors of the Company approved, and made legally effective, a 1-for-1.35 reverse stock split of the Company’s common stock. All share, stock option and per share information presented in the Successor consolidated financial statements have been adjusted to reflect the reverse stock split on a retroactive basis for all periods presented. The Company will make a cash payment to shareholders for all fractional shares which would have otherwise been required to be issued as a result of the reverse stock split. There was no change in number of authorized shares or the par value of the Company’s common stock.
F-40
Table of Contents
MEDPACE HOLDINGS, INC. AND SUBSIDIARIES
CONDENSED CONSOLIDATED BALANCE SHEETS (UNAUDITED)
(Amounts in thousands, except share amounts)
| AS OF | ||||||||
| JUNE 30, 2016 |
DECEMBER 31, 2015 |
|||||||
| ASSETS |
||||||||
| Current assets: |
||||||||
| Cash and cash equivalents |
$ | 13,674 | $ | 14,880 | ||||
| Restricted cash |
3,366 | 2,857 | ||||||
| Accounts receivable and unbilled, net (includes $3.8 million and $2.9 million with related parties at June 30, 2016 and December 31, 2015, respectively) |
90,048 | 65,088 | ||||||
| Prepaid expenses and other current assets |
20,402 | 11,896 | ||||||
|
|
|
|
|
|||||
| Total current assets |
127,490 | 94,721 | ||||||
| Property and equipment, net |
40,168 | 37,512 | ||||||
| Goodwill |
660,981 | 660,981 | ||||||
| Intangible assets, net |
161,407 | 186,743 | ||||||
| Deferred income taxes |
126 | 157 | ||||||
| Other assets |
4,691 | 3,927 | ||||||
|
|
|
|
|
|||||
| Total assets |
$ | 994,863 | $ | 984,041 | ||||
|
|
|
|
|
|||||
| LIABILITIES AND SHAREHOLDERS’ EQUITY |
||||||||
| Current liabilities: |
||||||||
| Accounts payable |
$ | 7,227 | $ | 8,728 | ||||
| Accrued expenses |
18,683 | 20,111 | ||||||
| Pre-funded study costs (includes $4.3 million and $3.7 million with related parties at June 30, 2016 and December 31, 2015, respectively) |
48,971 | 46,599 | ||||||
| Advanced billings (includes $11.5 million and $10.2 million with related parties at June 30, 2016 and December 31, 2015, respectively) |
66,084 | 51,051 | ||||||
| Other current liabilities |
8,785 | 7,528 | ||||||
|
|
|
|
|
|||||
| Total current liabilities |
149,750 | 134,017 | ||||||
| Long-term debt, net, less current portion |
364,033 | 377,882 | ||||||
| Deemed landlord liability, less current portion |
29,425 | 30,273 | ||||||
| Deferred income tax liability |
20,587 | 21,104 | ||||||
| Other long-term liabilities |
8,432 | 7,291 | ||||||
|
|
|
|
|
|||||
| Total liabilities |
572,227 | 570,567 | ||||||
| Commitments and contingencies (see Note 10) |
||||||||
| Shareholders’ equity: |
||||||||
| Common stock—$0.01 par-value; 60,000,000 shares authorized; 32,642,113 and 32,624,461 shares issued and outstanding at June 30, 2016 and December 31, 2015, respectively |
326 | 326 | ||||||
| Additional paid-in capital |
439,460 | 438,716 | ||||||
| Accumulated deficit |
(14,599 | ) | (23,009 | ) | ||||
| Accumulated other comprehensive loss |
(2,551 | ) | (2,559 | ) | ||||
|
|
|
|
|
|||||
| Total shareholders’ equity |
422,636 | 413,474 | ||||||
|
|
|
|
|
|||||
| Total liabilities and shareholders’ equity |
$ | 994,863 | $ | 984,041 | ||||
|
|
|
|
|
|||||
See notes to condensed consolidated financial statements.
F-41
Table of Contents
MEDPACE HOLDINGS, INC. AND SUBSIDIARIES
CONDENSED CONSOLIDATED STATEMENTS OF OPERATIONS (UNAUDITED)
(Amounts in thousands, except per share amounts)
| SIX MONTHS ENDED JUNE 30, |
||||||||
| 2016 | 2015 | |||||||
| Revenue: |
||||||||
| Service revenue, net (includes $12.4 million and $11.5 million with related parties for the six months ended June 30, 2016 and 2015, respectively) |
$ | 180,433 | $ | 152,782 | ||||
| Reimbursed out-of-pocket revenue (includes $2.9 million and $4.2 million with related parties for the six months ended June 30, 2016 and 2015, respectively) |
25,107 | 18,105 | ||||||
|
|
|
|
|
|||||
| Total revenue |
205,540 | 170,887 | ||||||
| Operating Expenses: |
||||||||
| Direct costs, excluding depreciation and amortization |
96,215 | 77,725 | ||||||
| Reimbursed out-of-pocket expenses (includes $2.9 million and $4.2 million with related parties for the six months ended June 30, 2016 and 2015, respectively) |
25,107 | 18,105 | ||||||
| Selling, general and administrative |
28,333 | 23,448 | ||||||
| Depreciation |
3,566 | 3,110 | ||||||
| Amortization |
25,336 | 34,243 | ||||||
|
|
|
|
|
|||||
| Total operating expenses |
178,557 | 156,631 | ||||||
|
|
|
|
|
|||||
| Income from operations |
26,983 | 14,256 | ||||||
| Other Expense, Net: |
||||||||
| Miscellaneous expense, net |
(941 | ) | (978 | ) | ||||
| Interest expense, net |
(11,894 | ) | (13,975 | ) | ||||
|
|
|
|
|
|||||
| Total other expense, net |
(12,835 | ) | (14,953 | ) | ||||
|
|
|
|
|
|||||
| Income (loss) before income taxes |
14,148 | (697 | ) | |||||
| Income tax provision (benefit) |
5,738 | (733 | ) | |||||
|
|
|
|
|
|||||
| Net income |
$ | 8,410 | $ | 36 | ||||
|
|
|
|
|
|||||
| Net income per share attributable to common shareholders: |
||||||||
| Basic |
$ | 0.26 | $ | — | ||||
| Diluted |
$ | 0.26 | $ | — | ||||
| Weighted average common shares outstanding: |
||||||||
| Basic |
32,631 | 31,527 | ||||||
| Diluted |
32,631 | 31,591 | ||||||
See notes to condensed consolidated financial statements.
F-42
Table of Contents
MEDPACE HOLDINGS, INC. AND SUBSIDIARIES
CONDENSED CONSOLIDATED STATEMENTS OF COMPREHENSIVE INCOME (LOSS) (UNAUDITED)
(Amounts in thousands)
| SIX MONTHS ENDED JUNE 30, |
||||||||
| 2016 | 2015 | |||||||
| Net income |
$ | 8,410 | $ | 36 | ||||
| Other comprehensive income (loss) |
||||||||
| Foreign currency translation adjustments, net of taxes |
8 | (395 | ) | |||||
|
|
|
|
|
|||||
| Comprehensive income (loss) |
$ | 8,418 | $ | (359 | ) | |||
|
|
|
|
|
|||||
See notes to condensed consolidated financial statements.
F-43
Table of Contents
MEDPACE HOLDINGS, INC. AND SUBSIDIARIES
CONDENSED CONSOLIDATED STATEMENT OF SHAREHOLDERS’ EQUITY (UNAUDITED)
(Amounts in thousands)
| COMMON STOCK |
ADDITIONAL PAID-IN CAPITAL |
(ACCUMULATED DEFICIT) RETAINED EARNINGS |
ACCUMULATED OTHER COMPREHENSIVE INCOME (LOSS) |
TOTAL | ||||||||||||||||
| BALANCE—December 31, 2015 |
$ | 326 | $ | 438,716 | $ | (23,009 | ) | $ | (2,559 | ) | $ | 413,474 | ||||||||
| Net income |
8,410 | 8,410 | ||||||||||||||||||
| Foreign currency translation |
8 | 8 | ||||||||||||||||||
| Stock-based compensation expense |
557 | 557 | ||||||||||||||||||
| Stock options exercised |
187 | 187 | ||||||||||||||||||
|
|
|
|
|
|
|
|
|
|
|
|||||||||||
| BALANCE—June 30, 2016 |
$ | 326 | $ | 439,460 | $ | (14,599 | ) | $ | (2,551 | ) | $ | 422,636 | ||||||||
|
|
|
|
|
|
|
|
|
|
|
|||||||||||
See notes to condensed consolidated financial statements.
F-44
Table of Contents
MEDPACE HOLDINGS, INC. AND SUBSIDIARIES
CONDENSED CONSOLIDATED STATEMENTS OF CASH FLOWS (UNAUDITED)
(Amounts in thousands)
| SIX MONTHS ENDED JUNE 30, |
||||||||
| 2016 | 2015 | |||||||
| CASH FLOWS FROM OPERATING ACTIVITIES: |
||||||||
| Net income |
$ | 8,410 | $ | 36 | ||||
| Adjustments to reconcile net income to net cash provided by operating activities: |
||||||||
| Depreciation |
3,566 | 3,110 | ||||||
| Amortization |
25,336 | 34,243 | ||||||
| Stock-based compensation expense |
4,275 | 4,905 | ||||||
| Amortization of debt issuance costs and discount |
1,345 | 1,328 | ||||||
| Deferred income tax benefit |
(483 | ) | (6,504 | ) | ||||
| Other |
(207 | ) | 195 | |||||
| Changes in assets and liabilities: |
||||||||
| Restricted cash |
(509 | ) | (595 | ) | ||||
| Accounts receivable and unbilled, net |
(24,825 | ) | 6,740 | |||||
| Prepaid expenses and other current assets |
(8,551 | ) | (1,579 | ) | ||||
| Accounts payable |
(2,112 | ) | (720 | ) | ||||
| Accrued expenses |
(1,461 | ) | (2,849 | ) | ||||
| Pre-funded study costs |
2,372 | (1,252 | ) | |||||
| Advanced billings |
15,017 | (6,532 | ) | |||||
| Other assets and liabilities, net |
(2,191 | ) | (4,255 | ) | ||||
|
|
|
|
|
|||||
| Net cash provided by operating activities |
19,982 | 26,271 | ||||||
|
|
|
|
|
|||||
| CASH FLOWS FROM INVESTING ACTIVITIES: |
||||||||
| Property and equipment expenditures |
(5,693 | ) | (2,665 | ) | ||||
| Other |
40 | 7 | ||||||
|
|
|
|
|
|||||
| Net cash used in investing activities |
(5,653 | ) | (2,658 | ) | ||||
|
|
|
|
|
|||||
| CASH FLOWS FROM FINANCING ACTIVITIES: |
||||||||
| Proceeds from stock option exercises |
102 | — | ||||||
| Payment of debt |
(15,036 | ) | (65,126 | ) | ||||
| Payment of deemed landlord liability |
(744 | ) | (576 | ) | ||||
|
|
|
|
|
|||||
| Net cash used in financing activities |
(15,678 | ) | (65,702 | ) | ||||
|
|
|
|
|
|||||
| EFFECTS OF EXCHANGE RATES ON CASH AND CASH EQUIVALENTS |
143 | (95 | ) | |||||
| DECREASE IN CASH AND CASH EQUIVALENTS |
(1,206 | ) | (42,184 | ) | ||||
| CASH AND CASH EQUIVALENTS—Beginning of period |
14,880 | 54,285 | ||||||
|
|
|
|
|
|||||
| CASH AND CASH EQUIVALENTS—End of period |
$ | 13,674 | $ | 12,101 | ||||
|
|
|
|
|
|||||
See notes to condensed consolidated financial statements.
F-45
Table of Contents
MEDPACE HOLDINGS, INC. AND SUBSIDIARIES
NOTES TO CONDENSED CONSOLIDATED FINANCIAL STATEMENTS (Unaudited)
JUNE 30, 2016
1. BASIS OF PRESENTATION
Description of Business
Medpace Holdings, Inc. together with its subsidiaries (“Medpace” or the “Company”) is a global provider of clinical research-based drug and medical device development services. The Company partners with pharmaceutical, biotechnology, and medical device companies in the development and execution of clinical trials. The Company’s drug development services focus on full service Phase I-IV clinical development services and include development plan design, coordinated central laboratory, project management, regulatory affairs, clinical monitoring, data management and analysis, pharmacovigilance new drug application submissions, and post-marketing clinical support. The Company also provides bio-analytical laboratory services, clinical human pharmacology, imaging services, and electrocardiography reading support for clinical trials.
The Company’s operations are principally based in North America, Europe, and Asia.
Unaudited Interim Financial Information
The interim condensed consolidated financial statements include the accounts of the Company, are prepared in conformity with U.S. generally accepted accounting principles (“GAAP”), and are unaudited. In the opinion of the Company’s management, all adjustments of a normal recurring nature necessary for a fair presentation have been reflected. Certain financial information that is normally included in annual financial statements prepared in accordance with GAAP, but that is not required for interim reporting purposes, has been omitted. The accompanying interim condensed consolidated financial statements and related notes should be read in conjunction with the Company’s consolidated financial statements and related notes included in the Company’s audited financial statements for the year ended December 31, 2015.
The preparation of the interim condensed consolidated financial statements in conformity with GAAP requires management to make estimates and assumptions that affect the reported amounts of assets and liabilities and disclosure of contingent assets and liabilities at the date of the interim condensed consolidated financial statements and the reported amounts of revenues and expenses during the reporting period. Actual results and outcomes could differ from management’s estimates and assumptions.
Stock Split
On July 25, 2016, the Board of Directors of the Company approved, and made legally effective, a 1-for-1.35 reverse stock split of the Company’s common stock. All share, stock option and per share information presented in the condensed consolidated financial statements have been adjusted to reflect the reverse stock split on a retroactive basis for all periods presented. The Company will make a cash payment to shareholders for all fractional shares which would have otherwise been required to be issued as a result of the reverse stock split. There was no change in number of authorized shares or the par value of the Company’s common stock.
Recently Adopted Accounting Standards
In April 2015, the Financial Accounting Standards Board (“FASB”) issued Accounting Standards Update (“ASU”) 2015-05, “Customer’s Accounting for Fees Paid in a Cloud Computing Arrangement,” which provides guidance for a customer’s accounting for cloud computing costs. Under ASU 2015-05, if a software cloud computing arrangement contains a software license, customers should account for the license element of the arrangement in a manner consistent with the acquisition of other software licenses. If the arrangement does not contain a software license, customers should account for the arrangement as a service contract. This standard may be applied prospectively to all arrangements entered into or materially modified after the effective date, or retrospectively. The Company adopted ASU 2015-05 in the first quarter of 2016. There was no impact to the Company’s condensed consolidated statements of operations, comprehensive (loss) income, shareholders’ equity or cash flows.
Recently Issued Accounting Standards
In June 2016, the FASB issued ASU 2016-13, Financial Instruments-Credit Losses (Topic 326), Measurement of Credit Losses on Financial Instruments. The new guidance adds Topic 326 to the Codification and removes the thresholds that companies apply to measure credit losses on financial instruments measured at amortized cost, such
F-46
Table of Contents
as loans, receivables, and held-to-maturity debt securities. Under current U.S. GAAP, companies generally recognize credit losses when it is probable that the loss has been incurred. The revised guidance will remove all recognition thresholds and will require companies to recognize an allowance for credit losses for the difference between the amortized cost basis of a financial instrument and the amount of amortized cost that the company expects to collect over the instrument’s contractual life. ASU 2016-13 will be applied on a prospective basis for fiscal years and interim periods beginning after December 15, 2019, with early adoption permitted for fiscal years beginning and interim periods beginning after December 15, 2018. The Company is currently evaluating the effect this standard will have on its condensed consolidated financial statements.
In May 2016, the FASB issued ASU 2016-12, Narrow-Scope Improvements and Practical Expedients. In March 2016, the FASB issued ASU 2016-08, Revenue from Contracts with Customers (Topic 606): Principal versus Agent Considerations (Reporting Revenue Gross versus Net). In April 2016, the FASB issued ASU 2016-10, Revenue from Contracts with Customers (Topic 606): Identifying Performance Obligations and Licensing. ASUs’ 2016-12, 2016-10 and 2016-08 all clarify the interpretation guidance in ASU No. 2014-09, “Revenue from Contracts with Customers” specifically related to narrowing specific aspects of Topic 606 and adding illustrative examples to assist in the application of the guidance. The effective date and transition requirements in ASUs’ 2016-12, 2016-10, and 2016-08 are the same as the effective date and transition requirements of ASU 2014-09. ASU 2015-14, Revenue from Contracts with Customers (Topic 606): Deferral of the Effective Date, which defers the effective date of ASU 2014-09 by one year. The Company will adopt the clarified guidance in ASUs’ 2016-12, 2016-10, 2016-08 by January 1, 2018, as required. The Company is currently evaluating the impact of this new standard on its condensed consolidated financial statements.
In March 2016, the FASB issued ASU No. 2016-09, Improvements to Employee Share-Based Payment Accounting. The new guidance is intended to simplify certain aspects of accounting for share-based payments to employees including the accounting for income taxes, forfeitures, and statutory tax withholding requirements, as well as classification in the statement of cash flows. ASU 2016-09 is effective for fiscal years beginning after December 15, 2016, and for interim periods within those fiscal years. Early adoption is permitted, but all guidance must be adopted in the same period. The Company is currently evaluating the effect this standard will have on its condensed consolidated financial statements.
In February 2016, the FASB issued ASU 2016-02, Leases (Topic 842). The guidance in ASU 2016-02 supersedes the lease recognition requirements in ASC Topic 840, Leases (FAS 13). ASU 2016-02 requires an entity to recognize assets and liabilities arising from a lease for both financing and operating leases, along with additional qualitative and quantitative disclosures. ASU 2016-02 will be applied on a modified retrospective basis and to each prior reporting period presented and is effective for fiscal years beginning after December 15, 2018, with early adoption permitted. The Company is currently evaluating the effect this standard will have on its condensed consolidated financial statements.
2. NET INCOME (LOSS) PER SHARE
Basic and diluted earnings per share (“EPS”) are computed using the two-class method, which is an earnings allocation that determines EPS for each class of common stock and participating securities according to dividends declared and participation rights in undistributed earnings. Basic net income (loss) per share is calculated by dividing net income (loss) by the weighted average number of common shares outstanding, including outstanding participating securities. Diluted net income (loss) per share is similar to basic net income (loss) per share, but adjusts for the potential issuance of common shares. The Company’s restricted stock awards (“RSAs”) contain non-forfeitable rights or dividend equivalents and participate in periods of net income but are not contractually obligated to share in the Company’s losses. As a result, RSAs are included in the number of shares in our basic and diluted EPS in periods of net income but are excluded in the number of shares in our basic and diluted EPS in periods of net loss.
F-47
Table of Contents
The following table reconciles the basic to diluted weighted average shares outstanding (in thousands):
| SIX MONTHS ENDED JUNE 30, |
||||||||
| 2016 | 2015 | |||||||
| Basic weighted average common shares outstanding |
32,631 | 31,527 | ||||||
| Effect of dilutive securities |
— | 64 | ||||||
|
|
|
|
|
|||||
| Diluted weighted average common shares outstanding |
32,631 | 31,591 | ||||||
|
|
|
|
|
|||||
| Anti-dilutive shares |
26 | 599 | ||||||
|
|
|
|
|
|||||
The anti-dilutive shares disclosed above were calculated using the treasury stock method. During the six months ended June 30, 2016 and June 30, 2015, the Company had stock options that were excluded due to the exercise price exceeding the average fair value of the Company’s common stock during the period.
3. FAIR VALUE MEASUREMENTS
The Company follows accounting guidance related to fair value measurements that defines fair value, establishes a framework for measuring fair value, and establishes a hierarchy for inputs used in measuring fair value. This hierarchy maximizes the use of “observable” inputs and minimizes the use of unobservable inputs by requiring that the most observable inputs be used when available. The hierarchy specifies three levels based on the inputs, as follows:
Level 1: Valuations based on quoted prices in active markets for identical assets or liabilities.
Level 2: Valuations based on directly observable inputs or unobservable inputs corroborated by market data.
Level 3: Valuations based on unobservable inputs supported by little or no market activity representing management’s determination of assumptions of how market participants would price the assets or liabilities.
The fair value of financial instruments such as cash and cash equivalents, accounts receivable and unbilled, net, accounts payable, accrued expenses and advanced billings approximate their carrying amounts due to their short term maturities.
The Company does not have any recurring fair value measurements as of June 30, 2016. There were no transfers between Level 1, Level 2 or Level 3 during the three or six months ended June 30, 2016 or June 30, 2015.
Non-recurring Fair Value Measurements
Certain assets are measured on the accompanying interim condensed consolidated balance sheets at cost and are not remeasured to fair value on a recurring basis. These assets, which include indefinite-lived intangible assets and goodwill, are tested for impairment annually during the fourth quarter or when a triggering event occurs. Total assets carried on the balance sheet that are not remeasured to fair value on a recurring basis, identified as Level 3 measurements, as of June 30, 2016 are $692.6 million, comprised of $661.0 million of goodwill and $31.6 million of identified indefinite-lived intangible assets.
4. ACCOUNTS RECEIVABLE AND UNBILLED, NET
Accounts receivable and unbilled, net includes service revenue and reimbursed out-of-pocket revenue. Accounts receivable and unbilled, net consisted of the following (in thousands):
| AS OF | ||||||||
| JUNE 30, 2016 |
DECEMBER 31, 2015 |
|||||||
| Accounts receivable |
$ | 67,701 | $ | 40,721 | ||||
| Unbilled |
24,763 | 26,091 | ||||||
| Less allowance for doubtful accounts |
(2,416 | ) | (1,724 | ) | ||||
|
|
|
|
|
|||||
| Total accounts receivable and unbilled, net |
$ | 90,048 | $ | 65,088 | ||||
|
|
|
|
|
|||||
F-48
Table of Contents
5. INTANGIBLE ASSETS, NET
Intangible assets, net consisted of the following (in thousands):
| AS OF | ||||||||
| JUNE 30, 2016 |
DECEMBER 31, 2015 |
|||||||
| Intangible assets: |
||||||||
| Finite-lived intangible assets: |
||||||||
| Carrying amount: |
||||||||
| Backlog |
$ | 72,630 | $ | 72,630 | ||||
| Customer relationships |
145,051 | 145,051 | ||||||
| Developed technologies |
54,475 | 54,475 | ||||||
| Other |
2,505 | 2,505 | ||||||
|
|
|
|
|
|||||
| Total finite-lived intangible assets |
274,661 | 274,661 | ||||||
|
|
|
|
|
|||||
| Accumulated amortization: |
||||||||
| Backlog |
(72,630 | ) | (72,630 | ) | ||||
| Customer relationships |
(46,629 | ) | (26,991 | ) | ||||
| Developed technologies |
(24,514 | ) | (19,066 | ) | ||||
| Other |
(1,127 | ) | (877 | ) | ||||
|
|
|
|
|
|||||
| Total accumulated amortization |
(144,900 | ) | (119,564 | ) | ||||
|
|
|
|
|
|||||
| Total finite-lived intangible assets, net |
129,761 | 155,097 | ||||||
|
|
|
|
|
|||||
| Trade name (indefinite-lived) |
31,646 | 31,646 | ||||||
|
|
|
|
|
|||||
| Total intangible assets, net |
$ | 161,407 | $ | 186,743 | ||||
|
|
|
|
|
|||||
As of June 30, 2016, estimated amortization expense of the Company’s intangible assets for each of the next five years and thereafter is as follows (in thousands):
| AMORTIZATION | ||||
| Remainder of 2016 |
$ | 25,336 | ||
| 2017 |
37,790 | |||
| 2018 |
29,371 | |||
| 2019 |
14,639 | |||
| 2020 |
7,797 | |||
| Later years |
14,828 | |||
|
|
|
|||
| $ | 129,761 | |||
|
|
|
|||
6. ACCRUED EXPENSES
Accrued expenses consisted of the following (in thousands):
| AS OF | ||||||||
| JUNE 30, 2016 |
DECEMBER 31, 2015 |
|||||||
| Employee compensation and benefits |
$ | 14,474 | $ | 17,195 | ||||
| Other |
4,209 | 2,916 | ||||||
|
|
|
|
|
|||||
| Total accrued expenses |
$ | 18,683 | $ | 20,111 | ||||
|
|
|
|
|
|||||
F-49
Table of Contents
7. DEBT
Debt consisted of the following (in thousands):
| AS OF | ||||||||
| JUNE 30, 2016 |
DECEMBER 31, 2015 |
|||||||
| Term loan |
$ | 375,000 | $ | 390,000 | ||||
| Capital lease |
25 | 59 | ||||||
|
|
|
|
|
|||||
| 375,025 | 390,059 | |||||||
| Less unamortized discount |
(1,795 | ) | (1,984 | ) | ||||
| Less unamortized term loan debt issuance costs |
(9,172 | ) | (10,134 | ) | ||||
| Less current portion of long-term debt |
(25 | ) | (59 | ) | ||||
|
|
|
|
|
|||||
| Long-term debt, net, less current portion |
$ | 364,033 | $ | 377,882 | ||||
|
|
|
|
|
|||||
Principal payments on debt are due as follows (in thousands):
| 2016 (remaining) |
$ | 25 | ||
| 2017 |
— | |||
| 2018 |
— | |||
| 2019 |
— | |||
| 2020 and thereafter |
375,000 | |||
|
|
|
|||
| Total |
$ | 375,025 | ||
|
|
|
The estimated fair value of the Company’s term loan based on Level 1 quoted market prices, approximates $372.7 million and $386.3 million as of June 30, 2016 and December 31, 2015, compared to the carrying value of $373.2 million and $388.0 million.
Credit Agreement
On April 1, 2014 the Company entered into a new credit agreement (the “Credit Agreement”), consisting of a $530 million term loan and a $60 million revolving credit facility (“revolver”). The term loan portion of the Credit Agreement expires in April 2021 and the revolver portion expires in April 2019. The Credit Agreement is guaranteed by the Company and its subsidiaries and is subject to customary covenants relating to financial ratios and restrictions on certain types of transactions including restricting the Company’s ability to incur additional indebtedness, acquire and dispose of assets, make investments, pay dividends, or engage in mergers and acquisitions.
Borrowings under the Credit Agreement bear interest at a rate equal to, at our option, either (a) a Eurocurency rate based on LIBOR for U.S. dollar deposits for loans denominated in dollars, EURIBOR for Euro deposits for loans denominated in Euros and the offer rate for any other currencies for loans denominated in such other currencies for the relevant interest period, plus 4.00% per annum if our total net leverage ratio is greater than 4.75:1.00, or 3.75% if our total net leverage ratio is less than or equal to 4.75:1.00; provided that the relevant Eurocurrency rate shall be deemed to be no less than 1.00% per annum; (b) a base rate, which is defined as the highest of (i) the Federal Funds Rate on such day plus 1⁄2 of 1.00%, (ii) the Prime Lending Rate on such day, (iii) the Adjusted Eurocurrency Rate for loans denominated in U.S. dollars published on such day for an Interest Period of one month plus 1.00% and (iv) 2.00%, plus 3.00% per annum if our total net leverage ratio is greater than 4.75:1.00, or 2.75% if our total leverage ratio is less than or equal to 4.75:1.00; provided that the base rate shall be deemed to be no less than 2.00% per annum. We may voluntarily prepay outstanding loans under the Credit Agreement without premium or penalty. As of June 30, 2016, the interest applicable on the term loan was the Eurocurrency minimum floor interest rate of 4.75%.
F-50
Table of Contents
In addition, the Company is required to pay to the lenders a commitment fee of 0.5% quarterly for unused commitments on the revolver, subject to a step-down to 0.375% based upon achievement of a certain leverage ratio as defined within the Credit Agreement. At June 30, 2016 the Company had no outstanding borrowings under the revolver resulting in $60.0 million in undrawn capacity available under the Revolver. In addition, the Company did not have any outstanding letters of credit, which are secured by the revolving credit facilities at June 30, 2016.
Also within the Credit Agreement, if we have drawn greater than 30% of the commitments under the Credit Agreement as of the last date of any quarter, then we are required to report compliance with a financial covenant that is tested at the end of each quarter. This financial covenant requires us to maintain a net debt to consolidated EBITDA leverage ratio (as defined under the Credit Agreement) of less than or equal to 8.00:1.00 for any fiscal quarter ending on or prior to March 31, 2016 and 7.50:1.00, thereafter. As of June 30, 2016, we were in compliance with all covenants under our Credit Agreement.
8. STOCK-BASED COMPENSATION
The Company has a long-term incentive plan (the “Plan”) that provides for long-term equity incentive compensation for key employees, officers and directors. A variety of discretionary awards (collectively, the “Awards”) for employees and non-employee directors are authorized under the Plan, including vested shares, stock options, restricted share awards (“RSAs”), and restricted stock units (“RSUs”). No further grants will be made under the Plan after the consummation of this offering.
The Company granted 34,812 stock options vesting equally over four years and 11,111 restricted awards which immediately vested upon issuance, during the six months ended June 30, 2016.
Stock-based compensation expense recognized in the condensed consolidated statements of operations related to the Awards are summarized below (in thousands):
| SIX MONTHS ENDED JUNE 30, |
||||||||
| 2016 | 2015 | |||||||
| Direct costs |
$ | 2,474 | $ | 3,181 | ||||
| Selling, general and administrative |
1,801 | 1,724 | ||||||
|
|
|
|
|
|||||
| Total stock-based compensation expense |
$ | 4,275 | $ | 4,905 | ||||
|
|
|
|
|
|||||
The majority of the Awards are classified as liability instruments due to a condition upon accepting the awards. Participants must execute a Contribution and Subscription Agreement that provides for the exchange of the shares issued for incentive units in the equity of a non-consolidated related party. The stock-based compensation liability was $7.2 million, of which $4.1 million is included in Other Current Liabilities and $3.1 million is included in Other Long-Term Liabilities in the condensed consolidated balance sheet at June 30, 2016. The stock-based compensation liability was $3.6 million, of which $1.7 million is included in Other Current Liabilities and $1.9 million is included in Other Long-Term Liabilities in the condensed consolidated balance sheet at December 31, 2015.
9. INCOME TAXES
The Company’s effective income tax rate was 40.6% and 105.2% for the six months ended June 30, 2016 and June 30, 2015, respectively. The Company’s effective income tax rate for the six months ended June 30, 2016 varied from the U.S. statutory rate of 35.0% primarily due to the impact of domestic and foreign uncertain tax positions.
F-51
Table of Contents
10. COMMITMENTS AND CONTINGENCIES
Legal Proceedings
The Company is involved in legal proceedings from time to time in the ordinary course of its business, including employment claims and claims related to other business transactions. The Company cannot predict with certainty the outcome of such proceedings, but it believes that adequate reserves have been recorded and losses already recognized with respect to such actions were immaterial as of June 30, 2016 and December 31, 2015. There is a reasonable possibility that a loss exceeding amounts already recognized may be incurred related to these actions; however, the Company believes that such potential losses were immaterial as of June 30, 2016.
Purchase Commitment
In May 2013, the Company committed to the aggregate purchase of $2.0 million of software services from a vendor during the period from June 1, 2013 through May 31, 2016. In return for the commitment, the Company receives preferential fixed rate pricing and a 5% discount on all purchases made pursuant to this agreement during its three-year term. During 2014, the Company met the aggregate purchase commitment.
11. RELATED PARTY TRANSACTIONS
Employee Loans
The Company periodically extends short term loans or advances to employees, typically upon commencement of employment. Total receivables as a result of these employee advances of $0.2 million existed at June 30, 2016 and December 31, 2015, respectively, and are included in the Prepaid expenses and other current assets and Other assets line item of the condensed consolidated balance sheets, respectively, depending on the contractual repayment date.
Management Fees
During the six months ended June 30, 2016, the Company incurred management fees to Cinven Limited of $0.2 million and related travel expenses of $0.1 million. During the six months ended June 30, 2015, the Company incurred management fees to Cinven Limited of $0.2 million and related travel expenses of $0.1 million. As of June 30, 2016 and December 31, 2015, the Company had outstanding accounts payable to Cinven Limited of $0.1 million and $0.1 million, respectively.
Service Agreements
Medpace Investors, LLC, a noncontrolling shareholder owned and managed by employees of the Company, has a majority ownership interest in Symplmed Pharmaceuticals, LLC (“Symplmed”), a private pharmaceutical development company. In addition, the Chief Executive Officer and other executives of the Company are board members of Symplmed. The Company entered into a Master Services Agreement (“MSA”) with Symplmed to perform clinical trials. The MSA also provides for a financing arrangement which allows for Symplmed to defer payments of the services provided by the Company while incurring premium service charges as consideration for the deferred payment concessions. The Company has evaluated its relationship with Symplmed and concluded that Symplmed is not a variable interest entity because the Company has no direct ownership interest or relationship other than the MSA. During the six months ended June 30, 2016 and 2015, the Company recognized service revenue from Symplmed of $0.4 million and $0.5 million, respectively, in the Company’s condensed consolidated statements of operations.
The chief executive officer of the Company is a member of Coherus BioSciences, Inc.’s (“Coherus”) board of directors, making Coherus a related party. The Company has secured an agreement to perform Phase I through Phase III clinical trial work for certain Coherus “bio-similar” drug compounds. The agreement provides for a minimum fee commitment for clinical trial services and is cancelable without cause by either party upon 30 days prior notification. During the six months ended June 30, 2016 and 2015, the Company recognized service revenue from Coherus of $11.4 million and $10.9 million, respectively, in the Company’s condensed consolidated statements of operations. As of June 30, 2016 and December 31, 2015, respectively, the Company had accounts receivable from Coherus of $2.6 million and $2.0 million recorded in the condensed consolidated balance sheets, respectively. As of June 30, 2016 and December 31, 2015, respectively, the Company had from Coherus, $9.5 million and $8.4 million of Advanced billings and $4.1 million and $3.5 million of Pre-funded study costs, in the condensed consolidated balance sheets.
F-52
Table of Contents
Certain executives and employees of the Company, including the chief executive officer, have equity investments in Xenon, a clinical-stage biopharmaceutical company. In addition, a Medpace employee was a director of Xenon until May 2015. During July 2015 the Company and Xenon entered into an amended MSA agreement for the Company to provide certain clinical development services. The Company recognized service revenue from Xenon of $0.4 million and $0.1 million during the six months ended June 30, 2016 and 2015, respectively, in the Company’s condensed consolidated statements of operations. As of June 30, 2016 and December 31, 2015, respectively, the Company had from Xenon, $1.9 million and $1.8 million of Advanced billings and $0.2 million and $0.2 million of Pre-funded study costs, in the condensed consolidated balance sheets.
Leased Real Estate
Headquarters Lease
The Company has entered into operating leases for its corporate headquarters and a storage space facility with a related party which is wholly owned by the chief executive officer of the Company. The Company has evaluated its relationship with the related party and concluded that the related party is not a variable interest entity because the Company has no direct ownership interest or relationship other than the leases. The lease for headquarters is for an initial term of twelve years through November 2022 with a renewal option for one 10-year term at prevailing market rates. The lease for storage space is through June 2016. The Company pays rent, taxes, insurance, and maintenance expenses that arise from the use of the properties. Annual base rent for the corporate headquarters allows for adjustments to the rental rate annually for increases in the consumer price index. Lease expense recognized for the six months ended June 30, 2016 and 2015 was $1.1 million and $1.1 million, respectively. The lease expense was allocated between Direct costs, excluding depreciation, amortization, and Selling, general and administrative in the condensed consolidated statements of operations.
Deemed Assets and Deemed Landlord Liabilities
The Company entered into two multi-year lease agreements with related parties governing the occupancy of space of two buildings in Cincinnati, Ohio. The related parties are wholly owned by the Company’s chief executive officer and certain of his immediate family. In accordance with the accounting guidance related to leases, the Company was deemed in substance to be the owner of the property during the construction phase and at completion. Accordingly, the Company reflected the buildings and related liabilities as deemed assets from landlord building construction in Property and equipment, net and Deemed landlord liabilities, respectively, on the condensed consolidated balance sheets. The Company assumed occupancy in 2012 and the leases expire in 2027 with the Company having one 10-year option to extend the lease term. The deemed assets are being fully depreciated, on a straight line basis, over the 15-year term of the lease. Deemed landlord liabilities are recorded at their net present value when the Company enters into qualifying leases and are reduced as the Company makes periodic lease payments on the properties. Accretion expense is being recorded over the term of the lease as a component of Interest expense, net in the Company’s condensed consolidated statements of operations. The Company paid $1.9 million and $1.6 million during the six months ended June 30, 2016 and 2015, respectively. The current and long-term portions of the Deemed landlord liability at June 30, 2016 were $1.7 million and $29.4 million, respectively. The current and long-term portions of the Deemed landlord liability at December 31, 2015 were $1.6 million and $30.3 million, respectively. The Company has recognized deemed assets, net of $18.9 million and $19.8 million at June 30, 2016 and December 31, 2015, respectively, in the condensed consolidated balance sheets.
Travel Services
The Company incurs expenses for travel services for company executives provided by a private aviation charter company which is owned by the chief executive officer and another executive of the Company (“private aviation charter”). The Company may contract directly with the private aviation charter for the use of its aircraft or indirectly through a third party aircraft management and jet charter company (the “Aircraft Management Company”). The travel services provided are primarily for business purposes, with certain personal travel paid for as part of the executives’ compensation arrangements. The Aircraft Management Company also makes the private aviation charter aircraft available to third parties. The Company incurred travel expenses of $0.5 million and $0.5 million during the six months ended June 30, 2016 and 2015, respectively. These travel expenses are recorded in Selling, general and administrative in the Company’s condensed consolidated statements of operations.
F-53
Table of Contents
12. SUBSEQUENT EVENTS
The Company has evaluated subsequent events through July 25, 2016, the date on which the condensed consolidated financial statements were available to be issued.
As disclosed in Note 1, on July 25, 2016, the Board of Directors of the Company approved, and made legally effective, a 1-for-1.35 reverse stock split of the Company’s common stock. All share, stock option and per share information presented in the condensed consolidated financial statements have been adjusted to reflect the reverse stock split on a retroactive basis for all periods presented. The Company will make a cash payment to shareholders for all fractional shares which would have otherwise been required to be issued as a result of the reverse stock split. There was no change in number of authorized shares or the par value of the Company’s common stock.
F-54
Table of Contents
7,000,000 Shares
Medpace Holdings, Inc.
Common Stock
PRELIMINARY PROSPECTUS
Joint Book-Running Managers
Jefferies
Credit Suisse
UBS Investment Bank
Wells Fargo Securities
Co-Managers
Baird
William Blair
, 2016
Through and including , 2016 (the 25th day after the date of this prospectus), all dealers effecting transactions in these securities, whether or not participating in this offering, may be required to deliver a prospectus. This is in addition to a dealer’s obligation to deliver a prospectus when acting as an underwriter and with respect to an unsold allotment or subscription.
Table of Contents
PART II INFORMATION NOT REQUIRED IN THE PROSPECTUS
Item 13. Other expenses of issuance and distribution.
The following table sets forth all fees and expenses, other than the underwriting discounts and commissions payable solely by Medpace Holdings, Inc. in connection with the offer and sale of the securities being registered. All amounts shown are estimated except for the SEC registration fee, the Financial Industry Regulatory Authority, Inc., or FINRA, filing fee and the exchange listing fee.
| AMOUNT TO BE PAID |
||||
| SEC registration fee |
$ | 18,645 | ||
| FINRA filing fee |
28,273 | |||
| Exchange listing fee |
125,000 | |||
| Accounting fees and expenses |
250,000 | |||
| Legal fees and expenses |
2,000,000 | |||
| Printing expenses |
225,000 | |||
| Transfer agent and registrar fees |
5,000 | |||
| Blue sky fees and expenses |
10,000 | |||
| Miscellaneous expenses |
143,082 | |||
|
|
|
|||
| Total |
$ | 2,805,000 | ||
|
|
|
|||
Item 14. Indemnification of directors and officers.
Section 102 of the General Corporation Law of the State of Delaware permits a corporation to eliminate the personal liability of directors of a corporation to the corporation or its shareholders for monetary damages for a breach of fiduciary duty as a director, except where the director breached his duty of loyalty, failed to act in good faith, engaged in intentional misconduct or knowingly violated a law, authorized the payment of a dividend or approved a stock repurchase in violation of Delaware corporate law or obtained an improper personal benefit. Our amended and restated certificate of incorporation provides that no director of Medpace Holdings, Inc. shall be personally liable to it or its shareholders for monetary damages for any breach of fiduciary duty as a director, notwithstanding any provision of law imposing such liability, except to the extent that the General Corporation Law of the State of Delaware prohibits the elimination or limitation of liability of directors for breaches of fiduciary duty.
Section 145 of the General Corporation Law of the State of Delaware provides that a corporation has the power to indemnify a director, officer, employee, or agent of the corporation, or a person serving at the request of the corporation for another corporation, partnership, joint venture, trust or other enterprise in related capacities against expenses (including attorneys’ fees), judgments, fines and amounts paid in settlement actually and reasonably incurred by the person in connection with an action, suit or proceeding to which he was or is a party or is threatened to be made a party to any threatened, ending or completed action, suit or proceeding by reason of such position, if such person acted in good faith and in a manner he reasonably believed to be in or not opposed to the best interests of the corporation, and, in any criminal action or proceeding, had no reasonable cause to believe his conduct was unlawful, except that, in the case of actions brought by or in the right of the corporation, no indemnification shall be made with respect to any claim, issue or matter as to which such person shall have been adjudged to be liable to the corporation unless and only to the extent that the Court of Chancery or other adjudicating court determines that, despite the adjudication of liability but in view of all of the circumstances of the case, such person is fairly and reasonably entitled to indemnity for such expenses which the Court of Chancery or such other court shall deem proper.
Upon consummation of this offering, our amended and restated certificate of incorporation and bylaws will provide indemnification for our directors and officers to the fullest extent permitted by the General Corporation Law of the
II-1
Table of Contents
State of Delaware. We will indemnify each person who was or is a party or threatened to be made a party to any threatened, pending or completed action, suit or proceeding (other than an action by or in the right of us) by reason of the fact that he or she is or was, or has agreed to become, a director or officer, or is or was serving, or has agreed to serve, at our request as a director, officer, partner, employee or trustee of, or in a similar capacity with, another corporation, partnership, joint venture, trust or other enterprise (all such persons being referred to as an “Indemnitee”), or by reason of any action alleged to have been taken or omitted in such capacity, against all expenses (including attorneys’ fees), judgments, fines and amounts paid in settlement actually and reasonably incurred in connection with such action, suit or proceeding and any appeal therefrom, if such Indemnitee acted in good faith and in a manner he or she reasonably believed to be in, or not opposed to, our best interests, and, with respect to any criminal action or proceeding, he or she had no reasonable cause to believe his or her conduct was unlawful. Our amended and restated certificate of incorporation and bylaws will provide that we will indemnify any Indemnitee who was or is a party to an action or suit by or in the right of us to procure a judgment in our favor by reason of the fact that the Indemnitee is or was, or has agreed to become, a director or officer, or is or was serving, or has agreed to serve, at our request as a director, officer, partner, employee or trustee of, or in a similar capacity with, another corporation, partnership, joint venture, trust or other enterprise, or by reason of any action alleged to have been taken or omitted in such capacity, against all expenses (including attorneys’ fees) and, to the extent permitted by law, amounts paid in settlement actually and reasonably incurred in connection with such action, suit or proceeding, and any appeal therefrom, if the Indemnitee acted in good faith and in a manner he or she reasonably believed to be in, or not opposed to, our best interests, except that no indemnification shall be made with respect to any claim, issue or matter as to which such person shall have been adjudged to be liable to us, unless a court determines that, despite such adjudication but in view of all of the circumstances, he or she is entitled to indemnification of such expenses. Notwithstanding the foregoing, to the extent that any Indemnitee has been successful, on the merits or otherwise, he or she will be indemnified by us against all expenses (including attorneys’ fees) actually and reasonably incurred in connection therewith. Expenses must be advanced to an Indemnitee under certain circumstances.
Prior to the consummation of this offering, we intend to enter into separate indemnification agreements with each of our directors and certain officers. Each indemnification agreement will provide, among other things, for indemnification to the fullest extent permitted by law and our amended and restated certificate of incorporation and bylaws against any and all expenses, judgments, fines, penalties and amounts paid in settlement of any claim. The indemnification agreements will provide for the advancement or payment of all expenses to the indemnitee and for the reimbursement to us if it is found that such indemnitee is not entitled to such indemnification under applicable law and our amended and restated certificate of incorporation and bylaws.
We maintain a general liability insurance policy that covers certain liabilities of directors and officers of our corporation arising out of claims based on acts or omissions in their capacities as directors or officers.
In any underwriting agreement we enter into in connection with the sale of common stock being registered hereby, the underwriters will agree to indemnify, under certain conditions, us, our directors, our officers and persons who control us within the meaning of the Securities Act against certain liabilities.
Item 15. Recent sales of unregistered securities.
Set forth below is information regarding shares of capital stock issued by us within the past three years. Also included is the consideration received by us for such shares and information relating to the section of the Securities Act, or rule of the SEC, under which exemption from registration was claimed.
The amounts set forth below have been adjusted to reflect the 1-for-1.35 reverse stock split of the Company’s common stock approved by the Board and made legally effective on July 25, 2016. All of the grants described below, except for the grant of 351,851 fully vested shares of our common stock to our Chief Executive Officer on July 31, 2015, were made pursuant to our 2014 Equity Incentive Plan.
On June 10, 2014, we granted (i) stock options to purchase an aggregate of 831,165 shares of our common stock at a price of $14.40 per share, (ii) 207,346 fully vested shares of our common stock and (iii) 311,052 restricted shares of our common stock, in each case to certain of our employees in connection with services provided to us by such parties.
II-2
Table of Contents
On July 7, 2014, we granted (i) stock options to purchase an aggregate of 274,805 shares of our common stock at a price of $14.40 per share, (ii) 71,252 fully vested shares of our common stock and (iii) 106,882 restricted shares of our common stock, in each case to certain of our executives and employees in connection with services provided to us by such parties.
On September 1, 2014, we granted stock options to purchase an aggregate of 11,111 fully vested shares of our common stock at a price of $14.40 per share to an employee in connection with services provided to us by such party.
On September 9, 2014, we granted (i) stock options to purchase an aggregate of 14,814 shares of our common stock at a price of $14.40 per share, (ii) 4,444 fully vested shares of our common stock and (iii) 6,666 restricted shares of our common stock, in each case to certain of our employees in connection with services provided to us by such parties.
On March 23, 2015, we granted (i) stock options to purchase an aggregate of 583,566 shares of our common stock at a price of $16.20 per share, (ii) 188,949 fully vested shares of our common stock and (iii) 283,341 restricted shares of our common stock and restricted share units, in each case to certain of our employees and executives in connection with services provided to us by such parties.
On May 15, 2015, we granted (i) stock options to purchase an aggregate of 3,703 shares of our common stock at a price of $16.20 per share, (ii) 1,481 fully vested shares of our common stock and (iii) 2,222 restricted shares of our common stock, in each case to certain of our employees in connection with services provided to us by such parties.
On July 31, 2015, we granted (i) stock options to purchase an aggregate of 69,252 shares of our common stock at a price of $16.88 per share to certain of our employees in connection with services provided to us by such parties, (ii) 351,851 fully vested shares of our common stock to our Chief Executive Officer in connection with services provided to us by him and (iii) 251,851 restricted shares of our common stock to our Chief Executive Officer in connection with services provided to us by him.
On August 31, 2015, we issued and sold 37,037 shares of common stock at a price of $16.42 per share for an aggregate consideration of $608,000, and granted (i) stock options to purchase an aggregate of 74,074 shares of our common stock at a price of $16.88 per share, (ii) 29,639 fully vested shares of our common stock and (iii) 44,444 restricted shares of our common stock, in each case to an employee in connection with services provided to us by him.
Additionally, from September 22, 2015 to November 10, 2015, certain of our officers and employees exercised stock options granted under our 2014 Equity Incentive Plan to purchase a total of 17,404 shares of our common stock at a price of $14.40 per share for an aggregate purchase price of approximately $250,745.
On December 22, 2015, we granted (i) stock options to purchase an aggregate of 159,254 shares of our common stock at a price of $18.23 per share, (ii) 11,111 fully vested shares of our common stock and (iii) 88,888 restricted shares of our common stock, in each case to certain of our employees in connection with services provided to us by such parties.
On January 14, 2016, an employee exercised stock options granted under the 2014 Equity Incentive Plan to purchase a total of 462 shares of our common stock at a price of $14.40 per share for an aggregate purchase price of approximately $6,700.
On March 23, 2016, we granted (i) stock options to purchase an aggregate of 34,812 shares of our common stock at a price of $18.23 per share and (ii) 11,111 fully vested shares of our common stock, in each case to certain of our employees in connection with services provided to us by such parties.
On May 2, 2016, an employee exercised stock options granted under the 2014 Equity Incentive Plan to purchase a total of 133 shares of our common stock at a price of $14.40 per share for an aggregate purchase price of approximately $1,900.
On June 10, 2016, an employee exercised stock options granted under the 2014 Equity Incentive Plan to purchase a total of 462 shares of our common stock at a price of $14.40 per share for an aggregate purchase price of approximately $6,700.
On June 23, 2016, an employee exercised stock options granted under the 2014 Equity Incentive Plan to purchase a total of 5,555 shares of our common stock at a price of $14.40 per share for an aggregate purchase price of approximately $80,000.
II-3
Table of Contents
On June 27, 2016, an employee exercised stock options granted under the 2014 Equity Incentive Plan to purchase a total of 370 shares of our common stock at a price of $16.20 per share for an aggregate purchase price of approximately $6,000.
On July 1, 2016, an employee exercised stock options granted under the 2014 Equity Incentive Plan to purchase a total of 7,407 shares of our common stock at a price of $14.40 per share for an aggregate purchase price of approximately $106,700.
On July 8, 2016, an employee exercised stock options granted under the 2014 Equity Incentive Plan to purchase a total of 1,333 shares of our common stock at a price of $14.40 per share for an aggregate purchase price of approximately $19,200.
The sales of the above securities were deemed to be exempt from registration under the Securities Act in reliance upon Section 4(a)(2) of the Securities Act or Rule 701 promulgated under Section 3(b) of the Securities Act as transactions by an issuer not involving any public offering or pursuant to benefit plans and contracts relating to compensation as provided under Rule 701. The recipients of the securities in each of these transactions represented their intentions to acquire the securities for investment only and not with a view to or for sale in connection with any distribution thereof, and appropriate legends were placed upon the stock certificates issued in these transactions. All recipients had adequate access, through their relationships with the Registrant, to information about the Registrant.
None of the foregoing transactions involved any underwriters, underwriting discounts or commissions, or any public offering.
Item 16. Exhibits and financial statements.
(a) Exhibits
The exhibit index attached hereto is incorporated herein by reference.
(b) Financial Statement Schedules
All schedules have been omitted because the information required to be set forth in the schedules is either not applicable or is shown in the financial statements or notes thereto.
Item 17. Undertakings.
(a) The undersigned registrant hereby undertakes to provide to the underwriters at the closing specified in the underwriting agreement certificates in such denominations and registered in such names as required by the underwriters to permit prompt delivery to each purchaser.
(b) Insofar as indemnification for liabilities arising under the Securities Act may be permitted to directors, officers and controlling persons of Medpace Holdings, Inc. pursuant to the foregoing provisions, or otherwise, Medpace Holdings, Inc. has been advised that in the opinion of the SEC such indemnification is against public policy as expressed in the Securities Act and is, therefore, unenforceable. In the event that a claim for indemnification against such liabilities (other than the payment by Medpace Holdings, Inc. of expenses incurred or paid by a director, officer or controlling person of Medpace Holdings, Inc. in the successful defense of any action, suit or proceeding) is asserted by such director, officer or controlling person in connection with the securities being registered, Medpace Holdings, Inc. will, unless in the opinion of its counsel the matter has been settled by controlling precedent, submit to a court of appropriate jurisdiction, the question whether such indemnification by it is against public policy as expressed in the Securities Act and will be governed by the final adjudication of such issue.
(c) The undersigned hereby further undertakes that:
(1) For purposes of determining any liability under the Securities Act the information omitted from the form of prospectus filed as part of this registration statement in reliance upon Rule 430A and contained in a form of prospectus filed by Medpace Holdings, Inc. pursuant to Rule 424(b)(1) or (4) or 497(h) under the Securities Act shall be deemed to be part of this registration statement as of the time it was declared effective.
(2) For the purpose of determining any liability under the Securities Act each post-effective amendment that contains a form of prospectus shall be deemed to be a new registration statement relating to the securities offered therein, and the offering of such securities at that time shall be deemed to be the initial bona fide offering thereof.
II-4
Table of Contents
SIGNATURES
Pursuant to the requirements of the Securities Act of 1933, as amended, Medpace Holdings, Inc. has duly caused this registration statement to be signed on its behalf by the undersigned, thereunto duly authorized, in the City of Cincinnati, State of Ohio on August 1, 2016.
| Medpace Holdings, Inc. | ||
| By: | /S/ DR. AUGUST J. TROENDLE | |
| Dr. August J. Troendle President and Chief Executive Officer | ||
Pursuant to the requirements of the Securities Act of 1933, as amended, this registration statement on Form S-1 has been signed by the following persons in the capacities set forth opposite their names and on the date indicated above.
| SIGNATURE |
TITLE |
DATE | ||
| /S/ DR. AUGUST J. TROENDLE Dr. August J. Troendle |
President, Chief Executive Officer and Chairman of the Board of Directors (Principal Executive Officer) |
August 1, 2016 | ||
| /S/ JESSE J. GEIGER Jesse J. Geiger |
Chief Financial Officer and Chief Operating Officer, Laboratory Operations (Principal Financial Officer and Principal Accounting Officer) | August 1, 2016 | ||
| * Dr. Supraj R. Rajagopalan |
Director | August 1, 2016 | ||
| * Alexander F.S. Leslie |
Director | August 1, 2016 | ||
| * Matthew R. Norton |
Director | August 1, 2016 | ||
| * Robert O. Kraft |
Director | August 1, 2016 | ||
| * Brian T. Carley |
Director | August 1, 2016 | ||
| *By: | /S/ DR. AUGUST J. TROENDLE | |
| Dr. August J. Troendle Attorney-in-fact |
II-5
Table of Contents
INDEX TO EXHIBITS
| EXHIBIT |
||
| 1.1** | Form of Underwriting Agreement. | |
| 3.1** | Form of Amended and Restated Certificate of Incorporation of Medpace Holdings, Inc., to be in effect upon the consummation of this offering. | |
| 3.2** | Form of Amended and Restated Bylaws of Medpace Holdings, Inc. to be in effect upon the consummation of this offering. | |
| 4.1** | Specimen Stock Certificate evidencing shares of common stock. | |
| 4.2** | Form of Voting Agreement, to be in effect upon the consummation of this offering. | |
| 5.1 | Opinion of Latham & Watkins LLP. | |
| 10.1** | Credit Agreement, dated as of April 1, 2014, by and among Scioto Acquisition, Inc., Scioto Merger Sub, Inc., Medpace IntermediateCo, Inc., Jefferies Finance LLC, as administrative agent and swingline lender, and other agents and lenders party thereto. | |
| 10.2** | Guaranty Agreement, dated as of April 1, 2014, by and among Scioto Acquisition, Inc., Scioto Merger Sub, Inc., Medpace IntermediateCo, Inc., each other direct or indirect subsidiary of Medpace Holdings, Inc. party to the Guaranty Agreement and Jefferies Finance LLC, as administrative agent. | |
| 10.3** | Security Agreement, dated as of April 1, 2014, by and among Scioto Acquisition, Inc., Scioto Merger Sub, Inc., Medpace IntermediateCo, Inc., each other direct or indirect subsidiary of Medpace Holdings, Inc. party to the Security Agreement and Jefferies Finance LLC, as administrative agent. | |
| 10.4** | Pledge Agreement, dated as of April 1, 2014, by and among Scioto Acquisition, Inc., Scioto Merger Sub, Inc., Medpace IntermediateCo, Inc., each other direct or indirect subsidiary of Medpace Holdings, Inc. party to the Pledge Agreement and Jefferies Finance LLC, as administrative agent. | |
| 10.5†** | Employment Agreement, dated as of June 17, 2011, by and between Medpace, Inc. and Dr. August J. Troendle. | |
| 10.6†** | Scioto Holdings, Inc. 2014 Equity Incentive Plan. | |
| 10.7†** | Form of Medpace Holdings, Inc. 2016 Incentive Award Plan. | |
| 10.8†** | Form of Medpace Holdings, Inc. 2016 Senior Executive Incentive Bonus Plan. | |
| 10.9** | Form of Registration Rights Agreement, to be in effect upon the consummation of this offering. | |
| 10.10** | Lease, dated as of October 7, 2010, by and between Medpace, Inc. and 100 Medpace Way, LLC. | |
| 10.11** | Lease, dated as of June 3, 2011, by and between Medpace, Inc. and 200 Medpace Way, LLC. | |
| 10.12** | Lease, dated as of June 3, 2011, by and between Medpace, Inc. and 300 Medpace Way, LLC. | |
| 10.13† |
Form of Medpace Holdings, Inc. 2016 Incentive Award Plan Restricted Stock Award Grant Notice. | |
| 10.14†
|
Form of Medpace Holdings, Inc. 2016 Incentive Award Plan Stock Option Grant Notice and Stock Option Agreement. | |
| 10.15† | Form of Medpace Holdings, Inc. 2016 Incentive Award Plan Restricted Stock Unit Award Grant Notice. | |
| 10.16† | Form of Medpace Holdings, Inc. 2016 Incentive Award Plan Sub-Plan for UK Participants. | |
| 10.17†** | Form of Medpace Holdings, Inc. Non-Employee Director Compensation Policy. | |
| 10.18†** | Amended and Restated Employment Agreement, by and between Medpace Holdings, Inc. and Dr. August J. Troendle. | |
| 10.19† | Form of Medpace Holdings, Inc. 2016 Incentive Award Plan UK Company Share Option Plan (CSOP) Sub-Plan. | |
II-6
Table of Contents
| EXHIBIT |
||
| 21.1** | List of Subsidiaries of Medpace Holdings, Inc. | |
| 23.1 | Consent of Deloitte & Touche LLP as to Medpace Holdings, Inc. | |
| 23.2 | Consent of Latham & Watkins LLP (included in Exhibit 5.1). | |
| 24.1** | Power of Attorney (included on signature page). | |
| ** | Previously filed. |
| † | Indicates a management contract or compensatory plan or arrangement. |
II-7