Attached files
| file | filename |
|---|---|
| EX-99.5 - EX-99.5 - COMSTOCK RESOURCES INC | d186491dex995.htm |
| EX-99.4 - EX-99.4 - COMSTOCK RESOURCES INC | d186491dex994.htm |
| EX-99.3 - EX-99.3 - COMSTOCK RESOURCES INC | d186491dex993.htm |
| EX-99.2 - EX-99.2 - COMSTOCK RESOURCES INC | d186491dex992.htm |
| EX-23.1 - EX-23.1 - COMSTOCK RESOURCES INC | d186491dex231.htm |
| 8-K - FORM 8-K - COMSTOCK RESOURCES INC | d186491d8k.htm |
Exhibit 99.1
| ITEM 5. |
MARKET FOR REGISTRANT’S COMMON EQUITY, RELATED STOCKHOLDER MATTERS AND ISSUER PURCHASES OF EQUITY SECURITIES |
Our common stock is listed for trading on the New York Stock Exchange under the symbol “CRK”. The following table sets forth, on a per share basis for the periods indicated, the high and low sales prices by calendar quarter for the periods indicated as reported by the New York Stock Exchange. All share and per share amounts below have been adjusted to give effect to the Company’s one-for-five (1:5) reverse stock split that became effective on July 29, 2016.
| High | Low | |||||||||
| 2014 – |
First Quarter |
$ | 115.75 | $ | 81.10 | |||||
| Second Quarter |
$ | 145.75 | $ | 112.10 | ||||||
| Third Quarter |
$ | 147.45 | $ | 91.50 | ||||||
| Fourth Quarter |
$ | 94.00 | $ | 25.05 | ||||||
| 2015 – |
First Quarter |
$ | 36.10 | $ | 16.15 | |||||
| Second Quarter |
$ | 27.20 | $ | 16.45 | ||||||
| Third Quarter |
$ | 20.35 | $ | 4.95 | ||||||
| Fourth Quarter |
$ | 16.90 | $ | 8.00 | ||||||
As of February 26, 2016, we had 10,635,664 shares of common stock outstanding, which were held by 196 holders of record and approximately 15,000 beneficial owners who maintain their shares in “street name” accounts.
We paid a quarterly cash dividend on our common stock in 2014, resulting in total dividends paid of $23.8 million. On February 13, 2015, we announced that the dividend was being suspended until oil and natural gas prices improve. Any future determination as to the payment of dividends will depend upon the results of our operations, capital requirements, our financial condition and such other factors as our board of directors may deem relevant.
Stockholder Return Performance
A peer group of companies is used by our compensation committee to benchmark our executives’ compensation and to determine total stockholder return performance for purposes of vesting of performance share units granted to executives under our 2009 Long-term Incentive Plan. For 2015, the compensation committee utilized a peer group, which consisted of Approach Resources. Inc., Bill Barrett Corporation, Carrizo Oil & Gas Inc., Cimarex Energy Co., Laredo Petroleum Holdings Inc., Oasis Petroleum Inc., PDC Energy Inc., SM Energy, Inc., Stone Energy Corporation, Swift Energy Co., and Ultra Petroleum Corp.
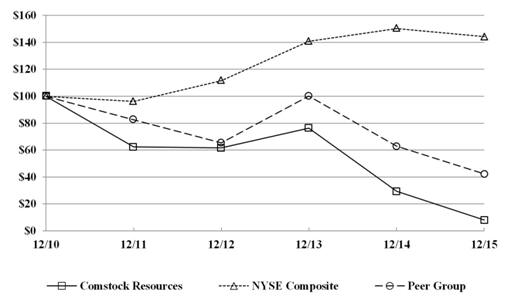
The following graph compares the yearly percentage change in the cumulative total stockholder return on our common stock during the five years ended December 31, 2015 with the cumulative return on the New York Stock Exchange Index and the cumulative return for our peer group. The graph assumes that $100.00 was invested on the last trading day of 2010, and that dividends, if any, were reinvested.
1
COMPARISON OF 5 YEAR CUMULATIVE TOTAL RETURN(1)(2)
Among Comstock Resources, the NYSE Composite Index, and Our Peer Group
| (1) |
$100 invested on December 31, 2010 in stock or index, including reinvestment of dividends, fiscal year ending December 31. |
| (2) |
The data contained in the above graph is deemed to be furnished and not filed pursuant to Section 18 of the Securities Exchange Act of 1934, as amended, or otherwise subject to the liabilities of that section. |
| As of December 31, | ||||||||||||||||||||||||
| Total Return Analysis |
2010 | 2011 | 2012 | 2013 | 2014 | 2015 | ||||||||||||||||||
| Comstock Resources |
$ | 100.00 | $ | 62.30 | $ | 61.56 | $ | 76.23 | $ | 29.33 | $ | 8.05 | ||||||||||||
| NYSE Composite |
$ | 100.00 | $ | 96.16 | $ | 111.53 | $ | 140.85 | $ | 150.35 | $ | 144.21 | ||||||||||||
| Peer Group |
$ | 100.00 | $ | 82.59 | $ | 65.44 | $ | 100.02 | $ | 62.82 | $ | 42.43 | ||||||||||||
2