Attached files
| file | filename |
|---|---|
| 8-K - 8-K - CIRCOR INTERNATIONAL INC | cir_07032016x8-k.htm |
| EX-99.2 - SECOND QUARTER 2016 INVESTOR REVIEW PRESENTATION - CIRCOR INTERNATIONAL INC | cir_q2x07032016xex992.htm |
EXHIBIT 99.1
CIRCOR Reports Second-Quarter 2016 Financial Results
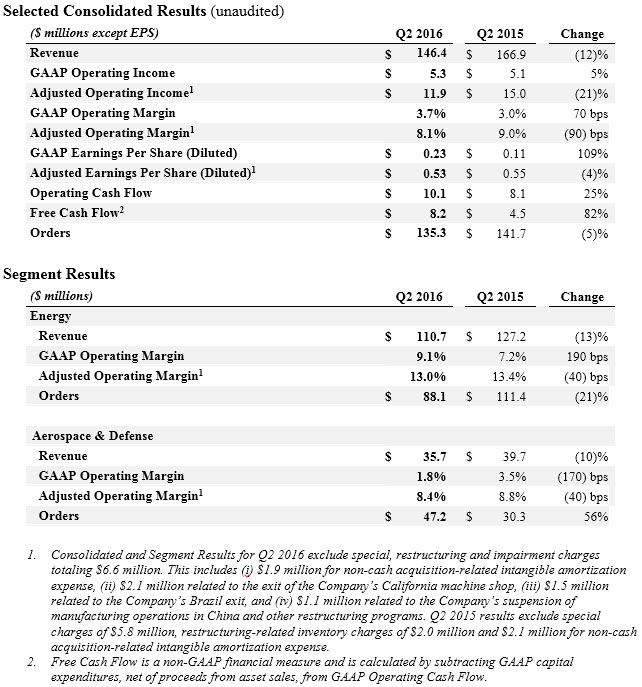
Burlington, MA - July 29, 2016 - CIRCOR International, Inc. (NYSE: CIR), a leading provider of valves and other highly engineered products for markets including oil & gas, power generation and aerospace & defense, today announced financial results for the second quarter ended July 3, 2016.
Second-Quarter 2016 Highlights
• | Delivered revenue of $146 million |
• | Achieved GAAP EPS of $0.23 and Adjusted EPS of $0.53 |
• | Aerospace & Defense orders of $47 million, up 56% versus prior year |
• | Restructuring actions remain on track to deliver $15 million of savings in 2016 |
“CIRCOR delivered solid second-quarter financial results for both revenue and earnings,” said Scott Buckhout, President and Chief Executive Officer. “We achieved year-over-year sales growth in our engineered valves business and we are encouraged to see upstream short-cycle revenue stabilizing at current levels. The power market remains a bright spot globally and led to modest revenue growth in the quarter for our control valves business. In our Aerospace & Defense segment, we reported a 56% increase in orders, which we expect to drive top line growth in the second half of this year. Energy orders overall were down in the quarter due to a challenging oil and gas market and delayed project awards.”
“As we enter the second half of 2016, we remain focused on what we control. We are laying the foundation for long-term growth through careful investments in sales, marketing and engineering, while we continuously improve operations. We are executing well on our simplification and restructuring actions. Our California machining facility closure is complete and we expect to see the positive effect on our margins as the year progresses. Customer on time delivery averaged 91% in the quarter and we are starting to see better working capital performance,” added Buckhout.
“Finally, we remain committed to creating shareholder value through growth, margin expansion, strong cash flow, and disciplined capital deployment,” concluded Buckhout.
Third-Quarter 2016 Guidance
For the third quarter of 2016, the Company will provide its guidance during the conference call later today.
1
Conference Call Information
CIRCOR International will hold a conference call to review its financial results today, July 29, 2016, at 9:00 a.m. ET. To listen to the conference call and view the accompanying presentation slides, visit “Webcasts & Presentations” in the “Investors” portion of the CIRCOR website. The call also can be accessed by dialing (877) 407-5790 or (201) 689-8328. The webcast will be archived for one year on the Company’s website.
2
Use of Non-GAAP Financial Measures
Adjusted net income, adjusted earnings per share (diluted), adjusted operating income, adjusted operating margin, and free cash flow are non-GAAP financial measures and are intended to serve as a complement to results provided in accordance with accounting principles generally accepted in the United States. CIRCOR believes that such information provides an additional measurement and consistent historical comparison of the Company’s performance. A reconciliation of the non-GAAP financial measures to the most directly comparable GAAP measures is available in this news release.
Safe Harbor Statement
This press release contains forward-looking statements within the meaning of Section 27A of the Securities Act of 1933, as amended, and Section 21E of the Securities Exchange Act of 1934, as amended. Reliance should not be placed on forward-looking statements because they involve unknown risks, uncertainties and other factors, which are, in some cases, beyond the control of CIRCOR. Any statements in this press release that are not statements of historical fact are forward-looking statements, including, but not limited to, those relating to CIRCOR’s future performance, including the realization of cost reductions from restructuring activities. Actual events, performance or results could differ materially from the anticipated events, performance or results expressed or implied by such forward-looking statements. BEFORE MAKING ANY INVESTMENT DECISIONS REGARDING OUR COMPANY, WE STRONGLY ADVISE YOU TO READ THE SECTION ENTITLED "RISK FACTORS" IN OUR MOST RECENT ANNUAL REPORT ON FORM 10-K AND SUBSEQUENT REPORTS ON FORMS 10-Q, WHICH CAN BE ACCESSED UNDER THE "INVESTORS" LINK OF OUR WEBSITE AT WWW.CIRCOR.COM. We undertake no obligation to publicly update or revise any forward-looking statement, whether as a result of new information, future events or otherwise.
About CIRCOR International, Inc.
CIRCOR International, Inc. designs, manufactures and markets highly engineered products and sub-systems for markets including oil & gas, power generation and aerospace & defense. CIRCOR has a diversified product portfolio with recognized, market-leading brands that fulfill its customers’ unique application needs. The Company’s strategy is to grow organically and through complementary acquisitions; simplify CIRCOR’s operations; achieve world class operational excellence; and attract and retain top industry talent. For more information, visit the Company’s investor relations web site at http://investors.circor.com.
Contact:
Rajeev Bhalla
Executive Vice President & Chief Financial Officer
CIRCOR International
(781) 270-1200
3
CIRCOR INTERNATIONAL, INC. CONSOLIDATED STATEMENTS OF INCOME (in thousands, except per share data) UNAUDITED | |||||||||||||||
Three Months Ended | Six Months Ended | ||||||||||||||
July 3, 2016 | July 5, 2015 | July 3, 2016 | July 5, 2015 | ||||||||||||
Net revenues | $ | 146,392 | $ | 166,906 | $ | 297,190 | $ | 332,766 | |||||||
Cost of revenues | 99,961 | 116,112 | 205,526 | 229,323 | |||||||||||
GROSS PROFIT | 46,431 | 50,794 | 91,664 | 103,443 | |||||||||||
Selling, general and administrative expenses | 36,490 | 42,394 | 74,289 | 81,201 | |||||||||||
Special charges, net | 4,594 | 3,310 | 6,533 | 4,821 | |||||||||||
OPERATING INCOME | 5,347 | 5,090 | 10,842 | 17,421 | |||||||||||
Other expense (income): | |||||||||||||||
Interest expense, net | 605 | 805 | 1,236 | 1,446 | |||||||||||
Other income, net | (549 | ) | (104 | ) | (1,077 | ) | (610 | ) | |||||||
TOTAL OTHER EXPENSE, NET | 56 | 701 | 159 | 836 | |||||||||||
INCOME BEFORE INCOME TAXES | 5,291 | 4,389 | 10,683 | 16,585 | |||||||||||
Provision for income taxes | 1,478 | 2,517 | 2,998 | 5,800 | |||||||||||
NET INCOME | $ | 3,813 | $ | 1,872 | $ | 7,685 | $ | 10,785 | |||||||
Earnings per common share: | |||||||||||||||
Basic | $ | 0.23 | $ | 0.11 | $ | 0.47 | $ | 0.63 | |||||||
Diluted | $ | 0.23 | $ | 0.11 | $ | 0.46 | $ | 0.62 | |||||||
Weighted average number of common shares outstanding: | |||||||||||||||
Basic | 16,424 | 16,828 | 16,403 | 17,245 | |||||||||||
Diluted | 16,595 | 16,900 | 16,538 | 17,306 | |||||||||||
Dividends paid per common share | $ | 0.0375 | $ | 0.0375 | $ | 0.0750 | $ | 0.0750 | |||||||
4
CIRCOR INTERNATIONAL, INC. CONSOLIDATED STATEMENTS OF CASH FLOWS (in thousands) UNAUDITED | |||||||
Six Months Ended | |||||||
July 3, 2016 | July 5, 2015 | ||||||
OPERATING ACTIVITIES | |||||||
Net income | $ | 7,685 | $ | 10,785 | |||
Adjustments to reconcile net income to net cash provided by (used in) operating activities: | |||||||
Depreciation | 6,476 | 7,150 | |||||
Amortization | 5,098 | 3,537 | |||||
Bad debt (recovery) expense | (853 | ) | 1,469 | ||||
Loss on write down of inventory | 4,011 | 3,673 | |||||
Compensation expense of share-based plans | 2,909 | 4,122 | |||||
Tax effect of share-based plan compensation | 116 | (287 | ) | ||||
Loss on sale or write down of property, plant and equipment | 3,116 | 377 | |||||
Gain on sale of business | — | (972 | ) | ||||
Changes in operating assets and liabilities, net of effects of acquisition and disposition: | |||||||
Trade accounts receivable | 11,555 | 12,313 | |||||
Inventories | 13,281 | (27,875 | ) | ||||
Prepaid expenses and other assets | (3,480 | ) | (8,484 | ) | |||
Accounts payable, accrued expenses and other liabilities | (32,161 | ) | (14,174 | ) | |||
Net cash provided by (used in) operating activities | 17,753 | (8,366 | ) | ||||
INVESTING ACTIVITIES | |||||||
Purchases of property, plant and equipment | (6,998 | ) | (5,567 | ) | |||
Proceeds from the sale of property, plant and equipment | 1,138 | — | |||||
Proceeds from the sale of affiliate | — | 2,759 | |||||
Business acquisition, net of cash acquired | — | (79,983 | ) | ||||
Net cash used in investing activities | (5,860 | ) | (82,791 | ) | |||
FINANCING ACTIVITIES | |||||||
Proceeds from long-term debt | 65,939 | 202,380 | |||||
Payments of long-term debt | (58,890 | ) | (100,533 | ) | |||
Dividends paid | (1,249 | ) | (1,308 | ) | |||
Proceeds from the exercise of stock options | 180 | 70 | |||||
Tax effect of share-based plan compensation | (116 | ) | 287 | ||||
Purchases of common stock | — | (69,517 | ) | ||||
Net cash provided by financing activities | 5,864 | 31,379 | |||||
Effect of exchange rate changes on cash and cash equivalents | 672 | (6,567 | ) | ||||
INCREASE (DECREASE) IN CASH AND CASH EQUIVALENTS | 18,429 | (66,345 | ) | ||||
Cash and cash equivalents at beginning of period | 54,541 | 121,372 | |||||
CASH AND CASH EQUIVALENTS AT END OF PERIOD | $ | 72,970 | $ | 55,027 | |||
5
CIRCOR INTERNATIONAL, INC. CONSOLIDATED BALANCE SHEETS (in thousands) UNAUDITED | |||||||
July 3, 2016 | December 31, 2015 | ||||||
ASSETS | |||||||
CURRENT ASSETS: | |||||||
Cash and cash equivalents | $ | 72,970 | $ | 54,541 | |||
Trade accounts receivable, less allowance for doubtful accounts of $7,811 and $8,290, respectively | 115,327 | 125,628 | |||||
Inventories | 162,347 | 177,840 | |||||
Prepaid expenses and other current assets | 21,522 | 16,441 | |||||
Total Current Assets | 372,166 | 374,450 | |||||
PROPERTY, PLANT AND EQUIPMENT, NET | 81,973 | 87,029 | |||||
OTHER ASSETS: | |||||||
Goodwill | 117,138 | 115,452 | |||||
Intangibles, net | 43,688 | 48,981 | |||||
Deferred income taxes | 36,328 | 36,799 | |||||
Other assets | 6,183 | 7,204 | |||||
TOTAL ASSETS | $ | 657,476 | $ | 669,915 | |||
LIABILITIES AND SHAREHOLDERS’ EQUITY | |||||||
CURRENT LIABILITIES: | |||||||
Accounts payable | $ | 45,987 | $ | 64,284 | |||
Accrued expenses and other current liabilities | 39,945 | 52,878 | |||||
Accrued compensation and benefits | 19,121 | 18,424 | |||||
Income taxes payable | 9,174 | 6,585 | |||||
Total Current Liabilities | 114,227 | 142,171 | |||||
LONG-TERM DEBT | 97,600 | 90,500 | |||||
DEFERRED INCOME TAXES | 9,927 | 10,424 | |||||
OTHER NON-CURRENT LIABILITIES | 24,355 | 26,043 | |||||
SHAREHOLDERS’ EQUITY: | |||||||
Common stock | 178 | 177 | |||||
Additional paid-in capital | 286,601 | 283,621 | |||||
Retained earnings | 264,375 | 257,939 | |||||
Common treasury stock, at cost | (74,972 | ) | (74,972 | ) | |||
Accumulated other comprehensive loss, net of tax | (64,815 | ) | (65,988 | ) | |||
Total Shareholders’ Equity | 411,367 | 400,777 | |||||
TOTAL LIABILITIES AND SHAREHOLDERS’ EQUITY | $ | 657,476 | $ | 669,915 | |||
6
CIRCOR INTERNATIONAL, INC. SUMMARY OF ORDERS AND BACKLOG (in millions) UNAUDITED | |||||||||||||||
Three Months Ended | Six Months Ended | ||||||||||||||
July 3, 2016 | July 5, 2015 | July 3, 2016 | July 5, 2015 | ||||||||||||
ORDERS (1) | |||||||||||||||
Energy | $ | 88.1 | $ | 111.4 | $ | 187.9 | $ | 254.5 | |||||||
Aerospace & Defense | 47.2 | 30.3 | 84.1 | 69.5 | |||||||||||
Total orders | $ | 135.3 | $ | 141.7 | $ | 272.0 | $ | 324.0 | |||||||
BACKLOG (2) | July 3, 2016 | July 5, 2015 | |||||||||||||
Energy | $ | 142.1 | $ | 248.0 | |||||||||||
Aerospace & Defense | 102.0 | 96.3 | |||||||||||||
Total backlog | $ | 244.1 | $ | 344.3 | |||||||||||
Note 1: Orders do not include the foreign exchange impact due to the re-measurement of customer order backlog amounts denominated in foreign currencies. | |||||||||||||||
Note 2: Backlog includes unshipped customer orders. | |||||||||||||||
7
CIRCOR INTERNATIONAL, INC. SUMMARY REPORT BY SEGMENT (in thousands, except percentages) UNAUDITED | ||||||||||||||||||||||||
2015 | 2016 | |||||||||||||||||||||||
1ST QTR | 2ND QTR | 3RD QTR | 4TH QTR | TOTAL | 1ST QTR | 2ND QTR | TOTAL | |||||||||||||||||
NET REVENUES | ||||||||||||||||||||||||
Energy | $ | 127,586 | $ | 127,230 | $ | 122,905 | $ | 124,412 | $ | 502,133 | $ | 112,620 | $ | 110,678 | $ | 223,298 | ||||||||
Aerospace & Defense | 38,274 | 39,676 | 36,353 | 39,832 | 154,134 | 38,178 | 35,714 | 73,892 | ||||||||||||||||
Total | $ | 165,860 | $ | 166,906 | $ | 159,258 | $ | 164,243 | $ | 656,267 | $ | 150,798 | $ | 146,392 | $ | 297,190 | ||||||||
OPERATING MARGIN | ||||||||||||||||||||||||
Energy | 13.8 | % | 13.4 | % | 15.4 | % | 13.4 | % | 14.0 | % | 12.6 | % | 13.0 | % | 12.8 | % | ||||||||
Aerospace & Defense | 8.0 | % | 8.8 | % | 9.1 | % | 10.4 | % | 9.1 | % | 9.3 | % | 8.4 | % | 8.9 | % | ||||||||
Segment operating margin | 12.4 | % | 12.3 | % | 14.0 | % | 12.7 | % | 12.8 | % | 11.8 | % | 11.9 | % | 11.8 | % | ||||||||
Corporate expenses | (3.6 | )% | (3.3 | )% | (3.8 | )% | (2.5 | )% | (3.3 | )% | (4.3 | )% | (3.7 | )% | (4.0 | )% | ||||||||
Adjusted operating margin | 8.8 | % | 9.0 | % | 10.1 | % | 10.2 | % | 9.5 | % | 7.5 | % | 8.1 | % | 7.8 | % | ||||||||
Restructuring related inventory charges | — | % | 1.2 | % | 4.0 | % | 0.6 | % | 1.4 | % | 1.3 | % | 0.1 | % | 0.7 | % | ||||||||
Impairment charges | — | % | — | % | 1.6 | % | — | % | 0.4 | % | — | % | — | % | — | % | ||||||||
Special restructuring charges, net | 0.9 | % | 1.9 | % | 0.2 | % | (0.2 | )% | 0.7 | % | 0.8 | % | 2.2 | % | 1.5 | % | ||||||||
Special acquisition amortization | — | % | 1.3 | % | 1.6 | % | 1.4 | % | 1.0 | % | 1.2 | % | 1.3 | % | 1.3 | % | ||||||||
Special other charges, net of recoveries | — | % | 0.1 | % | 5.0 | % | 1.0 | % | 1.5 | % | 0.5 | % | 0.9 | % | 0.7 | % | ||||||||
Brazil restatement impact | 0.4 | % | 1.5 | % | — | % | — | % | 0.5 | % | — | % | — | % | — | % | ||||||||
Total GAAP operating margin | 7.4 | % | 3.0 | % | (2.2 | )% | 7.5 | % | 4.0 | % | 3.6 | % | 3.7 | % | 3.6 | % | ||||||||
8
CIRCOR INTERNATIONAL, INC. SUMMARY REPORT BY SEGMENT (in thousands, except percentages) UNAUDITED | ||||||||||||||||||||||||
2015 | 2016 | |||||||||||||||||||||||
1ST QTR | 2ND QTR | 3RD QTR | 4TH QTR | TOTAL | 1ST QTR | 2ND QTR | TOTAL | |||||||||||||||||
INCOME STATEMENT | ||||||||||||||||||||||||
Energy | $ | 17,550 | $ | 17,008 | $ | 18,932 | $ | 16,724 | $ | 70,214 | $ | 14,186 | $ | 14,346 | $ | 28,532 | ||||||||
Aerospace & Defense | 3,045 | 3,494 | 3,298 | 4,146 | 13,982 | 3,562 | 3,011 | 6,573 | ||||||||||||||||
Segment operating income | 20,595 | 20,502 | 22,230 | 20,870 | 84,197 | 17,748 | 17,357 | 35,105 | ||||||||||||||||
Corporate expenses | (6,034 | ) | (5,477 | ) | (6,078 | ) | (4,122 | ) | (21,710 | ) | (6,488 | ) | (5,431 | ) | (11,919 | ) | ||||||||
Adjusted operating income | 14,561 | 15,025 | 16,152 | 16,748 | 62,487 | 11,260 | 11,926 | 23,186 | ||||||||||||||||
Restructuring related inventory charges | — | 2,005 | 6,412 | 974 | 9,391 | 1,958 | 75 | 2,033 | ||||||||||||||||
Impairment charges | — | — | 2,502 | — | 2,502 | — | — | — | ||||||||||||||||
Special restructuring charges, net | 1,512 | 3,127 | 342 | (347 | ) | 4,634 | 1,163 | 3,259 | 4,422 | |||||||||||||||
Special acquisition amortization | — | 2,110 | 2,490 | 2,238 | 6,838 | 1,868 | 1,911 | 3,779 | ||||||||||||||||
Special other charges, net of recoveries | (1 | ) | 183 | 7,935 | 1,603 | 9,720 | 776 | 1,334 | 2,110 | |||||||||||||||
Brazil restatement impact | 719 | 2,509 | — | — | 3,228 | — | — | — | ||||||||||||||||
Total GAAP operating income (loss) | 12,331 | 5,090 | (3,529 | ) | 12,281 | 26,174 | 5,495 | 5,347 | 10,842 | |||||||||||||||
INTEREST EXPENSE, NET | (640 | ) | (805 | ) | (828 | ) | (570 | ) | (2,844 | ) | (631 | ) | (605 | ) | (1,236 | ) | ||||||||
OTHER INCOME (EXPENSE), NET | 506 | 104 | 587 | (2,099 | ) | (902 | ) | 528 | 549 | 1,077 | ||||||||||||||
PRETAX INCOME (LOSS) | 12,197 | 4,389 | (3,770 | ) | 9,612 | 22,428 | 5,392 | 5,291 | 10,683 | |||||||||||||||
PROVISION FOR INCOME TAXES | (3,284 | ) | (2,517 | ) | (4,308 | ) | (2,456 | ) | (12,565 | ) | (1,520 | ) | (1,478 | ) | (2,998 | ) | ||||||||
EFFECTIVE TAX RATE | 26.9 | % | 57.3 | % | (114.3 | )% | 25.6 | % | 56.0 | % | 28.2 | % | 27.9 | % | 28.1 | % | ||||||||
NET INCOME (LOSS) | $ | 8,913 | $ | 1,872 | $ | (8,078 | ) | $ | 7,156 | $ | 9,863 | $ | 3,872 | $ | 3,813 | $ | 7,685 | |||||||
Weighted Average Common Shares Outstanding (Diluted) | 17,712 | 16,900 | 16,485 | 16,555 | 16,913 | 16,481 | 16,595 | 16,538 | ||||||||||||||||
EARNINGS (LOSS) PER COMMON SHARE (Diluted) | $ | 0.50 | $ | 0.11 | $ | (0.49 | ) | $ | 0.43 | $ | 0.58 | $ | 0.23 | $ | 0.23 | $ | 0.46 | |||||||
9
CIRCOR INTERNATIONAL, INC. RECONCILIATION OF KEY PERFORMANCE MEASURES TO COMMONLY USED GENERALLY ACCEPTED ACCOUNTING PRINCIPLE TERMS (in thousands, except percentages) UNAUDITED | ||||||||||||||||||||||||
2015 | 2016 | |||||||||||||||||||||||
1ST QTR | 2ND QTR | 3RD QTR | 4TH QTR | TOTAL | 1ST QTR | 2ND QTR | TOTAL | |||||||||||||||||
FREE CASH FLOW AS % OF NET INCOME (LOSS) | (207 | )% | 239 | % | (27 | )% | 397 | % | 169 | % | 96 | % | 214 | % | 155 | % | ||||||||
FREE CASH FLOW | $ | (18,415 | ) | $ | 4,483 | $ | 2,169 | $ | 28,403 | $ | 16,640 | $ | 3,720 | $ | 8,174 | $ | 11,894 | |||||||
ADD: | ||||||||||||||||||||||||
Capital expenditures, net of sale proceeds | 1,983 | 3,584 | 2,837 | 2,098 | 10,502 | 3,934 | 1,926 | 5,860 | ||||||||||||||||
NET CASH (USED IN) PROVIDED BY OPERATING ACTIVITIES | $ | (16,432 | ) | $ | 8,067 | $ | 5,006 | $ | 30,501 | $ | 27,142 | $ | 7,654 | $ | 10,100 | $ | 17,754 | |||||||
NET (CASH) DEBT | $ | (66,337 | ) | $ | 59,051 | $ | 57,277 | $ | 35,959 | $ | 35,959 | $ | 31,220 | $ | 24,630 | $ | 24,630 | |||||||
ADD: | ||||||||||||||||||||||||
Cash & cash equivalents | 103,883 | 55,027 | 53,822 | 54,541 | 54,541 | 66,580 | 72,970 | 72,970 | ||||||||||||||||
TOTAL DEBT | $ | 37,546 | $ | 114,078 | $ | 111,099 | $ | 90,500 | $ | 90,500 | $ | 97,800 | $ | 97,600 | $ | 97,600 | ||||||||
TOTAL SHAREHOLDERS' EQUITY | $ | 462,384 | $ | 421,070 | $ | 407,979 | $ | 400,777 | $ | 400,777 | $ | 414,107 | $ | 411,367 | $ | 411,367 | ||||||||
DEBT AS % OF EQUITY | 8 | % | 27 | % | 27 | % | 23 | % | 23 | % | 24 | % | 24 | % | 24 | % | ||||||||
NET DEBT AS % OF EQUITY | (14 | )% | 14 | % | 14 | % | 9 | % | 9 | % | 8 | % | 6 | % | 6 | % | ||||||||
10
CIRCOR INTERNATIONAL, INC. RECONCILIATION OF KEY PERFORMANCE MEASURES TO COMMONLY USED GENERALLY ACCEPTED ACCOUNTING PRINCIPLE TERMS (in thousands, except percentages) UNAUDITED | ||||||||||||||||||||||||
2015 | 2016 | |||||||||||||||||||||||
1ST QTR | 2ND QTR | 3RD QTR | 4TH QTR | TOTAL | 1ST QTR | 2ND QTR | TOTAL | |||||||||||||||||
ADJUSTED NET INCOME | $ | 10,564 | $ | 9,357 | $ | 10,635 | $ | 10,512 | $ | 41,068 | $ | 8,683 | $ | 8,781 | $ | 17,464 | ||||||||
LESS: | ||||||||||||||||||||||||
Restructuring related inventory charges | — | 2,005 | 6,412 | 974 | 9,391 | 1,958 | 75 | 2,033 | ||||||||||||||||
Impairment charges | — | — | 2,502 | — | 2,502 | — | — | — | ||||||||||||||||
Special restructuring charges, net | 1,512 | 3,127 | 342 | (347 | ) | 4,634 | 1,163 | 3,259 | 4,422 | |||||||||||||||
Special acquisition amortization | — | 2,110 | 2,490 | 2,238 | 6,838 | 1,868 | 1,911 | 3,779 | ||||||||||||||||
Special other charges, net of recoveries | (1 | ) | 183 | 7,935 | 1,603 | 9,720 | 776 | 1,334 | 2,110 | |||||||||||||||
Brazil restatement impact | 719 | 2,509 | — | — | 3,228 | — | — | — | ||||||||||||||||
Income tax impact | (579 | ) | (2,449 | ) | (968 | ) | (1,112 | ) | (5,108 | ) | (954 | ) | (1,611 | ) | (2,565 | ) | ||||||||
NET INCOME (LOSS) | $ | 8,913 | $ | 1,872 | $ | (8,078 | ) | $ | 7,156 | $ | 9,863 | $ | 3,872 | $ | 3,813 | $ | 7,685 | |||||||
ADJUSTED EARNINGS PER SHARE (Diluted) | $ | 0.60 | $ | 0.55 | $ | 0.64 | $ | 0.63 | $ | 2.43 | $ | 0.52 | $ | 0.53 | $ | 1.05 | ||||||||
LESS: | ||||||||||||||||||||||||
Restructuring related inventory charges | — | 0.12 | 0.39 | 0.06 | 0.57 | 0.12 | — | 0.12 | ||||||||||||||||
Impairment charges | — | — | 0.15 | — | 0.15 | — | — | — | ||||||||||||||||
Special restructuring charges, net | 0.09 | 0.19 | 0.02 | (0.02 | ) | 0.28 | 0.07 | 0.20 | 0.27 | |||||||||||||||
Special acquisition amortization | — | 0.12 | 0.15 | 0.14 | 0.41 | 0.11 | 0.12 | 0.23 | ||||||||||||||||
Special other charges, net of recoveries | — | 0.01 | 0.48 | 0.10 | 0.59 | 0.05 | 0.08 | 0.13 | ||||||||||||||||
Brazil restatement impact | 0.04 | 0.15 | — | — | 0.19 | — | — | — | ||||||||||||||||
Income tax impact | (0.03 | ) | (0.15 | ) | (0.06 | ) | (0.07 | ) | (0.31 | ) | (0.06 | ) | (0.10 | ) | (0.16 | ) | ||||||||
EARNINGS (LOSS) PER COMMON SHARE (Diluted) | $ | 0.50 | $ | 0.11 | $ | (0.49 | ) | $ | 0.43 | $ | 0.58 | $ | 0.23 | $ | 0.23 | $ | 0.46 | |||||||
11
CIRCOR INTERNATIONAL, INC. RECONCILIATION OF KEY PERFORMANCE MEASURES TO COMMONLY USED GENERALLY ACCEPTED ACCOUNTING PRINCIPLE TERMS (in thousands, except percentages) UNAUDITED | ||||||||||||||||||||||||
2015 | 2016 | |||||||||||||||||||||||
1ST QTR | 2ND QTR | 3RD QTR | 4TH QTR | TOTAL | 1ST QTR | 2ND QTR | TOTAL | |||||||||||||||||
ADJUSTED EBITDA | $ | 19,299 | $ | 19,474 | $ | 20,980 | $ | 18,927 | $ | 78,681 | $ | 15,712 | $ | 16,346 | $ | 32,058 | ||||||||
LESS: | ||||||||||||||||||||||||
Restructuring related inventory charges | — | (2,005 | ) | (6,412 | ) | (974 | ) | (9,391 | ) | (1,958 | ) | (75 | ) | (2,033 | ) | |||||||||
Impairment charges | — | — | (2,502 | ) | — | (2,502 | ) | — | — | — | ||||||||||||||
Special restructuring charges, net | (1,512 | ) | (3,127 | ) | (342 | ) | 347 | (4,634 | ) | (1,163 | ) | (3,259 | ) | (4,422 | ) | |||||||||
Special other charges, net of recoveries | 1 | (183 | ) | (7,935 | ) | (1,603 | ) | (9,720 | ) | (776 | ) | (1,334 | ) | (2,110 | ) | |||||||||
Brazil restatement impact | (719 | ) | (2,509 | ) | — | — | (3,228 | ) | — | — | — | |||||||||||||
EBITDA | $ | 17,068 | $ | 11,650 | $ | 3,789 | $ | 16,698 | $ | 49,206 | $ | 11,815 | $ | 11,678 | $ | 23,493 | ||||||||
LESS: | ||||||||||||||||||||||||
Interest expense, net | (641 | ) | (805 | ) | (828 | ) | (570 | ) | (2,844 | ) | (631 | ) | (605 | ) | (1,236 | ) | ||||||||
Depreciation | (3,521 | ) | (3,629 | ) | (3,526 | ) | (3,578 | ) | (14,254 | ) | (3,263 | ) | (3,213 | ) | (6,476 | ) | ||||||||
Amortization | (710 | ) | (2,827 | ) | (3,205 | ) | (2,939 | ) | (9,681 | ) | (2,529 | ) | (2,569 | ) | (5,098 | ) | ||||||||
Provision for income taxes | (3,284 | ) | (2,517 | ) | (4,308 | ) | (2,456 | ) | (12,565 | ) | (1,520 | ) | (1,478 | ) | (2,998 | ) | ||||||||
NET INCOME (LOSS) | $ | 8,913 | $ | 1,872 | $ | (8,078 | ) | $ | 7,156 | $ | 9,863 | $ | 3,872 | $ | 3,813 | $ | 7,685 | |||||||
12
CIRCOR INTERNATIONAL, INC. SUPPLEMENTAL SEGMENT DATA (in thousands, except percentages) UNAUDITED | ||||||||||||||||||||||||||||||||
2015 | 2016 | |||||||||||||||||||||||||||||||
1ST QTR | 2ND QTR | 3RD QTR | 4TH QTR | TOTAL | 1ST QTR | 2ND QTR | TOTAL | |||||||||||||||||||||||||
Energy | A&D | Energy | A&D | Energy | A&D | Energy | A&D | Energy | A&D | Energy | A&D | Energy | A&D | Energy | A&D | |||||||||||||||||
Adjusted operating margin | 13.8 | % | 8.0 | % | 13.4 | % | 8.8 | % | 15.4 | % | 9.1 | % | 13.4 | % | 10.4 | % | 14.0 | % | 9.1 | % | 12.6 | % | 9.3 | % | 13.0 | % | 8.4 | % | 13.8 | % | 8.0 | % |
Restructuring related inventory charges | — | % | — | % | 0.1 | % | 4.7 | % | 5.2 | % | — | % | 0.4 | % | 1.2 | % | 1.4 | % | 1.5 | % | 1.7 | % | 0.1 | % | 0.1 | % | — | % | — | % | — | % |
Impairment charges | — | % | — | % | — | % | — | % | 2.0 | % | — | % | — | % | — | % | 0.5 | % | — | % | — | % | — | % | — | % | — | % | — | % | — | % |
Special restructuring charges, net | 0.3 | % | 3.1 | % | 2.2 | % | 0.8 | % | 0.2 | % | 0.2 | % | (0.3 | )% | 0.1 | % | 0.6 | % | 1.0 | % | (0.2 | )% | 3.8 | % | 0.8 | % | 6.6 | % | 0.3 | % | 3.1 | % |
Special acquisition amortization | — | % | — | % | 1.7 | % | — | % | 2.0 | % | — | % | 1.8 | % | — | % | 1.4 | % | — | % | 1.7 | % | — | % | 1.7 | % | — | % | — | % | — | % |
Special other charges, net of recoveries | 0.4 | % | (2.6 | )% | 0.2 | % | (0.2 | )% | 6.5 | % | — | % | 0.7 | % | — | % | 1.9 | % | (0.7 | )% | 0.7 | % | — | % | 1.2 | % | — | % | 0.4 | % | (2.6 | )% |
Brazil restatement impact | 0.6 | % | — | % | 2.0 | % | — | % | — | % | — | % | — | % | — | % | 0.6 | % | — | % | — | % | — | % | — | % | — | % | 0.6 | % | — | % |
GAAP operating margin | 12.5 | % | 7.5 | % | 7.2 | % | 3.5 | % | (0.6 | )% | 8.9 | % | 10.9 | % | 9.1 | % | 7.6 | % | 7.2 | % | 8.8 | % | 5.5 | % | 9.1 | % | 1.8 | % | 12.5 | % | 7.5 | % |
2015 | 2016 | |||||||||||||||||||||||||||||||||||||||||||||||
1ST QTR | 2ND QTR | 3RD QTR | 4TH QTR | TOTAL | 1ST QTR | 2ND QTR | TOTAL | |||||||||||||||||||||||||||||||||||||||||
Energy | A&D | Energy | A&D | Energy | A&D | Energy | A&D | Energy | A&D | Energy | A&D | Energy | A&D | Energy | A&D | |||||||||||||||||||||||||||||||||
Adjusted operating income | $ | 17,550 | $ | 3,045 | $ | 17,008 | $ | 3,494 | $ | 18,932 | $ | 3,298 | $ | 16,724 | $ | 4,146 | $ | 70,214 | $ | 13,982 | $ | 14,186 | $ | 3,562 | $ | 14,346 | $ | 3,011 | $ | 28,532 | $ | 6,573 | ||||||||||||||||
Restructuring related inventory charges | — | — | 153 | 1,852 | 6,412 | — | 508 | 466 | 7,073 | 2,318 | 1,919 | 39 | 74 | — | 1,993 | 39 | ||||||||||||||||||||||||||||||||
Impairment charges | — | — | — | — | 2,502 | — | — | — | 2,502 | — | — | — | — | — | — | — | ||||||||||||||||||||||||||||||||
Special restructuring charges, net | 343 | 1,169 | 2,818 | 309 | 279 | 63 | (394 | ) | 47 | 3,046 | 1,588 | (278 | ) | 1,441 | 900 | 2,359 | 622 | 3,800 | ||||||||||||||||||||||||||||||
Special acquisition amortization | — | — | 2,110 | — | 2,490 | — | 2,238 | — | 6,838 | — | 1,868 | — | 1,911 | — | 3,779 | — | ||||||||||||||||||||||||||||||||
Special other charges, net of recoveries | 556 | (977 | ) | 248 | (65 | ) | 7,935 | — | 828 | — | 9,567 | (1,042 | ) | 774 | — | 1,335 | — | 2,109 | — | |||||||||||||||||||||||||||||
Brazil restatement impact | 719 | — | 2,509 | — | — | — | — | — | 3,228 | — | — | — | — | — | — | — | ||||||||||||||||||||||||||||||||
GAAP operating income | $ | 15,932 | $ | 2,853 | $ | 9,170 | $ | 1,398 | $ | (686 | ) | $ | 3,235 | $ | 13,544 | $ | 3,633 | $ | 37,960 | $ | 11,118 | $ | 9,903 | $ | 2,082 | $ | 10,126 | $ | 652 | $ | 20,029 | $ | 2,734 | |||||||||||||||
13