Attached files
| file | filename |
|---|---|
| EX-32.1 - Shepherd's Finance, LLC | ex32-1.htm |
| EX-31.1 - Shepherd's Finance, LLC | ex31-1.htm |
UNITED STATES
SECURITIES AND EXCHANGE COMMISSION
WASHINGTON, DC 20549
FORM 10-Q
[X] Quarterly Report Pursuant to Section 13 or 15(d) of the Securities Exchange Act of 1934
For the Quarterly Period Ended June 30, 2016
or
[ ] Transition Report Pursuant to Section 13 or 15(d) of the Securities Exchange Act of 1934
For the Transition Period From to
Commission File Number 333-203707
SHEPHERD’S FINANCE, LLC
(Exact name of registrant as specified on its charter)
| DELAWARE | 36-4608739 | |
| (State or other jurisdiction of | (I.R.S. Employer | |
| Incorporation or organization) | Identification No.) |
12627 San Jose Blvd., Suite 203, Jacksonville, FL 32223
(Address of principal executive offices)
302-752-2688
(Registrant’s telephone number including area code)
Indicate by check mark whether the registrant (1) has filed all reports required to be filed by section 13 or 15(d) of the Securities Exchange Act of 1934 during the preceding 12 months (or for such shorter period that the registrant was required to file such reports) and (2) has been subject to such filing requirements for the past 90 days. Yes [X] No [ ]
Indicate by check mark whether the registrant has submitted electronically and posted on its corporate Web site, if any, every Interactive Data File required to be submitted and posted pursuant to Rule 405 of Regulation S-T (§232.405 of this chapter) during the preceding 12 months (or for such shorter period that the registrant was required to submit and post such files). Yes [X] No [ ]
Indicate by check mark whether the registrant is a large accelerated filer, accelerated filer, or non-accelerated filer. See definition of “accelerated filer and large accelerated filer” in Rule 12b-2 of the Exchange Act.
| Large accelerated filer | [ ] | Accelerated filer | [ ] |
| Non-accelerated filer | [ ] | Smaller reporting company | [X] |
Indicate by check mark whether the registrant is a shell company (as defined in Rule 12b-2 of the Exchange Act). Yes [ ] No [X]
FORM 10-Q
SHEPHERD’S FINANCE, LLC
TABLE OF CONTENTS
| 2 |
CAUTIONARY NOTE REGARDING FORWARD-LOOKING STATEMENTS
Certain statements contained in this Form 10-Q of Shepherd’s Finance, LLC, other than historical facts, may be considered forward-looking statements within the meaning of the federal securities laws. Words such as “may,” “will,” “expect,” “anticipate,” “believe,” “estimate,” “continue,” “predict,” or other similar words identify forward-looking statements. Forward-looking statements appear in a number of places in this report, including without limitation, “Management’s Discussion and Analysis of Financial Condition and Results of Operations,” and include statements regarding our intent, belief or current expectation about, among other things, trends affecting the markets in which we operate, our business, financial condition and growth strategies. Although we believe that the expectations reflected in these forward-looking statements are based on reasonable assumptions, forward-looking statements are not guarantees of future performance and involve risks and uncertainties. Actual results may differ materially from those predicted in the forward-looking statements as a result of various factors, including but not limited to those set forth in the “Risk Factors” section of our Annual Report on Form 10-K for the year ended December 31, 2015, as filed with the Securities and Exchange Commission. If any of the events described in “Risk Factors” occur, they could have an adverse effect on our business, consolidated financial condition, results of operations and cash flows.
When considering forward-looking statements, you should keep these risk factors, as well as the other cautionary statements in this report and in our 2015 Form 10-K in mind. You should not place undue reliance on any forward-looking statement. We are not obligated to update forward-looking statements.
| 3 |
PART I – FINANCIAL INFORMATION
Shepherd’s Finance, LLC
Interim Condensed Consolidated Balance Sheets
| As of | ||||||||
| (in thousands of dollars) | June 30, 2016 | December 31, 2015 | ||||||
| (Unaudited) | ||||||||
| Assets | ||||||||
| Cash and cash equivalents | $ | 1,032 | $ | 1,341 | ||||
| Accrued interest on loans | 294 | 146 | ||||||
| Loans receivable, net | 16,595 | 14,060 | ||||||
| Foreclosed assets | 3,153 | 965 | ||||||
| Other assets | 124 | 14 | ||||||
| Total assets | $ | 21,198 | $ | 16,526 | ||||
| Liabilities and Members’ Capital | ||||||||
| Customer interest escrow | $ | 418 | $ | 498 | ||||
| Accounts payable and accrued expenses | 1,000 | 539 | ||||||
| Notes payable secured | 5,476 | 3,683 | ||||||
| Notes payable unsecured, net of deferred financing costs | 10,899 | 8,497 | ||||||
| Due to preferred equity member | 26 | 25 | ||||||
| Total liabilities | 17,819 | 13,242 | ||||||
| Commitments and Contingencies (Notes 4 and 8) | ||||||||
| Series B preferred equity | 1,060 | 1,010 | ||||||
| Class A common equity | 2,319 | 2,274 | ||||||
| Members’ capital | 3,379 | 3,284 | ||||||
| Total liabilities and members’ capital | $ | 21,198 | $ | 16,526 | ||||
The accompanying notes are an integral part of these interim condensed consolidated financial statements.
| 4 |
Shepherd’s Finance, LLC
Interim Condensed Consolidated Statements of Operations – Unaudited
| Three Months Ended | Six Months Ended | |||||||||||||||
| June 30, | June 30, | |||||||||||||||
| (in thousands of dollars) | 2016 | 2015 | 2016 | 2015 | ||||||||||||
| Interest Income | ||||||||||||||||
| Interest and fee income on loans | $ | 898 | $ | 410 | $ | 1,747 | $ | 786 | ||||||||
| Interest expense | 436 | 183 | 798 | 359 | ||||||||||||
| Net interest income | 462 | 227 | 949 | 427 | ||||||||||||
| Less: Loan loss provision | (2 | ) | 15 | 6 | 23 | |||||||||||
| Net interest income after loan loss provision | 464 | 212 | 943 | 404 | ||||||||||||
| Non-Interest Income | ||||||||||||||||
| Gain from foreclosure of assets | 44 | – | 44 | – | ||||||||||||
| Income | 508 | 212 | 987 | 404 | ||||||||||||
| Non-Interest Expense | ||||||||||||||||
| Selling, general and administrative | 305 | 119 | 655 | 269 | ||||||||||||
| Total non-interest expense | 305 | 119 | 655 | 269 | ||||||||||||
| Net Income | $ | 203 | $ | 93 | $ | 332 | $ | 135 | ||||||||
| Earned distribution to preferred equity holder | 26 | 25 | 52 | 50 | ||||||||||||
| Net income attributable to common equity holder | $ | 177 | $ | 68 | $ | 280 | $ | 85 | ||||||||
The accompanying notes are an integral part of these interim condensed consolidated financial statements.
| 5 |
Shepherd’s Finance, LLC
Interim Condensed Consolidated Statement of Changes in Members’ Capital – Unaudited
| Six Months | ||||
| Ended | ||||
| (in thousands of dollars) | June 30, 2016 | |||
| Members’ capital, as of December 31, 2015 | $ | 3,284 | ||
| Net income | 332 | |||
| Additional capital (preferred) | 50 | |||
| Earned distributions to preferred equity holder | (52 | ) | ||
| Distributions to common equity holders | (235 | ) | ||
| Members’ capital, as of June 30, 2016 | $ | 3,379 | ||
The accompanying notes are an integral part of these interim condensed consolidated financial statements.
| 6 |
Shepherd’s Finance, LLC
Interim Condensed Consolidated Statements of Cash Flows – Unaudited
| Six Months Ended | ||||||||
| June 30, | ||||||||
| (in thousands of dollars) | 2016 | 2015 | ||||||
| Cash flows from operations | ||||||||
| Net income | $ | 332 | $ | 135 | ||||
| Adjustments to reconcile net income to net cash provided by (used in) operating activities | ||||||||
| Amortization of deferred financing costs | 134 | 105 | ||||||
| Provision for loan losses | 6 | 23 | ||||||
| Net loan origination fees deferred (earned) | (93 | ) | (26 | ) | ||||
| Change in deferred origination expense | (30 | ) | – | |||||
| Gain on foreclosed assets | (44 | ) | – | |||||
| Net change in operating assets and liabilities | ||||||||
| Other assets | (110 | ) | (13 | ) | ||||
| Accrued interest on loans | (278 | ) | (30 | ) | ||||
| Customer interest escrow | (80 | ) | 285 | |||||
| Accounts payable and accrued expenses | 461 | 152 | ||||||
| Net cash provided by (used in) operating activities | 298 | 631 | ||||||
| Cash flows from investing activities | ||||||||
| Loan originations and principal collections, net | (4,057 | ) | (795 | ) | ||||
| Investment in foreclosed assets | (375 | ) | – | |||||
| Net cash provided by (used in) investing activities | (4,432 | ) | (795 | ) | ||||
| Cash flows from financing activities | ||||||||
| Contributions from members | 50 | – | ||||||
| Distributions to members | (286 | ) | (112 | ) | ||||
| Proceeds from secured note payable | 5,023 | 1,344 | ||||||
| Repayments of secured note payable | (3,230 | ) | (515 | ) | ||||
| Proceeds from unsecured notes payable | 2,355 | 1,804 | ||||||
| Redemptions of unsecured notes payable | (59 | ) | (540 | ) | ||||
| Repayment of unsecured note payable | –– | (375 | ) | |||||
| Deferred financing costs paid | (28 | ) | (97 | ) | ||||
| Net cash provided by (used in) financing activities | 3,825 | 1,509 | ||||||
| Net increase (decrease) in cash and cash equivalents | (309 | ) | 1,345 | |||||
| Cash and cash equivalents | ||||||||
| Beginning of period | 1,341 | 558 | ||||||
| End of period | $ | 1,032 | $ | 1,903 | ||||
| Supplemental disclosure of cash flow information | ||||||||
| Cash paid for interest | $ | 378 | $ | 113 | ||||
| Non-cash investing and financing activities | ||||||||
| Earned but not paid distribution to preferred equity holder | $ | 26 | $ | 25 | ||||
| Foreclosure of assets | $ | 1,813 | $ | – | ||||
| Accrued interest reduction due to foreclosure | $ | 130 | $ | – | ||||
| Net loan origination fees (earned) due to foreclosure | $ | (55 | ) | $ | – | |||
The accompanying notes are an integral part of these interim condensed consolidated financial statements.
| 7 |
Shepherd’s Finance, LLC
Notes to Interim Condensed Consolidated Financial Statements (unaudited)
Information presented throughout these notes to the interim condensed consolidated financial statements (Unaudited) is in thousands of dollars.
1. Description of Business and Basis of Presentation
Description of Business
Description of Business
Shepherd’s Finance, LLC and subsidiaries (the “Company”, “we” or “our”) is a finance company that engages in commercial lending to residential homebuilders, financing construction of single family homes and residential development. The loans are extended to residential homebuilders and, as such, are commercial loans. We primarily fund our lending and operations by continued extension of Notes to the general public, which Notes are unsecured subordinated debt. We currently have six sources of capital:
June 30, 2016 | December 31, 2015 | |||||||
| Capital Source | ||||||||
| Purchase and sale agreements | $ | 5,476 | $ | 3,683 | ||||
| Secured line of credit from affiliates | – | – | ||||||
| Unsecured Notes through our Notes offer, net of deferred costs | 10,199 | 7,897 | ||||||
| Other unsecured debt | 700 | 600 | ||||||
| Preferred equity | 1,060 | 1,010 | ||||||
| Common equity | 2,319 | 2,274 | ||||||
| Total | $ | 19,754 | $ | 15,464 | ||||
Certain features of the purchase and sale agreements have added liquidity and flexibility, which have lessened the need for the lines of credit from affiliates. Eventually, the Company intends to permanently replace the lines of credit to affiliates with a secured line of credit from a bank or through other liquidity.
Basis of Presentation
The accompanying (a) condensed consolidated balance sheet as of December 31, 2015, which has been derived from audited consolidated financial statements, and (b) unaudited interim condensed consolidated financial statements have been prepared in accordance with accounting principles generally accepted in the United States of America (“U.S. GAAP”) for interim financial information and the instructions to Form 10-Q and Article 10 of Regulation S-X. While certain information and disclosures normally included in financial statements prepared in accordance with U.S. GAAP have been condensed or omitted pursuant to the rules and regulations of the Securities and Exchange Commission (“SEC”), management believes that the disclosures herein are adequate to make the unaudited interim condensed consolidated information presented not misleading. In the opinion of management, the unaudited interim condensed consolidated financial statements reflect all adjustments necessary for a fair presentation of the consolidated financial position, results of operations and cash flows for the periods presented. Such adjustments are of a normal, recurring nature. The results of operations for any interim period are not necessarily indicative of results expected for the fiscal year ending December 31, 2016. These unaudited interim condensed consolidated financial statements should be read in conjunction with the 2015 consolidated financial statements and notes thereto included in the Company’s Annual Report on Form 10-K as of and for the year ended December 31, 2015 (the “2015 Statements”). The accounting policies followed by the Company are set forth in Note 2 - Summary of Significant Accounting Policies of the notes to the 2015 Statements.
| 8 |
2. Summary of Significant Accounting Policies
Segment Reporting
We report all ongoing operations in one segment, commercial lending.
Use of Estimates
The preparation of consolidated financial statements in conformity with U.S. GAAP requires management to make estimates and assumptions that affect the reported amounts of assets and liabilities and disclosure of contingent assets and liabilities at the date of the interim condensed consolidated financial statements and the reported amounts of revenues and expenses during the reporting period. Actual results could differ from those estimates. It is reasonably possible that market conditions could deteriorate, which could materially affect our consolidated financial position, results of operations, and cash flows. Among other effects, such changes could result in the need to increase the amount of our allowance for loan losses.
Revenue Recognition
Interest income generally is recognized on an accrual basis. The accrual of interest is generally discontinued on all loans past due 90 days or more. All interest accrued but not collected for loans that are placed on nonaccrual or charged off is reversed against interest income, unless management believes that the accrued interest is recoverable through liquidation of collateral. Interest received on nonaccrual loans is applied against principal. Interest on accruing impaired loans is recognized as long as such loans do not meet the criteria for nonaccrual status.
Advertising
Advertising costs are expensed as incurred and are included in selling, general and administrative. Advertising expenses were $25 and $10 for the six months ended June 30, 2016 and 2015, respectively.
Cash and Cash Equivalents
Management considers highly-liquid investments with original maturities of three months or less to be cash equivalents.
Fair Value Measurements
The Company follows the guidance of the Financial Accounting Standards Board (FASB) Accounting Standards Codification Topic (ASC) 825, Financial Instruments, and ASC 820, Fair Value Measurements. ASC 825 permits entities to measure many financial instruments and certain other items at fair value. The objective is to improve financial reporting by providing entities with the opportunity to mitigate volatility in reported earnings caused by measuring related assets and liabilities differently without having to apply complex hedge accounting provisions. ASC 820 clarifies that fair value is an exit price, representing the amount that would be received to sell an asset or paid to transfer a liability in an orderly transaction between market participants. Under this guidance, fair value measurements are not adjusted for transaction costs. This guidance establishes a fair value hierarchy that prioritizes the inputs to valuation techniques used to measure fair value. The hierarchy gives the highest priority to unadjusted quoted prices in active markets for identical assets or liabilities (Level 1 measurements) and the lowest priority to unobservable inputs (Level 3 measurements). See Note 3.
Loans Receivable
Loans are stated at the amount of unpaid principal, net of any allowances for loan losses, and adjusted for (1) the net unrecognized portion of direct costs and nonrefundable loan fees associated with lending, and (2) deposits made by the borrowers used as collateral for a loan and due back to the builder at or prior to loan payoff. The net amount of nonrefundable loan origination fees and direct costs associated with the lending process, including commitment fees, is deferred and accreted to interest income over the lives of the loans using a method that approximates the interest method.
| 9 |
A loan is classified as nonaccrual, and the accrual of interest on such loan is discontinued, when the contractual payment of principal or interest becomes 90 days past due. In addition, a loan may be placed on nonaccrual at any other time management has serious doubts about further collectability of principal or interest according to the contractual terms, even though the loan is currently performing. A loan may remain on accrual status if it is in the process of collection or well-secured (i.e., the loan has sufficient collateral value). Loans are restored to accrual status when the obligation is brought current or has performed in accordance with the contractual terms for a reasonable period of time and the ultimate collectability of the total contractual principal and interest is no longer in doubt.
A loan is considered impaired when, based on current information and events, it is probable that the Company will be unable to collect the scheduled payments of principal or interest when due according to the contractual terms of the loan agreement. Impaired loans, or portions thereof, are charged off when deemed uncollectible. Once a loan is 90 days past due, management begins a workout plan with the borrower or commences its foreclosure process on the collateral.
Allowance for Loan Losses
The allowance for loan losses is maintained at a level believed adequate by management to absorb probable losses inherent in the loan portfolio.
We establish a collective reserve for all loans which are not more than 60 days past due at the end of a quarter. This collective reserve takes into account both historical information and a qualitative analysis of housing and other economic factors that may impact our future realized losses. For loans to one borrower with committed balances less than 10% of our total committed balances on all loans extended to all customers, we individually analyze for impairment all loans which are more than 60 days past due at the end of a quarter. For loans to one borrower with committed balances equal to or greater than 10% of our total committed balances on all loans extended to all customers, we individually analyze all loans for potential impairment. The analysis of loans, if required, includes a comparison of estimated collateral value to the principal amount of the loan. For impaired loans, if the value determined is less than the principal amount due (less any builder deposit), then the difference is included in the allowance for loan loss. As values change, estimated loan losses may be provided for more or less than the previous period, and some loans may not need a loss provision based on payment history. For homes which are partially complete, we appraise on an as-is and completed basis, and use the one that more closely aligns with our planned method of disposal for the property.
For loans greater than 12 months in age that are individually evaluated for impairment, appraisals have been prepared within the last 13 months. For all loans individually evaluated for impairment, there is also a broker’s opinions of value (“BOV”) prepared, if the appraisal is more than six months old. The lower of any BOV prepared in the last six months, or the most recent appraisal, is used, unless we determine a BOV to be invalid based on the comparable sales used. If we determine a BOV to be invalid, we will use the appraised value. Appraised values are adjusted down for estimated costs associated with asset disposal. Broker’s opinion of selling price, currently valid sales contracts on the subject property, or representative recent actual closings by the builder on similar properties may be used in place of a BOV.
Impaired Loans
A loan is considered to be impaired when it is probable the Company will be unable to collect all principal and interest payments due in accordance with the contractual terms of the loan agreement. The analysis of impaired loans includes a comparison of estimated collateral value to the principal amount of the loan. If the value determined is less than the principal amount due (less any builder deposit), then the difference is included in the allowance for loan loss. As values change, estimated loan losses may be provided for more or less than the previous period. For homes which are partially complete, we appraise on an as-is and completed basis, and use the one that more closely aligns with our planned method of disposal for the property. For loans greater than 12 months in age that are individually evaluated for impairment, appraisals have been prepared within the last 13 months. For all loans individually evaluated for impairment, there is also a BOV prepared, if the appraisal is more than six months old. The lower of any BOV prepared in the last six months, or the most recent appraisal, is used, unless we determine a BOV to be invalid based on the comparable sales used. If we determine a BOV to be invalid, we will use the appraised value. Appraised values are adjusted down for estimated costs associated with asset disposal. Broker’s opinion of selling price, currently valid sales contracts on the subject property, or representative recent actual closings by the builder on similar properties may be used in place of a BOV.
| 10 |
Deferred Financing Costs, Net
We defer certain costs associated with financing activities related to the issuance of debt securities (deferred financing costs). These costs consist primarily of professional fees incurred related to the transactions. Deferred financing costs are amortized into interest expense over the life of the related debt. We make estimates for the average duration of future investments. If these estimates are determined to be incorrect in the future, the rate at which we are amortizing the deferred offering costs as interest expense would be adjusted and could have a material impact on the consolidated financial statements. The deferred financing costs are reflected as a reduction in the unsecured notes offering liability. The Company adopted the guidance on the presentation of debt issuance costs on January 1, 2016, as required. As a result, the Company retrospectively applied the guidance to the 2015 Consolidated Balance Sheet by reclassifying $599 of deferred financing costs previously classified in the assets section.
The following is a roll forward of deferred financing costs:
| Six Months | Six Months | |||||||||||
| Ended | Year Ended | Ended | ||||||||||
| June 30, 2016 | December 31, 2015 | June 30, 2015 | ||||||||||
| Deferred financing costs, beginning balance | $ | 935 | $ | 737 | $ | 737 | ||||||
| Additions | 28 | 198 | 97 | |||||||||
| Deferred financing costs, ending balance | $ | 963 | $ | 935 | $ | 834 | ||||||
| Less accumulated amortization | (470 | ) | (336 | ) | (212 | ) | ||||||
| Deferred financing costs, net | $ | 493 | $ | 599 | $ | 622 | ||||||
The following is a roll forward of the accumulated amortization of deferred financing costs:
| Six Months | Six Months | |||||||||||
| Ended | Year Ended | Ended | ||||||||||
| June 30, 2016 | December 31, 2015 | June 30, 2015 | ||||||||||
| Accumulated amortization, beginning balance | $ | 336 | $ | 107 | $ | 107 | ||||||
| Additions | 134 | 229 | 105 | |||||||||
| Accumulated amortization, ending balance | $ | 470 | $ | 336 | $ | 212 | ||||||
Income Taxes
The entities included in the consolidated financial statements are organized as pass-through entities under the Internal Revenue Code. As such, taxes are the responsibility of the members. Other significant taxes for which the Company is liable are recorded on an accrual basis.
The Company applies ASC Topic 740, Income Taxes. ASC 740 provides guidance for how uncertain tax positions should be recognized, measured, presented and disclosed in the consolidated financial statements and requires the evaluation of tax positions taken or expected to be taken in the course of preparing the Company’s consolidated financial statements to determine whether the tax positions are “more-likely-than-not” to be sustained by the applicable tax authority. Tax positions with respect to income tax at the LLC level not deemed to meet the “more-likely-than-not” threshold would be recorded as a tax benefit or expense in the appropriate period. Management concluded that there are no uncertain tax positions that should be recognized in the consolidated financial statements. With few exceptions, the Company is no longer subject to income tax examinations for years prior to 2012.
The Company’s policy is to record interest and penalties related to taxes in interest expense on the consolidated statements of operations. There have been no significant interest or penalties assessed or paid.
| 11 |
Risks and Uncertainties
The Company is subject to many of the risks common to the commercial lending and real estate industries, such as general economic conditions, decreases in home values, decreases in housing starts, and high unemployment. These risks, which could have a material and negative impact on the Company’s consolidated financial condition, results of operations, and cash flows include, but are not limited to, declines in housing starts, unfavorable changes in interest rates, and competition from other lenders. At June 30, 2016, our loans were significantly concentrated in a suburb of Pittsburgh, Pennsylvania, so the housing starts and prices in that area are more significant to our business than other areas until and if more loans are created in other markets.
Concentrations
Financial instruments that potentially subject the Company to concentrations of credit risk consist principally of loans receivable. As of June 30, 2016 and December 31, 2015, 41% and 37%, respectively, of our outstanding loan commitments consist of loans to one borrower, and the collateral is in one real estate market, Pittsburgh, Pennsylvania. Accordingly, the ultimate collectability of a significant portion of these loans is susceptible to changes in market conditions in that area. As of June 30, 2016, our next two largest customers make up 14% and 8% respectively of our loan commitments, with loans in Sarasota, Florida and Savannah, Georgia, respectively. As of December 31, 2015, our next two largest customers made up 22% and 6% respectively of our loan commitments, with loans in Sarasota, Florida and Columbia, South Carolina, respectively.
Recent Accounting Pronouncements
The FASB issued Accounting Standards Update (ASU) 2014-09, “Revenue from Contracts with Customers (Topic 606).” ASU 2014-09 implements a common revenue standard that clarifies the principles for recognizing revenue. The core principle of ASU 2014-09 is that an entity should recognize revenue to depict the transfer of promised goods or services to customers in an amount that reflects the consideration to which the entity expects to be entitled in exchange for those goods or services. To achieve that core principle, an entity should apply the following steps: (i) identify the contract(s) with a customer, (ii) identify the performance obligations in the contract, (iii) determine the transaction price, (iv) allocate the transaction price to the performance obligations in the contract and (v) recognize revenue when (or as) the entity satisfies a performance obligation. ASU 2014-09 is effective for the Company on January 1, 2018. The Company is still evaluating the potential impact on the Company’s consolidated financial statements.
In April 2015, the FASB issued ASU No. 2015-03, Interest - Imputation of Interest (Subtopic 835-30): Simplifying the Presentation of Debt Issuance Costs. The amendments in this ASU require that debt issuance costs related to a recognized debt liability be presented in the balance sheet as a direct deduction from the carrying amount of that debt liability, consistent with debt discounts. This guidance required retrospective application. The Company adopted the guidance on January 1, 2016, as required. See Note 1-Deferred Financing Costs, Net for additional information regarding the adoption of the new guidance
| 12 |
On January 5, 2016, the FASB issued ASU 2016-01, Financial Instruments–Overall: Recognition and Measurement of Financial Assets and Financial Liabilities. Changes to the current GAAP model primarily affect the accounting for equity investments, financial liabilities under the fair value option, and the presentation and disclosure requirements for financial instruments. In addition, the FASB clarified guidance related to the valuation allowance assessment when recognizing deferred tax assets resulting from unrealized losses on available-for-sale debt securities. The accounting for other financial instruments, such as loans, investments in debt securities, and financial liabilities is largely unchanged. The ASU also eliminates the requirement for public business entities to disclose the method(s) and significant assumptions used to estimate the fair value that is required to be disclosed for financial instruments measured at amortized cost. The guidance is effective for public companies for fiscal years beginning after December 15, 2017, including interim periods within those fiscal years, and early application is permitted. The Company is currently evaluating the impact of this amendment on the consolidated financial statements.
In February 2016, the FASB issued FASB ASU 2016-02, Leases (“ASU 2016-02”), which eliminates the current tests for lease classification under U.S. GAAP and requires lessees to recognize the right-to-use assets and related lease liabilities on the balance sheet. ASU 2016-02 is effective for annual and interim periods beginning after December 15, 2018 and early application is permitted. The new standard provides for a modified retrospective application for leases existing at, or entered into after, the earliest comparative period presented in the financial statements. The Company is currently evaluating the impact of this amendment on the consolidated financial statements.
In June 2016, the FASB issued ASU 2016-13, Financial Instruments - Credit Losses: Measurement of Credit Losses on Financial Instruments (the ASU), which introduces the current expected credit losses methodology. Among other things, the ASU requires the measurement of all expected credit losses for financial assets, including available-for-sale debt securities, held at the reporting date based on historical experience, current conditions, and reasonable and supportable forecasts that affect the collectability of the reported amount. The new model will require institutions to calculate all probable and estimable losses that are expected to be incurred through the loan’s entire life. ASU 2016-13 also requires the allowance for credit losses for purchased financial assets with credit deterioration since origination to be determined in a manner similar to that of other financial assets measured at amortized cost; however, the initial allowance will be added to the purchase price rather than recorded as credit loss expense. The disclosure of credit quality indicators related to the amortized cost of financing receivables will be further disaggregated by year of origination (or vintage). Disaggregation by vintage will be optional for nonpublic business entities. Institutions are to apply the changes through a cumulative-effect adjustment to their retained earnings as of the beginning of the first reporting period in which the standard is effective. The amendments are effective for fiscal years beginning after December 15, 2020. Early application will be permitted for fiscal years beginning after December 15, 2018. The Company is currently evaluating the impact of these amendments on the consolidated financial statements.
Subsequent Events
Management of the Company has evaluated subsequent events through July 28, 2016, the date these consolidated financial statements were issued. See Note 12.
3. Fair Value
Utilizing ASC 820, the Company has established a framework for measuring fair value under U.S. GAAP using a hierarchy, which requires the Company to maximize the use of observable inputs and minimize the use of unobservable inputs. Fair value measurements are an exit price, representing the amount that would be received to sell an asset or paid to transfer a liability in an orderly transaction between market participants. Three levels of inputs are used to measure fair value, as follows:
| Level 1 – | quoted prices in active markets for identical assets or liabilities; | |
| Level 2 – | quoted prices in active markets for similar assets and liabilities and inputs that are observable for the asset or liability; or | |
| Level 3 – | unobservable inputs, such as discounted cash flow models or valuations. |
| 13 |
A financial instrument’s level within the fair value hierarchy is based on the lowest level of input that is significant to the fair value measurement.
Fair Value Measurements of Financial Assets on a Recurring Basis
The Company has no financial and non-financial assets or liabilities measured at fair value on a recurring basis.
Fair Value Measurements of Financial Assets on a Non-recurring Basis
Certain assets are measured at fair value on a non-recurring basis when there is evidence of impairment. The fair values of impaired loans with specific allocations of the allowance for loan losses are generally based on recent real estate appraisals of the collateral less estimated cost to sell. Declines in the fair values of other real estate owned subsequent to their initial acquisitions are also based on recent real estate appraisals less selling costs.
Fair value estimates are determined using the methodology discussed in Note 2. The real estate appraisals are on similar properties at similar times, however due to the differences in time and properties, the fair values estimates for impaired loans and foreclosed assets are classified as Level 3 inputs. There were no impaired assets as of June 30, 2016 or December 31, 2015.
Impaired Loans
Fair value estimates are determined using the methodology discussed in Note 2. The appraisals are on similar properties at similar times, however due to the differences in time and properties, the impaired loans are classified as Level 3. There were no impaired loan assets as of June 30, 2016 or December 31, 2015.
Foreclosed assets
Foreclosed assets (upon initial recognition or subsequent impairment) are non-financial assets measured at fair value on a non-recurring basis.
During both 2016 and 2015, certain foreclosed assets, upon initial recognition, were measured and reported at fair value. The excess of fair value measurements of foreclosed assets over the carrying value of the underlying loans result in a gain in non-interest income. The excess of the carrying value of the underlying loans over the fair value measurements of foreclosed assets are charged-off to the allowance for possible loan losses. These valuations are Level 3 valuations because the appraisal is comparing similar properties which sold at a similar date, but not the same. Foreclosed assets were $3,153 and $965 as of June 30, 2016 and December 31, 2015, respectively. In connection with the measurement and initial recognition of the foregoing foreclosed assets in 2015, the Company recognized a gain in non-interest income of approximately $105 subsequent to June 30, 2015. During 2015, there were no foreclosed assets remeasured at fair value subsequent to initial recognition. In connection with the measurement and initial recognition of the foregoing foreclosed assets in 2016, the Company recognized a gain in non-interest income of approximately $44. During 2016, there were no foreclosed assets remeasured at fair value subsequent to initial recognition.
Fair Value of Financial Instruments
ASC 825 requires disclosure of fair value information about financial instruments, whether or not recognized on the face of the balance sheet, for which it is practicable to estimate that value. The following methods and assumptions were used by the Company in estimating the fair value of its financial instruments:
Cash and Cash Equivalents
The carrying amount approximates fair value because of the short maturity of these instruments.
| 14 |
Loans Receivable and Commitments to Extend Credit
For variable rate loans that reprice frequently with no significant change in credit risk, estimated fair values of collateral are based on carrying values at June 30, 2016 and December 31, 2015. The estimated fair values for other loans are calculated by discounting the future cash flows using current rates at which similar loans would be made to borrowers with similar credit ratings and the same remaining maturities and approximate carrying values of these instruments at June 30, 2016 and December 31, 2015. Because the loans are demand loan and therefore have no known time horizon, there is no significant impact from fluctuating interest rates. For unfunded commitments to extend credit, because there would be no adjustment between fair value and carrying amount for the amount if actually loaned, there is no adjustment to the amount before it is loaned. The amount for commitments to extend credit is not listed in the tables below because there is no difference between carrying value and fair value, and the amount is not recorded on the consolidated balance sheets as a liability.
Interest Receivable
Although interest receivable from our customers does not yield additional interest to us, because interest is due roughly 10 days after it is billed, the impact is negligible and the fair value approximates the carrying value at both June 30, 2016 and December 31, 2015.
Other Assets
Other assets at June 30, 2016 were $124, of which $99 were short term receivables established on June 30, 2016 for two different transactions. These funds were received in the first week of July 2016 and are treated as Interest Receivable for fair value measurement.
Customer Interest Escrow
The customer interest escrow does not yield interest to the customer, but because: 1) the customer loans are demand loans, 2) there is no way to estimate how long the escrow will be in place, and 3) the interest rate which could be used to discount this amount is negligible, the fair value approximates the carrying value at both June 30, 2016 and December 31, 2015.
Borrowings under Credit Facilities
The fair value of the Company’s borrowings under credit facilities is estimated based on the expected cash flows discounted using the current rates offered to the Company for debt of the same remaining maturities. As all of the borrowings under credit facilities or the Notes are either payable on demand or at similar rates to what the Company can borrow funds for today, the fair value of the borrowings is determined to approximate carrying value at June 30, 2016 and December 31, 2015. The interest on our Notes offering is paid to our Note Holders either monthly or at the end of their investment, compounding on a monthly basis. For the same reasons as the determination for the principal balances on the Notes, the fair value approximates the carrying value for the interest as well. The interest payable makes up the bulk of our accounts payable and accrued expenses.
| 15 |
The table below is a summary of fair value estimates for financial instruments and the level of the fair value hierarchy (as discussed in Note 2) within which the fair value measurements are categorized at the periods indicated:
June 30, 2016
| Quoted Prices | ||||||||||||||||||||
| in Active | Significant | |||||||||||||||||||
| Markets for | Other | Significant | ||||||||||||||||||
| Identical | Observable | Unobservable | ||||||||||||||||||
| Carrying | Estimated | Assets | Inputs | Inputs | ||||||||||||||||
| Amount | Fair Value | Level 1 | Level 2 | Level 3 | ||||||||||||||||
| Financial Assets | ||||||||||||||||||||
| Cash and cash equivalents | $ | 1,032 | $ | 1,032 | $ | 1,032 | $ | – | $ | – | ||||||||||
| Loans receivable, net | 16,595 | 16,595 | – | – | 16,595 | |||||||||||||||
| Other assets | 124 | 124 | – | 124 | ||||||||||||||||
| Accrued interest on loans | 294 | 294 | – | – | 294 | |||||||||||||||
| Financial Liabilities | ||||||||||||||||||||
| Customer interest escrow | 418 | 418 | – | – | 418 | |||||||||||||||
| Notes payable secured | 5,476 | 5,476 | – | – | 5,476 | |||||||||||||||
| Notes payable unsecured, net | 10,899 | 10,899 | – | – | 10,899 | |||||||||||||||
| Accounts payable and accrued expenses | 1,000 | 1,000 | – | – | 1,000 | |||||||||||||||
December 31, 2015
| Quoted Prices | ||||||||||||||||||||
| in Active | Significant | |||||||||||||||||||
| Markets for | Other | Significant | ||||||||||||||||||
| Identical | Observable | Unobservable | ||||||||||||||||||
| Carrying | Estimated | Assets | Inputs | Inputs | ||||||||||||||||
| Amount | Fair Value | Level 1 | Level 2 | Level 3 | ||||||||||||||||
| Financial Assets | ||||||||||||||||||||
| Cash and cash equivalents | $ | 1,341 | $ | 1,341 | $ | 1,341 | $ | – | $ | – | ||||||||||
| Loans receivable, net | 14,060 | 14,060 | – | – | 14,060 | |||||||||||||||
| Accrued interest on loans | 146 | 146 | – | – | 146 | |||||||||||||||
| Financial Liabilities | ||||||||||||||||||||
| Customer interest escrow | 498 | 498 | – | – | 498 | |||||||||||||||
| Notes payable secured | 3,683 | 3,683 | – | – | 3,683 | |||||||||||||||
| Notes payable unsecured, net | 8,497 | 8,497 | – | – | 8,497 | |||||||||||||||
| Accounts payable and accrued expenses | 539 | 539 | – | – | 539 | |||||||||||||||
| 16 |
4. Financing Receivables
Financing receivables are comprised of the following as of June 30, 2016 and December 31, 2015:
June 30, 2016 | December 31, 2015 | |||||||
| Commercial loans, gross | $ | 17,651 | $ | 15,247 | ||||
| Less: Deferred loan fees | (480 | ) | (628 | ) | ||||
| Less: Deposits | (562 | ) | (521 | ) | ||||
| Plus: Deferred origination expense | 30 | – | ||||||
| Less: Allowance for loan losses | (44 | ) | (38 | ) | ||||
| Commercial loans, net | $ | 16,595 | $ | 14,060 | ||||
Roll forward of commercial loans:
Six Months Ended | Year Ended | Six Months Ended | ||||||||||
| Beginning balance | $ | 14,060 | $ | 8,097 | $ | 8,097 | ||||||
| Additions | 10,692 | 13,760 | 4,015 | |||||||||
| Payoffs/Sales | (6,594 | ) | (6,436 | ) | (3,196 | ) | ||||||
| Moved to foreclosed assets | (1,639 | ) | (767 | ) | – | |||||||
| Change in deferred origination expense | 30 | – | – | |||||||||
| Change in builder deposit | (41 | ) | (387 | ) | (24 | ) | ||||||
| Change in loan loss provision | (6 | ) | (17 | ) | (23 | ) | ||||||
| New loan fees | (540 | ) | (897 | ) | (268 | ) | ||||||
| Earned loan fees | 633 | 707 | 294 | |||||||||
| Ending balance | $ | 16,595 | $ | 14,060 | $ | 8,895 | ||||||
Commercial Construction and Development Loans
Pennsylvania Loans
On December 30, 2011, pursuant to a credit agreement (as amended, the “Credit Agreement”) by and between us, Benjamin Marcus Homes, LLC (“BMH”), Investor’s Mark Acquisitions, LLC (“IMA”), and Mark L. Hoskins (“Hoskins”) (collectively, the “Hoskins Group”), we originated two new loan assets, one to BMH as borrower (the “BMH Loan”) and one to IMA as borrower (the “New IMA Loan”). Pursuant to the Credit Agreement and simultaneously with the origination of the BMH Loan and the New IMA Loan, we also assumed the position of lender on an existing loan to IMA (the “Existing IMA Loan”) and assumed the position of borrower on another existing loan in which IMA serves as the lender (the “SF Loan”). Throughout this report, we refer to the BMH Loan, the New IMA Loan, and the Existing IMA Loan collectively as the “Pennsylvania Loans.”
As a result of amendments to the Credit Agreement, we converted $1,000 of the SF Loan from debt to preferred equity. The new preferred equity serves as collateral for the Pennsylvania Loans. There is no liquid market for the preferred equity instrument, so we can give no assurance as to our ability to generate any amount of proceeds from that collateral. We also reduced the balance of the SF Loan by $125, which was added to the Interest Escrow, and repaid the remaining $375 with cash. The interest rate on the Existing IMA Loan was raised to match the New IMA Loan. Beginning in December 2015, the Hoskins Group invests in our preferred equity in an amount equal to $10 per closing of a lot payoff in the Hamlets or Tuscany subdivisions.
| 17 |
Also as a result of amendments to the Credit Agreement, we funded an additional $500 of interest escrow, we issued several letters of credit relating to BMH Loan which totaled $153 and $68 at June 30, 2016 and December 31, 2015, respectively (the “Letter of Credit”), and we issued cash bonds for development with $257 outstanding at both June 30, 2016 and December 31, 2015. We also allowed a fully funded mortgage in the amount of $1,146 to be placed in superior position to our mortgage, with the $1,146 proceeds being used to reduce the balance of BMH’s outstanding loan with us. The terms and conditions of the Pennsylvania Loans are set forth in further detail below.
BMH Loan
The BMH Loan is a revolving demand loan in the original principal amount of up to $4,164, of which $3,568 was funded at closing. We collected a fee of $750 upon closing of the BMH Loan, which was funded from proceeds of the loan. Additionally, $450 of the loan proceeds was allocated to an interest escrow account (the “Interest Escrow”). Interest on the BMH Loan accrues annually at 2% (7% starting August 1, 2016) plus the greater of (i) 5.0% or (ii) the weighted average price paid by us on or in connection with all of our borrowed funds (such weighted average price includes interest rates, loan fees, legal fees and any and all other costs paid by us on our borrowed funds, and, in the case of funds borrowed by us from our affiliates, the weighted average price paid by such affiliate on or in connection with such borrowed funds) (“COF”).
The BMH Loan is secured by a second priority mortgage in residential property consisting of one building lot and a parcel of land of approximately 34 acres which is currently partially under development, all located in the subdivision commonly known as the Hamlets of Springdale in Peters Township, Pennsylvania, a suburb of Pittsburgh, as well as the Interest Escrow. The seller of the property securing the BMH Loan retained a third mortgage in the amount of $400, with a balance of approximately $139 and $157 as of June 30, 2016 and December 31, 2015, respectively. The property securing the BMH Loan is subject to a mortgage in the amount of $1,146, which is held by United Bank and guaranteed by the seller, an independent third-party. The superior mortgage balance is subtracted from the appraised value of the land in the land valuation detail of the Pennsylvania loan financing receivables at June 30, 2016 and December 31, 2015 in the tables detailing the Pennsylvania Loans below.
New IMA Loan
The New IMA Loan is a demand loan in the original principal amount of up to $2,225, of which $250 was funded at closing. We collected a fee of $250 upon closing of the New IMA Loan, which was funded from proceeds of the loan. Interest on the New IMA Loan accrues annually at 2.0% (7% starting August 1, 2016) plus the greater of (i) 5.0% or (ii) the weighted average price paid by us on or in connection with all of our borrowed funds (such weighted average price includes interest rates, loan fees, legal fees and any and all other costs paid by us on our borrowed funds, and, in the case of funds borrowed by us from our affiliates, the weighted average price paid by such affiliate on or in connection with such borrowed funds).
The New IMA Loan is secured by a mortgage in residential property originally consisting of 18 lots (6 and 8 lots remained as of June 30, 2016 and December 31, 2015, respectively) located in the subdivision commonly known as the Tuscany Subdivision in Peters Township, Pennsylvania, a suburb of Pittsburgh. Construction of the improvements for the Tuscany Subdivision began in December 2012, with $92 remaining to be completed as of June 30, 2016.
Existing IMA Loan
The Existing IMA Loan is a demand loan in the original principal amount of $1,687, of which $1,687 was outstanding as of both June 30, 2016 and December 31, 2015. Interest on the Existing IMA Loan accrued annually at a rate of 7.0% through December 30, 2014. Beginning December 31, 2014, the interest rate was the same as the New IMA Loan. Pursuant to the Credit Agreement, interest payments on the Existing IMA Loan are funded from the Interest Escrow, with any shortfall funded by IMA.
The Existing IMA Loan is secured by a mortgage in the residential property that also secures the New IMA Loan.
| 18 |
SF Loan
Concurrent with the execution of the loans above, we entered into the SF Loan with the Hoskins Group, under which we were the borrower. The SF Loan is described in Note 6.
Interest Escrow
The Pennsylvania Loans called for a funded Interest Escrow account which was funded with proceeds from the Pennsylvania Loans. The initial funding on that Interest Escrow was $450. The balance as of June 30, 2016 and December 31, 2015 was $112 and $267, respectively. To the extent the balance is available in the Interest Escrow, interest due on certain loans is deducted from the Interest Escrow on the date due. The Interest Escrow is increased by 10% of lot payoffs on the same loans, and by interest and/or distributions on the SF Loan and Hoskins Group preferred equity. All of these transactions are noncash to the extent that the total escrow amount does not need additional funding. The Interest Escrow is also used to contribute to the reduction of the $400 subordinated mortgage upon certain lot sales of the collateral of the BMH Loan.
Construction loans
The Pennsylvania Loans have been modified from time to time to allow for funding of construction of homes. Those loans are detailed in the tables below.
A detail of the financing receivables for the Pennsylvania loans at June 30, 2016 is as follows:
| Item | Term | Interest Rate | Funded
to borrower | Estimated collateral values | ||||||||||
| BMH Loan | Demand | (1) | COF
+2% (7% Floor) | |||||||||||
| Land for phase 5 (10 acres) | $ | – | $ | 1,079 | ||||||||||
| Lots | 1,094 | 2,628 | (7) | |||||||||||
| Interest Escrow | 950 | 112 | ||||||||||||
| Cash Bond | 257 | (5) | 257 | |||||||||||
| Loan Fee | 750 | – | ||||||||||||
| Total BMH Loan | 3,051 | 4,076 | ||||||||||||
| IMA Loans | ||||||||||||||
| New IMA Loan (loan fee) | Demand | (1) | COF
+2% (7% Floor) | 250 | – | |||||||||
| New IMA Loan (advances) | Demand | (1) | COF
+2% (7% Floor) | 577 | – | |||||||||
| Existing IMA Loan | Demand | (2) | COF
+2% (7% Floor) | 1,687 | 2,277 | (3) | ||||||||
| Total IMA Loans | 2,514 | 2,277 | ||||||||||||
| Unearned Loan Fee | (16 | ) | – | |||||||||||
| SF Preferred Equity | – | 1,060 | (8) | |||||||||||
| Total | $ | 5,549 | $ | 7,413 | ||||||||||
| 19 |
A detail of the financing receivables for the Pennsylvania loans at December 31, 2015 is as follows:
| Item | Term | Interest Rate | Funded to borrower | Estimated collateral values | ||||||||||
| BMH Loan | Demand | (1) | COF +2% (7% Floor) | |||||||||||
| Land for phase 5 (10 acres) | $ | – | $ | 1,079 | ||||||||||
| Lots | 974 | 2,338 | (4) | |||||||||||
| Interest Escrow | 950 | 267 | ||||||||||||
| Cash Bond | 257 | (5) | 257 | |||||||||||
| Loan Fee | 750 | – | ||||||||||||
| Total BMH Loan | 2,931 | 3,941 | ||||||||||||
| IMA Loans | ||||||||||||||
| New IMA Loan (loan fee) | Demand | (1) | COF +2% (7% Floor) | 250 | – | |||||||||
| New IMA Loan (advances) | Demand | (1) | COF +2% (7% Floor) | 1,251 | – | |||||||||
| Existing IMA Loan | Demand | (2) | COF +2% (7% Floor) | 1,687 | 2,951 | (6) | ||||||||
| Total IMA Loans | 3,188 | 2,951 | ||||||||||||
| Unearned Loan Fee | (115 | ) | – | |||||||||||
| SF Preferred Equity | – | 1,010 | (8) | |||||||||||
| Total | $ | 6,004 | $ | 7,902 | ||||||||||
(1) These are the stated terms; however, in practice, principal will be repaid upon the sale of each developed lot.
(2) These are the stated terms; however, in practice, principal will be repaid upon the sale of each developed lot after the BMH loan and the New IMA loan are satisfied.
(3) Estimated collateral value is equal to the appraised value of the remaining lots of $2,369, net of the net estimated costs to finish the development of $92.
(4) Estimated collateral value is equal to the appraised value of the remaining lots of $3,600, net of the net estimated costs to finish the development of $531 and the first mortgage amount of $731.
(5) The cash bond is in place to guarantee to the township that work will be completed on this project. We will fund this work and expect to cancel the bond upon completion of the work.
(6) Estimated collateral value is equal to the appraised value of $3,101, net of estimated costs to finish the development of $150.
(7) Estimated collateral value is equal to the lots’ appraised value of $3,156 minus remaining improvements of $435, net of the outstanding first mortgage of $93.
(8) In the event of a foreclosure on the property securing certain of our loans, a portion of our collateral is preferred equity in our Company, which might be difficult to sell, which could impact our ability to eliminate the loan balance. The loans are collectively cross-collateralized and, therefore, treated as one loan for the purpose of calculating the effective interest rate and for available remedies upon an instance of default. As lots are released, a specific release price is repaid by the borrower, with 10% of that amount being used to fund the Interest Escrow (except for the construction funding for homes). The customer will make cash interest payments only when the Interest Escrow is fully depleted, except for construction funding for homes, where the customer makes interest payments monthly.
| 20 |
The Pennsylvania Loans created in 2011 had a $1,000 loan fee. The expenses incurred related to issuing the loan were approximately $76, which were netted against the loan amount. The remaining $924, which is netted against the gross loan amount, is being recognized over the expected life of the loans using the straight-line method in accordance with ASC 310-20, Nonrefundable Fees and Other Costs.
The Company has a credit agreement with its largest borrower which includes a maximum exposure on all three loans, as described in the chart below. This limit does not include construction loans.
Commercial Loans – Real Estate Development Loan Portfolio Summary
The following is a summary of our loan portfolio to builders for land development as of June 30, 2016. The Pennsylvania loans below are included as part of the Pennsylvania Loans discussed above.
| State | Number of Borrowers | Number of Loans | Value
of Collateral(1) | Commitment Amount | Amount Outstanding | Loan
to Value Ratio(2) | Loan Fee | |||||||||||||||||||||
| Pennsylvania | 1 | 3 | $ | 7,413 | $ | 6,541 | (3) | $ | 5,565 | 75 | % | $ | 1,000 | |||||||||||||||
| Total | 1 | 3 | $ | 7,413 | $ | 6,541 | $ | 5,565 | 75 | % | $ | 1,000 | ||||||||||||||||
| (1) | The value is determined by the appraised value adjusted for remaining costs to be paid and third party mortgage balances. Part of this collateral is $1,060 of preferred equity in our Company. In the event of a foreclosure on the property securing certain of our loans, a portion of our collateral is preferred equity in our Company, which might be difficult to sell, which could impact our ability to eliminate the loan balance. |
| (2) | The loan to value ratio is calculated by taking the outstanding amount and dividing by the appraised value. |
| (3) | The commitment amount includes letters of credit and cash bonds. |
The following is a summary of our loan portfolio to builders for land development as of December 31, 2015. The Pennsylvania loans below are included as part of the Pennsylvania Loans discussed above.
| State | Number of Borrowers | Number of Loans | Value
of Collateral(1) | Commitment Amount | Amount Outstanding | Loan
to Value Ratio(2) | Loan Fee | |||||||||||||||||||||
| Pennsylvania | 1 | 3 | $ | 7,902 | $ | 6,456 | (3) | $ | 6,119 | 77 | % | $ | 1,000 | |||||||||||||||
| Total | 1 | 3 | $ | 7,902 | $ | 6,456 | $ | 6,119 | 77 | % | $ | 1,000 | ||||||||||||||||
| (1) | The value is determined by the appraised value adjusted for remaining costs to be paid and third party mortgage balances. Part of this collateral is $1,010 of preferred equity in our Company. In the event of a foreclosure on the property securing certain of our loans, a portion of our collateral is preferred equity in our Company, which might be difficult to sell, which could impact our ability to eliminate the loan balance. |
| (2) | The loan to value ratio is calculated by taking the outstanding amount and dividing by the appraised value. |
| (3) | The commitment amount includes letters of credit and cash bonds. |
| 21 |
Commercial Loans – Construction Loan Portfolio Summary
The following is a summary of our loan portfolio to builders for home construction loans as of June 30, 2016.
| State | Number of Borrowers | Number of Loans | Value
of Collateral (1) | Commitment Amount | Amount Outstanding | Loan
to Value Ratio(2) | Loan Fee | |||||||||||||||||||||
| Colorado | 1 | 3 | $ | 1,545 | $ | 1,081 | $ | 619 | 70 | % | 5 | % | ||||||||||||||||
| Connecticut | 1 | 1 | 715 | 500 | 348 | 70 | % | 5 | % | |||||||||||||||||||
| Delaware | 1 | 2 | 1,074 | 671 | 516 | 62 | % | 5 | % | |||||||||||||||||||
| Florida | 4 | 8 | 9,464 | 5,715 | 4,222 | 60 | % | 5 | % | |||||||||||||||||||
| Georgia | 3 | 5 | 4,390 | 2,610 | 1,145 | 59 | % | 5 | % | |||||||||||||||||||
| Idaho | 1 | 1 | 319 | 215 | 95 | 67 | % | 5 | % | |||||||||||||||||||
| New Jersey | 2 | 2 | 677 | 456 | 165 | 67 | % | 5 | % | |||||||||||||||||||
| New York | 1 | 4 | 1,445 | 617 | 565 | 43 | % | 5 | % | |||||||||||||||||||
| North Carolina | 1 | 1 | 242 | 169 | 14 | 70 | % | 5 | % | |||||||||||||||||||
| Pennsylvania | 2 | 6 | 6,927 | 4,112 | 3,632 | 59 | % | 5 | % | |||||||||||||||||||
| South Carolina | 3 | 7 | 1,858 | 1,301 | 214 | 70 | % | 5 | % | |||||||||||||||||||
| Tennessee | 1 | 3 | 1,080 | 767 | 375 | 71 | % | 5 | % | |||||||||||||||||||
| Utah | 1 | 2 | 730 | 511 | 176 | 70 | % | 5 | % | |||||||||||||||||||
| Total | 22 | 45 | $ | 30,466 | $ | 18,725 | $ | 12,086 | 61 | %(3) | 5 | % | ||||||||||||||||
| (1) | The value is determined by the appraised value. |
| (2) | The loan to value ratio is calculated by taking the commitment amount and dividing by the appraised value. |
| (3) | Represents the weighted average loan to value ratio of the loans. |
The following is a summary of our loan portfolio to builders for home construction loans as of December 31, 2015.
| State | Number of Borrowers | Number of Loans | Value
of Collateral (1) | Commitment Amount | Amount Outstanding | Loan
to Value Ratio(2) | Loan Fee | |||||||||||||||||||||
| Colorado | 1 | 4 | $ | 2,160 | $ | 1,519 | $ | 830 | 70 | % | 5 | % | ||||||||||||||||
| Connecticut | 1 | 1 | 715 | 500 | 251 | 70 | % | 5 | % | |||||||||||||||||||
| Delaware | 1 | 2 | 1,074 | 671 | 105 | 63 | % | 5 | % | |||||||||||||||||||
| Florida | 3 | 10 | 10,683 | 6,440 | 4,378 | 60 | % | 5 | % | |||||||||||||||||||
| Georgia | 2 | 3 | 3,916 | 2,278 | 712 | 58 | % | 5 | % | |||||||||||||||||||
| New Jersey | 1 | 2 | 510 | 357 | 268 | 70 | % | 5 | % | |||||||||||||||||||
| North Carolina | 1 | 2 | 385 | 270 | 172 | 70 | % | 5 | % | |||||||||||||||||||
| Pennsylvania | 2 | 6 | 4,107 | 2,391 | 1,275 | 58 | % | 5 | % | |||||||||||||||||||
| South Carolina | 2 | 16 | 2,395 | 1,699 | 1,136 | 71 | % | 5 | % | |||||||||||||||||||
| Total | 14 | 46 | $ | 25,945 | $ | 16,125 | $ | 9,127 | 62 | %(3) | 5 | % | ||||||||||||||||
| (1) | The value is determined by the appraised value. |
| (2) | The loan to value ratio is calculated by taking the commitment amount and dividing by the appraised value. |
| (3) | Represents the weighted average loan to value ratio of the loans. |
| 22 |
Credit Quality Information
The following table presents credit-related information at the “class” level in accordance with ASC 310-10-50, Disclosures about the Credit Quality of Finance Receivables and the Allowance for Credit Losses. A class is generally a disaggregation of a portfolio segment. In determining the classes, the Company considered the finance receivable characteristics and methods it applies in monitoring and assessing credit risk and performance.
The following table summarizes finance receivables by the risk ratings that regulatory agencies utilize to classify credit exposure and which are consistent with indicators the Company monitors. Risk ratings are reviewed on a regular basis and are adjusted as necessary for updated information affecting the borrowers’ ability to fulfill their obligations.
The definitions of these ratings are as follows:
| ● | Pass – finance receivables in this category do not meet the criteria for classification in one of the categories below. | |
| ● | Special mention – a special mention asset exhibits potential weaknesses that deserve management’s close attention. If left uncorrected, these potential weaknesses may, at some future date, result in the deterioration of the repayment prospects. | |
| ● | Classified – a classified asset ranges from: 1) assets that are inadequately protected by the current sound worth and paying capacity of the borrower, and are characterized by the distinct possibility that some loss will be sustained if the deficiencies are not corrected to 2) assets with weaknesses that make collection or liquidation in full unlikely on the basis of current facts, conditions, and values. Assets in this classification can be accruing or on non-accrual depending on the evaluation of these factors. |
Finance Receivables – By risk rating:
June 30, 2016 | December 31, 2015 | |||||||
| Pass | $ | 14,258 | $ | 14,060 | ||||
| Special mention | 2,337 | – | ||||||
| Classified – accruing | – | – | ||||||
| Classified – nonaccrual | – | – | ||||||
| Total | $ | 16,595 | $ | 14,060 | ||||
Finance Receivables – Method of impairment calculation:
June 30, 2016 | December 31, 2015 | |||||||
| Performing loans evaluated individually | $ | 11,199 | $ | 9,971 | ||||
| Performing loans evaluated collectively | 5,396 | 4,089 | ||||||
| Non-performing loans without a specific reserve | $ | – | $ | – | ||||
| Non-performing loans with a specific reserve | – | – | ||||||
| Total evaluated collectively for loan losses | $ | 16,595 | $ | 14,060 | ||||
At June 30, 2016 and December 31, 2015, there were no loans acquired with deteriorated credit quality, past due loans, impaired loans, or loans on nonaccrual status.
| 23 |
5. Foreclosed Assets
Roll forward of Foreclosed Assets:
Six Months Ended | Year Ended | Six Months Ended | ||||||||||
| Beginning balance | $ | 965 | $ | – | $ | – | ||||||
| Additions from loans | 1,813 | 885 | – | |||||||||
| Additions for construction/development | 375 | 85 | – | |||||||||
| Ending balance | $ | 3,153 | $ | 965 | $ | – | ||||||
We foreclosed on five properties during 2015, of which four were acquired at the foreclosure sale and one was acquired via a deed in lieu of foreclosure. Three of the properties were lots in Georgia. We have an agreement with a builder to build a house on one of the lots (which is nearing completion as of June 30, 2016) and will likely start construction on a second home once the first has a sales agreement. Two of the properties are partially completed homes in Louisiana, and work is proceeding to complete those homes. We acquired one property via a deed in lieu of foreclosure during 2016. This property is a beach lot in Sarasota, Florida. We have executed the seller’s part of an option to purchase the property which expires in December 2016. If that sale is executed, we will record a small gain on the sale.
6. Borrowings
The following table displays our borrowings:
June 30, 2016 | December 31, 2015 | |||||||
| Borrowing Source | ||||||||
| Purchase and sale agreements | $ | 5,476 | $ | 3,683 | ||||
| Secured line of credit from affiliates | – | – | ||||||
| Unsecured Notes through our Notes offer, net of deferred costs | 10,199 | 7,897 | ||||||
| Other unsecured debt | 700 | 600 | ||||||
| Total | $ | 16,375 | $ | 12,180 | ||||
Purchase and Sale Agreements
In December 2014, the Company entered into a purchase and sale agreement with 1st Financial Bank USA whereby the purchaser may buy loans offered to it by us, and we may be obligated to offer certain loans to purchaser. Purchaser is buying senior positions in the loans they purchase, originally 50%, 60% on new loans as of January 2016, of each loan. Purchaser generally receives the interest rate we charge the borrower (with a floor of 10%) on their portion of the loan balance, and we receive the rest of the interest and all of the loan fee. We service the loans. There is an unlimited right for us to call any loan sold, however in any case of such call, a minimum of 4% of the commitment amount of purchaser must have been received by purchaser in interest, or we must make up the difference. Also, the purchaser has a put option, which is limited to 10% of the funding provided by purchaser under all loans purchased in the trailing 12 months.
| 24 |
In April 2015, the Company entered into a purchase and sale agreement with Seven Kings Holdings, Inc. (“7Kings”) as purchaser and the Company as seller, whereby 7Kings buys loans offered to it by us, providing that their portions of the loans always total less than $1,500. On or about May 7, 2015, 7Kings assigned its right and interest in the purchase and sale agreement to S.K. Funding, LLC (“S.K. Funding”), an affiliate of 7Kings. S.K. Funding may adjust the $1,500 with notice, but such change will not cause a buyback by us. S.K. Funding is buying pari-passu positions in the loans they purchase, generally 50% of each loan. S.K. Funding generally receives a 9% interest rate on its portion of the loan balance, and we receive the rest of the interest and all of the loan fees. We service the loans. There is an unlimited right for us to call any loan sold. This transaction is accounted for as a secured line of credit. In the fourth quarter of 2015, we entered into a modification of our agreement with S.K. Funding whereby S.K. Funding agreed to buy priority interests of $1,000 each in two large loans we originated. In the first quarter of 2016, after one of the $1,000 loans repaid, we entered into an additional modification whereby S.K. Funding agreed to buy priority interests totaling $2,000 in a total of three large loans we originated. The interest rate for the loans covered by these modifications is 9.5% to S.K. Funding. On June 30, 2016, one of those two loans was terminated with a deed in lieu of foreclosure. The property is owned by us, and we owe S.K. Funding $1,000 on that property (secured by mortgage) to be repaid upon the sale of the property. This amount is still covered by our purchase and sale agreement and is included in the totals in the chart below. On December 31, 2015, S.K. Funding purchased 4% of our common equity from the Wallach family.
The purchase and sale agreements are recorded as secured borrowings.
The purchase and sale agreements are detailed below:
| June 30, 2016 | December 31, 2015 | |||||||||||||||
| Book Value of | Due From | Book Value of | Due From | |||||||||||||
| Loans which | Shepherd’s | Loans which | Shepherd’s | |||||||||||||
| Served as | Finance to Loan | Served as | Finance to Loan | |||||||||||||
| Collateral | Purchaser | Collateral | Purchaser | |||||||||||||
| Loan purchaser | ||||||||||||||||
| 1st Financial Bank, USA | $ | 3,366 | $ | 1,667 | $ | 2,723 | $ | 1,061 | ||||||||
| S.K. Funding, LLC | 6,281 | 3,809 | 4,522 | 2,622 | ||||||||||||
| Total | $ | 9,647 | $ | 5,476 | $ | 7,245 | $ | 3,683 | ||||||||
The $6,281 of loans which served as collateral for Seven Kings Holdings, Inc. does not include the book value of the foreclosed assets which also secure their position, which amount is $1,813.
Affiliate Loans
In December 2011, the Company entered into two secured revolving lines of credit with affiliates, both of whom are members. These loans have an interest rate of the affiliates’ cost of funds, which was 4.17% and 4.20% as of June 30, 2016 and December 31, 2015, respectively. They are demand notes. The maximum that can be borrowed under these notes is $1,500, at the discretion of the lenders. The actual amount borrowed was $0 at both June 30, 2016 and December 31, 2015, leaving $1,500 in potential credit availability on those dates. There is no obligation of the affiliates to lend money up to the note amount. The security for the lines of credit includes all of the assets of the Company. The Company has not borrowed on these lines in either 2015 or 2016.
S.K. Funding owns 4% of our common equity. S.K. Funding is also a buyer in a purchase and sale agreement where we are the seller. 7Kings is an investor in our notes program for $500 and has a $500 unsecured note due from us.
Other Unsecured Loans
In August 2015, we entered into an unsecured note with 7Kings, under which we are the borrower. The note has a maximum amount outstanding of $500, of which $500 was outstanding as of June 30, 2016 and December 31, 2015. Interest on the 7Kings loan accrues annually at a rate of 7.5%. The note was due on February 19, 2016, was renewed through August 18, 2016, and may be prepaid at any time without penalty. Interest is due at the end of each month and was $14 in 2015 and $19 in the first six months of 2016. On December 31, 2015, S.K. Funding, an affiliate of 7Kings, purchased 4% of our common equity from the Wallach family.
In December 2015, we entered into an unsecured note with an unrelated third party, under which we are the borrower. The note has a maximum amount outstanding of $100, of which $100 was outstanding on both June 30, 2016 and December 31, 2015. Interest on this note accrues annually at a rate of 7.9%. The note is due on June 23, 2017 and may be prepaid at any time without penalty. Interest accrues and compounds monthly. In April 2016, we entered into an unsecured note with the same unrelated third party, under which we are the borrower. The note has a maximum amount outstanding of $100, of which $100 was outstanding on June 30, 2016. Interest on this note accrues annually at a rate of 10%. The note is due on April 15, 2020 and may be prepaid at any time without penalty. Interest accrues and compounds monthly.
| 25 |
SF Loan
The SF Loan, under which we were the borrower, was an unsecured loan in the original principal amount of $1,500. Interest on the SF Loan accrued annually at a rate of 5.0%. On December 31, 2014, the Company and the Hoskins Group entered into a series of agreements which, among other things, 1) converted $1,000 of the SF Loan from debt to preferred equity, 2) repaid $125 of the SF Loan and applied those proceeds to increase the Interest Escrow, and 3) required elimination of the remaining balance of the SF Loan with a cash payment upon the repayment of the construction loan on lot 5, Tuscany. This payment was made in the first quarter of 2015.
Notes Program
Borrowings through our public offerings were $10,692 and $8,496 at June 30, 2016 and December 31, 2015, respectively. The effective interest rate on the borrowings at June 30, 2016 and December 31, 2015 was 7.63% and 7.30%, respectively, not including the amortization of deferred financing costs. There are limited rights of early redemption. We generally offer four durations at any given time, ranging anywhere from 12 to 48 months. The following table shows the roll forward of our Notes program:
| Six Months Ended June 30, 2016 | Year Ended December 31, 2015 | Six Months Ended June 30, 2015 | ||||||||||
| Notes outstanding, beginning of period | $ | 8,496 | $ | 5,427 | $ | 5,427 | ||||||
| Notes issued | 2,255 | 3,737 | 1,804 | |||||||||
| Note repayments / redemptions | (59 | ) | (668 | ) | (540 | ) | ||||||
| Notes outstanding, end of period | $ | 10,692 | $ | 8,496 | $ | 6,691 | ||||||
| Less deferred financing costs, net | 493 | 599 | 622 | |||||||||
| Notes outstanding, net | 10,199 | 7,897 | 6,069 | |||||||||
The following table shows the maturity of outstanding debt as of June 30, 2016.
| Year Maturing | Total Amount Maturing | Public Offering | Other Unsecured | Purchase and Sale Agreements | ||||||||||||
| 2016 | $ | 8,164 | $ | 2,188 | $ | 500 | $ | 5,476 | ||||||||
| 2017 | 2,853 | 2,753 | 100 | – | ||||||||||||
| 2018 | 2,176 | 2,176 | – | – | ||||||||||||
| 2019 | 1,580 | 1,580 | ||||||||||||||
| 2020 | 2,095 | 1,995 | 100 | – | ||||||||||||
| Total | $ | 16,868 | $ | 10,692 | $ | 700 | $ | 5,476 | ||||||||
Purchase and sale agreements are treated as secured lines of credit, where the collateral is demand loans, and therefore they are considered short term liabilities.
| 26 |
7. Members’ Capital
There are currently two classes of units (class A common units and series B cumulative preferred units).
The Class A common units are held by three members, all of whom have no personal liability. All Class A common members have voting rights in proportion to their capital account. There were 2,629 Class A common units outstanding at both June 30, 2016 and December 31, 2015. On December 31, 2015, an affiliate of 7Kings, S.K. Funding, purchased 4% of our common equity from the Wallach family.
The series B cumulative preferred units were issued to the Hoskins Group through a reduction in the SF Loan. They are redeemable only at the option of the Company or upon a change or control or liquidation. Ten units were issued for a total of $1,000. The series B units have a fixed value which is their purchase price, and preferred liquidation and distribution rights. Yearly distributions of 10% of the units’ value (providing profits are available) will be made quarterly. The Hoskins Group series B cumulative preferred units are also used as collateral for that group’s loans to the Company. There is no liquid market for the preferred equity instrument, so we can give no assurance as to our ability to generate any amount of proceeds from that collateral. In December of 2015, the Hoskins Group agreed to purchase 0.1 unit for $10 at each closing of a lot to a third party in the Hamlets and Tuscany subdivision.
There are two additional authorized unit classes: class A preferred units and class B profit units. Once class B profit units are issued, the existing class A common units will become class A preferred units. Class A preferred units will receive preferred treatment in terms of distributions and liquidation proceeds.
The members’ capital balances by class are as follows:
| Class | June 30, 2016 | December 31, 2015 | ||||||
| B Preferred Units | $ | 1,060 | $ | 1,010 | ||||
| A Common Units | 2,319 | 2,274 | ||||||
| Members’ Capital | $ | 3,379 | $ | 3,284 | ||||
8. Related Party Transactions
Notes and Accounts Payable to Affiliates
The Company has a loan agreement with two of our affiliates, as more fully described in Note 6 – Affiliate Loans.
The Company had loan agreements with the Hoskins Group, as more fully described in Note 6 – SF Loan and Note 4 – Pennsylvania Loans.
The Hoskins Group has a preferred equity interest in the Company, as more fully described in Note 7.
S.K. Funding, an affiliate of 7Kings, owns 4% of our common equity. S.K. Funding is also a buyer in a purchase and sale agreement where we are the seller. 7Kings is an investor in our notes program for $500 and has a $500 unsecured note due from us.
| 27 |
The Company has accepted new investments under the Notes program from employees, managers, members and relatives of managers and members, with $2,810 outstanding at June 30, 2016. The larger of these investments are detailed below:
| Relationship to | Weighted average interest | Interest earned during the six months ended | ||||||||||||||||||||
| Shepherd’s | Amount invested as of | rate as of | June 30, | |||||||||||||||||||
| Investor | Finance | June 30, 2016 | December 31, 2015 | June 30, 2016 | 2016 | 2015 | ||||||||||||||||
| Bill Myrick | Independent Manager | $ | 281 | $ | 268 | 7.73 | % | $ | 11 | $ | 6 | |||||||||||
| R. Scott Summers | Son of Independent Manager | 475 | 475 | 7.26 | % | 12 | 4 | |||||||||||||||
| Wallach Family Irrevocable Educational Trust | Trustee is Member | 200 | 200 | 7.00 | % | 8 | 7 | |||||||||||||||
| David and Carole Wallach | Parents of Member | 111 | 111 | 8.00 | % | 5 | 4 | |||||||||||||||
| Eric Rauscher | Independent Manager | 600 | 600 | 7.13 | % | 22 | 18 | |||||||||||||||
| Joseph Rauscher | Parents of Independent Manager | 186 | 186 | 8.00 | % | 8 | 8 | |||||||||||||||
| Schultz Family Revocable Living Trust | Parents of Member | 111 | 96 | 8.21 | 5 | 3 | ||||||||||||||||
| Seven Kings Holdings, Inc. | Member | 500 | 500 | 7.00 | % | 17 | 17 | |||||||||||||||
9. Commitments and Contingencies
In the normal course of business there may be outstanding commitments to extend credit that are not included in the consolidated financial statements. Commitments to extend credit are agreements to lend to a customer as long as there is no violation of any condition established in the contract. Commitments generally have fixed expiration dates or other termination clauses and may require payment of a fee. Since many of the commitments are expected to expire without being drawn upon and some of the funding may come from the earlier repayment of the same loan (in the case of revolving lines), the total commitment amounts do not necessarily represent future cash requirements. The financial instruments involve, to varying degrees, elements of credit and interest rate risk in excess of amounts recognized in the consolidated financial statements. The Company evaluates each customer’s creditworthiness on a case-by-case basis. Unfunded commitments to extend credit, which have similar collateral, credit risk and market risk to our outstanding loans, were $7,615 and $7,332 at June 30, 2016 and December 31, 2015, respectively.
The Company has several Letters of Credit relating to the BMH Loan. Refer to the chart in Note 4 – Commercial Loans – Real Estate Development Loan Portfolio Summary for further details describing this commitment.
| 28 |
The property securing the BMH Loan is subject to a mortgage in the amount of $1,146, which is held by United Bank and guaranteed by 84 FINANCIAL, L.P. The subordinated mortgage balance of $93 and $731 is subtracted from the appraised value of the land in the land valuation detail of the Pennsylvania financing receivables in Note 4 at June 30, 2016 and December 31, 2015, respectively.
10. Selected Quarterly Condensed Consolidated Financial Data (Unaudited)
Summarized unaudited quarterly condensed consolidated financial data for the four quarters of 2016 and 2015 are as follows (in thousands):
| Quarter 4 | Quarter 3 | Quarter 2 | Quarter 1 | Quarter 4 | Quarter 3 | Quarter 2 | Quarter 1 | |||||||||||||||||||||||||
| 2016 | 2016 | 2016 | 2016 | 2015 | 2015 | 2015 | 2015 | |||||||||||||||||||||||||
| Net Interest Income | $ | – | $ | – | $ | 464 | $ | 479 | $ | 326 | $ | 210 | $ | 212 | $ | 192 | ||||||||||||||||
| Non-Interest Income | – | – | 44 | – | 105 | – | – | – | ||||||||||||||||||||||||
| SG&A expense | – | – | 305 | 350 | 163 | 115 | 119 | 150 | ||||||||||||||||||||||||
| Net Income | $ | – | $ | – | $ | 203 | $ | 129 | $ | 268 | $ | 95 | $ | 93 | $ | 42 | ||||||||||||||||
11. Non-Interest expense detail
The following table displays our SG&A expenses:
| For the Six Months Ended June 30, | ||||||||
| 2016 | 2015 | |||||||
| Selling, general and administrative expenses | ||||||||
| Legal and Accounting | $ | 112 | $ | 88 | ||||
| Salaries and related expenses | 385 | 82 | ||||||
| Board related expenses | 55 | 48 | ||||||
| Advertising | 25 | 10 | ||||||
| Rent and Utilities | 10 | 9 | ||||||
| Printing | 7 | 10 | ||||||
| Loan and foreclosed asset expenses | 17 | 1 | ||||||
| Travel | 19 | 8 | ||||||
| Other | 25 | 13 | ||||||
| Total SG&A | $ | 655 | $ | 269 | ||||
12. Subsequent Events
Management of the Company has evaluated subsequent events through July 28, 2016, the date these interim condensed consolidated financial statements were issued.
On July 20, 2016, we entered into the Eleventh Amendment (the “Eleventh Amendment”) to the Credit Agreement with BMH and IMA.
| 29 |
Pursuant to the Eleventh Amendment, effective July 1, 2016, upon BMH paying us a “release price” upon the sale of a lot in the Hamlets subdivision or upon BMH obtaining construction financing on a lot in the Hamlets subdivision, we will apply 80% of such release price to payment of BMH’s principal balance on its indebtedness us and the remaining 20% will be applied to the interest escrow with us. Prior to the Eleventh Amendment, we would apply 90% of such release price to payment of BMH’s principal balance on its indebtedness to us and the remaining 10% would be applied to the interest escrow with us. Additionally, pursuant to the Eleventh Amendment and also effective July 1, 2016, upon IMA paying us a “release price” upon the sale of a lot in the Tuscany subdivision or upon IMA obtaining construction financing on a lot in the Tuscany subdivision, we will apply 80% of such release price to payment of IMA’s principal balance on its indebtedness to us and the remaining 20% will be applied to the interest escrow with us. Prior to the Eleventh Amendment, we would apply 90% of such release price to payment of IMA’s principal balance on its indebtedness to us and the remaining 10% would be applied to the interest escrow with us.
The Eleventh Amendment also requires that, effective July 1, 2016, $250,000 be added to the principal balance of the New IMA Note (as defined in the Credit Agreement) and the interest escrow.
ITEM 2. MANAGEMENT’S DISCUSSION AND ANALYSIS OF FINANCIAL CONDITION AND RESULTS OF OPERATIONS
(All dollar [$] amounts shown in thousands.)
The following Management’s Discussion and Analysis of Financial Condition and Results of Operations should be read in conjunction with our interim condensed consolidated financial statements and the notes thereto contained elsewhere in this report. The following Management’s Discussion and Analysis of Financial Condition and Results of Operations should also be read in conjunction with our audited annual consolidated financial statements and related notes and other consolidated financial data included in the Company’s Annual Report on Form 10-K as of and for the year ended December 31, 2015. See also “Cautionary Note Regarding Forward-Looking Statements” preceding Part I.
Overview
We were organized in the Commonwealth of Pennsylvania in 2007 under the name 84 RE Partners, LLC and changed our name to Shepherd’s Finance, LLC on December 2, 2011. We converted to a Delaware limited liability company on March 29, 2012. Our business is focused on commercial lending to participants in the residential construction and development industry. We believe this market is underserved because of the lack of traditional lenders currently participating in the market. We are located in Jacksonville, Florida. Our operations are governed pursuant to our operating agreement.
From 2007 through the majority of 2011, we were the lessor in three commercial real estate leases with a then affiliate, 84 Lumber Company. Beginning in late 2011, we began commercial lending to residential homebuilders. Our current loan portfolio is described more fully in this section under the sub heading “Commercial Construction and Development Loans.” We have a limited operating history as a finance company. We currently have four paid employees, including our Executive Vice President of Operations. We currently use our CEO to originate most of our new loans, and augment that with several people to whom we pay consulting fees. Our Board of Managers is comprised of Mr. Wallach and three independent Managers – Bill Myrick, Eric Rauscher, and Kenneth R. Summers. Our officers are responsible for our day-to-day operations, while the Board of Managers is responsible for overseeing our business.
The commercial loans we extend are secured by mortgages on the underlying real estate. We extend and service commercial loans to small-to-medium sized homebuilders for the purchase of lots and/or the construction of homes thereon. In a few limited circumstances, we lend money to homebuilders for the purchase of existing homes to be rehabbed. We also extend and service loans for the purchase of undeveloped land and the development of that land into residential building lots. In addition, we may, depending on our cash position and the opportunities available to us, do none, any or all of the following: purchase defaulted unsecured debt from suppliers to homebuilders at a discount (and then secure that debt with real estate or other collateral), purchase defaulted secured debt from financial institutions at a discount, and purchase real estate in which we will operate our business.
Our Chief Executive Officer, Daniel M. Wallach, has been in the housing industry since 1985. He was the CFO of a multi-billion dollar supplier of building materials to home builders for 11 years. He also was responsible for that company’s lending business for 20 years. During those years, he was responsible for the creation and implementation of many secured lending programs to builders. Some of these were performed fully by that company, and some were performed in partnership with banks. In general, the creation of all loans, and the resolution of defaulted loans, was his responsibility, whether the loans were company loans or loans in partnership with banks. Through these programs, he was responsible for the creation of approximately $2,000,000 in loans which generated interest spread of $50,000, after deducting for loan losses. Through the years, he managed the development of systems for reducing and managing the risks and losses on defaulted loans. Mr. Wallach also was responsible for that company’s unsecured debt to builders, which reached over $300,000 at its peak. He also gained experience in securing defaulted unsecured debt.
| 30 |
We had $16,595 and $14,060 in loan assets as of June 30, 2016 and December 31, 2015, respectively. As of June 30, 2016, we have a limited number of construction loans in 13 states with 22 borrowers, and have three development loans in Pittsburgh, Pennsylvania. At the end of 2014 and again in April 2015, we entered into purchase and sale agreements for portions of our loans. The first loan portions sold under the program took place during the first quarter of 2015 and it has allowed us to increase our loan balances and commitments significantly in 2015 and 2016.
We currently have six sources of capital:
June 30, 2016 | December 31, 2015 | |||||||
| Capital Source | ||||||||
| Purchase and sale agreements | $ | 5,476 | $ | 3,683 | ||||
| Secured line of credit from affiliates | – | – | ||||||
| Unsecured Notes through our Notes offer, net of deferred costs | 10,199 | 7,897 | ||||||
| Other unsecured debt | 700 | 600 | ||||||
| Preferred equity | 1,060 | 1,010 | ||||||
| Common equity | 2,319 | 2,274 | ||||||
| Total | $ | 19,754 | $ | 15,464 | ||||
Certain features of the purchase and sale agreements have added liquidity and flexibility, which have lessened the need for the lines of credit from affiliates. Eventually, the Company intends to permanently replace the lines of credit to affiliates with a secured line of credit from a bank or through other liquidity.
Critical Accounting Estimates
To assist in evaluating our consolidated financial statements, we describe below the critical accounting estimates that we use. We consider an accounting estimate to be critical if: (1) the accounting estimate requires us to make assumptions about matters that were highly uncertain at the time the accounting estimate was made, and (2) changes in the estimate that are reasonably likely to occur from period to period, or use of different estimates that we reasonably could have used, would have a material impact on our consolidated financial condition or results of operations.
Loan Losses
Nature of estimates required
Loan losses, as applicable, are accounted for both on the consolidated balance sheets and the consolidated statements of operations. On the consolidated statements of operations, management estimates the amount of losses to capture during the current year. This current period amount incurred is referred to as the loan loss provision. The calculation of our allowance for loan losses, which appears on our consolidated balance sheets, requires us to compile relevant data for use in a systematic approach to assess and estimate the amount of probable losses inherent in our commercial lending operations and to reflect that estimated risk in our allowance calculations. We use the policy summarized as follows:
| 31 |
We establish a collective reserve for all loans which are not more than 60 days past due at the end of a quarter. This collective reserve takes into account both historical information and a qualitative analysis of housing and other economic factors that may impact our future realized losses. For loans to one borrower with committed balances less than 10% of our total committed balances on all loans extended to all customers, we individually analyze for impairment all loans which are more than 60 days past due at the end of a quarter. For loans to one borrower with committed balances equal to or greater than 10% of our total committed balances on all loans extended to all customers, we individually analyze all loans for potential impairment. The analysis of loans, if required, includes a comparison of estimated collateral value to the principal amount of the loan. For impaired loans, if the value determined is less than the principal amount due (less any builder deposit), then the difference is included in the allowance for loan loss. As values change, estimated loan losses may be provided for more or less than the previous period, and some loans may not need a loss provision based on payment history. For homes which are partially complete, we appraise on an as-is and completed basis, and use the one that more closely aligns with our planned method of disposal for the property.
For loans greater than 12 months in age that are individually evaluated for impairment, appraisals have been prepared within the last 13 months. For all loans individually evaluated for impairment, there is also a broker’s opinions of value (“BOV”) prepared, if the appraisal is more than six months old. The lower of any BOV prepared in the last six months, or the most recent appraisal, is used, unless we determine a BOV to be invalid based on the comparable sales used. If we determine a BOV to be invalid, we will use the appraised value. Appraised values are adjusted down for estimated costs associated with asset disposal. Broker’s opinion of selling price, currently valid sales contracts on the subject property, or representative recent actual closings by the builder on similar properties may be used in place of a broker’s opinion of value.
Appraisers are state certified, and are selected by first attempting to utilize the appraiser who completed the original appraisal report. If that appraiser is unavailable or not affordable, we use another appraiser who appraises routinely in that geographic area. BOVs are created by real estate agents. We try to first select an agent we have worked with, and then, if that fails, we select another agent who works in that geographic area.
Loan losses are also impacted when a loan asset is taken through foreclosure or similar means and changed from a loan to a foreclosed asset. The valuation for foreclosed assets does not include future value, as it does while the asset is a loan, and therefore the calculation can have a different result. Also as market values of foreclosed assets reduce, losses are added to loan loss. Gains on loan assets as they become foreclosed assets, and as foreclosed assets are liquidated, are reflected in non-interest income, gain on foreclosed assets.
Fair Value
Nature of estimates required
Currently, fair value of collateral has the potential to impact the calculation of the loan loss provision most heavily. Specifically relevant to the allowance for loan loss reserve is the fair value of the underlying collateral supporting the outstanding loan balances. Also the fair value of real estate will affect our foreclosed asset value (which is booked at 100% of fair value, after selling costs are deducted). Fair value measurements are an exit price, representing the amount that would be received to sell an asset or paid to transfer a liability in an orderly transaction between market participants. Due to a rapidly changing economic market, an erratic housing market, the various methods that could be used to develop fair value estimates, and the various assumptions that could be used, determining the collateral’s fair value requires significant judgment.
Sensitivity analysis
| June 30, 2016 | ||||
| Loan Loss | ||||
| Provision | ||||
| Change in Fair Value Assumption | Higher/(Lower) | |||
| Increasing fair value of the real estate collateral by 30%* | $ | – | ||
| Decreasing fair value of the real estate collateral by 30%** | $ | 11 | ||
* Increases in the fair value of the real estate collateral do not impact the loan loss provision, as the value generally is not “written up.”
**If the loans were nonperforming, assuming a book amount of the loans outstanding of $16,595 and the fair value of the real estate collateral on all outstanding loans was reduced by 30%, an addition to the loan loss provision of $11 would be required.
| 32 |
| June 30, 2016 | ||||
| Foreclosed | ||||
| Assets | ||||
| Change in Fair Value Assumption | Higher/(Lower) | |||
| Increasing fair value of the foreclosed asset by 30%* | $ | – | ||
| Decreasing fair value of the foreclosed asset by 30% | $ | (946 | ) | |
* Increases in the fair value of the foreclosed assets do not impact the carrying value, as the value generally is not “written up.” Those gains would be recognized at the sale of the asset.
Amortization of Deferred Financing Costs
We amortize our deferred financing costs based on the effective interest method. As such, we make estimates for the duration of the future investment proceeds we anticipate receiving from our Notes offering. If this estimate is determined to be incorrect in the future, the rate at which we are amortizing the deferred financing costs as interest expense would be adjusted.
Currently we anticipate a consistent average duration of 35 months for the Notes. An increasing average duration over the remaining anticipated length of the Notes offering would decrease the amount of amortization reflected in interest in the next 12 months, and a decreasing average duration of investments over the remaining anticipated length would increase the amount reflected in the next 12 months.
Sensitivity analysis for average duration
| Change in Anticipated Average Duration | Resulting adjustment needed to Interest Expense during the next 12 months Higher/(Lower) | |||
| Decreasing the average duration by 5 months for all remaining months of origination | $ | 10 | ||
| Increasing the average duration by 5 months for all remaining months of origination | $ | (7 | ) | |
Other Loss Contingencies
Other loss contingencies are recorded as liabilities when it is probable that a liability has been incurred and the amount of the loss is reasonably estimable. Disclosure is required when there is a reasonable possibility that the ultimate loss will exceed the recorded provision. Contingent liabilities are often resolved over long time periods. Estimating probable losses requires analysis of multiple forecasts that often depend on judgments about potential actions by third parties such as courts, arbitrators, juries, or regulators.
Accounting and Auditing Standards Applicable to “Emerging Growth Companies”
We are an “emerging growth company” under the recently enacted JOBS Act. For as long as we are an “emerging growth company,” we are not required to: (1) comply with any new or revised financial accounting standards that have different effective dates for public and private companies until those standards would otherwise apply to private companies, (2) provide an auditor’s attestation report on management’s assessment of the effectiveness of internal control over financial reporting pursuant to Section 404 of the Sarbanes-Oxley Act, (3) comply with any new requirements adopted by the Public Company Accounting Oversight Board, or the PCAOB, requiring mandatory audit firm rotation or a supplement to the auditor’s report in which the auditor would be required to provide additional information about the audit and the financial statements of the issuer or (4) comply with any new audit rules adopted by the PCAOB after April 5, 2012, unless the SEC determines otherwise. We intend to take advantage of such extended transition period. Since we will not be required to comply with new or revised accounting standards on the relevant dates on which adoption of such standards is required for other public companies, our consolidated financial statements may not be comparable to the financial statements of companies that comply with public company effective dates. If we were to subsequently elect to instead comply with these public company effective dates, such election would be irrevocable pursuant to Section 107 of the JOBS Act.
| 33 |
Other Significant Accounting Policies
Other significant accounting policies, not involving the same level of measurement uncertainties as those discussed above, are nevertheless important to an understanding of the consolidated financial statements. Policies related to credit quality information, fair value measurements, related party transactions and revenue recognition require difficult judgments on complex matters that are often subject to multiple and recent changes in the authoritative guidance. Certain of these matters are among topics currently under reexamination or have recently been addressed by accounting standard setters and regulators. Specific conclusions have not been reached by these standard setters, and outcomes cannot be predicted with confidence. Also, see Notes 1 and 2 to our consolidated financial statements, as they discuss accounting policies that we have selected from acceptable alternatives.
Consolidated Results of Operations
Key financial and operating data for the three and six months ended June 30, 2016 and 2015 are set forth below. For a more complete understanding of our industry, the drivers of our business, and our current period results, this discussion should be read in conjunction with our consolidated financial statements, including the related notes and the other information contained in this document.
| Three Months Ended | Six Months Ended | |||||||||||||||
| June 30, | June 30, | |||||||||||||||
| (in thousands of dollars) | 2016 | 2015 | 2016 | 2015 | ||||||||||||
| Interest Income | ||||||||||||||||
| Interest and fee income on loans | $ | 898 | $ | 410 | $ | 1,747 | $ | 786 | ||||||||
| Interest expense | 436 | 183 | 798 | 359 | ||||||||||||
| Net interest income | 462 | 227 | 949 | 427 | ||||||||||||
| Less: Loan loss provision | (2 | ) | 15 | 6 | 23 | |||||||||||
| Net interest income after loan loss provision | 464 | 212 | 943 | 404 | ||||||||||||
| Non-Interest Income | ||||||||||||||||
| Gain from foreclosure of assets | 44 | – | 44 | – | ||||||||||||
| Income | 508 | 212 | 987 | 404 | ||||||||||||
| Non-Interest Expense | ||||||||||||||||
| Selling, general and administrative | 305 | 119 | 655 | 269 | ||||||||||||
| Total non-interest expense | 305 | 119 | 655 | 269 | ||||||||||||
| Net Income | $ | 203 | $ | 93 | $ | 332 | $ | 135 | ||||||||
| Earned distribution to preferred equity holder | 26 | 25 | 52 | 50 | ||||||||||||
| Net income attributable to common equity holder | $ | 177 | $ | 68 | $ | 280 | $ | 85 | ||||||||
| 34 |
Interest Spread
The following table displays a comparison of our interest income, expense, fees and spread:
| Three Months Ended | Six Months Ended | |||||||||||||||||||||||||||||||
| June 30, | June 30, | |||||||||||||||||||||||||||||||
| (in thousands of dollars) | 2016 | 2015 | 2016 | 2015 | ||||||||||||||||||||||||||||
| Interest Income | * | * | * | * | ||||||||||||||||||||||||||||
| Interest income on loans | $ | 609 | 13 | % | $ | 259 | 11 | % | $ | 1,114 | 13 | % | $ | 493 | 11 | % | ||||||||||||||||
| Fee income on loans | 289 | 6 | % | 151 | 7 | % | 633 | 7 | % | 293 | 7 | % | ||||||||||||||||||||
| Interest and fee income on loans | 898 | 19 | % | 410 | 18 | % | 1,747 | 20 | % | 786 | 18 | % | ||||||||||||||||||||
| Interest expense related parties | – | – | – | – | – | – | – | – | ||||||||||||||||||||||||
| Interest expense unsecured | 224 | 5 | % | 113 | 5 | % | 402 | 5 | % | 216 | 5 | % | ||||||||||||||||||||
| Interest expense secured | 145 | 3 | % | 22 | 1 | % | 262 | 3 | % | 38 | 1 | % | ||||||||||||||||||||
| Amortization offering costs | 67 | 1 | % | 48 | 2 | % | 134 | 1 | % | 105 | 2 | % | ||||||||||||||||||||
| Interest expense | 436 | 9 | % | 183 | 8 | % | 798 | 9 | % | 359 | 8 | % | ||||||||||||||||||||
| Net interest income (spread) | 462 | 10 | % | 227 | 10 | % | 949 | 11 | % | 427 | 10 | % | ||||||||||||||||||||
| Weighted average outstanding loan asset balance | $ | 18,620 | $ | 9,132 | $ | 17,875 | $ | 8,877 | ||||||||||||||||||||||||
*annualized amount as percentage of weighted average outstanding gross loan balance
There are three main components that can impact our interest spread:
● Difference between the interest rate received (on our loan assets) and the interest rate paid (on our borrowings). The loans we have originated have interest rates which are based on our cost of funds, with a minimum cost of funds of 5%. The margin is fixed at 2%. Future loans are anticipated to be originated at approximately the same 2% margin. This component is also impacted by the lending of money with no interest cost (our equity). Our interest income on loans was higher in both the three and six month periods ended June 30, 2016 as compared to the same periods in 2015. This increase was due to: 1) default interest charged to a borrower in 2016; 2) a higher interest rate charged to all of our borrowers (caused by an increase in our borrowing costs); and 3) not recognizing interest in 2015 for a borrower we were foreclosing on. Our interest expense increased in 2016 as we sought to increase our loan balances and found that we were able to do so by raising the interest rates we paid to our lenders, including the Notes program. Also we were using capital raised from debt to carry foreclosed assets, and while that raised our interest cost, it did not increase our weighted average outstanding loan balance.
The difference (spread) between the interest income and interest expense was 4% in both the three and six month periods ended June 30, 2016, and 3% for both the three and six months period ended June 30, 2015. This increase is due to charging default interest to one of our borrowers during 2016, and not charging interest during default of a borrower during 2015. We expect an increase in the spread for the second half of 2016, as discussed in the next paragraph.
● Fee income. Fee income is displayed in the table above. The two loans originated in December 2011 had a net origination fee of $924. This fee is being recognized over the life of the loans. In both 2016 and 2015, this fee was 4% of the average outstanding balance on those loans. All of our construction loans have a 5% fee on the amount we commit to lend, which is amortized over the expected life of each of those loans. When loans pay back quicker than their expected life, the remaining unrecognized fee is recognized upon the termination of the loan. In the three months ended June 30, 2016 and 2015, this fee was 6% and 7%, respectively, of the average outstanding balance on those loans. This decrease was due to a longer weighted average duration of our loan portfolio in the second quarter of 2016. In the future, we anticipate creating loans with fees ranging between 4 and 5% of the maximum loan amount, and we anticipate that our fee percentage in 2016 vs. 2015 will be slightly higher due to construction loans being a higher portion of our balances in 2016, and slightly lower due to the 2011 loans only having fee income through July 2016. After July 2016, the interest rate on those loans increases to offset the decrease in fee income, but that amount will be reflected in the difference between the interest rate received and the interest rate paid amounts described in the previous paragraph.
| 35 |
● Amount of nonperforming assets. In 2015 we had loan assets we were foreclosing on which were not paying interest, and in 2016 we had no such loan assets. Our foreclosed assets do not have an interest return, and the balance of those has risen over the last four quarters. On June 30, 2016 and December 31, 2015, we carried cash balances of $1,032 and $1,341, respectively, which also do not have a material return. We have unfunded loan commitments outstanding as of June 30, 2016 and December 31, 2015 of $7,615 and $7,332, respectively.
Loan Loss Provision
We recorded $(2) and $2 in the three month periods ended June 30, 2016 and 2015, respectively, in loss reserve related to our collective reserve (loans not individually impaired). We recorded $6 and $2 in the six month periods ended June 30, 2016 and 2015, respectively, in loss reserve related to our collective reserve. In addition, we reserved $13 and $21 in the three and six month periods ended June 30, 2015 in our specific reserve (for loans individually impaired) specifically related to loans we were foreclosing on in 2015. We anticipate that the collective reserve will increase as our balances rise throughout 2016.
SG&A Expenses
The following table displays our SG&A expenses:
| Three Months | Six Months | |||||||||||||||
| Ended June 30, | Ended June 30, | |||||||||||||||
| 2016 | 2015 | 2016 | 2015 | |||||||||||||
| Selling, general and administrative expenses | ||||||||||||||||
| Legal and accounting | $ | 26 | $ | 26 | $ | 112 | $ | 88 | ||||||||
| Salaries and related expenses | 205 | 40 | 385 | 82 | ||||||||||||
| Board related expenses | 26 | 29 | 55 | 48 | ||||||||||||
| Advertising | 7 | 3 | 25 | 10 | ||||||||||||
| Rent and utilities | 5 | 4 | 10 | 9 | ||||||||||||
| Printing | 3 | 5 | 7 | 10 | ||||||||||||
| Loan foreclosed asset expenses | 13 | 1 | 17 | 1 | ||||||||||||
| Travel | 10 | 3 | 19 | 8 | ||||||||||||
| Other | 10 | 8 | 25 | 13 | ||||||||||||
| Total SG&A | $ | 305 | $ | 119 | $ | 655 | $ | 269 | ||||||||
We began paying our CEO effective January 1, 2016. Our CEO’s total compensation (including bonus accrual and benefits) was approximately $223 and $0 in the six months ended June 30, 2016 and 2015, respectively, and was $131 and $0 in the three months ended June 30, 2016 and 2015, respectively. We also had two additional employees, one field representative and one office for all six months of 2016 as compared to 2015, plus for the last two months we had an additional field representative. We anticipate adding more staff in 2016. Advertising increased due to expenses related to new builder efforts. Loan and foreclosed asset expenses increased due to expenses related to having real estate which we foreclosed on. Travel expense was higher due to our field representatives and more site visits to potential loan jobsites. We anticipate additional travel and advertising expenses in 2016 due to having a field staff, the first of which was hired in December of 2015.
| 36 |
Consolidated Financial Position
Cash and Cash Equivalents
We try to avoid borrowing on our line of credit from affiliates. To accomplish this, we must carry some cash for liquidity. This amount generally grows as our Company grows. At June 30, 2016 and December 31, 2015, we had $1,032 and $1,341, respectively, in cash. When we create new loans, they typically do not have significant outstanding loan balances for several months. We anticipate loan production to increase in 2016, therefore increasing the average amount of cash we may hold, unless we obtain a line of credit from a financial institution.
Deferred Financing Costs, Net
Gross deferred financing costs were $963 and $935 as of June 30, 2016 and December 31, 2015, respectively. The accumulated amortization of those costs was $470 and $336 as of the same dates. We expect that the gross deferred financing amount will continue to increase over time as more of the anticipated financing costs are deferred when paid, and expensed over the life of the debt associated with the financing using the effective interest method. We also expect that the amortization expense and the accumulated amortization will increase in 2016 as compared to 2015.
The deferred financing costs are reflected as a reduction in the unsecured notes offering liability. The Company adopted the guidance on the presentation of debt issuance costs on January 1, 2016, as required. As a result, the Company retrospectively applied the guidance to the 2015 Consolidated Balance Sheet by reclassifying $599 of deferred financing costs previously classified in the assets section.
The following is a roll forward of deferred financing costs:
| Six Months Ended | Year Ended | Six Months Ended | ||||||||||
| June 30, 2016 | December 31, 2015 | June 30, 2015 | ||||||||||
| Deferred financing costs, beginning balance | $ | 935 | $ | 737 | $ | 737 | ||||||
| Additions | 28 | 198 | 97 | |||||||||
| Deferred financing costs, ending balance | $ | 963 | $ | 935 | $ | 834 | ||||||
| Less accumulated amortization | (470 | ) | (336 | ) | (212 | ) | ||||||
| Deferred financing costs, net | $ | 493 | $ | 599 | $ | 622 | ||||||
The following is a roll forward of the accumulated amortization of deferred financing costs:
| Six Months Ended | Year Ended | Six Months Ended | ||||||||||
| June 30, 2016 | December 31, 2015 | June 30, 2015 | ||||||||||
| Accumulated amortization, beginning balance | $ | 336 | $ | 107 | $ | 107 | ||||||
| Additions | 134 | 229 | 105 | |||||||||
| Accumulated amortization, ending balance | $ | 470 | $ | 336 | $ | 212 | ||||||
Loans Receivable
In December 2011, we originated two new loans and assumed a lender’s position on a third loan, which, net of unearned loan fees, had total balances of $5,549 and $6,004 as of June 30, 2016 and December 31, 2015, respectively (these amounts do not include the construction loans mentioned below). These loans were all to borrowers that are affiliated with each other, and are cross-collateralized. Collectively, the development loans and home construction loans to the borrower are referred to herein as the “Pennsylvania Loans.” No individual impairment has been deemed necessary for these loans. The purpose of the loans was to develop two subdivisions in a suburb of Pittsburgh, Pennsylvania. The Hamlets subdivision is a five phase subdivision of 81 lots, of which 52 have been developed and sold, 15 are developed and not sold, and 13 are undeveloped as of June 30, 2016. The Tuscany subdivision is a single phase 18 lot subdivision, with 6 lots remaining as of June 30, 2016. A portion of the collateral of the Pennsylvania Loans is preferred equity interests in us which might be difficult to sell to reduce the loan balance.
| 37 |
As a result of amendments to the Credit Agreement, we converted $1,000 of the SF Loan from debt to preferred equity. The new preferred equity serves as collateral for the Pennsylvania Loans. There is no liquid market for the preferred equity instrument, so we can give no assurance as to our ability to generate any amount of proceeds from that collateral. We also reduced the balance of the SF Loan by $125, which was added to the Interest Escrow, and repaid the remaining $375 with cash. The interest rate on the Existing IMA Loan was raised to match the New IMA Loan. As of June 2016, the Hoskins Group invests in our preferred equity in an amount equal to $10 per closing of a lot payoff in the Hamlets or Tuscany subdivisions.
Also as a result of amendments to the Credit Agreement, we funded an additional $500 of interest escrow, we issued several letters of credit relating to BMH Loan which totaled $153 and $68 June 30, 2016 and December 31, 2015, respectively (the “Letter of Credit”), and we issued cash bonds for development with $257 outstanding at both June 30, 2016 and December 31, 2015. We also allowed a fully funded mortgage in the amount of $1,146 to be placed in superior position to our mortgage, with the $1,146 proceeds being used to reduce the balance of BMH’s outstanding loan with us. The terms and conditions of the Pennsylvania Loans are set forth in further detail below.
We have other borrowers, all of whom borrow money for the purpose of building new homes.
Commercial Loans – Real Estate Development Loan Portfolio Summary
The following is a summary of our loan portfolio to builders for land development as of June 30, 2016. The Pennsylvania loans below are included as part of the Pennsylvania Loans discussed above.
| State | Number
of Borrowers | Number
of Loans | Value
of Collateral(1) | Commitment Amount | Amount
Outstanding | Loan
to Value Ratio(2) | Loan Fee | |||||||||||||||||||||
| Pennsylvania | 1 | 3 | $ | 7,413 | $ | 6,541 | (3) | $ | 5,565 | 75 | % | $ | 1,000 | |||||||||||||||
| Total | 1 | 3 | $ | 7,413 | $ | 6,541 | $ | 5,565 | 75 | % | $ | 1,000 | ||||||||||||||||
| (1) | The value is determined by the appraised value adjusted for remaining costs to be paid and third party mortgage balances. Part of this collateral is $1,060 of preferred equity in our Company. In the event of a foreclosure on the property securing certain of our loans, a portion of our collateral is preferred equity in our Company, which might be difficult to sell, which could impact our ability to eliminate the loan balance. | |
| (2) | The loan to value ratio is calculated by taking the outstanding amount and dividing by the appraised value. | |
| (3) | The commitment amount includes letters of credit and cash bonds. |
The following is a summary of our loan portfolio to builders for land development as of December 31, 2015. The Pennsylvania loans below are included as part of the Pennsylvania Loans discussed above.
| State | Number
of Borrowers | Number
of Loans | Value
of Collateral(1) | Commitment Amount | Amount
Outstanding | Loan
to Value Ratio(2) | Loan Fee | |||||||||||||||||||||
| Pennsylvania | 1 | 3 | $ | 7,902 | $ | 6,456 | (3) | $ | 6,119 | 77 | % | $ | 1,000 | |||||||||||||||
| Total | 1 | 3 | $ | 7,902 | $ | 6,456 | $ | 6,119 | 77 | % | $ | 1,000 | ||||||||||||||||
| (1) | The value is determined by the appraised value adjusted for remaining costs to be paid and third party mortgage balances. Part of this collateral is $1,010 of preferred equity in our Company. In the event of a foreclosure on the property securing certain of our loans, a portion of our collateral is preferred equity in our Company, which might be difficult to sell, which could impact our ability to eliminate the loan balance. | |
| (2) | The loan to value ratio is calculated by taking the outstanding amount and dividing by the appraised value. | |
| (3) | The commitment amount includes letters of credit and cash bonds. |
| 38 |
Commercial Loans – Construction Loan Portfolio Summary
The following is a summary of our loan portfolio to builders for home construction loans as of June 30, 2016.
| State | Number
of Borrowers | Number
of Loans | Value
of Collateral (1) | Commitment Amount | Amount
Outstanding | Loan
to Value Ratio(2) | Loan Fee | |||||||||||||||||||||
| Colorado | 1 | 3 | $ | 1,545 | $ | 1,081 | $ | 619 | 70 | % | 5 | % | ||||||||||||||||
| Connecticut | 1 | 1 | 715 | 500 | 348 | 70 | % | 5 | % | |||||||||||||||||||
| Delaware | 1 | 2 | 1,074 | 671 | 516 | 62 | % | 5 | % | |||||||||||||||||||
| Florida | 4 | 8 | 9,464 | 5,715 | 4,222 | 60 | % | 5 | % | |||||||||||||||||||
| Georgia | 3 | 5 | 4,390 | 2,610 | 1,145 | 59 | % | 5 | % | |||||||||||||||||||
| Idaho | 1 | 1 | 319 | 215 | 95 | 67 | % | 5 | % | |||||||||||||||||||
| New Jersey | 2 | 2 | 677 | 456 | 165 | 67 | % | 5 | % | |||||||||||||||||||
| New York | 1 | 4 | 1,445 | 617 | 565 | 43 | % | 5 | % | |||||||||||||||||||
| North Carolina | 1 | 1 | 242 | 169 | 14 | 70 | % | 5 | % | |||||||||||||||||||
| Pennsylvania | 2 | 6 | 6,927 | 4,112 | 3,632 | 59 | % | 5 | % | |||||||||||||||||||
| South Carolina | 3 | 7 | 1,858 | 1,301 | 214 | 70 | % | 5 | % | |||||||||||||||||||
| Tennessee | 1 | 3 | 1,080 | 767 | 375 | 71 | 5 | % | ||||||||||||||||||||
| Utah | 1 | 2 | 730 | 511 | 176 | 70 | % | 5 | % | |||||||||||||||||||
| Total | 22 | 45 | $ | 30,466 | $ | 18,725 | $ | 12,086 | 61 | %(3) | 5 | % | ||||||||||||||||
| (1) | The value is determined by the appraised value. | |
| (2) | The loan to value ratio is calculated by taking the commitment amount and dividing by the appraised value. | |
| (3) | Represents the weighted average loan to value ratio of the loans. |
The following is a summary of our loan portfolio to builders for home construction loans as of December 31, 2015.
| State | Number
of Borrowers | Number
of Loans | Value
of Collateral (1) | Commitment Amount | Amount
Outstanding | Loan
to Value Ratio(2) | Loan Fee | |||||||||||||||||||||
| Colorado | 1 | 4 | $ | 2,160 | $ | 1,519 | $ | 830 | 70 | % | 5 | % | ||||||||||||||||
| Connecticut | 1 | 1 | 715 | 500 | 251 | 70 | % | 5 | % | |||||||||||||||||||
| Delaware | 1 | 2 | 1,074 | 671 | 105 | 63 | % | 5 | % | |||||||||||||||||||
| Florida | 3 | 10 | 10,683 | 6,440 | 4,378 | 60 | % | 5 | % | |||||||||||||||||||
| Georgia | 2 | 3 | 3,916 | 2,278 | 712 | 58 | % | 5 | % | |||||||||||||||||||
| New Jersey | 1 | 2 | 510 | 357 | 268 | 70 | % | 5 | % | |||||||||||||||||||
| North Carolina | 1 | 2 | 385 | 270 | 172 | 70 | % | 5 | % | |||||||||||||||||||
| Pennsylvania | 2 | 6 | 4,107 | 2,391 | 1,275 | 58 | % | 5 | % | |||||||||||||||||||
| South Carolina | 2 | 16 | 2,395 | 1,699 | 1,136 | 71 | % | 5 | % | |||||||||||||||||||
| Total | 14 | 46 | $ | 25,945 | $ | 16,125 | $ | 9,127 | 62 | %(3) | 5 | % | ||||||||||||||||
| (1) | The value is determined by the appraised value. | |
| (2) | The loan to value ratio is calculated by taking the commitment amount and dividing by the appraised value. | |
| (3) | Represents the weighted average loan to value ratio of the loans. |
| 39 |
During the first half of 2016, we added 9 new customers and 4 new states. Our second largest customer stopped paying interest on two large loans. This was resolved by the customer deeding one property to us in lieu of foreclosure, and the customer partnered with another company to bring the other loan current. The new company also made a $97 deposit into an interest escrow to keep the loan current. These funds represent the vast majority of our other assets at June 30, 2016.
Another of our frequent borrowers has moved on to other lenders. We believe that overall demand for our product is high. In June 2016, we closed 15 loans with 9 customers in 6 states. We expect loan originations to increase in the third quarter as compared to the second quarter of 2016.
Financing receivables are comprised of the following as of June 30, 2016 and December 31, 2015:
June 30, 2016 | December 31, 2015 | |||||||
| Commercial loans, gross | $ | 17,651 | $ | 15,247 | ||||
| Less: Deferred loan fees | (480 | ) | (628 | ) | ||||
| Less: Deposits | (562 | ) | (521 | ) | ||||
| Plus: Deferred origination expense | 30 | – | ||||||
| Less: Allowance for loan losses | (44 | ) | (38 | ) | ||||
| Commercial loans, net | $ | 16,595 | $ | 14,060 | ||||
Roll forward of commercial loans:
Six
Months Ended | Year
Ended | Six
Months Ended | ||||||||||
| Beginning balance | $ | 14,060 | $ | 8,097 | $ | 8,097 | ||||||
| Additions | 10,692 | 13,760 | 4,015 | |||||||||
| Payoffs/Sales | (6,594 | ) | (6,436 | ) | (3,196 | ) | ||||||
| Moved to foreclosed assets | (1,639 | ) | (767 | ) | – | |||||||
| Change in deferred origination expense | 30 | – | – | |||||||||
| Change in builder deposit | (41 | ) | (387 | ) | (24 | ) | ||||||
| Change in loan loss provision | (6 | ) | (17 | ) | (23 | ) | ||||||
| New loan fees | (540 | ) | (897 | ) | (268 | ) | ||||||
| Earned loan fees | 633 | 707 | 294 | |||||||||
| Ending balance | $ | 16,595 | $ | 14,060 | $ | 8,895 | ||||||
| 40 |
Finance Receivables – By risk rating:
June 30, 2016 | December 31, 2015 | |||||||
| Pass | $ | 14,258 | $ | 14,060 | ||||
| Special mention | 2,337 | – | ||||||
| Classified – accruing | – | – | ||||||
| Classified – nonaccrual | – | – | ||||||
| Total | $ | 16,595 | $ | 14,060 | ||||
Finance Receivables – Method of impairment calculation:
June 30, 2016 | December 31, 2015 | |||||||
| Performing loans evaluated individually | $ | 11,199 | $ | 9,971 | ||||
| Performing loans evaluated collectively | 5,396 | 4,089 | ||||||
| Non-performing loans without a specific reserve | $ | – | $ | – | ||||
| Non-performing loans with a specific reserve | – | – | ||||||
| Total evaluated collectively for loan losses | $ | 16,595 | $ | 14,060 | ||||
At June 30, 2016 and December 31, 2015, there were no loans acquired with deteriorated credit quality, past due loans, impaired loans, or loans on nonaccrual status.
The special mention loan as of June 30, 2016 is a loan to our second largest borrower, in Sarasota, Florida. This customer stopped paying interest on two large loans. This was resolved by the customer deeding one property to us in lieu of foreclosure, and the customer partnered with another company to bring the other loan current. The new company also made a $97 deposit into an interest escrow to keep the loan current. We determined to keep this loan as a special mention loan at June 30, 2016. There is no specific reserve for this loan, and it is still included in the collective reserve calculation.
| 41 |
Below is an aging schedule of loans receivable as of June 30, 2016, on a recency basis:
| No.
Accts. |
Unpaid Balances |
% | ||||||||||
| Current loans (current accounts and accounts on which more than 50% of an original contract payment was made in the last 59 days) | 48 | $ | 16,595 | 100 | % | |||||||
| 60-89 days | – | – | 0 | % | ||||||||
| 90-179 days | – | – | 0 | % | ||||||||
| 180-269 days | – | – | 0 | % | ||||||||
| Subtotal | 48 | $ | 16,595 | 100 | % | |||||||
| Interest only accounts (Accounts on which interest, deferment, extension and/or default charges were received in the last 60 days) | – | $ | – | 0 | % | |||||||
| Partial Payment accounts (Accounts on which the total received in the last 60 days was less than 50% of the original contractual monthly payment. “Total received” to include interest on simple interest accounts, as well as late charges on deferment charges on pre-computed accounts.) | $ | 0 | % | |||||||||
| Total | 48 | $ | 16,595 | 100 | % | |||||||
Below is an aging schedule of loans receivable as of June 30, 2016, on a contractual basis:
| No.
Accts. |
Unpaid Balances |
% | ||||||||||
| Contractual Terms - All current Direct Loans and Sales Finance Contracts with installments past due less than 60 days from due date. | 48 | $ | 16,595 | 100 | % | |||||||
| 60-89 days | – | – | 0 | % | ||||||||
| 90-179 days | – | – | 0 | % | ||||||||
| 180-269 days | – | – | 0 | % | ||||||||
| Subtotal | 48 | $ | 16,595 | 100 | % | |||||||
| Interest only accounts (Accounts on which interest, deferment, extension and/or default charges were received in the last 60 days) | – | $ | – | 0 | % | |||||||
| Partial Payment accounts (Accounts on which the total received in the last 60 days was less than 50% of the original contractual monthly payment. “Total received” to include interest on simple interest accounts, as well as late charges on deferment charges on pre-computed accounts.) | – | $ | – | 0 | % | |||||||
| Total | 48 | $ | 16,595 | 100 | % | |||||||
| 42 |
Below is an aging schedule of loans receivable as of December 31, 2015, on a recency basis:
| No.
Accts. |
Unpaid Balances |
% | ||||||||||
| Current loans (current accounts and accounts on which more than 50% of an original contract payment was made in the last 59 days) | 49 | $ | 14,060 | 100 | % | |||||||
| 60-89 days | – | – | 0 | % | ||||||||
| 90-179 days | – | – | 0 | % | ||||||||
| 180-269 days | – | – | 0 | % | ||||||||
| Subtotal | 49 | $ | 14,060 | 100 | % | |||||||
| Interest only accounts (Accounts on which interest, deferment, extension and/or default charges were received in the last 60 days) | – | $ | – | 0 | % | |||||||
| Partial Payment accounts (Accounts on which the total received in the last 60 days was less than 50% of the original contractual monthly payment. “Total received” to include interest on simple interest accounts, as well as late charges on deferment charges on pre-computed accounts.) | – | $ | – | 0 | % | |||||||
| Total | 49 | $ | 14,060 | 100 | % | |||||||
Below is an aging schedule of loans receivable as of December 31, 2015, on a contractual basis:
| No.
Accts. |
Unpaid Balances |
% | ||||||||||
| Contractual Terms - All current Direct Loans and Sales Finance Contracts with installments past due less than 60 days from due date. | 49 | $ | 14,060 | 100 | % | |||||||
| 60-89 days | – | – | 0 | % | ||||||||
| 90-179 days | – | – | 0 | % | ||||||||
| 180-269 days | – | – | 0 | % | ||||||||
| Subtotal | 49 | $ | 14,060 | 100 | % | |||||||
| Interest only accounts (Accounts on which interest, deferment, extension and/or default charges were received in the last 60 days) | – | $ | – | 0 | % | |||||||
| Partial Payment accounts (Accounts on which the total received in the last 60 days was less than 50% of the original contractual monthly payment. “Total received” to include interest on simple interest accounts, as well as late charges on deferment charges on pre-computed accounts.) | – | $ | – | 0 | % | |||||||
| Total | 49 | $ | 14,060 | 100 | % | |||||||
| 43 |
Foreclosed Assets
Roll forward of Foreclosed Assets:
Six
Months Ended | Year
Ended | Six
Months Ended | ||||||||||
| Beginning balance | $ | 965 | $ | – | $ | – | ||||||
| Additions from loans | 1,813 | 885 | – | |||||||||
| Additions for construction/development | 375 | 85 | – | |||||||||
| Ending balance | $ | 3,153 | $ | 965 | $ | – | ||||||
We foreclosed on five properties during 2015, of which four were acquired at the foreclosure sale and one was acquired via a deed in lieu of foreclosure. Three of the properties were lots in Georgia. We have an agreement with a builder to build a house on one of the lots (which is nearing completion as of June 30, 2016) and will likely start construction on a second home once the first home is under contract. Two of the properties are partially completed homes in Louisiana, and work is proceeding to complete those homes. We acquired one property via a deed in lieu of foreclosure during 2016. This property is a beach lot in Sarasota, Florida. We have executed the seller’s part of an option to purchase the property which expires in December 2016. If that sale is executed, we will record a small gain on the sale.
The house we built in Georgia, one of the homes in Louisiana, and the beach lot in Florida are currently being marketed for sale. The remaining home in Louisiana is progressing through construction and we will most likely construct homes on the remaining two lots in Georgia after the sales price for the first home is established.
Other Assets
Other assets at June 30, 2016 were $124, of which $99 were short term receivables established on June 30, 2016 for two different transactions. These funds were received in the first week of July 2016 and are treated as Interest Receivable for fair value measurement.
Customer Interest Escrow
The Pennsylvania Loans called for a funded Interest Escrow account which was funded with proceeds from the Pennsylvania Loans. The initial funding on that Interest Escrow was $450. The balance as of June 30, 2016 and December 31, 2015 was $112 and $267, respectively. To the extent the balance is available in the Interest Escrow, interest due on certain loans is deducted from the Interest Escrow on the date due. The Interest Escrow is increased by 10% of lot payoffs on the same loans, and by interest and/or distributions on the SF Loan and Hoskins Group preferred equity. All of these transactions are noncash to the extent that the total escrow amount does not need additional funding. The Interest Escrow is also used to contribute to the reduction of the $400 subordinated mortgage upon certain lot sales of the collateral of that loan.
Eleven and ten other loans active as of June 30, 2016 and December 31, 2015 also have interest escrows. The cumulative balance of all interest escrows other than the Pennsylvania Loans was $306 and $231 as of June 30, 2016 and December 31, 2015, respectively.
| 44 |
Roll forward of interest escrow:
| Six
Months Ended June 30, 2016 | Year
Ended December 31, 2015 | Six
Months Ended June 30, 2015 | ||||||||||
| Beginning balance | $ | 498 | $ | 318 | $ | 318 | ||||||
| + SF Loan interest and preferred equity dividends | 51 | 82 | 32 | |||||||||
| + Additions from Pennsylvania Loans | 130 | 562 | 532 | |||||||||
| + Additions from other loans | 199 | 328 | 79 | |||||||||
| - Interest and fees | (460 | ) | (755 | ) | (330 | ) | ||||||
| - Repaid to borrower or used to reduce principal | – | (37 | ) | (28 | ) | |||||||
| Ending balance | $ | 418 | $ | 498 | $ | 603 | ||||||
Notes Payable Unsecured
At the same time that we extended the Pennsylvania Loans in December 2011, we assumed a note payable to our borrowing customer for $1,500, which was the balance until December 2014. This loan was unsecured and had the same priority as the Notes. It was also collateral for the loans we extended to this customer. In December 2014, we converted $1,000 of this note payable to preferred equity and moved $125 of the note payable to the interest escrow. In January 2015, we repaid the remaining $375 to the borrower. In addition, we owed $10,692 and $8,496 in Notes payable under our Notes offering as of June 30, 2016 and December 31, 2015, respectively. In August 2015, we borrowed $500 through a note with Seven Kings Holdings, Inc. (“7Kings”), which is currently due in August of 2016. We also have two notes to a third party for $100 each which are due in June 2017 and April 2020. We expect our Notes payable unsecured balance to increase as we raise funds in our Notes offering.
Notes Payable Related Party
We have two lines of credit from affiliates, which had a combined, outstanding balance of $0 as of both June 30, 2016 and December 31, 2015. We had $1,500 available to us on the affiliate lines as of both June 30, 2016 and December 31, 2015, although there is no obligation of the affiliates to lend money up to the note amount. We intend to have a line of credit or multiple lines of credit in the future, and intend to eventually replace these lines from affiliates with lines from unrelated financial institutions. However, we can make no assurance that we will obtain a line of credit with an unrelated financial institution on favorable terms or at all. Certain features of the purchase and sale agreement with the Loan Purchaser have added liquidity and flexibility, which have lessened the need for the lines of credit from affiliates.
S.K. Funding, LLC (“S.K. Funding”), an affiliate of 7Kings, owns 4% of our common equity. S.K. Funding is also a buyer in a purchase and sale agreement where we are the seller. 7Kings is an investor in our notes program for $500 and has a $500 unsecured note due from us.
Purchase and Sale Agreements
In December 2014, the Company entered into a purchase and sale agreement with 1st Financial Bank USA whereby the purchaser may buy loans offered to it by us, and we may be obligated to offer certain loans to purchaser. Purchaser is buying senior positions in the loans they purchase, originally 50%, 60% on new loans as of January 2016, of each loan. Purchaser generally receives the interest rate we charge the borrower (with a floor of 10%) on their portion of the loan balance, and we receive the rest of the interest and all of the loan fee. We service the loans. There is an unlimited right for us to call any loan sold, however in any case of such call, a minimum of 4% of the commitment amount of purchaser must have been received by purchaser in interest, or we must make up the difference. Also, the purchaser has a put option, which is limited to 10% of the funding made by purchaser under all loans purchased in the trailing 12 months.
| 45 |
In April 2015, the Company entered into a purchase and sale agreement with 7Kings as purchaser and the Company as seller, whereby 7Kings buys loans offered to it by us, providing that their portions of the loans always total less than $1,500. On or about May 7, 2015, 7Kings assigned its right and interest in the purchase and sale agreement to S.K. Funding, an affiliate of 7Kings. S.K. Funding may adjust the $1,500 with notice, but such change will not cause a buyback by us. S.K. Funding is buying pari-passu positions in the loans they purchase, generally 50% of each loan. S.K. Funding generally receives a 9% interest rate on its portion of the loan balance, and we receive the rest of the interest and all of the loan fees. We service the loans. There is an unlimited right for us to call any loan sold. This transaction is accounted for as a secured line of credit. In the fourth quarter of 2015, we entered into a modification of our agreement with S.K. Funding whereby S.K. Funding agreed to buy priority interests of $1,000 each in two large loans we originated. In the first quarter of 2016, after one of the $1,000 loans repaid, we entered into an additional modification whereby S.K. Funding agreed to buy priority interests totaling $2,000 in a total of three large loans we originated. The interest rate for the loans covered by these modifications is 9.5% to S.K. Funding. On June 30, 2016, one of those two loans was to our borrower was terminated with a deed in lieu of foreclosure. The property is owned by us, and we owe S.K. Funding $1,000 on that property (secured by mortgage) to be repaid upon the sale of the property. This amount is still covered by our purchase and sale agreement and is included in the totals in the chart below. On December 31, 2015, S.K. Funding purchased 4% of our common equity from the Wallach family.
The purchase and sale agreements are recorded as secured borrowings.
The purchase and sale agreements are detailed below:
| June 30, 2016 | December 31, 2015 | |||||||||||||||
| Book Value of | Due From | Book Value of | Due From | |||||||||||||
| Loans which | Shepherd’s | Loans which | Shepherd’s | |||||||||||||
| Served as | Finance to Loan | Served as | Finance to Loan | |||||||||||||
| Collateral | Purchaser | Collateral | Purchaser | |||||||||||||
| Loan purchaser | ||||||||||||||||
| 1st Financial Bank, USA | $ | 3,366 | $ | 1,667 | $ | 2,723 | $ | 1,061 | ||||||||
| S.K. Funding, LLC | 6,281 | 3,809 | 4,522 | 2,622 | ||||||||||||
| Total | $ | 9,647 | $ | 5,476 | $ | 7,245 | $ | 3,683 | ||||||||
The $6,281 of loans which served as collateral for Seven Kings Holdings, Inc. does not include the book value of the foreclosed assets which also secure their position, which amount is $1,813.
Liquidity and Capital Resources
Our operations are subject to certain risks and uncertainties, particularly related to the concentration of our current operations, a significant portion of which are to a single customer and geographic region, as well as the evolution of the current economic environment and its impact on the United States real estate and housing markets. Both the concentration of risk and the economic environment could directly or indirectly cause or magnify losses related to certain transactions and access to and cost of adequate financing.
The Company’s anticipated primary sources of liquidity going forward are:
| ● | The purchase and sale agreements, which are allowing for a significant increase in loan balances; | |
| ● | The continued issuance of Notes to the general public through our second public Notes offering, which was declared effective by the SEC on September 29, 2015, and has been registered and declared effective in 44 states as of June 30, 2016. We began to advertise for our Notes offerings in March 2013 and received an aggregate of approximately $10,692 and $8,496 in Notes proceeds as of June 30, 2016 and December 31, 2015, respectively (net of redemptions). We anticipate continuing our capital raising efforts in 2016, focusing on the efforts that have proven fruitful; | |
| ● | Interest income and/or principal repayments related to the loans. The Company’s ability to fund its operations remains dependent upon the ability of our largest borrower, whose loan commitments represented 41% and 37% of our total outstanding loan commitments as of June 30, 2016 and December 31, 2015, respectively, to continue paying interest and/or principal. The risk of our largest customer not paying interest is mitigated in the short term by having an interest escrow, which had a balance of $112 and $267 as of June 30, 2016 and December 31, 2015, respectively. While a default by this large customer could impact our cash flow and/or profitability in the long term, we believe that, in the short term, a default might impact profitability, but not liquidity, as we are generally not receiving interest payments from the customer on the development loan portion of his Balance while he is performing (this interest is being credited from his interest escrow). This customer is in good standing with us and is current on his construction loan interest payments. As of June 30, 2016, our next two largest customers make up 14% and 8% respectively of our loan commitments, with loans in Sarasota, Florida and Savannah, Georgia, respectively. As of December 31, 2015, our next two largest customers made up 22% and 6% respectively of our loan commitments, with loans in Sarasota, Florida and Columbia, South Carolina, respectively; and | |
| ● | Funds borrowed from affiliated creditors. |
| 46 |
We generated net income of $332 and $135 for the six months ended June 30, 2016 and 2015, respectively and cash flow from operations of $298 and $631 for the same periods. The largest factors causing cash flow to be greater than income in the period ended June 30, 2015 was an increase in interest payable to note holders who are compounding their interest of $128 and an increase in the customer interest escrow of $285. At June 30, 2016 and December 31, 2015, we had cash on hand of $1,032 and $1,341, respectively, and our outstanding debt totaled $16,868 and $12,779, respectively, of which $5,476 and $3,683 was secured, respectively. The secured amount is from our purchase and sale agreements, which add liquidity and allow us to expand our business. As of June 30, 2016 and December 31, 2015, the amount that we have not loaned, but are obligated to potentially lend to our customers based on our agreements with them, was $7,615 and $7,332, respectively. Our availability on our line of credit from our members was $1,500 at both June 30, 2016 and December 31, 2015. Our members are not obligated to fund requests under our line of credit.
Our current plan is to expand the commercial lending program by using current liquidity and available funding (including funding from our Notes program). We have anticipated the costs of this expansion and the continuing costs of maintaining our public company status, and we anticipate generating, through normal operations, the cash flows and liquidity necessary to meet our operating, investing, and financing requirements. As noted above, the three most significant factors driving our current plans are the purchase and sale agreements, continued payments of principal and/or interest by our largest borrower, and the public offering of Notes. If actual results differ materially from our current plan or if expected financing is not available, we believe we have the ability and intent to obtain funding and generate net worth through additional debt or equity infusions of cash, if needed. There can be no assurance, however, that we will be able to implement our strategies or obtain additional financing under favorable terms, if at all.
Our business of borrowing money and re-lending it to generate interest spread is our primary use of capital resources. There are several risks in any financing company of this nature, and we will discuss significant risks here and how they relate to our Company and what, if any, mitigation techniques we have or may employ.
First, any financial institution needs to match the maturities of its borrowings with the maturities of its assets. The bulk of most financial institutions’ borrowings are in the form of public investments or deposits. These generally have maturities that are either set periods of time, or upon the demand of the investor/depositor. The risk is that either obligations come due before funds are available to be paid out (a shortage of liquidity) or that funds are repaid before the obligation comes due (idle cash, as described herein). To mitigate these risks, we are not offering demand deposits (for instance, a checking account). Instead, we are offering Notes with varying maturities between one and four years, which are typically longer than the average life of the loans we extend. However, we have the option to repay the Notes early, if we wish, without penalty. These items protect us against this risk of matching of debt and asset maturity.
Second, financial institutions must have daily liquidity on their debt side, to offset variations in loan balances on a daily basis. Borrowers can repay their Notes at any time, and they will request draws as they are ready for them. Further, construction loans are not funded 100% initially, so there are contractual obligations on the lender’s part to fund loans in the future. Most financial institutions mitigate this risk by having a secured line of credit from the Federal Reserve Bank. We have the same risk from customer repayments and draws as banks, and we intend to mitigate this risk by obtaining a secured line of credit with a bank. Our current debt financing consists of the two demand loans from our members, our purchase and sale agreement, two unsecured notes, and our unsecured Notes from the public offering. The loan balance from our members on both June 30, 2016 and December 31, 2015 was $0. We had balances on our purchase and sale agreements (which are treated like secured lines of credit in our consolidated financial statements) of $5,476 and $3,683 on June 30, 2016 and December 31, 2015, respectively. The loan balance on all unsecured notes not part of the Notes program was $700 and $600 on June 30, 2016 and December 31, 2015, respectively. The balance of debt from the Notes offering was $10,692 and $8,496 as of June 30, 2016 and December 31, 2015, respectively. If we are able to refinance the demand loans with a bank line of credit, we intend to maintain the outstanding balance on the line at approximately 10% of our committed loan amount. Failure to refinance the demand loans in the future with a larger bank line of credit may result in a lack of liquidity, or low loan production. Future lines of credit from banks will have expiration dates or be demand loans, which will have risks associated with those maturities.
| 47 |
Third, financial institutions have the risk of swings in market rates on borrowing and lending, which can make borrowing money to fund loans to their customers or fund their operations costly. The rates at which institutions can borrow are not necessarily tied to the rates at which they can lend. In our case, we are lending to customers using a rate which varies monthly with our cost of funds. So while we somewhat mitigate this risk, we are still open to the problem of, at the time of originating loans, wanting to originate new loans at a rate that would be profitable, but that rate not being competitive in the market. Lack of lending may cause us to repay Notes early and lose interest spread dollars, hurting our profitability and ability to repay.
We currently (or may in the future) generate liquidity from:
| ● | proceeds from our purchase and sale agreements; | |
| ● | proceeds from the Notes; | |
| ● | interest and fee income; | |
| ● | repayments of loan receivables; | |
| ● | borrowings in the form of the demand loans from our members; | |
| ● | borrowings from lines of credit with banks (not in place yet); | |
| ● | sale of property obtained through foreclosure (none to date); and | |
| ● | other sources as we determine in the future. |
We currently (or may in the future) use liquidity to:
| ● | make payments on other borrowings, including loans from affiliates; | |
| ● | pay Notes on their scheduled due date and Notes that we are required to redeem early; | |
| ● | make interest payments on the Notes; and | |
| ● | to the extent we have remaining net proceeds and adequate cash on hand, fund any one or more of the following activities: |
| ● | to extend commercial construction loans to homebuilders to build single or multi-family homes or develop lots; | |
| ● | to make distributions to equity owners, including the preferred equity; | |
| ● | for working capital and other corporate purposes; | |
| ● | to purchase defaulted secured debt from financial institutions at a discount; | |
| ● | to purchase defaulted unsecured debt from suppliers to homebuilders at a discount and then secure it with real estate or other collateral; | |
| ● | to purchase real estate, in which we will operate our business; and | |
| ● | to redeem Notes which we have decided to redeem prior to maturity. |
| 48 |
The Company’s anticipated primary sources of liquidity going forward are the purchase and sale agreements, continued issuance of Notes to the general public, interest income and principal repayments related to loans it extends, as well as funds borrowed from affiliated creditors. Therefore, the Company’s ability to fund its operations is dependent upon these sources of liquidity.
Inflation, Interest Rates, and Housing Starts
Since we are in the housing industry, we are affected by factors that impact that industry. Housing starts impact our customers’ ability to sell their homes. Faster sales mean higher effective interest rates for us, as the recognition of fees we charge is spread over a shorter period. Slower sales mean lower effective interest rates for us. Slower sales are likely to increase the default rate we experience.
Housing inflation has a positive impact on our operations. When we lend initially, we are lending a percentage of a home’s expected value, based on historical sales. If those estimates prove to be low (in an inflationary market), the percentage we loaned of the value actually decreases, reducing potential losses on defaulted loans. The opposite is true in a deflationary housing price market. It is our opinion that values are average in many of the housing markets in the U.S. today, and our lending against these values is safer than loans made by financial institutions in 2006 to 2008.
Interest rates have several impacts on our business. First, rates affect housing (starts, home size, etc.). High long term interest rates may decrease housing starts, having the effects listed above. Higher interest rates will also affect our investors. We believe that there will be a spread between the rate our Notes yield to our investors and the rates the same investors could get on deposits at FDIC insured institutions. We also believe that the spread may need to widen if these rates rise. For instance, if we pay 7% above average CD rates when CDs are paying 0.5%, when CDs are paying 3%, we may have to have a larger than 7% difference. This may cause our lending rates, which are based on our cost of funds, to be uncompetitive. High interest rates may also increase builder defaults, as interest payments may become a higher portion of operating costs for the builder. Below is a chart showing average CD rates as reported by the Federal Reserve Board. The Board stopped issuing this information in 2014, as rates are so low. We will monitor and update once the Federal Reserve Board begins to update again. Short term interest rates were raised slightly at the end of 2015, but more recently rates have receded.
| 49 |
Certificates of Deposit Index
| Month | 2002 | 2003 | 2004 | 2005 | 2006 | 2007 | 2008 | 2009 | 2010 | 2011 | 2012 | 2013 | ||||||||||||||||||||||||||||||||||||
| Jan | 3.363 | % | 1.688 | % | 1.132 | % | 1.693 | % | 3.674 | % | 5.217 | % | 5.145 | % | 2.730 | % | 0.488 | % | 0.319 | % | 0.313 | % | 0.268 | % | ||||||||||||||||||||||||
| Feb | 3.077 | % | 1.643 | % | 1.113 | % | 1.836 | % | 3.837 | % | 5.266 | % | 4.958 | % | 2.572 | % | 0.407 | % | 0.327 | % | 0.315 | % | 0.262 | % | ||||||||||||||||||||||||
| Mar | 2.828 | % | 1.586 | % | 1.098 | % | 1.996 | % | 3.996 | % | 5.301 | % | 4.748 | % | 2.428 | % | 0.337 | % | 0.331 | % | 0.316 | % | 0.255 | % | ||||||||||||||||||||||||
| Apr | 2.607 | % | 1.533 | % | 1.085 | % | 2.163 | % | 4.158 | % | 5.324 | % | 4.543 | % | 2.265 | % | 0.288 | % | 0.325 | % | 0.321 | % | 0.248 | % | ||||||||||||||||||||||||
| May | 2.423 | % | 1.483 | % | 1.083 | % | 2.332 | % | 4.318 | % | 5.338 | % | 4.323 | % | 2.091 | % | 0.278 | % | 0.305 | % | 0.328 | % | 0.240 | % | ||||||||||||||||||||||||
| Jun | 2.263 | % | 1.419 | % | 1.118 | % | 2.492 | % | 4.483 | % | 5.336 | % | 4.108 | % | 1.893 | % | 0.288 | % | 0.280 | % | 0.336 | % | 0.229 | % | ||||||||||||||||||||||||
| Jul | 2.107 | % | 1.358 | % | 1.162 | % | 2.658 | % | 4.640 | % | 5.324 | % | 3.898 | % | 1.690 | % | 0.293 | % | 0.266 | % | 0.341 | % | 0.220 | % | ||||||||||||||||||||||||
| Aug | 1.961 | % | 1.303 | % | 1.212 | % | 2.833 | % | 4.774 | % | 5.333 | % | 3.673 | % | 1.483 | % | 0.295 | % | 0.263 | % | 0.338 | % | 0.216 | % | ||||||||||||||||||||||||
| Sep | 1.868 | % | 1.247 | % | 1.277 | % | 3.000 | % | 4.897 | % | 5.343 | % | 3.517 | % | 1.204 | % | 0.298 | % | 0.268 | % | 0.331 | % | 0.214 | % | ||||||||||||||||||||||||
| Oct | 1.820 | % | 1.194 | % | 1.355 | % | 3.174 | % | 4.997 | % | 5.323 | % | 3.453 | % | 0.864 | % | 0.300 | % | 0.276 | % | 0.319 | % | 0.212 | % | ||||||||||||||||||||||||
| Nov | 1.767 | % | 1.171 | % | 1.451 | % | 3.345 | % | 5.081 | % | 5.293 | % | 3.236 | % | 0.685 | % | 0.305 | % | 0.288 | % | 0.304 | % | 0.210 | % | ||||||||||||||||||||||||
| Dec | 1.726 | % | 1.151 | % | 1.563 | % | 3.512 | % | 5.153 | % | 5.268 | % | 2.965 | % | 0.556 | % | 0.312 | % | 0.304 | % | 0.283 | % | 0.206 | % | ||||||||||||||||||||||||
Source: Derivation of Rates Reported by Federal Reserve Board-Copyright 2014 MoneyCafe.com (01/2002-06/2013) and Mortgage-X (07/2013 -12/2013).
Housing prices are also generally correlated with housing starts, so that increases in housing starts usually coincide with increases in housing values, and the reverse is generally true. Below is a graph showing single family housing starts from 2000 through today.
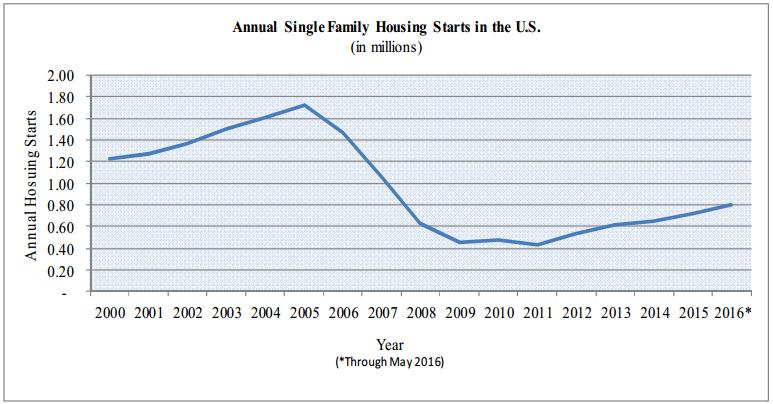
Source: U.S. Census Bureau
To date, changes in housing starts, CD rates, and inflation have not had a material impact on our business.
Off-Balance Sheet Arrangements
As of June 30, 2016 and December 31, 2015, we had no off-balance sheet transactions, nor do we currently have any such arrangements or obligations
| 50 |
ITEM 3. QUANTITATIVE AND QUALITATIVE DISCLOSURE ABOUT MARKET RISK
We are a smaller reporting company as defined by Rule 12b-2 of the Securities Exchange Act of 1934 and are not required to provide the information under this item.
ITEM 4. CONTROLS AND PROCEDURES
Disclosure Controls and Procedures
As of the end of the period covered by this report our chief executive officer (our principal executive officer and principal financial officer) evaluated the effectiveness of the design and operation of our disclosure controls and procedures. Based upon, and as of the date of, the evaluation, our chief executive officer (our principal executive officer and principal financial officer) concluded that the disclosure controls and procedures were effective as of the end of the period covered by this report to ensure that information required to be disclosed in the reports we file and submit under the Securities Exchange Act of 1934, as amended (the “Exchange Act”), is recorded, processed, summarized and reported as and when required. Disclosure controls and procedures include, without limitation, controls and procedures designed to ensure that information required to be disclosed by us in the reports we file and submit under the Exchange Act is accumulated and communicated to our management, including our chief executive officer (our principal executive officer and principal financial officer), as appropriate to allow timely decisions regarding required disclosure.
Internal Control over Financial Reporting
There have been no changes in our internal control over financial reporting that occurred during the quarter ended June 30, 2016 that have materially affected, or are reasonably likely to materially affect, our internal control over financial reporting.
| 51 |
None.
Not applicable.
ITEM 2. UNREGISTERED SALES OF EQUITY SECURITIES AND USE OF PROCEEDS
| (a) | Pursuant to the Tenth Amendment to the Credit Agreement and the Second Preferred Unit Purchase Agreement, we agreed to issue and sell to Investor’s Mark Acquisitions, LLC (“IMA”) and Benjamin Marcus Homes, L.L.C. (“BMH”), in multiple closings, up to 5 Series B Cumulative Redeemable Preferred Units (“Preferred Units”) at a liquidation preference of $100,000 per unit. Specifically, IMA and BMH agreed to purchase 1/10th of a Preferred Unit for $10,000 upon the closing of each lot sold by IMA in the Tuscany subdivision or any subdivisions thereof and each lot sold by BMH in the Hamlets of Springdale subdivision phases 3, 4 and 5.
In April of 2016, IMA and BMH closed on one lot and, upon that closing, purchased 1/10th of a Preferred Unit for $10,000 pursuant to the Second Preferred Unit Purchase Agreement, for a total of 1/10th of a Preferred Unit purchased for $10,000. The proceeds received from the sale of the partial Preferred Unit in this transaction were used for the funding of construction loans.
The transaction described above was effected in a private transaction exempt from the registration requirements of the Securities Act under Section 4(a)(2) thereof. The transaction described above did not involve any public offering, was made without general solicitation or advertising, and IMA represented to the Registrant that it is an “accredited investor” within the meaning of Rule 501 of Regulation D promulgated under the Securities Act, with access to all relevant information necessary to evaluate the investment. | |
| (b) | We registered up to $70,000,000 in Fixed Rate Subordinated Notes in our public offering (SEC File No. 333-203707, effective September 29, 2015). As of June 30, 2016, we had issued $3,522,000 in Notes pursuant to that public offering. From September 29, 2015 through June 30, 2016, we incurred expenses of $63,000 in connection with the issuance and distribution of the Notes, which were paid to third parties. These expenses were not for underwriters or discounts, but were for advertising, printing, and professional services. Net offering proceeds as of June 30, 2016 were $3,459,000, 76% of which was used to increase loan balances, 8% was used to increase cash for future loan balances, 15% was used to reduce senior debt, and 1% was used to complete houses in foreclose assets. | |
| (c) | None. |
ITEM 3. DEFAULTS UPON SENIOR SECURITIES
None.
ITEM 4. MINE SAFETY DISCLOSURES
Not applicable.
| (a) | During the quarter ended June 30, 2016, there was no information required to be disclosed in a report on Form 8-K which was not disclosed in a report on Form 8-K. |
| (b) | During the quarter ended June 30, 2016, there were no material changes to the procedures by which members may recommend nominees to our board of managers. |
| 52 |
The exhibits required to be filed with this report are set forth on the Exhibit Index hereto and incorporated by reference herein.
EXHIBIT INDEX
The following exhibits are included in this report on Form 10-Q for the period ended March 31, 2016 (and are numbered in accordance with Item 601 of Regulation S-K).
| Exhibit No. | Name of Exhibit | |
| 3.1 | Certificate of Conversion, incorporated by reference to Exhibit 3.1 to the Company’s Registration Statement on Form S-1, filed on May 11, 2012, Commission File No. 333-181360 | |
| 3.2 | Certificate of Formation, incorporated by reference to Exhibit 3.2 to the Company’s Registration Statement on Form S-1, filed on May 11, 2012, Commission File No. 333-181360 | |
| 3.3 | Amended and Restated Operating Agreement, incorporated by reference to Exhibit 3.3 to the Company’s Registration Statement on Form S-1, filed on May 11, 2012, Commission File No. 333-181360 | |
| 3.4 | Amendment No. 1 to the Amended and Restated Limited Liability Company Agreement of Shepherd’s Finance, LLC, dated December 31, 2014, incorporated by reference to Exhibit 10.2 to the Company’s Form 8-K, filed on January 6, 2015, Commission File No. 333-181360 | |
| 3.5 | Amendment No. 2 to the Amended and Restated Limited Liability Company Agreement of Shepherd’s Finance, LLC, dated March 30, 2015, incorporated by reference to Exhibit 10.1 to the Company’s Form 8-K, filed on March 30, 2015, Commission File No. 333-181360 | |
| 3.6 | Amendment No. 3 to the Amended and Restated Limited Liability Company Agreement of Shepherd’s Finance, LLC, dated as of December 28, 2015, incorporated by reference to Exhibit 10.3 to the Company’s Form 8-K, filed on December 31, 2015, Commission File No. 333-203707 | |
| 4.1 | Indenture Agreement (including Form of Note) dated September 29, 2015, incorporated by reference to Exhibit 4.1 to the Company’s Post-Effective Amendment No. 1, filed on September 29, 2015, Commission File No. 333-203707 | |
| 10.1 | Deed in Lieu of Foreclosure Agreement with ,Eclipse Partners IILLC dated June 30, 2016, incorporated by reference to Exhibit 10.1 to the Company’s Current Report on Form 8-K, filed on July 7, 2016, Commission File No. 333-203707 | |
| 10.2 | Option to Purchase with Eclipse Partners II, LLC dated June 30, 2016, incorporated by reference to Exhibit 10.2 to the Company’s Current Report on Form 8-K, filed on July 7, 2016, Commission File No. 333-203707 | |
| 10.3 | Assignment of Mortgage from Shepherd’s Finance, LLC to S.K. Funding, LLC dated June 30, 2016, incorporated by reference to Exhibit 10.3 to the Company’s Current Report on Form 8-K, filed on July 7, 2016, Commission File No. 333-203707 | |
| 10.4 | Agreement between Shepherd’s Finance, LLC, Lex Partners II, LLC, and 1333 Vista Drive, LLC effective as of June 30, 2016, incorporated by reference to Exhibit 10.4 to the Company’s Current Report on Form 8-K, filed on July 7, 2016, Commission File No. 333-203707 | |
| 10.5 | Interest Escrow Account Agreement with 1333 Vista Drive, LLC dated June 30, 2016, incorporated by reference to Exhibit 10.5 to the Company’s Current Report on Form 8-K, filed on July 7, 2016, Commission File No. 333-203707 | |
| 10.6 | Amendment to Builder Deposit Agreement between Shepherd’s Finance, LLC, Eclipse Partners II, LLC, and Lex Partners II, LLC dated June 30, 2016, incorporated by reference to Exhibit 10.6 to the Company’s Current Report on Form 8-K, filed on July 7, 2016, Commission File No. 333-203707 | |
| 31.1* | Certification of Principal Executive Officer and Principal Financial Officer, pursuant to Section 302 of the Sarbanes-Oxley Act of 2002 | |
| 32.1* | Certification of Principal Executive Officer and Principal Financial Officer, pursuant to 18 U.S.C. Section 1350, as created by Section 906 of the Sarbanes-Oxley Act of 2002 |
| 101.INS** | XBRL Instance Document | |
| 101.SCH** | XBRL Schema Document | |
| 101.CAL** | XBRL Calculation Linkbase Document | |
| 101.DEF** | XBRL Definition Linkbase Document | |
| 101.LAB** | XBRL Labels Linkbase Document | |
| 101.PRE** | XBRL Presentation Linkbase Document |
* Filed herewith.
**Pursuant to Regulation 406T of Regulation S-T, these Interactive Data Files are deemed not filed or part of a registration statement or prospectus for purpose of Section 11 or 12 of the Securities Act of 1933, as amended, or Section 18 of the Securities Exchange Act of 1934, as amended, and are otherwise not subject to liability.
| 53 |
SIGNATURES
Pursuant to the requirements of the Securities Exchange Act of 1934, the Registrant has duly caused this report to be signed on its behalf by the undersigned thereunto duly authorized.
SHEPHERD’S FINANCE, LLC (Registrant) | ||
| Dated: July 28, 2016 | By: | /s/ Daniel M. Wallach |
| Daniel M. Wallach | ||
| Chief Executive Officer and Manager | ||
| 54 |