Attached files
| file | filename |
|---|---|
| 8-K - FORM 8-K - PG&E Corp | form8k.htm |
| EX-99.01 - EARNINGS RELEASE - PG&E Corp | exhibit9901.htm |

SECOND QUARTER EARNINGS CALL July 28, 2016

Forward Looking Statements This slide presentation contains forecasts and estimates of PG&E Corporation’s 2016 financial results and equity issuances, capital expenditures to be made by PG&E Corporation’s subsidiary, Pacific Gas and Electric Company (Utility), through 2019, the Utility’s rate base through 2019, dividend policy, and general earnings sensitivities. These forecasts, estimates and the underlying assumptions, including but not limited to those relating to future costs, authorized revenues, 2015 GT&S rate case, and incremental equity factors, constitute forward-looking statements that are necessarily subject to various risks and uncertainties and actual results may differ materially. PG&E Corporation and the Utility are not able to predict all the factors that may affect future results. Factors that could cause actual results to differ materially include, but are not limited to: the timing and outcomes of the final CPUC decision in Phase 2 of the 2015 GT&S rate case, the 2017 GRC, the TO rate cases, and other ratemaking and regulatory proceedings; the timing and amount of fines, penalties, and remedial costs that the Utility may incur in connection with the federal criminal prosecution of the Utility, the CPUC decision in the Utility’s natural gas distribution record-keeping practices investigation, the SED’s enforcement matters relating to the Utility’s compliance with natural gas-related laws and regulations, and other investigations that have been or may be commenced relating to the Utility’s compliance with natural gas-related laws and regulations; the timing and outcomes of (i) the CPUC’s investigation of communications between the Utility and the CPUC that may have violated the CPUC’s rules regarding ex parte communications or are otherwise alleged to be improper, and (ii) the U.S. Attorney’s Office in San Francisco and the California Attorney General’s office investigations in connection with communications between the Utility’s personnel and CPUC officials, and whether such matters negatively affect the final decisions to be issued in Phase 2 of the 2015 GT&S rate case or other ratemaking proceedings; the outcome of the Butte fire litigation, and whether the Utility’s insurance is sufficient to cover the Utility’s liability resulting therefrom and otherwise available; and whether additional investigations and proceedings will be openedthe Utility’s ability to control its costs within the authorized levels of spending and the extent to which the Utility incurs unrecoverable costs that are higher than the forecasts of such costs; changes in cost forecasts or the scope and timing of planned work resulting from changes in customer demand for electricity and natural gas or other reasons; the impact that reductions in customer demand for electricity and natural gas have on the Utility’s ability to make investments and recover its costs through rates and earn its authorized return on equity, and whether the Utility is successful in addressing the impact of growing distributed and renewable generation resources and changing customer demand for natural gas and electric services; the amount and timing of charges reflecting probable liabilities for third-party claims and the extent to which costs incurred in connection with third-party claims or litigation can be recovered through insurance, rates, or from other third parties; the ability of PG&E Corporation and the Utility to access capital markets and other sources of debt and equity financing in a timely manner on acceptable terms, and the amount and timing of additional common stock and debt issuances by PG&E Corporation; changes in estimated environmental remediation costs, including costs associated with the Utility’s natural gas compressor sites; the outcome of federal or state tax audits and the impact of any changes in federal or state tax laws, policies, regulations, or their interpretation; the impact of changes in GAAP, standards, rules, or policies, including those related to regulatory accounting, and the impact of changes in their interpretation or application; and the other factors disclosed in PG&E Corporation and the Utility’s joint Annual Report on Form 10-K for the year ended December 31, 2015 and Quarterly Reports on Form 10-Q for the quarters ended March 31 and June 30, 2016. This presentation is not complete without the accompanying statements made by management during the webcast conference call held on July 28, 2016. The statements in this presentation are made as of July 28, 2016. PG&E Corporation undertakes no obligation to update information contained herein. This presentation, including Appendices, and the accompanying press release were attached to PG&E Corporation’s Current Report on Form 8-K that was furnished to the Securities and Exchange Commission on July 28, 2016 and, along with the replay of the conference call, is also available on PG&E Corporation’s website at www.pgecorp.com.
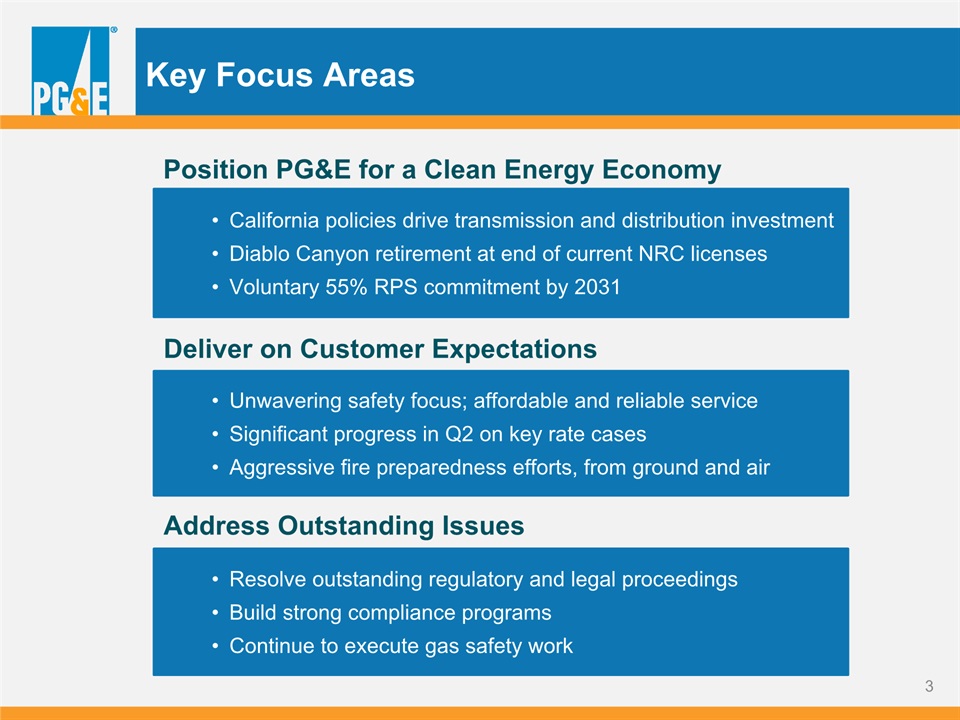
Key Focus Areas California policies drive transmission and distribution investment Diablo Canyon retirement at end of current NRC licensesVoluntary 55% RPS commitment by 2031 Unwavering safety focus; affordable and reliable serviceSignificant progress in Q2 on key rate cases Aggressive fire preparedness efforts, from ground and air Resolve outstanding regulatory and legal proceedingsBuild strong compliance programs Continue to execute gas safety work Position PG&E for a Clean Energy Economy Address Outstanding Issues Deliver on Customer Expectations

Key Assumptions: 2015 GT&S Rate Case Final revenues uncertain pending final Phase 2 decision; billing begins August 1Undercollected revenues for revenue requirement increase in 2015 and 7 months of 2016 will be amortized over 36 monthsTiming for revenue recognition2016 – Recognize 29 months of undercollection: 5 months actual billed revenues plus 24 months of undercollected revenue amortization (collected in rates in 2017 and 2018)2017 – Recognize remaining 7 months of undercollected revenue amortization (collected in rates in 2019) 2011-2014 Capital Spend Above Authorized~$135 million permanently disallowed~$400 million in ratebase subject to audit with potential for future recovery (~$545 million before depreciation and deferred taxes)2015-2018 Capital Spend – Impairment of ~$55 million in spending in excess of cost caps Final decision in 2016$850 million San Bruno penalty allocation: ~$690M capital, ~$160M expense Revenue Recognition Phase 2 Decision Capital Disallowance

Q2 2016 Earnings Results Earnings from Operations is not calculated in accordance with GAAP excludes items impacting comparability. See Appendix 2, Exhibit A for a reconciliation of Earnings per Share (“EPS”) from Operations to EPS on a GAAP basis and Exhibit G for the use of non-GAAP financial measures.

Q2 2016: Quarter over Quarter Comparison Earnings per Share from Operations Earnings per Share from Operations is not calculated in accordance with GAAP and excludes items impacting comparability. See Appendix 2, Exhibit A for a reconciliation of EPS from Operations to EPS on a GAAP basis and Exhibit G for the use of non-GAAP financial measures.

2016 Earnings Per Share Guidance See the Forward Looking Statements for factors that could cause actual results to differ materially from the guidance presented and underlying assumptions. See Appendix 2, Exhibit E for detailed 2016 earnings guidance and Exhibit G for the use of non-GAAP financial measures. Changes from prior quarter are noted in blue. Guidance range excludes a disallowance that may be imposed for prohibited ex parte communicationsin the 2015 GT&S rate case, and any additional potential future fines or penalties

Assumptions for 2016 Return on Equity: 10.4% Equity Ratio: 52% Authorized Cost of Capital* Authorized Rate Base (weighted average) ($ billions) Other Factors Affecting Earnings from Operations - Gas Transmission & Storage rate caseFinal Phase 2 decision in 2016Expense and capital allocation consistent with San Bruno penalty decisionAmounts not requested+ Tax benefits+ Incentive revenues CWIP earnings: offset by below-the-line costs Capital Expenditures($ millions) (1) Includes ~$300M of estimated capital disallowance from San Bruno Penalty Decision(2) Amounts previously reserved for limits on PSEP authorized spend *CPUC authorized See the Forward Looking Statements for factors that could cause actual results to differ materially from the guidance presented and underlying assumptions. Changes from prior quarter are noted in blue.

2016 Items Impacting Comparability Items Impacting Comparability range excludes a disallowance that may be imposed for prohibited ex parte communications in the 2015 GT&S rate case, and any additional potential future fines or penalties See the Forward Looking Statements for factors that could cause actual results to differ materially from the guidance presented and underlying assumptions. See Appendix 2, Exhibit E for detailed 2016 earnings guidance and Exhibit G for the use of non-GAAP financial measures. (1) “Pipeline related expenses” includes costs to identify and remove encroachments from transmission pipeline rights of way. The company spent ~$210 million on this work in 2013-2015. Changes from prior quarter are noted in blue.

2016 Equity Issuance ~$800M 2016 See the Forward Looking Statements for factors that could cause actual results to differ materially from the guidance presented and underlying assumptions. $600 - $800M 2016 - Butte Fire Insurance Receivable+ GT&S Capital Disallowance+ Gas Distribution Recordkeeping Fine June 30, 2016 shares outstanding: ~496 million Changes from prior quarter are noted in blue. As of Q1 2016 As of Q2 2016

Capital Expenditures 2015-2019 ~$5.6B See the Forward Looking Statements for factors that could cause actual results to differ materially from the guidance presented and underlying assumptions. 2019 2016 2017 2018 $5.4B $5.4B – 6.4B annually* * Ranges reflect authorized amounts, amounts requested but not yet authorized, amounts that are currently planned subject to future authorization requests, and historic spending patterns. Ranges also include ~$300 million in 2016 (total of $689 million) for estimated capital disallowed in April 9, 2015 Penalty Decision. 2015 * Ranges reflect authorized amounts, amounts requested but not yet authorized, amounts that are currently planned subject to future authorization requests, and historic spending patterns. Ranges also include ~$300 million in 2016 (total of $692 million) for estimated capital disallowance in San Bruno Penalty Decision. Changes from prior quarter are noted in blue.

Rate Base Growth 2016-2019 2016-2019 Weighted Average Rate Base Estimates reflect authorized amounts, amounts requested but not yet authorized, amounts that are currently planned to be subject to future authorization requests, and historic spending patterns See the Forward Looking Statements for factors that could cause actual results to differ materially from the guidance presented and underlying assumptions. $37 – 39.5B ~ $32.4B $33.3 – 34.9B $35 – 37B 2019 2016 2017 2018 2017-2019 CAGR:5.5 – 6.5% Estimates reflect authorized amounts, amounts requested but not yet authorized, amounts that are currently planned to be subject to future authorization requests, and historic spending patterns Changes from prior quarter are noted in blue.

PG&E Dividend Policy 2015 2016 2019 Targeting 55-65% payout ratio over time ~8%increase ~60%Payout Ratio See the Forward Looking Statements for factors that could cause actual results to differ materially from the guidance presented and underlying assumptions.

Appendix 1 – Guidance and Regulatory Matters Updates to Appendix 1 Since the Previous Quarter slide 15Regulatory CPUC Penalty Decision in Gas Transmission Pipeline Investigations slide 162015 CPUC Gas Transmission and Storage Rate Case slide 172017 CPUC General Rate Case slide 18FERC Transmission Owner Rate Cases slide 19CPUC Investigative Proceedings Schedule slide 20GuidanceIncremental Equity Factors slide 21

Updates to Appendix 1 Since the Previous Quarter Slide 16 CPUC Penalty Decision in Gas Transmission Pipeline InvestigationsSlide 17 2015 CPUC Gas Transmission and Storage Rate CaseSlide 18 2017 CPUC General Rate CaseSlide 19 FERC Transmission Owner Rate CaseSlide 20 CPUC Investigative Proceedings ScheduleSlide 21 Incremental Equity Factors

CPUC Penalty Decision in Gas Transmission Pipeline Investigations See the Forward Looking Statements for factors that could cause actual results to differ materially from the guidance presented and underlying assumptions. (1) The Penalty Decision disallows the Utility from recovering $850 million in costs associated with pipeline safety-related projects and programs that the CPUC will identify in a final phase two decision to be issued in the Utility’s 2015 GT&S rate case. The CPUC recommended in its May 5, 2016 proposed decision in the Utility’s 2015 GT&S rate case that at least $692 million of the $850 million cost disallowance be allocated to capital expenditures. (In the final phase one decision, the CPUC requested comments on whether the percentage of the disallowance that should be applied to capital expenditures as opposed to expense should be changed.) The Utility estimates that approximately $642 million of cumulative capital spending is probable of disallowance, subject to adjustment based on the CPUC final phase two decision in the Utility’s 2015 GT&S rate case.(2) These costs are being expensed as incurred. Future GT&S revenues will be reduced for these unrecovered expenses after a final Phase 2 decision in the 2015 GT&S rate case.(3) In the San Bruno Penalty Decision, the CPUC estimated that the Utility would incur $50 million to comply with the remedies specified in the Penalty Decision, which does not reflect the Utility’s remedy-related costs already incurred nor the Utility’s estimated future remedy-related costs. These costs are being expensed as incurred.

2015 CPUC Gas Transmission and StorageRate Case Application filed with the CPUC December 19, 2013On June 23, 2016, the CPUC voted out a final decision in Phase 1 of the proceedingIn Phase 2, the CPUC will decide on the impact of the San Bruno penalty decision to the adopted interim revenue requirement Assigned Commissioner: Peterman (Florio recused from proceeding) Administrative Law Judge: Dudney (case reassigned from Wong, Yip-Kikugawa, Duda) Q4 2016 Phase 1 Proposed DecisionPhase 1 Final Decision Q3 Q2 Potential Phase 2 Proposed DecisionPotential Phase 2 Final Decision
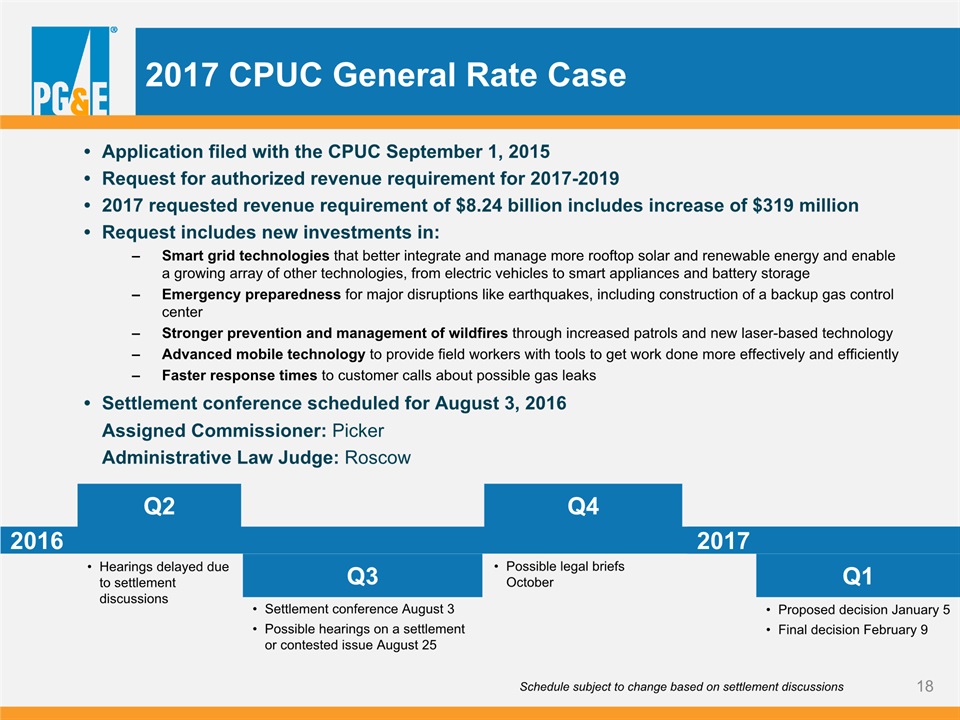
2017 CPUC General Rate Case Application filed with the CPUC September 1, 2015Request for authorized revenue requirement for 2017-20192017 requested revenue requirement of $8.24 billion includes increase of $319 millionRequest includes new investments in:Smart grid technologies that better integrate and manage more rooftop solar and renewable energy and enable a growing array of other technologies, from electric vehicles to smart appliances and battery storage Emergency preparedness for major disruptions like earthquakes, including construction of a backup gas control center Stronger prevention and management of wildfires through increased patrols and new laser-based technologyAdvanced mobile technology to provide field workers with tools to get work done more effectively and efficiently Faster response times to customer calls about possible gas leaks Settlement conference scheduled for August 3, 2016 Assigned Commissioner: Picker Administrative Law Judge: Roscow Q4 2016 Hearings delayed due to settlement discussions Possible legal briefs October Q3 Q2 Settlement conference August 3Possible hearings on a settlement or contested issue August 25 Q1 2017 Proposed decision January 5Final decision February 9 Schedule subject to change based on settlement discussions

FERC Transmission Owner Rate Case July 29, 2015 – TO17 filed with FERC; requested revenue requirement of $1.5 billion, a $314 million increase over TO16September 30, 2015 – FERC accepted TO17 and rate changes suspended until March 1, 2016February 4-5, 2016 – FERC settlement conferenceMarch 18, 2016 – FERC settlement conferenceMay 3, 2016 – FERC settlement conferenceJune 3, 2016 – FERC settlement conference TO17 TO18 July 29, 2016 – TO18 filed with FERC

CPUC Investigative Proceedings Schedule July June August 2016 Ex Parte OIII. 15.11.015 Gas DistributionOII and Order toShow Cause I. 14-11-008 May April Safety Culture OIII. 15.08.019 September 4/1: Reply briefs 4/18: Meet and confer report 4/20: Prehearing conference 5/20: Opening briefs 6/10: Reply briefs 6/1: Presiding officer’s decision NorthStar Consulting begins assessment 7/1: SED appeal of presiding officer's decision 7/18: PG&E response to appeals 8/12: Status report on due diligence efforts Additional prehearingconference 6/28: Carmel appeal of presiding officer’s decision

Incremental Equity Factors Equity Impacting Event MultiplierFine payable to Government (1) 100%Customer bill credit (2) (4) 60%Charge for disallowed capital (3) (4) 30%Disallowed revenue / unrecoverable expenses (1) (4) 60%GT&S revenue timing impact (1) (5) 60% Half of multiplier applies at time of accrual; remaining half applies at time of cash charge Half of multiplier applies at time of the non-cash impact; remaining half applies when cash is returned to customersApplies to charges in the year in which they are incurredAssumes costs tax deductibleHalf of multiplier applies at time of revenue recognition; remaining half applies over amortization period Incremental Equity Factors for Unrecovered Costs

Appendix 2 – Supplemental Earnings Materials Exhibit A: Reconciliation of PG&E Corporation’s Earnings from Operations to Consolidated slide 23-24 Income Available for Common Shareholders in Accordance with GAAP Exhibit B: Key Drivers of PG&E Corporation’s Earnings per Common Share from Operations slide 25Exhibit C: Operational Performance Metrics slide 26-27 Exhibit D: Sales and Sources Summary slide 28Exhibit E: PG&E Corporation’s Earnings Per Share Guidance slide 29-30 Exhibit F: General Earnings Sensitivities slide 31Exhibit G: Use of Non-GAAP Financial Measures slide 32Exhibit H: Expected Timelines of Selected Regulatory Cases slide 33-38

Exhibit A: Reconciliation of PG&E Corporation’s Earnings from Operations to Consolidated Income Available for Common Shareholders in Accordance with Generally Accepted Accounting Principles (“GAAP”) Page 1 of 2 Second Quarter, 2016 vs. 2015 (in millions, except per share amounts) “Earnings from operations” is a non-GAAP financial measure. See Exhibit G: Use of Non-GAAP Financial Measures.“Items impacting comparability” represent items that management does not consider part of the normal course of operations and affect comparability of financial results between periods. See Exhibit G: Use of Non-GAAP Financial Measures. The Utility incurred costs of $27 million pre-tax (before tax impact of $11 million) and $49 million pre-tax (before tax impact of $20 million), during the three and six months ended June 30, 2016, respectively, for pipeline related expenses incurred in connection with the multi-year effort to identify and remove encroachments from transmission pipeline rights of way.The Utility incurred costs of $14 million pre-tax (before tax impact of $6 million) and $31 million pre-tax (before tax impact of $13 million), during the three and six months ended June 30, 2016, respectively, for legal and regulatory related expenses incurred in connection with various enforcement, regulatory, and litigation activities regarding natural gas matters and regulatory communications. The Utility incurred costs of $172 million pre-tax and $259 million pre-tax, during the three and six months ended June 30, 2016, respectively, associated with fines and penalties imposed by the CPUC for natural gas enforcement proceedings. This includes costs of $148 million pre-tax (before tax impact of $60 million) and $235 million pre-tax (before tax impact of $96 million), during the three and six months ended June 30, 2016, respectively, associated with penalties imposed by the CPUC on April 9, 2015 (“San Bruno Penalty Decision”) in the gas transmission pipeline investigations. These are estimated charges for safety-related capital costs that the Utility believes are probable of disallowance in phase two of the 2015 Gas Transmission and Storage (“GT&S”) rate case. In addition, for the three and six months ended June 30, 2016, the Utility accrued fines of $24 million, which are not tax deductible, in connection with the presiding officer’s decision in the CPUC’s investigation regarding natural gas distribution record-keeping practices. Future fines or penalties may be imposed in connection with other enforcement, regulatory, and litigation activities regarding natural gas matters and regulatory communications. All amounts presented in the table above are tax adjusted at PG&E Corporation’s tax rate of 40.75 percent, except for the fine accrued in connection with the presiding officer’s decision in the gas distribution record-keeping investigation, which is not tax deductible. See Footnote 5 below.

Exhibit A: Reconciliation of PG&E Corporation’s Earnings from Operations to Consolidated Income Available for Common Shareholders in Accordance with Generally Accepted Accounting Principles (“GAAP”) Page 2 of 2 The Utility incurred charges of $190 million pre-tax (before tax impact of $77 million), during the three and six months ended June 30, 2016, for capital expenditures that the Utility believes are probable of disallowance based on the CPUC decision dated June 23, 2016 in phase one of the 2015 GT&S rate case, including $134 million pre-tax (before tax impact of $54 million) for 2011 through 2014 capital expenditures in excess of adopted amounts and $56 million pre-tax (before tax impact of $23 million) for the Utility’s estimate of 2015 through 2018 capital expenditures that are probable of exceeding authorized amounts.“GT&S revenue timing impact” refers to the revenues that are expected to be recorded in excess of the 2016 authorized cost of service after the CPUC issues a decision in phase two of the 2015 GT&S rate case to address the allocation of the $850 million disallowance for safety-related work adopted in the San Bruno Penalty Decision. Due to the uncertainty regarding the revenue requirement the CPUC will ultimately adopt, the Utility will not be able to record a true-up of revenues under-collected since January 1, 2015 until after a final phase two decision is issued. The Utility received $39 million pre-tax (before tax impact of $16 million), during the three and six months ended June 30, 2015, for insurance recoveries related to third-party claims and associated legal costs related to natural gas matters. The Utility accrued charges of $0 and $350 million pre-tax (before tax impact of $143 million), during the three and six months ended June 30, 2016, respectively, related to estimated third-party claims in connection with the Butte fire, partially offset by $260 million pre-tax (before tax impact of $106 million) accrued during the three and six months ended June 30, 2016, as probable of insurance recovery. The Utility also incurred charges of $49 million pre-tax (before tax impact of $20 million) and $80 million pre-tax (before tax impact of $32 million), during the three and six months ended June 30, 2016, respectively, for Utility clean-up, repair, and legal costs associated with the Butte fire.

Exhibit B: Key Drivers of PG&E Corporation’s Earnings per Common Share (“EPS”) from Operations Second Quarter and Year to Date, 2016 vs. 2015($/Share, Diluted) See Exhibit A for a reconciliation of EPS from Operations to EPS on a GAAP basis. All amounts presented in the table above are tax adjusted at PG&E Corporation’s tax rate of 40.75 percent.Represents the timing of taxes reportable in quarterly financial statements.Represents the net impact of various legal matters and regulatory proceedings.Represents the gain recognized during the three months ended March 31, 2015. No comparable gain was recognized for the same period in 2016.

Exhibit C: Operational Performance Metrics The 2016 target for earnings from operations is not publicly reported but is consistent with the guidance range provided for 2016 EPS from operations of $3.65 to $3.85. See following page for definitions of the operational performance metrics. The operational performance goals set under the PG&E Corporation 2016 Short Term Incentive Plan (“STIP”) are based on the same operational metrics and targets. 2016 Year to Date

Definitions of 2016 Operational Performance Metrics from Exhibit C SafetyPublic and employee safety are measured in four areas: (1) Nuclear Operations Safety, (2) Gas Operations Safety, (3) Electric Operations Safety, and (4) Employee Safety.1. The safety of the Utility’s nuclear power operations, Unit 1 and Unit 2, is an index comprised of 12 performance indicators for nuclear power generation that are regularly benchmarked against other nuclear power generators. 2. The safety of the Utility’s electric operations is represented by (a) the percentage improvement in the number of wire down events with resulting unplanned sustained outages compared to the same report period of the previous year, and (b) the percentage of time that Utility personnel are on site within 60 minutes after receiving a 911 call of a potential Utility electric hazard.3. The safety of the Utility’s natural gas operations is represented by (a) the ability to complete planned in-line inspections and pipeline retrofit projects, measured by two equally weighted components of In-Line Inspections and In-Line Upgrades; (b) the number of third party “dig-ins” (i.e., damage resulting in repair or replacement of underground facility) to Utility gas assets per 1,000 Underground Service Alert tickets; and (c) the timeliness (measured in minutes) of on-site response to gas emergency service calls.4. The safety of the Utility’s employees is represented by (a) the number of lost workday cases incurred per 200,000 hours worked (or for approximately every 100 employees), (b) the number of serious preventable motor vehicle incidents that the driver could have reasonably avoided, per one million miles driven, and (c) the percentage of work-related injuries reported to the 24/7 Nurse Report Line within one day of the incident.CustomerCustomer satisfaction and service reliability are measured by:1. The overall satisfaction (measured as a score of zero to 100) of customers with the products and services offered by the Utility, as measured through a quarterly survey performed by an independent third-party research firm.2. The total time (measured in minutes) the average customer is without electric power during a given time period.FinancialEarnings from Operations (shown in millions of dollars) measures PG&E Corporation’s earnings power from ongoing core operations. It allows investors to compare the underlying financial performance of the business from one period to another, exclusive of items that management believes do not reflect the normal course of operations (items impacting comparability). EFO is not calculated in accordance with GAAP. For a reconciliation of EFO to Consolidated Income Available for Common Shareholders as reported in accordance with GAAP, see Exhibit A.

Exhibit D: Pacific Gas and Electric Company Sales and Sources Summary Second Quarter and Year to Date, 2016 vs. 2015 Please see the 2015 Annual Report on Form 10-K for additional information about operating statistics. Includes other sources of electric energy totaling 1,581 kWh and 1,366 kWh for the three months ended June 30, 2016 and 2015, respectively, and 3,965 kWh and 3,632 kWh for the six months ended June 30, 2016 and 2015, respectively.

Exhibit E: PG&E Corporation’s Earnings Per Share Guidance Page 1 of 2 All amounts presented in the table above are tax adjusted at PG&E Corporation’s tax rate of 40.75 percent, except for the fine accrued in connection with the presiding officer’s decision in the gas distribution record-keeping investigation, which is not tax deductible. See Footnote 4 below.“Items impacting comparability” represent items that management does not consider part of the normal course of operations and affect comparability of financial results between periods. See Exhibit G: Use of Non-GAAP Financial Measures.“Pipeline related expenses” includes costs incurred to identify and remove encroachments from transmission pipeline rights-of-way. The pre-tax range of estimated costs is shown below. The offsetting tax impacts for the low and high EPS guidance range are $61 million and $41 million, respectively. (3) “Legal and regulatory related expenses” includes costs incurred in connection with various enforcement, regulatory, and litigation activities regarding natural gas matters and regulatory communications. The pre-tax range of estimated costs is shown below. The offsetting tax impacts for the low and high EPS guidance range are $31 million and $10 million, respectively. (4) “Fines and penalties” includes actual and future fines and penalties resulting from various enforcement, regulatory, and litigation activities regarding natural gas matters and regulatory communications. Guidance of $434 million is consistent with the estimated 2016 components of the $1.6 billion final San Bruno Penalty Decision in the gas transmission pipeline investigations and a non-deductible $24 million fine accrued in connection with the presiding officer’s decision in the CPUC’s investigation regarding natural gas distribution record-keeping practices. Guidance does not include amounts for other potential future fines or penalties, including a disallowance that may be imposed for prohibited ex parte communications made in the 2015 GT&S rate case. The pre-tax range of estimated costs is shown below. The offsetting tax impact for the low and high EPS guidance range is $167 million. Actual financial results for 2016 may differ materially from the guidance provided. For a discussion of the factors that may affect future results, see the Forward Looking Statements.

Exhibit E: PG&E Corporation’s Earnings Per Share Guidance Page 2 of 2 Actual financial results for 2016 may differ materially from the guidance provided. For a discussion of the factors that may affect future results, see the Forward Looking Statements. (5) “Butte fire related costs, net of insurance” includes charges of $430 million pre-tax (before tax impact of $175 million) recorded for the six months ended June 30, 2016 related to estimated third-party claims and Utility clean-up, repair, and legal costs associated with the Butte fire. Guidance is consistent with the low end of the estimated range of these costs. The Utility is currently unable to estimate the high end of the range. This amount is partially offset by $260 million pre-tax (before tax impact of $106 million) accrued as probable of insurance recovery for the six months ended June 30, 2016. The pre-tax range of estimated costs is shown below. The offsetting tax impact for the low and high EPS guidance range is $69 million. (6) “GT&S capital disallowance” includes capital expenditures that the Utility believes are probable of disallowance based on the CPUC decision dated June 23, 2016 in phase one of the 2015 GT&S rate case, including $134 million pre-tax (before tax impact of $54 million) for 2011 through 2014 capital expenditures in excess of adopted amounts and $56 million pre-tax (before tax impact of $23 million) for the Utility’s estimate of 2015 through 2018 capital expenditures that are probable of exceeding authorized amounts. The pre-tax range of estimated costs is shown below. The offsetting tax impact for the low and high EPS guidance range is $77 million. (7) “GT&S revenue timing impact” refers to the revenues that are expected to be recorded in excess of the 2016 authorized cost of service after the CPUC issues a decision in phase two of the 2015 GT&S rate case to address the allocation of the $850 million disallowance for safety-related work adopted in the San Bruno Penalty Decision. Due to the uncertainty regarding the revenue requirement the CPUC will ultimately adopt in the final phase two decision, the Utility will not be able to record a true-up of revenues under-collected since January 1, 2015 until after the final phase two decision is issued. In addition, accounting rules allow the Utility to recognize revenues in a given year only if they will be collected from customers within 24 months of the end of that year. Because the phase one decision directs the Utility to collect the difference between the adopted “interim” revenue requirements and the amounts previously collected in rates, retroactive to January 1, 2015, over a 36-month period, the Utility will complete recording the full true-up of under-collected revenues in 2017. The pre-tax range of estimated revenues is shown below. The offsetting tax impact for the low and high EPS guidance range is $143 million.

Exhibit F: General Earnings SensitivitiesPG&E Corporation and Pacific Gas and Electric Company These general earnings sensitivities on factors that may affect 2016 earnings are forward-looking statements that are based on various assumptions. Actual results may differ materially. For a discussion of the factors that may affect future results, see the Forward-Looking Statements.

PG&E Corporation discloses historical financial results and provides guidance based on “earnings from operations” in order to provide a measure that allows investors to compare the underlying financial performance of the business from one period to another, exclusive of items impacting comparability. “Earnings from operations” is a non-GAAP financial measure and is calculated as income available for common shareholders less items impacting comparability. “Items impacting comparability” represent items that management does not consider part of the normal course of operations and affect comparability of financial results between periods, including certain pipeline related expenses, certain legal and regulatory related expenses, fine and penalties, Butte fire costs, and impacts of the GT&S rate case. PG&E Corporation uses earnings from operations to understand and compare operating results across reporting periods for various purposes including internal budgeting and forecasting, short- and long-term operating planning, and employee incentive compensation. PG&E Corporation believes that earnings from operations provide additional insight into the underlying trends of the business allowing for a better comparison against historical results and expectations for future performance. Earnings from operations are not a substitute or alternative for GAAP measures such as consolidated income available for common shareholders and may not be comparable to similarly titled measures used by other companies. Exhibit G: Use of Non-GAAP Financial Measures PG&E Corporation and Pacific Gas and Electric Company: Use of Non-GAAP Financial Measures

Exhibit H: Pacific Gas and Electric CompanyExpected Timelines of Selected Regulatory Cases

Exhibit H: Pacific Gas and Electric CompanyExpected Timelines of Selected Regulatory Cases

Exhibit H: Pacific Gas and Electric CompanyExpected Timelines of Selected Regulatory Cases

Exhibit H: Pacific Gas and Electric CompanyExpected Timelines of Selected Regulatory Cases

Exhibit H: Pacific Gas and Electric CompanyExpected Timelines of Selected Regulatory Cases

Exhibit H: Pacific Gas and Electric CompanyExpected Timelines of Selected Regulatory Cases