Attached files
| file | filename |
|---|---|
| EX-99.3 - EX-99.3 - CoreSite Realty Corp | a16-15554_1ex99d3.htm |
| EX-99.1 - EX-99.1 - CoreSite Realty Corp | a16-15554_1ex99d1.htm |
| EX-10.2 - EX-10.2 - CoreSite Realty Corp | a16-15554_1ex10d2.htm |
| EX-10.1 - EX-10.1 - CoreSite Realty Corp | a16-15554_1ex10d1.htm |
| 8-K - 8-K - CoreSite Realty Corp | a16-15554_18k.htm |
Exhibit 99.2
Earnings Release and Supplemental Information Quarter ended JUNE 30, 2016 ®2016 CoreSite Realty Corporation, All Rights Reserved. Rendering of SV7 - Santa Clara, California

Overview Earnings Release 3 Company Profile 8 Summary of Financial Data 10 Financial Statements Consolidated Balance Sheets 11 Consolidated Statements of Operations 12 Reconciliations of Net Income to FFO, AFFO, EBITDA and Adjusted EBITDA 13 Operating Portfolio Operating Properties 14 Leasing Statistics 15 Geographic and Vertical Diversification 17 10 Largest Customers 18 Development Capital Expenditures and Completed Pre-Stabilized Projects 19 Development Summary 20 Capital Structure Market Capitalization and Debt Summary 22 Interest Summary and Debt Covenants 23 Components of Net Asset Value 24 2016 Guidance 25 Appendix 26 Table of Contents 2

Second-quarter net income per share of $0.37 increased 68% year over year DENVER, CO – JULY 28, 2016 CoreSite Realty Corporation (NYSE:COR), a premier provider of secure, reliable, high-performance data center and interconnection solutions across the U.S., today announced financial results for the second quarter ended June 30, 2016. Quarterly Highlights Reported second-quarter net income per diluted share of $0.37, representing 68.2% growth year over year Reported second-quarter funds from operations (“FFO”) of $0.89 per diluted share and unit, representing 30.9% growth year over year Reported second-quarter total operating revenues of $96.1 million, representing an 18.1% increase year over year Executed a record 171 new and expansion data center leases comprising 48,147 net rentable square feet (NRSF), representing $7.7 million of annualized GAAP rent at a rate of $159 per square foot Commenced 157,642 net rentable square feet of new and expansion leases representing $8.7 million of annualized GAAP rent at a rate of $55 per square foot, including the 136,580 square foot powered-shell build-to-suit in Santa Clara Realized rent growth on signed renewals of 5.2% on a cash basis and 9.4% on a GAAP basis and recorded rental churn of 2.1% Tom Ray, CoreSite’s Chief Executive Officer, commented, “We are pleased that our focused efforts and consistent execution resulted in another quarter of solid financial and operational performance.” Mr. Ray continued, “We made strong progress against our goal of increasing transaction volume, with a record 171 new and expansion leases signed in Q2, as well as further diversifying our customer base with 31 net new logos added across our platform. Our core colocation and interconnection-solutions business produced strong results and we believe we continue to drive differentiated value in our portfolio with the launch of new cloud on-ramps in our platform. We believe that CoreSite remains well-positioned to strengthen the value of its communities of interest within its network-rich, cloud-enabled data center platform.” Financial Results CoreSite reported FFO per diluted share and unit of $0.89 for the three months ended June 30, 2016, an increase of 30.9% compared to $0.68 per diluted share and unit for the three months ended June 30, 2015. On a sequential-quarter basis, FFO per diluted share and unit increased 3.5%. Total operating revenues for the three months ended June 30, 2016, were $96.1 million, an 18.1% increase year over year and an increase of 3.9% on a sequential-quarter basis. CoreSite reported second-quarter net income attributable to common shares of $12.0 million, or $0.37 per diluted share. CoreSite Reports Second-Quarter Revenue and FFO per Share Growth of 18% and 31% Year over Year, Respectively 3 OVERVIEW FINANCIAL STATEMENTS OPERATING PORTFOLIO DEVELOPMENT CAPITAL STRUCTURE Components of NAV GUIDANCE APPENDIX
Sales Activity CoreSite executed 171 new and expansion data center leases representing $7.7 million of annualized GAAP rent during the second quarter, comprised of 48,147 NRSF at a weighted-average GAAP rental rate of $159 per NRSF. CoreSite’s second-quarter data center lease commencements totaled 157,642 NRSF at a weighted average GAAP rental rate of $55 per NRSF, which represents $8.7 million of annualized GAAP rent. CoreSite’s second-quarter lease commencements include the 136,580 square foot powered-shell build-to-suit at SV6 in Santa Clara, which commenced on May 1, 2016. CoreSite’s renewal leases signed in the second quarter totaled $8.5 million in annualized GAAP rent, comprised of 70,028 NRSF at a weighted-average GAAP rental rate of $122 per NRSF, reflecting a 5.2% increase in rent on a cash basis and a 9.4% increase on a GAAP basis. The second-quarter rental churn rate was 2.1%, and included 100 basis points of churn related to CoreSite’s original full-building customer at SV3, as previously disclosed. Development Activity Denver – Subsequent to the end of the second quarter, CoreSite executed a lease providing for expansion at its DE1 facility. The 10-year lease – with renewal rights for four, 5-year extensions at fixed rental rates – is for 23,000 square feet of shell capacity to support CoreSite’s build out of turn-key data center capacity in two or more phases. CoreSite expects to substantially complete construction of the initial phase of 8,000 square feet in the first quarter of 2017, at a cost of approximately $14 million. Santa Clara – During the second quarter, CoreSite placed into service 136,580 square feet at SV6, a powered-shell build-to-suit for a strategic customer; this capacity was 100% leased and occupied at June 30, 2016. Additionally, as of the end of the second quarter, CoreSite had 230,000 square feet of turn-key data center capacity under construction at SV7. As of June 30, 2016, CoreSite had incurred $151.6 million of the estimated $190.0 million required to complete this development and expects to substantially complete construction in the third quarter of 2016. SV7 was 58.5% pre-leased as of the end of the second quarter. Northern Virginia – During the second quarter, CoreSite placed into service 48,137 square feet of turn-key data center space at Phase 4 at VA2. CoreSite’s Reston campus is now fully built out and was 79.4% occupied as of June 30, 2016. Los Angeles – During the second quarter, CoreSite placed into service 43,345 square feet of turn-key data center space at LA2. As of June 30, 2016, this space was 21.2% leased and 7.1% occupied. Quarter Ended June 30, 2016 4 OVERVIEW FINANCIAL STATEMENTS OPERATING PORTFOLIO DEVELOPMENT CAPITAL STRUCTURE Components of NAV GUIDANCE APPENDIX

Balance Sheet and Liquidity As of June 30, 2016, CoreSite had net principal debt of $497.8 million, correlating to 2.4 times second-quarter annualized adjusted EBITDA, and net principal debt and preferred stock outstanding of $612.8 million, correlating to 3.0 times second-quarter annualized adjusted EBITDA. At quarter end, CoreSite had $2.2 million of cash available on its balance sheet and $345.5 million of capacity available under its revolving credit facility. Dividend On May 20, 2016, CoreSite announced a dividend of $0.53 per share of common stock and common stock equivalents for the second quarter of 2016. The dividend was paid on July 15, 2016, to shareholders of record on June 30, 2016. CoreSite also announced on May 20, 2016, a dividend of $0.4531 per share of Series A preferred stock for the period April 15, 2016, to July 14, 2016. The preferred dividend was paid on July 15, 2016, to shareholders of record on June 30, 2016. 2016 Guidance CoreSite is increasing its 2016 guidance of FFO per diluted share and unit to a range of $3.56 to $3.64 from the previous range of $3.52 to $3.60. In addition, CoreSite is increasing its 2016 guidance for net income attributable to common shares to a range of $1.41 to $1.49 from the previous range of $1.28 to $1.36, with the difference between FFO and net income being real estate depreciation and amortization. This outlook is predicated on current economic conditions, internal assumptions about CoreSite’s customer base, and the supply and demand dynamics of the markets in which CoreSite operates. The guidance does not include the impact of any future financing, investment or disposition activities, beyond what has already been disclosed. Upcoming Conferences and Events CoreSite will participate in the Cowen and Company Communications Infrastructure Summit on August 9th in Boulder, Colorado and the Bank of America Merrill Lynch 2016 Global Real Estate Conference on September 13th in New York, New York. Quarter Ended June 30, 2016 5 OVERVIEW FINANCIAL STATEMENTS OPERATING PORTFOLIO DEVELOPMENT CAPITAL STRUCTURE Components of NAV GUIDANCE APPENDIX
Conference Call Details CoreSite will host a conference call on July 28, 2016, at 12:00 p.m., Eastern Time (10:00 a.m., Mountain Time), to discuss its financial results, current business trends and market conditions. The call can be accessed live over the phone by dialing 877-407-3982 for domestic callers or 201-493-6780 for international callers. A replay will be available shortly after the call and can be accessed by dialing 877-870-5176 for domestic callers or 858-384-5517 for international callers. The passcode for the replay is 13639460. The replay will be available until August 11, 2016. Interested parties may also listen to a simultaneous webcast of the conference call by logging on to CoreSite’s website at www.CoreSite.com and clicking on the “Investors” link. The on-line replay will be available for a limited time beginning immediately following the call. About CoreSite CoreSite Realty Corporation (NYSE:COR) delivers secure, reliable, high-performance data center and interconnection solutions to a growing customer ecosystem across eight key North American markets. More than 900 of the world’s leading enterprises, network operators, cloud providers, and supporting service providers choose CoreSite to connect, protect and optimize their performance-sensitive data, applications and computing workloads. Our scalable, flexible solutions and 350+ dedicated employees consistently deliver unmatched data center options — all of which leads to a best-in-class customer experience and lasting relationships. For more information, visit www.CoreSite.com. CoreSite Contact Greer Aviv Vice President of Investor Relations and Media/Public Relations +1 303.405.1012 +1 303.222.7276 Greer.Aviv@CoreSite.com Quarter Ended June 30, 2016 6 OVERVIEW FINANCIAL STATEMENTS OPERATING PORTFOLIO DEVELOPMENT CAPITAL STRUCTURE Components of NAV GUIDANCE APPENDIX
Forward Looking Statements This earnings release and accompanying supplemental information may contain forward-looking statements within the meaning of the federal securities laws. Forward-looking statements relate to expectations, beliefs, projections, future plans and strategies, anticipated events or trends and similar expressions concerning matters that are not historical facts. In some cases, you can identify forward-looking statements by the use of forward-looking terminology such as “believes,” “expects,” “may,” “will,” “should,” “seeks,” “approximately,” “intends,” “plans,” “pro forma,” “estimates” or “anticipates” or the negative of these words and phrases or similar words or phrases that are predictions of or indicate future events or trends and that do not relate solely to historical matters. Forward-looking statements involve known and unknown risks, uncertainties, assumptions and contingencies, many of which are beyond CoreSite’s control, that may cause actual results to differ significantly from those expressed in any forward-looking statement. These risks include, without limitation: the geographic concentration of the company’s data centers in certain markets and any adverse developments in local economic conditions or the demand for data center space in these markets; fluctuations in interest rates and increased operating costs; difficulties in identifying properties to acquire and completing acquisitions; significant industry competition; the company’s failure to obtain necessary outside financing; the company’s failure to qualify or maintain its status as a REIT; financial market fluctuations; changes in real estate and zoning laws and increases in real property tax rates; and other factors affecting the real estate industry generally. All forward-looking statements reflect the company’s good faith beliefs, assumptions and expectations, but they are not guarantees of future performance. Furthermore, the company disclaims any obligation to publicly update or revise any forward-looking statement to reflect changes in underlying assumptions or factors, of new information, data or methods, future events or other changes. For a further discussion of these and other factors that could cause the company’s future results to differ materially from any forward-looking statements, see the section entitled “Risk Factors” in the company’s most recent annual report on Form 10-K, and other risks described in documents subsequently filed by the company from time to time with the Securities and Exchange Commission. Quarter Ended June 30, 2016 7 OVERVIEW FINANCIAL STATEMENTS OPERATING PORTFOLIO DEVELOPMENT CAPITAL STRUCTURE Components of NAV GUIDANCE APPENDIX
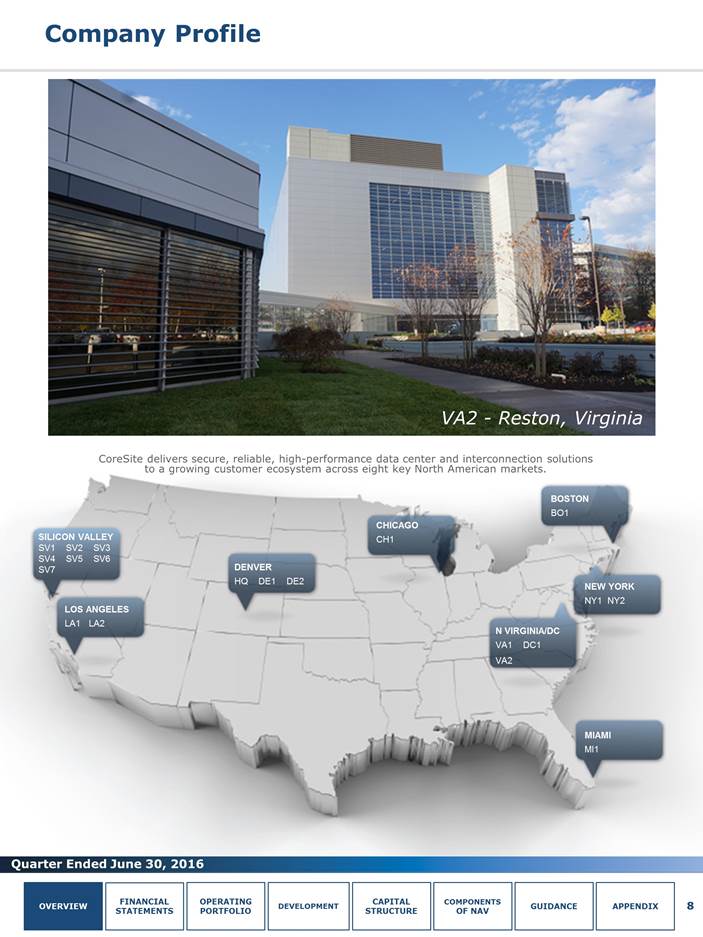
Company Profile CoreSite delivers secure, reliable, high-performance data center and interconnection solutions to a growing customer ecosystem across eight key North American markets. NY2 SILICON VALLEY SV1 SV2 SV3 SV4 SV5 SV6 SV7 LOS ANGELES LA1 LA2 DENVER HQ DE1 DE2 CHICAGO CH1 N VIRGINIA/DC VA1 DC1 VA2 BOSTON BO1 MIAMI MI1 NEW YORK NY1 NY2 8 OVERVIEW FINANCIAL STATEMENTS OPERATING PORTFOLIO DEVELOPMENT CAPITAL STRUCTURE Components of NAV GUIDANCE APPENDIX VA2 - Reston, Virginia
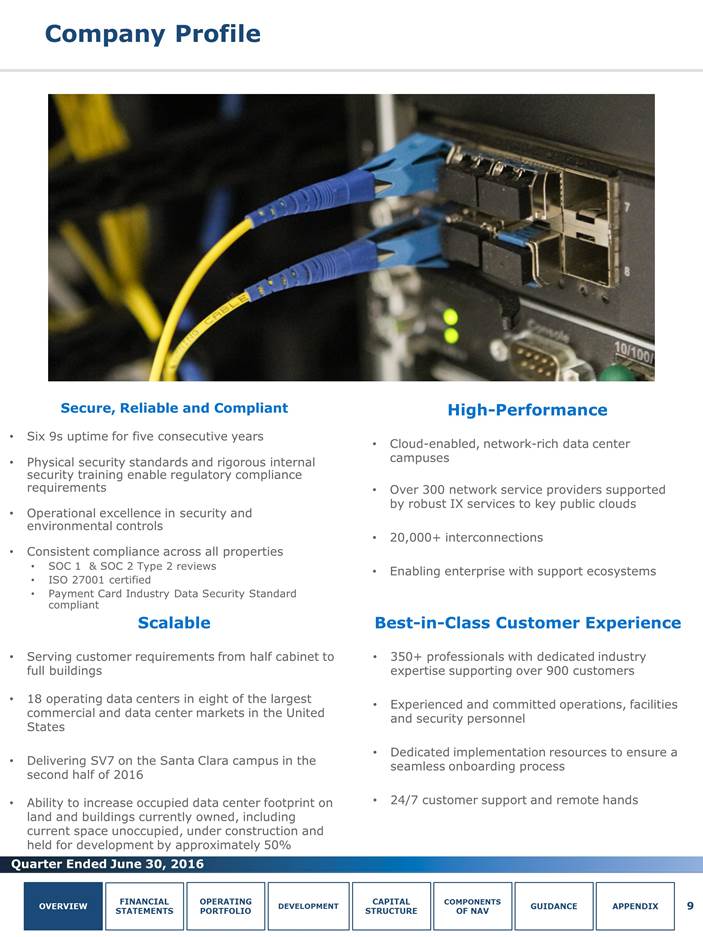
Company Profile Secure, Reliable and Compliant Six 9s uptime for five consecutive years Physical security standards and rigorous internal security training enable regulatory compliance requirements Operational excellence in security and environmental controls Consistent compliance across all properties SOC 1 & SOC 2 Type 2 reviews ISO 27001 certified Payment Card Industry Data Security Standard compliant Scalable Serving customer requirements from half cabinet to full buildings 18 operating data centers in eight of the largest commercial and data center markets in the United States Delivering SV7 on the Santa Clara campus in the second half of 2016 Ability to increase occupied data center footprint on land and buildings currently owned, including current space unoccupied, under construction and held for development by approximately 50% High-Performance Cloud-enabled, network-rich data center campuses Over 300 network service providers supported by robust IX services to key public clouds 20,000+ interconnections Enabling enterprise with support ecosystems Best-in-Class Customer Experience 350+ professionals with dedicated industry expertise supporting over 900 customers Experienced and committed operations, facilities and security personnel Dedicated implementation resources to ensure a seamless onboarding process 24/7 customer support and remote hands 9 OVERVIEW FINANCIAL STATEMENTS OPERATING PORTFOLIO DEVELOPMENT CAPITAL STRUCTURE Components of NAV GUIDANCE APPENDIX
Summary of Financial Data (in thousands, except per share, NRSF and MRR data) 10 OVERVIEW FINANCIAL STATEMENTS OPERATING PORTFOLIO DEVELOPMENT CAPITAL STRUCTURE Components of NAV GUIDANCE APPENDIX Three Months Ended Six Months Ended Summary of Results June 30, 2016 March 31, 2016 June 30, 2015 June 30, 2016 June 30, 2015 Operating revenues $ 96,090 $ 92,480 $ 81,336 $ 188,570 $ 155,991 Net income 19,835 19,606 12,882 39,441 24,942 Net income attributable to common shares 12,035 11,261 5,538 23,296 10,106 Funds from operations (FFO) to shares and units 42,614 40,907 32,140 83,521 62,333 Adjusted funds from operations (AFFO) 40,299 35,581 26,116 75,880 51,270 EBITDA 48,785 46,391 38,722 95,176 74,910 Adjusted EBITDA 51,122 48,487 40,559 99,609 78,510 Per share - diluted: Net income attributable to common shares $ 0.37 $ 0.37 $ 0.22 $ 0.74 $ 0.43 FFO per common share and OP unit $ 0.89 $ 0.86 $ 0.68 $ 1.75 $ 1.32

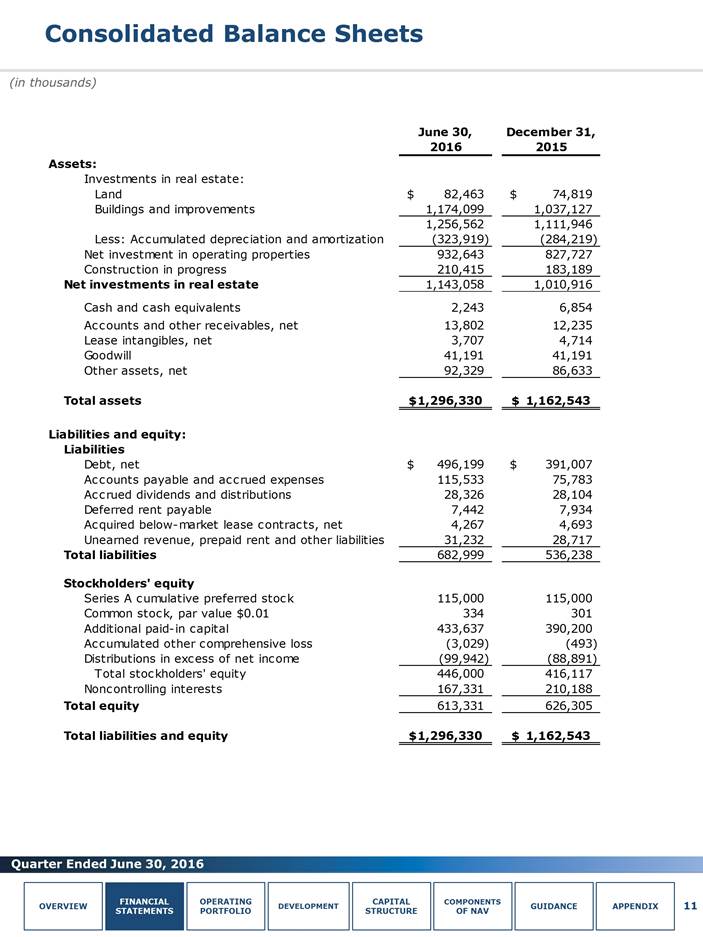
Consolidated Balance Sheets (in thousands) 11 OVERVIEW FINANCIAL STATEMENTS OPERATING PORTFOLIO DEVELOPMENT CAPITAL STRUCTURE Components of NAV GUIDANCE APPENDIX June 30, 2016 December 31, 2015 Assets: Investments in real estate: Land $ 82,463 $74,819 Buildings and improvements 1,174,099 1,037,127 1,256,562 1,111,946 Less: Accumulated depreciation and amortization(323,919) (284,219) Net investment in operating properties 932,643 827,727 Construction in progress 210,415 183,189 Net investments in real estate 1,143,058 1,010,916 Cash and cash equivalents 2,243 6,854 Accounts and other receivables, net 13,802 12,235 Lease intangibles, net 3,707 4,714 Goodwill 41,191 41,191 Other assets, net 92,329 86,633 Total assets $ 1,296,330 $ 1,162,543 Liabilities and equity: Liabilities Debt, net $ 496,199 $ 391,007 Accounts payable and accrued expenses 115,533 75,783 Accrued dividends and distributions 28,326 28,104 Deferred rent payable 7,442 7,934 Acquired below-market lease contracts, net 4,267 4,693 Unearned revenue, prepaid rent and other liabilities 31,232 28,717 Total liabilities 682,999 536,238 Stockholders' equity Series A cumulative preferred stock 115,000 115,000 Common stock, par value $0.01334 301 Additional paid-in capital 433,637 390,200 Accumulated other comprehensive loss (3,029) (493) Distributions in excess of net income (99,942) (88,891) Total stockholders' equity 446,000 416,117 Noncontrolling interests 167,331 210,188 Total equity 613,331 626,305 Total liabilities and equity $ 1,296,330 $ 1,162,543
Consolidated Statements of Operations (in thousands, except share and per share data) 12 OVERVIEW FINANCIAL STATEMENTS OPERATING PORTFOLIO DEVELOPMENT CAPITAL STRUCTURE Components of NAV GUIDANCE APPENDIX Three Months Ended Six Months Ended June 30, 2016 March 31, 2016 December 31, 2015 September 30, 2015 June 30, 2015 June 30, 2016 June 30, 2015 Operating revenues: Data center revenue: Rental revenue $ 52,364 $ 50,371 $ 50,018 $ 47,135 $ 44,824 $ 102,735 $ 86,147 Power revenue 26,401 25,574 24,713 23,543 21,672 51,975 41,239 Interconnection revenue 12,977 12,742 12,024 11,400 10,595 25,719 20,810 Tenant reimbursement and other 2,326 1,830 2,246 2,357 2,276 4,156 3,692 Total data center revenue 94,068 90,517 89,001 84,435 79,367 184,585 151,888 Office, light-industrial and other revenue 2,022 1,963 1,918 1,947 1,969 3,985 4,103 Total operating revenues 96,090 92,480 90,919 86,382 81,336 188,570 155,991 Operating expenses: Property operating and maintenance 25,576 24,663 23,840 24,203 22,084 50,239 41,762 Real estate taxes and insurance 3,070 3,065 3,723 3,216 3,270 6,135 5,205 Depreciation and amortization 26,227 24,770 24,493 24,347 24,046 50,997 46,862 Sales and marketing 4,501 4,221 4,117 3,775 4,256 8,722 8,038 General and administrative 8,818 8,720 9,718 8,644 7,952 17,538 15,817 Rent 5,334 5,417 5,385 5,440 5,007 10,751 10,250 Transaction costs 6 3 - 6 45 9 45 Total operating expenses 73,532 70,859 71,598 69,631 66,660 144,391 127,979 Operating income 22,558 21,621 19,321 16,751 14,676 44,179 28,012 Gain on real estate disposal - - - - - - 36 Interest income - 1 1 1 2 1 4 Interest expense (2,680) (2,012) (1,921) (2,188) (1,730) (4,692) (2,995) Income before income taxes 19,878 19,610 17,401 14,564 12,948 39,488 25,057 Income tax expense (43) (4) (14) (34) (66) (47) (115) Net income 19,835 19,606 17,387 14,530 12,882 39,441 24,942 Net income attributable to noncontrolling interests 5,715 6,261 5,960 5,526 5,259 11,976 10,667 Net income attributable to CoreSite Realty Corporation 14,120 13,345 11,427 9,004 7,623 27,465 14,275 Preferred stock dividends (2,085) (2,084) (2,085) (2,084) (2,085) (4,169) (4,169) Net income attributable to common shares $ 12,035 $ 11,261 $ 9,342 $ 6,920 $ 5,538 $ 23,296 $ 10,106 Net income per share attributable to common shares: Basic $ 0.38 $ 0.37 $ 0.32 $ 0.26 $ 0.23 $ 0.75 $ 0.44 Diluted $ 0.37 $ 0.37 $ 0.32 $ 0.26 $ 0.22 $ 0.74 $ 0.43 Weighted average common shares outstanding: Basic 32,022,845 30,252,693 28,747,900 26,126,332 24,536,583 31,137,769 22,963,111 Diluted 32,435,606 30,694,747 29,183,879 26,549,537 25,055,195 31,554,157 23,525,316

Reconciliations of Net Income to FFO, AFFO, EBITDA and Adjusted EBITDA (in thousands, except per share data) Reconciliation of Net Income to FFO Reconciliation of FFO to AFFO Reconciliation of Net Income to EBITDA and Adjusted EBITDA 13 OVERVIEW FINANCIAL STATEMENTS OPERATING PORTFOLIO DEVELOPMENT CAPITAL STRUCTURE Components of NAV GUIDANCE APPENDIX Three Months Ended Six Months Ended June 30, 2016 March 31, 2016 June 30, 2015 June 30, 2016 June 30, 2015 Net income $ 19,835 $ 19,606 $ 12,882 $ 39,441 $ 24,942 Real estate depreciation and amortization 24,864 23,385 21,343 48,249 41,596 Gain on real estate disposal - - - - (36) FFO $ 44,699 $ 42,991 $ 34,225 $ 87,690 $ 66,502 Preferred stock dividends (2,085) (2,084) (2,085) (4,169) (4,169) FFO available to common shareholders and OP unit holders $ 42,614 $ 40,907 $ 32,140 $ 83,521 $ 62,333 Weighted average common shares outstanding - diluted 32,436 30,695 25,055 31,554 23,525 Weighted average OP units outstanding - diluted 15,239 16,856 22,344 16,047 23,844 Total weighted average shares and units outstanding - diluted 47,675 47,551 47,399 47,601 47,369 FFO per common share and OP unit - diluted $ 0.89 $ 0.86 $ 0.68 $ 1.75 $ 1.32 Reconciliations of FFO to adjusted funds from operations (AFFO): Three Months Ended Six Months Ended June 30, 2016 March 31, 2016 June 30, 2015 June 30, 2016 June 30, 2015 FFO available to common shareholders and unit holders $ 42,614 $ 40,907 $ 32,140 $ 83,521 $ 62,333 Adjustments: Amortization of deferred financing costs 311 283 292 594 586 Non-cash compensation 2,311 2,093 1,792 4,404 3,361 Non-real estate depreciation 1,363 1,385 2,703 2,748 5,266 Straight-line rent adjustment (1,002) (1,594) (2,755) (2,596) (3,819) Amortization of above and below market leases (143) (133) (130) (276) (258) Recurring capital expenditures (1,217) (1,700) (852) (2,917) (2,833) Tenant improvements (901) (1,289) (2,282) (2,190) (4,479) Capitalized leasing costs (3,037) (4,371) (4,792) (7,408) (8,887) AFFO available to common shareholders and OP unit holders $ 40,299 $ 35,581 $ 26,116 $ 75,880 $ 51,270 Reconciliations of earnings before interest, taxes, depreciation and amortization (EBITDA): (in thousands) Three Months Ended Six Months Ended June 30, 2016 March 31, 2016 June 30, 2015 June 30, 2016 June 30, 2015 Net income $ 19,835 $ 19,606 $ 12,882 $ 39,441 $ 24,942 Adjustments: Interest expense, net of interest income 2,680 2,011 1,728 4,691 2,991 Income taxes 43 4 66 47 115 Depreciation and amortization 26,227 24,770 24,046 50,997 46,862 EBITDA $ 48,785 $ 46,391 $ 38,722 $ 95,176 $ 74,910 Non-cash compensation 2,311 2,093 1,792 4,404 3,361 Gain on real estate disposal - - - - (36) Transaction costs / litigation 26 3 45 29 275 Adjusted EBITDA $ 51,122 $ 48,487 $ 40,559 $ 99,609 $ 78,510

Operating Properties 14 OVERVIEW FINANCIAL STATEMENTS OPERATING PORTFOLIO DEVELOPMENT CAPITAL STRUCTURE Components of NAV GUIDANCE APPENDIX See Appendix for definitions. Data Center Operating NRSF Annualized Stabilized Pre-Stabilized Total Held for Rent Percent Percent Percent NRSF Under Development Market/Facilities ($000)(1) Total Occupied(2) Total Occupied(2) Total Occupied(2) Construction NRSF Total NRSF Los Angeles One Wilshire campus LA1* $ 27,953 139,053 88.7 % - - % 139,053 88.7 % - 10,352 149,405 LA2 27,157 254,343 87.5 43,345 3.6 297,688 75.3 - 127,202 424,890 Los Angeles Total 55,110 393,396 87.9 43,345 3.6 436,741 79.6 - 137,554 574,295 San Francisco Bay may need to flip SV and LA for Q2'16 SV1 6,350 85,932 81.5 - - 85,932 81.5 - - 85,932 SV2 7,090 76,676 71.9 - - 76,676 71.9 - - 76,676 Santa Clara campus(3) 36,804 388,589 98.4 - - 388,589 98.4 230,000 - 618,589 San Francisco Bay Total 50,244 551,197 92.1 - - 551,197 92.1 230,000 - 781,197 Northern Virginia VA1 30,096 201,719 96.1 - - 201,719 96.1 - - 201,719 VA2 9,870 115,336 100.0 73,111 1.0 188,447 61.6 - - 188,447 DC1* 3,277 22,137 88.3 - - 22,137 88.3 - - 22,137 Northern Virginia Total 43,243 339,192 96.9 73,111 1.0 412,303 79.9 - - 412,303 - Chicago CH1 18,051 166,776 92.1 11,631 80.2 178,407 91.3 - - 178,407 - Boston BO1 16,348 166,026 98.6 14,031 34.2 180,057 93.6 - 73,619 253,676 New York NY1* 5,009 48,404 70.7 - - 48,404 70.7 - - 48,404 NY2 8,588 68,822 94.1 32,920 27.8 101,742 72.6 - 134,508 236,250 New York Total 13,597 117,226 84.4 32,920 27.8 150,146 72.0 - 134,508 284,654 - Miami MI1 1,843 30,176 81.6 - - 30,176 81.6 - 13,154 43,330 - Denver DE1* 1,333 5,878 100.0 - - 5,878 100.0 - - 5,878 DE2* 391 5,140 86.6 - - 5,140 86.6 - - 5,140 Denver Total 1,724 11,018 93.8 - - 11,018 93.8 - - 11,018 Total Data Center Facilities $ 200,160 1,775,007 92.0 % 175,038 14.6 % 1,950,045 85.1 % 230,000 358,835 2,538,880 Office & Light-Industrial 7,230 354,721 76.7 - - 354,721 76.7 - - 354,721 Total Portfolio $ 207,390 2,129,728 89.5 % 175,038 14.6 % 2,304,766 83.8 % 230,000 358,835 2,893,601 * Indicates properties in which we hold a leasehold interest. (1) On a gross basis, our total portfolio annualized rent was approximately $213.1 million as of June 30, 2016, which reflects the addition of $5.7 million in operating expense reimbursements to contractual net rent under modified gross and triple-net leases. (2) Includes customer leases that have commenced and are occupied as of June 30, 2016. If all leases signed during the current and prior periods had commenced, the percent occupied would have been as follows: Percent Leased Stabilized Pre-Stabilized Total Total Data Center Facilities 92.9% 21.2% 86.5% Total Portfolio 90.2% 21.2% 85.0% (3) The annualized rent for the Santa Clara campus includes amounts associated with a restructured lease agreement involving a customer that has vacated its leased space and is paying discounted rent payments that may be applied to new lease arrangements elsewhere in our portfolio on a dollar-for-dollar basis until the original lease term expires in Q2 2017.

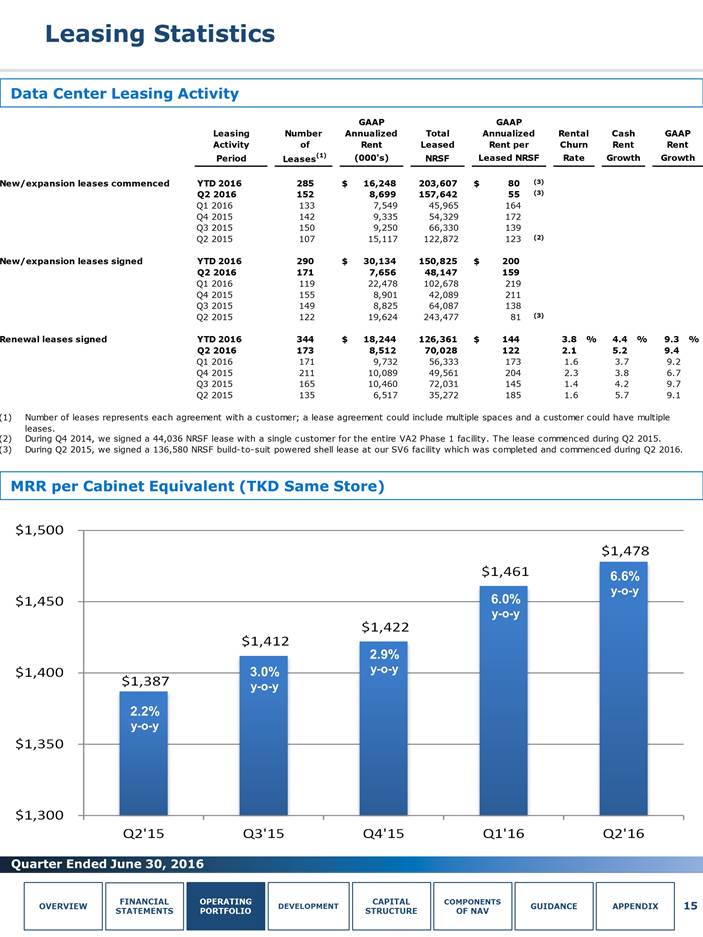
Leasing Statistics Data Center Leasing Activity MRR per Cabinet Equivalent (TKD Same Store) 15 OVERVIEW FINANCIAL STATEMENTS OPERATING PORTFOLIO DEVELOPMENT CAPITAL STRUCTURE Components of NAV GUIDANCE APPENDIX 6.6% y-o-y 6.0% y-o-y 2.9% y-o-y 3.0% y-o-y 2.2% y-o-y $1,387 $1,412 $1,422 $1,461 $1,478 $1,300 $1,350 $1,400 $1,450 $1,500 Q2'15 Q3'15 Q4'15 Q1'16 Q2'16 Leasing Statistics Data Center Leasing Activity GAAP GAAP Leasing Number Annualized Total Annualized Rental Cash GAAP Activity of Rent Leased Rent per Churn Rent Rent Period Leases(1) (000's) NRSF Leased NRSF Rate Growth Growth New/expansion leases commenced YTD 2016 285 $ 16,248 203,607 $ 80 (3) Q2 2016 152 8,699 157,642 55 (3) Q1 2016 133 7,549 45,965 164 Q4 2015 142 9,335 54,329 172 Q3 2015 150 9,250 66,330 139 Q2 2015 107 15,117 122,872 123 (2) New/expansion leases signed YTD 2016 290 $ 30,134 150,825 $ 200 Q2 2016 171 7,656 48,147 159 Q1 2016 119 22,478 102,678 219 Q4 2015 155 8,901 42,089 211 Q3 2015 149 8,825 64,087 138 Q2 2015 122 19,624 243,477 81 (3) Renewal leases signed YTD 2016 344 $ 18,244 126,361 $ 144 3.8 % 4.4 % 9.3 % Q2 2016 173 8,512 70,028 122 2.1 5.2 9.4 Q1 2016 171 9,732 56,333 173 1.6 3.7 9.2 Q4 2015 211 10,089 49,561 204 2.3 3.8 6.7 Q3 2015 165 10,460 72,031 145 1.4 4.2 9.7 Q2 2015 135 6,517 35,272 185 1.6 5.7 9.1 (1) Number of leases represents each agreement with a customer; a lease agreement could include multiple spaces and a customer could have multiple leases. (2) During Q4 2014, we signed a 44,036 NRSF lease with a single customer for the entire VA2 Phase 1 facility. The lease commenced during Q2 2015. (3) During Q2 2015, we signed a 136,580 NRSF build-to-suit powered shell lease at our SV6 facility which was completed and commenced during Q2 2016.
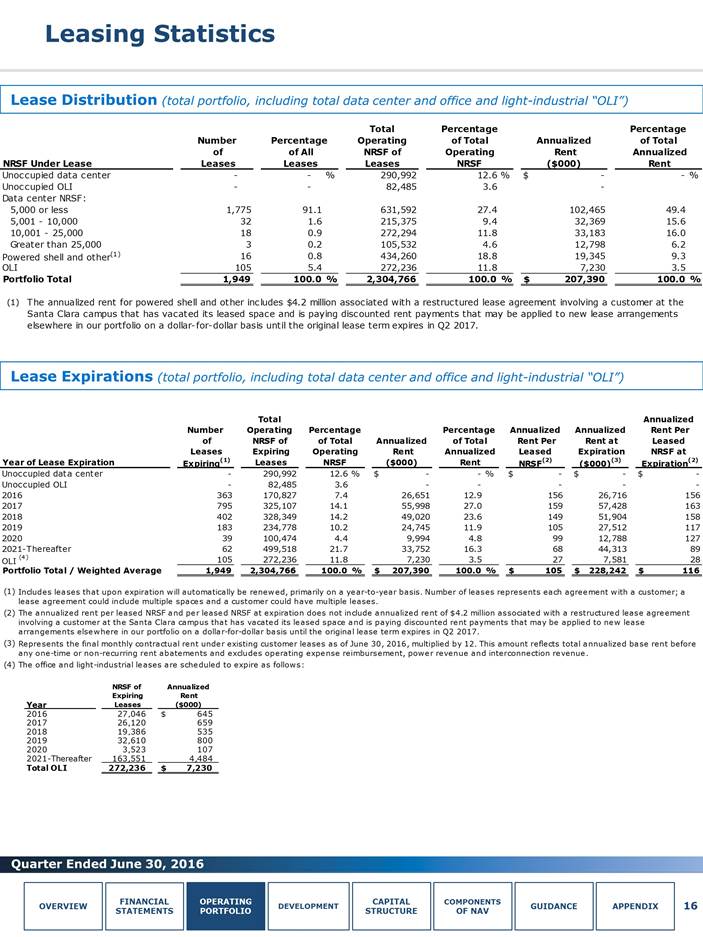
Leasing Statistics Lease Expirations (total portfolio, including total data center and office and light-industrial “OLI”) Lease Distribution (total portfolio, including total data center and office and light-industrial “OLI”) 16 OVERVIEW FINANCIAL STATEMENTS OPERATING PORTFOLIO DEVELOPMENT CAPITAL STRUCTURE Components of NAV GUIDANCE APPENDIX Total Percentage Percentage Number Percentage Operating of Total Annualized of Total of of All NRSF of Operating Rent Annualized NRSF Under Lease Leases Leases Leases NRSF ($000) Rent Unoccupied data center - - % 290,992 12.6 % $ - - % Unoccupied OLI - - 82,485 3.6 - Data center NRSF: 5,000 or less 1,775 91.1 631,592 27.4 102,465 49.4 5,001 - 10,000 32 1.6 215,375 9.4 32,369 15.6 10,001 - 25,000 18 0.9 272,294 11.8 33,183 16.0 Greater than 25,000 3 0.2 105,532 4.6 12,798 6.2 Powered shell and other(1) 16 0.8 434,260 18.8 19,345 9.3 OLI 105 5.4 272,236 11.8 7,230 3.5 Portfolio Total 1,949 100.0 % 2,304,766 100.0 % $ 207,390 100.0 % (1) The annualized rent for powered shell and other includes $4.2 million associated with a restructured lease agreement involving a customer at the Santa Clara campus that has vacated its leased space and is paying discounted rent payments that may be applied to new lease arrangements elsewhere in our portfolio on a dollar-for-dollar basis until the original lease term expires in Q2 2017.
Geographic and Vertical Diversification Geographic Diversification Vertical Diversification 17 OVERVIEW FINANCIAL STATEMENTS OPERATING PORTFOLIO DEVELOPMENT CAPITAL STRUCTURE Components of NAV GUIDANCE APPENDIX Los Angeles 27.5% San Francisco Bay 25.1% Northern Virginia 21.6% Chicago 9.0% Boston 8.2% New York 6.8% Miami 0.9% Denver 0.9% Digital Content & Multimedia 23.7% SI & MSP 9.9% Other Enterprise 18.8% Networks & Mobility 23.2% Cloud 24.4% Percentage of Total Data Metropolitan Market Center Annualized Rent Los Angeles 27.5 % San Francisco Bay 25.1 Northern Virginia 21.6 Chicago 9.0 Boston 8.2 New York 6.8 Miami 0.9 Denver 0.9 Total 100.0 %

10 Largest Customers 10 Largest Customers (total portfolio, including data center and office and light-industrial) 18 OVERVIEW FINANCIAL STATEMENTS OPERATING PORTFOLIO DEVELOPMENT CAPITAL STRUCTURE Components of NAV GUIDANCE APPENDIX Weighted Percentage Percentage Average Number Total of Total Annualized of Total Remaining of Occupied Operating Rent Annualized Lease Term in Customer Industry CoreSite Vertical Locations NRSF NRSF(1) ($000) Rent(2) Months(3) 1 Technology Cloud 10 282,629 12.3 % $ 14,369 6.9 % 76 2 Technology Enterprise - SI & MSP 3 63,859 2.8 8,597 4.2 32 3 Technology Cloud 2 95,225 4.1 7,339 3.5 74 4 Technology(4) Enterprise - Digital Content 10 68,492 3.0 6,493 3.1 12 5 Technology Enterprise - Digital Content 2 31,848 1.4 5,669 2.7 22 6 Technology Enterprise - Other 3 15,055 0.6 4,865 2.4 29 7 Technology Network 5 27,935 1.2 4,848 2.3 34 8 Technology Enterprise - Other 2 26,337 1.1 4,568 2.2 12 9 Technology Cloud 1 31,283 1.4 4,230 2.1 28 10 Government* Enterprise - Other 1 136,420 5.9 3,895 1.9 79 Total/Weighted Average(5) 779,083 33.8 % $ 64,873 31.3 % 45 * Denotes customer using space for general office purposes. (1) Represents the customer’s total occupied square feet divided by the total operating NRSF in the portfolio as of June 30, 2016. (2) Represents the customer’s total annualized rent divided by the total annualized rent in the portfolio as of June 30, 2016. (3) Weighted average based on percentage of total annualized rent expiring calculated as of June 30, 2016. (4) During the second quarter of 2016 we successfully renewed and extended portions of the customer's deployments. We are currently negotiating renewal leases for the remaining locations. We anticipate that the lease negotiations will be finalized at some of the locations during 2016 and that other locations will be vacated. (5) In addition to the ten largest customers, total annualized rent includes $4.2 million associated with a restructured lease agreement involving a customer at the Santa Clara campus that has vacated its leased space and is paying discounted rent payments that may be applied to new lease arrangements elsewhere in our portfolio on a dollar-for-dollar basis until the original lease term expires in Q2 2017.

Capital Expenditures and Completed Pre-Stabilized Projects (in thousands, except NRSF and cost per NRSF data) Completed Pre-Stabilized Projects Capital Expenditures and Repairs and Maintenance 19 OVERVIEW FINANCIAL STATEMENTS OPERATING PORTFOLIO DEVELOPMENT CAPITAL STRUCTURE Components of NAV GUIDANCE APPENDIX Capital Expenditures Three Months Ended June 30, March 31, December 31, September 30, June 30, 2016 2016 2015 2015 2015 Data center expansion(1) $ 100,990 $ 64,088 $ 64,816 $ 25,762 $ 21,130 Non-recurring investments(2) 3,091 3,765 1,968 1,263 2,868 Tenant improvements 901 1,289 1,866 1,692 2,282 Recurring capital expenditures(3) 1,217 1,700 2,328 667 852 Total capital expenditures $ 106,199 $ 70,842 $ 70,978 $ 29,384 $ 27,132 Repairs and maintenance expense(4) $ 3,042 $ 3,073 $ 2,715 $ 3,011 $ 2,485 (1) Data center expansion capital expenditures include new data center construction, development projects adding capacity to existing data centers and other revenue generating investments. Data center expansion also includes investment of Deferred Expansion Capital, as defined in the Appendix. (2) Non-recurring investments include upgrades to existing data center or office space and company-wide improvements that are ancillary to revenue generation such as internal system development and system-wide security upgrades, which have a future economic benefit. (3) Recurring capital expenditures include required equipment upgrades within our operating portfolio, which have a future economic benefit. (4) Repairs and maintenance expense is classified within property operating and maintenance expense in the consolidated statement of operations. These expenditures represent recurring maintenance contracts and repairs to operating equipment necessary to maintain current operations.

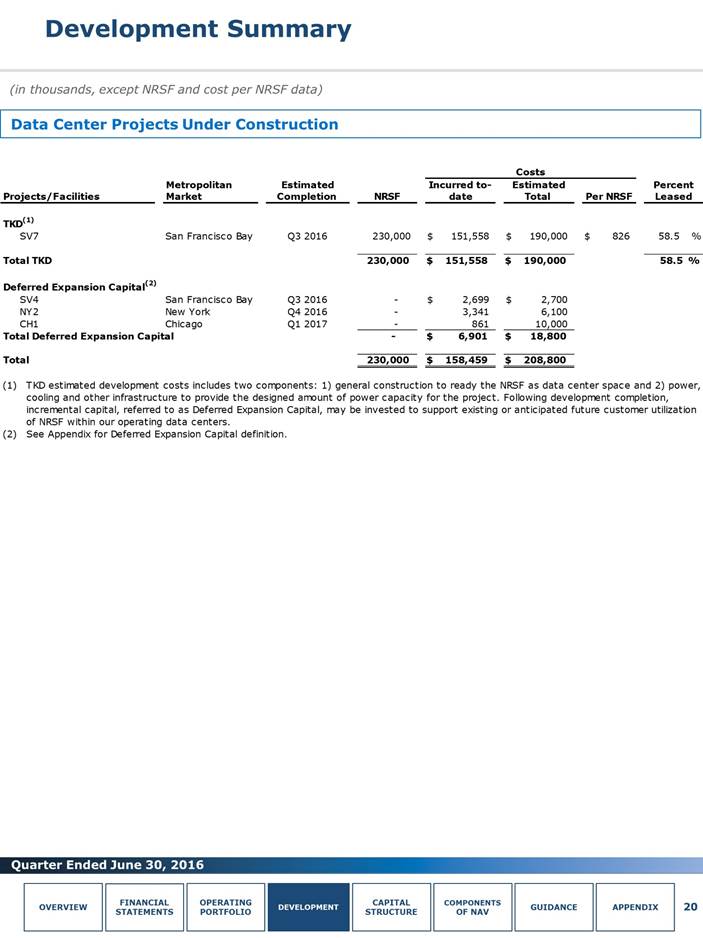
Development Summary (in thousands, except NRSF and cost per NRSF data) Data Center Projects Under Construction 20 OVERVIEW FINANCIAL STATEMENTS OPERATING PORTFOLIO DEVELOPMENT CAPITAL STRUCTURE Components of NAV GUIDANCE APPENDIX Costs Metropolitan Estimated Incurred to- Estimated Percent Projects/Facilities Market Completion NRSF date Total Per NRSF Leased TKD(1) SV7 San Francisco Bay Q3 2016 230,000 $ 151,558 $ 190,000 826 58.5 % Total TKD 230,000 $ 151,558 $ 190,000 58.5 % Deferred Expansion Capital(2) SV4 San Francisco Bay Q3 2016 - $ 2,699 $ 2,700 NY2 New York Q4 2016 - 3,341 6,100 CH1 Chicago Q1 2017 - 861 10,000 Total Deferred Expansion Capital - $ 6,901 $ 18,800 Total 230,000 $ 158,459 $ 208,800 (1) TKD estimated development costs includes two components: 1) general construction to ready the NRSF as data center space and 2) power, cooling and other infrastructure to provide the designed amount of power capacity for the project. Following development completion, incremental capital, referred to as Deferred Expansion Capital, may be invested to support existing or anticipated future customer utilization of NRSF within our operating data centers. (2) See Appendix for Deferred Expansion Capital definition.
Development Summary (in thousands, except NRSF and power data) Held for Development 21 OVERVIEW FINANCIAL STATEMENTS OPERATING PORTFOLIO DEVELOPMENT CAPITAL STRUCTURE Components of NAV GUIDANCE APPENDIX Held for Development Estimated Estimated Estimated Metropolitan Estimated Incremental Sellable Power Incremental Project / Building Market NRSF Costs (Megawatts) Cost per MW Incremental capacity in existing core and shell buildings(1) LA1 Los Angeles 10,352 $ 1,250 0.5 $ 2,500 LA2 Los Angeles 127,202 55,000 9.0 6,111 BO1 Boston 73,619 40,000 6.0 6,667 NY2 Phases 3-4 New York 87,297 57,000 8.5 6,706 NY2 Phase 5 New York 47,211 35,000 5.0 7,000 MI1 Miami 13,154 7,500 1.0 7,500 Total incremental capacity 358,835 $ 195,750 30.0 $ 6,525 Deferred Expansion Capital(2) - 25,000 Total(3) 358,835 $ 220,750 (1) Represents incremental data center capacity that may be constructed within existing facilities when the core and shell building have been developed and certain amounts of the existing space is not yet built out into data center space. (2) As we construct data center capacity, we work to optimize both the amount of the capital we deploy on power and cooling infrastructure and the timing of that capital deployment; as such, we generally construct our power and cooling infrastructure supporting our data center NRSF based on our estimate of customer utilization. This practice can result in our investment at a later time in Deferred Expansion Capital. We define Deferred Expansion Capital as our estimate of the incremental capital we may invest in the future to add power or cooling infrastructure to support existing or anticipated future customer utilization of NRSF within our operating data centers. From time to time, we may revise our estimate of Deferred Expansion Capital as well as the potential time period during which we may invest it. We estimate a range of $20 - $30 million of future capital investment. (3) In addition to new construction and incremental capacity in existing core and shell buildings, we have available acreage which represents entitled and unentitled land we own adjacent to our existing buildings, in the form of existing parking lots. By utilizing existing parking lots, we believe we can build approximately 100,000 NRSF and 200,000 NRSF buildings on our available acreage at NY2 and LA2, respectively.

Market Capitalization and Debt Summary (in thousands, except per share data) Market Capitalization Debt Maturities Debt Summary (1) 22 OVERVIEW FINANCIAL STATEMENTS OPERATING PORTFOLIO DEVELOPMENT CAPITAL STRUCTURE Components of NAV GUIDANCE APPENDIX Market Capitalization Shares or Market Price / Equivalents Liquidation Value as of Market Value Outstanding June 30, 2016 Equivalents Common shares 33,927 $88.69 $ 3,008,963 Operating partnership units 13,851 $88.69 1,228,476 Liquidation value of preferred stock 4,600 $25.00 115,000 Total equity 4,352,439 Total principal debt outstanding 500,000 Total enterprise value $ 4,852,439 Net principal debt to enterprise value 10.3% Net principal debt and preferred stock to enterprise value 12.6%

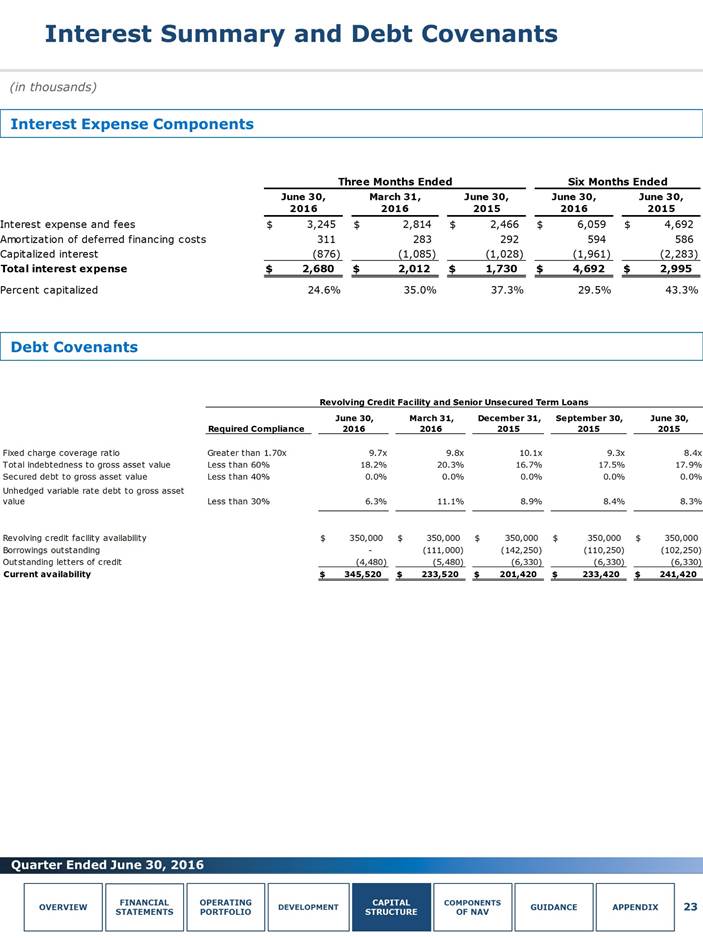
Interest Summary and Debt Covenants (in thousands) Interest Expense Components Debt Covenants 23 OVERVIEW FINANCIAL STATEMENTS OPERATING PORTFOLIO DEVELOPMENT CAPITAL STRUCTURE Components of NAV GUIDANCE APPENDIX GAAP Interest Calculation Three Months Ended Six Months Ended June 30, 2016 March 31, 2016 June 30, 2015 June 30, 2016 June 30, 2015 Interest expense and fees $ 3,245 $ 2,814 $ 2,466 $ 6,059 $ 4,692 Amortization of deferred financing costs 311 283 292 594 586 Capitalized interest (876) (1,085) (1,028) (1,961) (2,283) Total interest expense $ 2,680 $ 2,012 $ 1,730 $ 4,692 $ 2,995 Percent capitalized 24.6% 35.0% 37.3% 29.5% 43.3% 18.2% 6.3%
Components of Net Asset Value (NAV) (in thousands) 24 OVERVIEW FINANCIAL STATEMENTS OPERATING PORTFOLIO DEVELOPMENT CAPITAL STRUCTURE Components of NAV GUIDANCE APPENDIX Cash Net Operating Income Development Projects Other Assets and Liabilities Reconciliation of Net Operating Income (NOI) Q2 2016 Annualized Operating Income $ 22,558 $ 90,232 Adjustments: Depreciation and amortization 26,227 104,908 General and administrative (includes litigation) 8,818 35,272 Net Operating Income $ 57,603 $ 230,412 Cash Net Operating Income (Cash NOI) Net Operating Income $ 57,603 $ 230,412 Adjustments: Straight-line rent (1,002) (4,008) Amortization of above and below-market leases (143) (572) Cash NOI $ 56,458 $ 225,832 Cash NOI with backlog (85.0% leased)(1) $ 59,059 $ 236,236 Cash stabilized NOI (93% leased) $ 64,617 $ 258,468 Data Center Projects Under Construction TKD construction in progress(2) $ 151,558 Remaining spend(2) 38,442 Total $ 190,000 Targeted annual yields 12% - 16% Annualized pro forma NOI range $22,800 - $30,400 Deferred Expansion Capital in progress $ 6,901 Remaining spend(3) 11,899 Total $ 18,800 Other Assets Remaining construction in progress(4) $ 51,956 Cash and cash equivalents 2,243 Accounts and other receivables 13,802 Other tangible assets 24,579 Total other assets $ 92,580 Liabilities Debt Principal debt $ 500,000 Accounts payable, accrued and other liabilities 146,765 Accrued dividends and distributions 28,326 Preferred equity 115,000 Total liabilities $ 790,091 Weighted average common shares and units - diluted 47,675 (1) Cash NOI with backlog is adjusted to include one quarter of the cash backlog as of June 30, 2016, less any leasing of currently occupied NRSF and data center projects under development. (2) Does not include spend associated with leasing commissions. See page 20 for further breakdown of data center projects under construction. (3) Does not include spend associated with future Deferred Expansion Capital. (4) Represents the book value of in progress capital projects, including land and shell building, of future data center expansion, non-recurring investments, tenant improvements and recurring capital expenditures.

2016 Guidance (in thousands, except per share amounts) 25 OVERVIEW FINANCIAL STATEMENTS OPERATING PORTFOLIO DEVELOPMENT CAPITAL STRUCTURE Components of NAV GUIDANCE APPENDIX The annual guidance provided below represents forward-looking projections, which are based on current economic conditions, internal assumptions about our existing customer base and the supply and demand dynamics of the markets in which we operate. Please refer to the press release for additional information on forward-looking statements. Projected per share and OP unit information: 2016 Implied Low High Mid 2015 Growth(1) Net income attributable to common shares $ 1.41 $ 1.49 $ 1.45 $ 1.03 40.8% Real estate depreciation and amortization 2.15 2.15 2.15 1.83 FFO $ 3.56 $ 3.64 $ 3.60 $ 2.86 25.9% Projected operating results: Total operating revenues $ 292,500 $ 402,500 $ 397,500 $ 333,292 19.3% General and administrative expenses 35,000 37,000 36,000 34,179 5.3% Adjusted EBITDA 205,000 213,000 209,000 169,903 23.0% Guidance drivers: Annual rental churn rate 6.0% 8.0% 7.0% 7.5% Cash rent growth on data center renewals 3.0% 5.0% 4.0% 4.6% Capital expenditures: Data center expansion $ 225,000 $ 240,000 $ 232,500 $ 132,786 Non-recurring investments 15,000 20,000 17,500 9,971 Tenant improvements 5,000 10,000 7,500 8,037 Recurring capital expenditures 5,000 10,000 7,500 5,828 Total capital expenditures $ 250,000 $ 280,000 $ 265,000 $ 156,622 (1) Implied growth is based on the midpoint of 2016 guidance.

Appendix Definitions This document includes certain non-GAAP financial measures that management believes are helpful in understanding our business, as further described below. Our definition and calculation of non-GAAP financial measures may differ from those of other REITs and therefore may not be comparable. The non-GAAP measures should not be considered an alternative to net income as an indicator of our performance and should be considered only a supplement to net income, cash flows from operating, investing or financing activities as a measure of profitability and/or liquidity, computed in accordance with GAAP. Adjusted Funds From Operations “AFFO” is a non-GAAP measure that is used as a supplemental operating measure specifically for comparing year over year ability to fund dividend distribution from operating activities. We use AFFO as a basis to address our ability to fund our dividend payments. AFFO is calculated by adding to or subtracting from FFO: Plus: Amortization of deferred financing costs Plus: Non-cash compensation Plus: Non-real estate depreciation Plus: Impairment charges Plus: Below market debt amortization Less: Straight line rents adjustment Less: Amortization of above and below market leases Less: Recurring capital expenditures Less: Tenant improvements Less: Capitalized leasing costs Capitalized leasing costs consist of commissions payable to third parties, including brokers, leasing agents, referral agents, and internal sales commissions payable to employees. Capitalized leasing costs are accrued and deducted from AFFO generally in the period the lease is executed. Leasing costs are generally paid a) to third party brokers and internal sales employees 50% at customer lease signing and 50% at lease commencement and b) to referral and leasing agents monthly over the lease term as and to the extent we receive payment from the end customer. AFFO is not intended to represent cash flow from operations for the period, and is only intended to provide an additional measure of performance by adjusting the effect of certain items noted above included in FFO. Other REITs widely report AFFO, however, other REITs may use different methodologies for calculating AFFO and, accordingly, our AFFO may not be comparable to other REITs. Annualized Rent Monthly contractual rent under existing commenced customer leases as of quarter-end, multiplied by 12. This amount reflects total annualized base rent before any one-time or non-recurring rent abatements and excludes power revenue, interconnection revenue and operating expense reimbursement. 26 OVERVIEW FINANCIAL STATEMENTS OPERATING PORTFOLIO DEVELOPMENT CAPITAL STRUCTURE Components of NAV GUIDANCE APPENDIX

Appendix Data Center Leasing Metrics Rental Churn Rate – represents data center leases which are not renewed or are terminated during the period. Rental churn is calculated based on the annualized rent of data center expired leases terminated in the period, compared with total portfolio annualized rent at the beginning of the period. Cash and GAAP Rent Growth – represents the increase in rental rates on renewed data center leases signed during the period, as compared with the previous rental rates for the same space. Cash and GAAP rent growth is calculated based on annualized rent from the renewed data center license compared to annualized rent from the expired data center license. Data Center Net Rentable Square Feet (“NRSF”) Both occupied and available data center NRSF includes a factor based on management’s estimate of space to account for a customer’s proportionate share of required data center support space (such as the mechanical, telecommunications and utility rooms) and building common areas, which may be updated on a periodic basis to reflect the most current build-out of our properties. Deferred Expansion Capital As we construct data center capacity, we work to optimize both the amount of the capital we deploy on power and cooling infrastructure and the timing of that capital deployment; as such, we generally construct our power and cooling infrastructure supporting our data center NRSF based on our estimate of customer utilization. This practice can result in our investment at a later time in Deferred Expansion Capital. We define Deferred Expansion Capital as our estimate of the incremental capital we may invest in the future to add power or cooling infrastructure to support existing or anticipated future customer utilization of NRSF within our operating data centers. From time to time, we may revise our estimate of Deferred Expansion Capital as well as the potential time period during which we may invest it. See the Data Center Projects Under Construction and Held for Development tables on pages 20 and 21, respectively, for more detail. Earnings before Interest, Taxes, Depreciation and Amortization (EBITDA) and Adjusted EBITDA - EBITDA is defined as earnings before interest, taxes, depreciation and amortization. We calculate adjusted EBITDA by adding our non-cash compensation expense, transaction costs and litigation expense to EBITDA as well as adjusting for the impact of impairment charges, gains or losses from sales of property and undepreciated land and gains or losses on early extinguishment of debt. Management uses EBITDA and adjusted EBITDA as indicators of our ability to incur and service debt. In addition, we consider EBITDA and adjusted EBITDA to be appropriate supplemental measures of our performance because they eliminate depreciation and interest, which permits investors to view income from operations without the impact of non-cash depreciation or the cost of debt. However, because EBITDA and adjusted EBITDA are calculated before recurring cash charges including interest expense and taxes, and are not adjusted for capital expenditures or other recurring cash requirements of our business, their utilization as a cash flow measurement is limited. 27 OVERVIEW FINANCIAL STATEMENTS OPERATING PORTFOLIO DEVELOPMENT CAPITAL STRUCTURE Components of NAV GUIDANCE APPENDIX
Appendix Funds From Operations (“FFO”) is a supplemental measure of our performance which should be considered along with, but not as an alternative to, net income and cash provided by operating activities as a measure of operating performance and liquidity. We calculate FFO in accordance with the standards established by the National Association of Real Estate Investment Trusts (“NAREIT”). FFO represents net income (loss) (computed in accordance with GAAP), excluding gains (or losses) from sales of property and undepreciated land and impairment write-downs of depreciable real estate, plus real estate related depreciation and amortization (excluding amortization of deferred financing costs) and after adjustments for unconsolidated partnerships and joint ventures. FFO attributable to common shares and units represents FFO less preferred stock dividends declared during the period. Our management uses FFO as a supplemental performance measure because, in excluding real estate related depreciation and amortization and gains and losses from property dispositions, it provides a performance measure that, when compared year over year, captures trends in occupancy rates, rental rates and operating costs. We offer this measure because we recognize that investors use FFO as a basis to compare our operating performance with that of other REITs. However, the utility of FFO as a measure of our performance is limited because FFO excludes depreciation and amortization and captures neither the changes in the value of our properties that result from use or market conditions, nor the level of capital expenditures and capitalized leasing commissions necessary to maintain the operating performance of our properties, all of which have real economic effect and could materially impact our financial condition and results from operations. FFO is a non-GAAP measure and should not be considered a measure of liquidity, an alternative to net income, cash provided by operating activities or any other performance measure determined in accordance with GAAP, nor is it indicative of funds available to fund our cash needs, including our ability to pay dividends or make distributions. In addition, our calculations of FFO are not necessarily comparable to FFO as calculated by other REITs that do not use the same definition or implementation guidelines or interpret the standards differently from us. Investors in our securities should not rely on these measures as a substitute for any GAAP measure, including net income. Monthly Recurring Revenue per Cabinet Equivalent Represents the turn-key monthly recurring colocation revenue (“MRR”) per cabinet equivalent billed. We define MRR as recurring contractual revenue under existing commenced customer leases. MRR per cabinet equivalent is calculated as (current quarter MRR/3) divided by ((quarter-end cabinet equivalents billed plus prior quarter-end cabinet equivalents billed)/2). Cabinet equivalents are calculated as cage-usable square feet (turn-key leased NRSF/NRSF factor) divided by 25. 28 OVERVIEW FINANCIAL STATEMENTS OPERATING PORTFOLIO DEVELOPMENT CAPITAL STRUCTURE Components of NAV GUIDANCE APPENDIX

Appendix Net Operating Income (“NOI”) and Cash NOI – NOI, and cash NOI are supplemental measures for the operating performance of the company’s portfolio. NOI is operating revenues less operating expenses and adjusted for items such as depreciation and amortization, general and administrative expenses, transaction costs and litigation expenses. Cash NOI is NOI less straight-line rents and above and below market rent amortization. NRSF Held for Development Represents incremental data center capacity that may be constructed in existing facilities that requires significant capital investment in order to develop new data center facilities. The data represents management's best estimate of incremental costs based on estimated NRSF and power design and are subject to market conditions and build-out specifications and may vary. NRSF Under Construction Represents NRSF for which substantial activities are ongoing to prepare the property for its intended use following development. The NRSF reflects managements estimate of engineering drawings and required support space and is subject to change based on final demising of space. Estimated costs of completion are based on actual costs at quarter-end and management’s estimate of remaining projects costs. Turn-Key Same Store Includes turn-key data center space that was leased or available to be leased to our colocation customers as of December 31, 2014, at each of our properties, and excludes powered shell data center space, SV3 data center space, office and light-industrial space and space for which development was completed and became available to be leased after December 31, 2014. The turn-key same store space as of December 31, 2014, is 1,149,119 NRSF. We track same store on a computer room basis within each data center facility. Stabilized and Pre-Stabilized NRSF Data center projects and facilities that recently have been developed and are in the initial lease-up phase are classified as pre-stabilized NRSF until they reach 85% occupancy or have been in service for 24 months. Pre-stabilized projects and facilities become stabilized operating properties at the earlier of achievement of 85% occupancy or 24 months after development completion and are included in the stabilized operating NRSF. 29 OVERVIEW FINANCIAL STATEMENTS OPERATING PORTFOLIO DEVELOPMENT CAPITAL STRUCTURE Components of NAV GUIDANCE APPENDIX
