Attached files
| file | filename |
|---|---|
| EX-99.1 - EXHIBIT 99.1 - CURTISS WRIGHT CORP | a51390072ex99_1.htm |
| 8-K - CURTISS-WRIGHT CORPORATION 8-K - CURTISS WRIGHT CORP | a51390072.htm |
Exhibit 99.2

2Q 2016 Earnings Conference CallJuly 28, 2016 NYSE: CW
Safe Harbor Statement Please note that the information provided in this presentation is accurate as of the date of the original presentation. The presentation will remain posted on this website from one to twelve months following the initial presentation, but content will not be updated to reflect new information that may become available after the original presentation posting. The presentation contains forward-looking statements including, among other things, management's estimates of future performance, revenue and earnings, our management's growth objectives and our management's ability to produce consistent operating improvements. These forward-looking statements are based on expectations as of the time the statements were made only, and are subject to a number of risks and uncertainties which could cause us to fail to achieve our then-current financial projections and other expectations. This presentation also includes certain non-GAAP financial measures with reconciliations being made available in the earnings release that is posted to our website and furnished with the SEC. We undertake no duty to update this information. More information about potential factors that could affect our business and financial results is included in our filings with the Securities and Exchange Commission, including our Annual Reports on Form 10-K and Quarterly Reports on Form 10-Q, including, among other sections, under the captions, "Risk Factors" and "Management's Discussion and Analysis of Financial Condition and Results of Operations," which is on file with the SEC and available at the SEC's website at www.sec.gov.
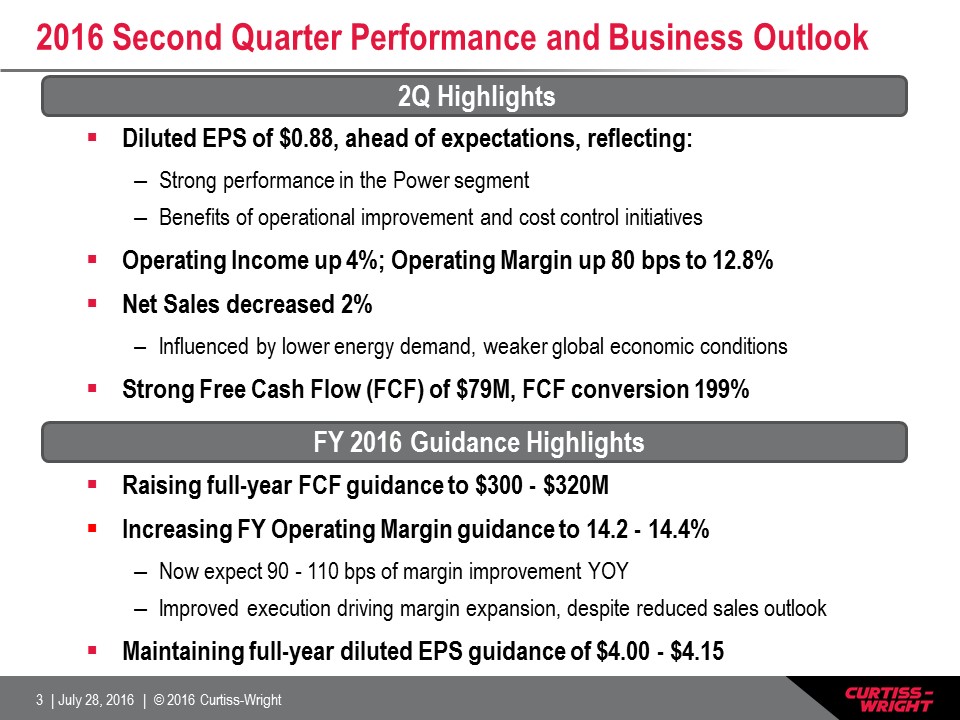
2016 Second Quarter Performance and Business Outlook Diluted EPS of $0.88, ahead of expectations, reflecting:Strong performance in the Power segmentBenefits of operational improvement and cost control initiatives Operating Income up 4%; Operating Margin up 80 bps to 12.8% Net Sales decreased 2%Influenced by lower energy demand, weaker global economic conditionsStrong Free Cash Flow (FCF) of $79M, FCF conversion 199% 2Q Highlights FY 2016 Guidance Highlights Raising full-year FCF guidance to $300 - $320MIncreasing FY Operating Margin guidance to 14.2 - 14.4%Now expect 90 - 110 bps of margin improvement YOYImproved execution driving margin expansion, despite reduced sales outlookMaintaining full-year diluted EPS guidance of $4.00 - $4.15
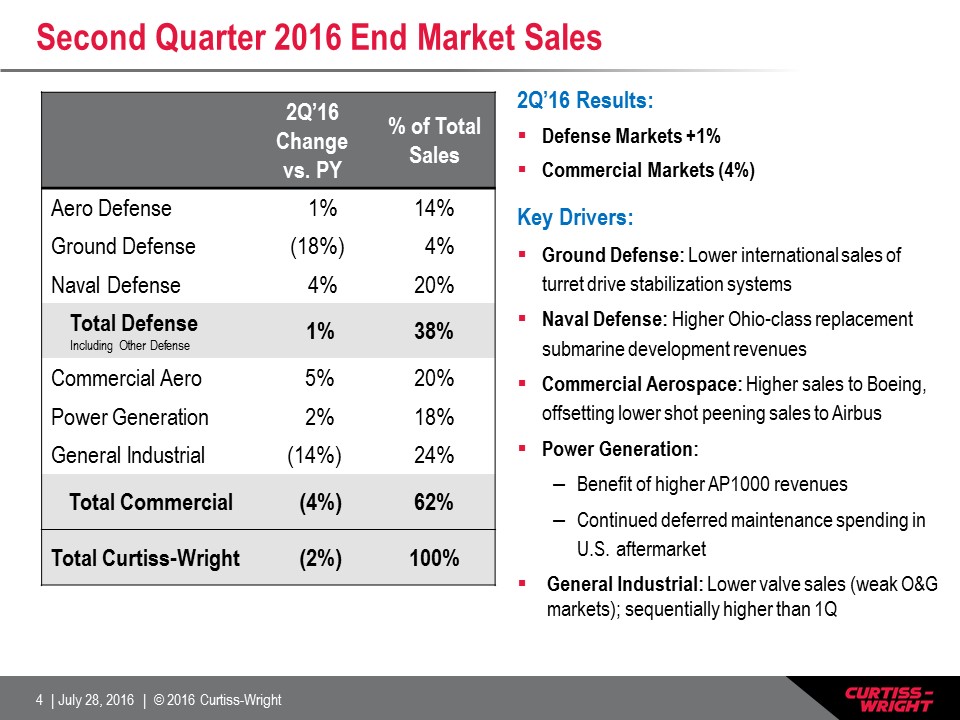
Second Quarter 2016 End Market Sales 2Q’16 Results:Defense Markets +1%Commercial Markets (4%)Key Drivers:Ground Defense: Lower international sales of turret drive stabilization systems Naval Defense: Higher Ohio-class replacement submarine development revenuesCommercial Aerospace: Higher sales to Boeing, offsetting lower shot peening sales to AirbusPower Generation:Benefit of higher AP1000 revenues Continued deferred maintenance spending in U.S. aftermarket General Industrial: Lower valve sales (weak O&G markets); sequentially higher than 1Q 2Q’16 Change vs. PY % of Total Sales Aero Defense 1% 14% Ground Defense (18%) 4% Naval Defense 4% 20% Total DefenseIncluding Other Defense 1% 38% Commercial Aero 5% 20% Power Generation 2% 18% General Industrial (14%) 24% Total Commercial (4%) 62% Total Curtiss-Wright (2%) 100%
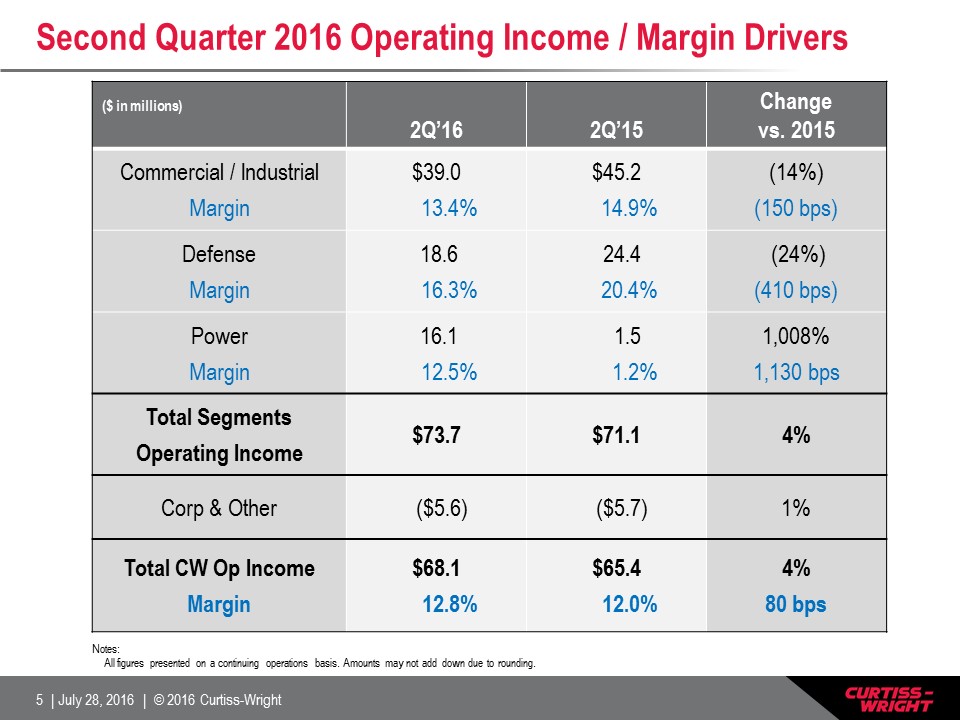
Second Quarter 2016 Operating Income / Margin Drivers ($ in millions) 2Q’16 2Q’15 Change vs. 2015 Commercial / IndustrialMargin $39.0 13.4% $45.2 14.9% (14%)(150 bps) DefenseMargin 18.6 16.3% 24.4 20.4% (24%)(410 bps) PowerMargin 16.1 12.5% 1.5 1.2% 1,008%1,130 bps Total SegmentsOperating Income $73.7 $71.1 4% Corp & Other ($5.6) ($5.7) 1% Total CW Op IncomeMargin $68.1 12.8% $65.4 12.0% 4%80 bps Notes: All figures presented on a continuing operations basis. Amounts may not add down due to rounding.
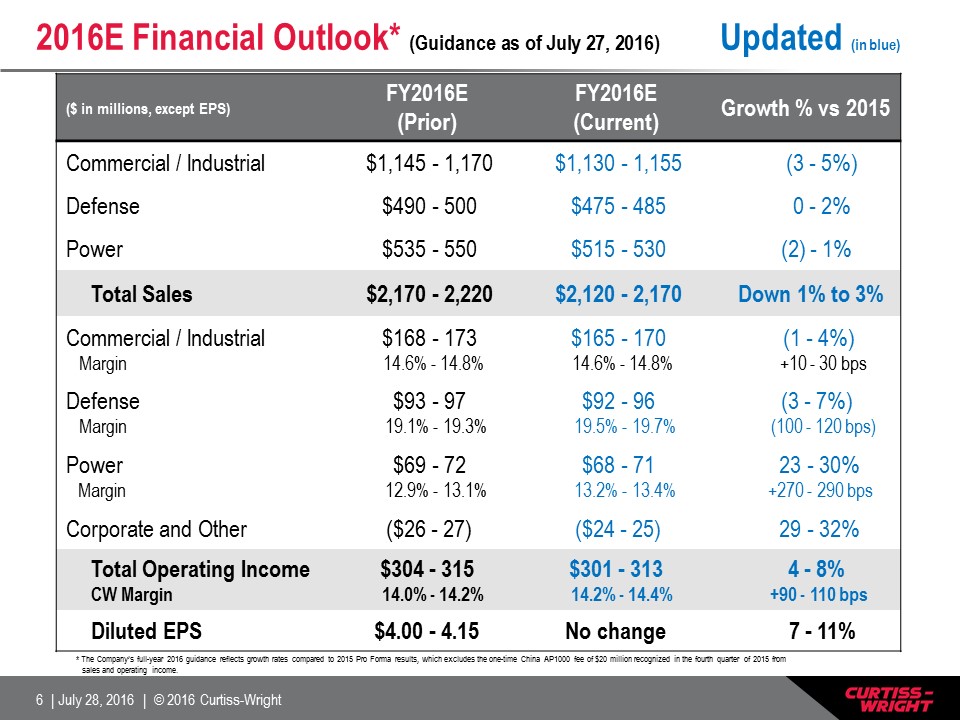
($ in millions, except EPS) FY2016E(Prior) FY2016E(Current) Growth % vs 2015 Commercial / Industrial $1,145 - 1,170 $1,130 - 1,155 (3 - 5%) Defense $490 - 500 $475 - 485 0 - 2% Power $535 - 550 $515 - 530 (2) - 1% Total Sales $2,170 - 2,220 $2,120 - 2,170 Down 1% to 3% Commercial / IndustrialMargin $168 - 173 14.6% - 14.8% $165 - 170 14.6% - 14.8% (1 - 4%) +10 - 30 bps DefenseMargin $93 - 97 19.1% - 19.3% $92 - 96 19.5% - 19.7% (3 - 7%) (100 - 120 bps) PowerMargin $69 - 72 12.9% - 13.1% $68 - 71 13.2% - 13.4% 23 - 30% +270 - 290 bps Corporate and Other ($26 - 27) ($24 - 25) 29 - 32% Total Operating IncomeCW Margin $304 - 315 14.0% - 14.2% $301 - 313 14.2% - 14.4% 4 - 8% +90 - 110 bps Diluted EPS $4.00 - 4.15 No change 7 - 11% 2016E Financial Outlook* (Guidance as of July 27, 2016) Updated (in blue) * The Company’s full-year 2016 guidance reflects growth rates compared to 2015 Pro Forma results, which excludes the one-time China AP1000 fee of $20 million recognized in the fourth quarter of 2015 from sales and operating income.
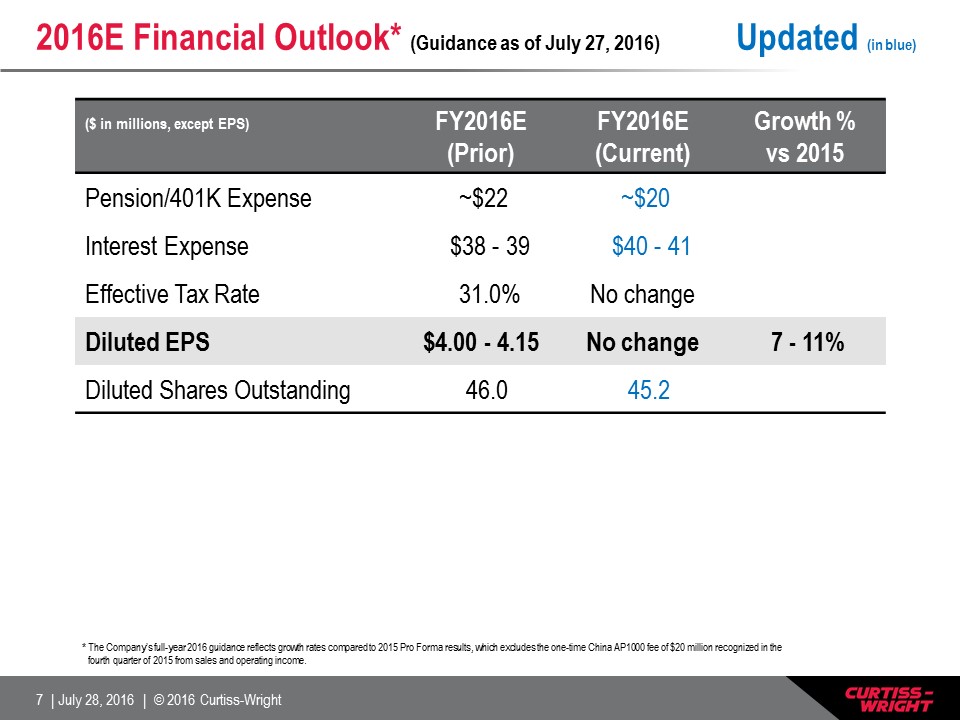
($ in millions, except EPS) FY2016E(Prior) FY2016E(Current) Growth %vs 2015 Pension/401K Expense ~$22 ~$20 Interest Expense $38 - 39 $40 - 41 Effective Tax Rate 31.0% No change Diluted EPS $4.00 - 4.15 No change 7 - 11% Diluted Shares Outstanding 46.0 45.2 2016E Financial Outlook* (Guidance as of July 27, 2016) Updated (in blue) * The Company’s full-year 2016 guidance reflects growth rates compared to 2015 Pro Forma results, which excludes the one-time China AP1000 fee of $20 million recognized in the fourth quarter of 2015 from sales and operating income.
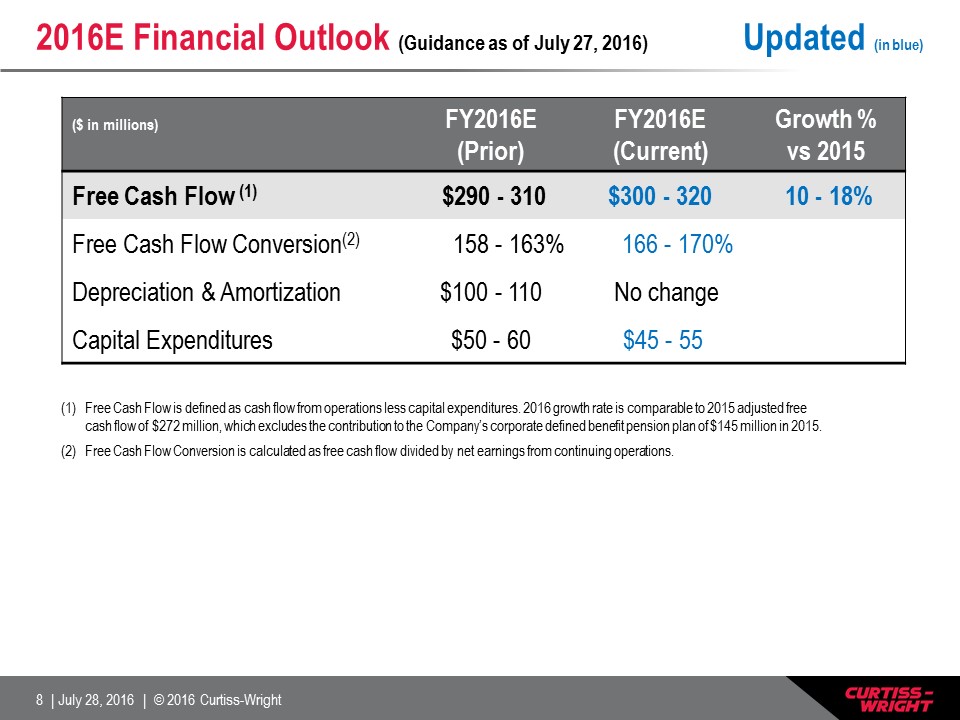
2016E Financial Outlook (Guidance as of July 27, 2016) Updated (in blue) ($ in millions) FY2016E(Prior) FY2016E(Current) Growth %vs 2015 Free Cash Flow (1) $290 - 310 $300 - 320 10 - 18% Free Cash Flow Conversion(2) 158 - 163% 166 - 170% Depreciation & Amortization $100 - 110 No change Capital Expenditures $50 - 60 $45 - 55 Free Cash Flow is defined as cash flow from operations less capital expenditures. 2016 growth rate is comparable to 2015 adjusted free cash flow of $272 million, which excludes the contribution to the Company’s corporate defined benefit pension plan of $145 million in 2015.Free Cash Flow Conversion is calculated as free cash flow divided by net earnings from continuing operations.
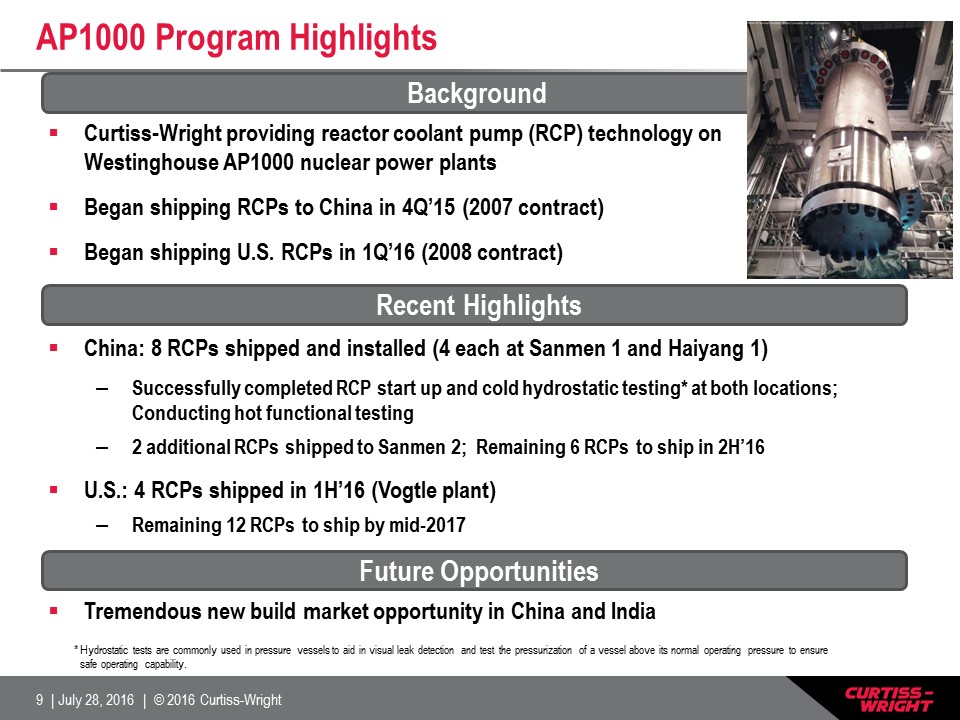
AP1000 Program Highlights Curtiss-Wright providing reactor coolant pump (RCP) technology on Westinghouse AP1000 nuclear power plantsBegan shipping RCPs to China in 4Q’15 (2007 contract)Began shipping U.S. RCPs in 1Q’16 (2008 contract) * Hydrostatic tests are commonly used in pressure vessels to aid in visual leak detection and test the pressurization of a vessel above its normal operating pressure to ensure safe operating capability. Background Recent Highlights Future Opportunities Tremendous new build market opportunity in China and India China: 8 RCPs shipped and installed (4 each at Sanmen 1 and Haiyang 1)Successfully completed RCP start up and cold hydrostatic testing* at both locations; Conducting hot functional testing2 additional RCPs shipped to Sanmen 2; Remaining 6 RCPs to ship in 2H’16U.S.: 4 RCPs shipped in 1H’16 (Vogtle plant)Remaining 12 RCPs to ship by mid-2017
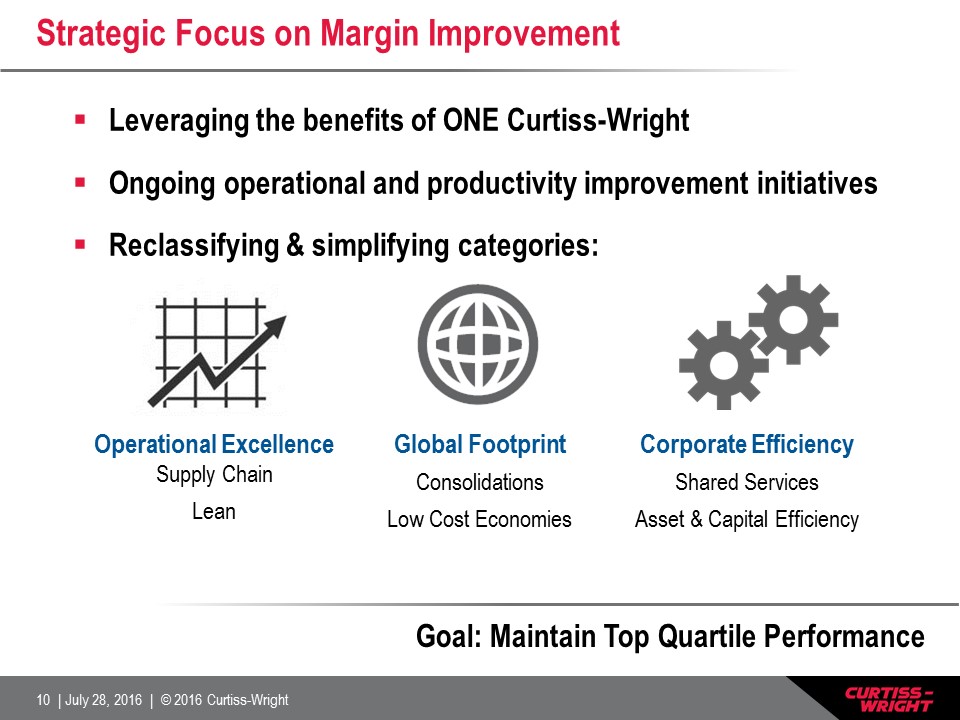
Strategic Focus on Margin Improvement Goal: Maintain Top Quartile Performance Leveraging the benefits of ONE Curtiss-WrightOngoing operational and productivity improvement initiativesReclassifying & simplifying categories: Operational Excellence Supply ChainLean Global Footprint ConsolidationsLow Cost Economies Corporate Efficiency Shared ServicesAsset & Capital Efficiency
Positioned to Deliver Strong 2016 Results Remain on track for continued operating margin expansion, up 90 - 110 bps to 14.2 - 14.4%* Mitigating impact of reduced sales outlookBenefit of operational improvement and cost control initiativesGoal to remain in Top Quartile vs peersSolid growth in diluted EPS, up 7 - 11%*Strong free cash flow expectations (>$300 million) driven by AP1000 and improved working capital managementCommitted to a balanced capital allocation strategy * The Company’s full-year 2016 guidance reflects growth rates compared to 2015 Pro Forma results, which excludes the one-time China AP1000 fee of $20 million recognized in the fourth quarter of 2015 from sales and operating income.
Appendix
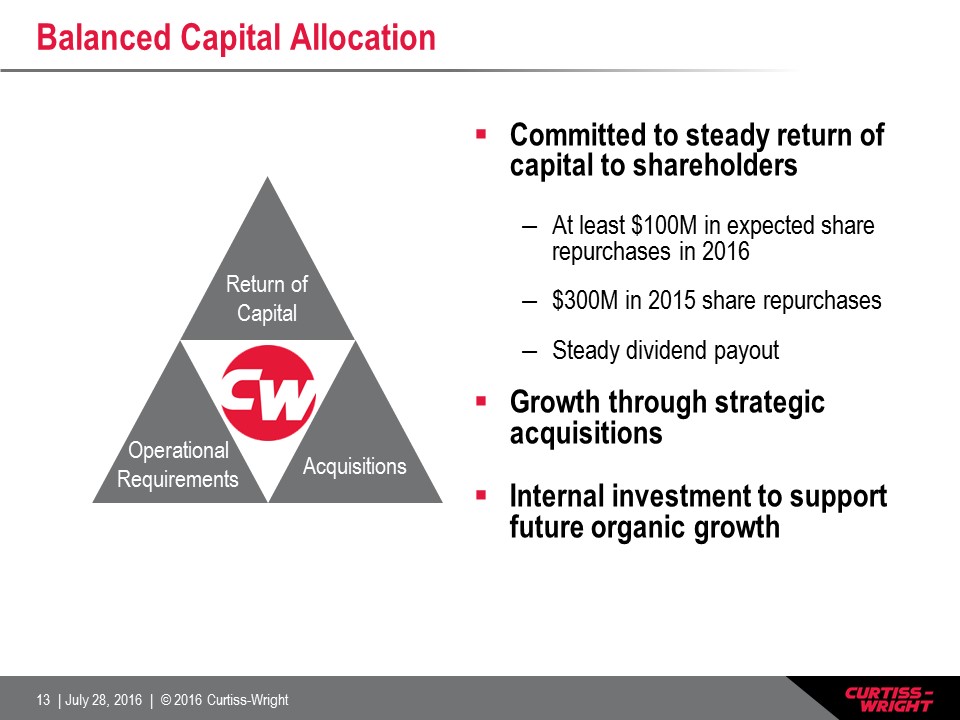
Balanced Capital Allocation Return of Capital Operational Requirements Acquisitions Committed to steady return of capital to shareholdersAt least $100M in expected share repurchases in 2016$300M in 2015 share repurchasesSteady dividend payoutGrowth through strategic acquisitions Internal investment to support future organic growth
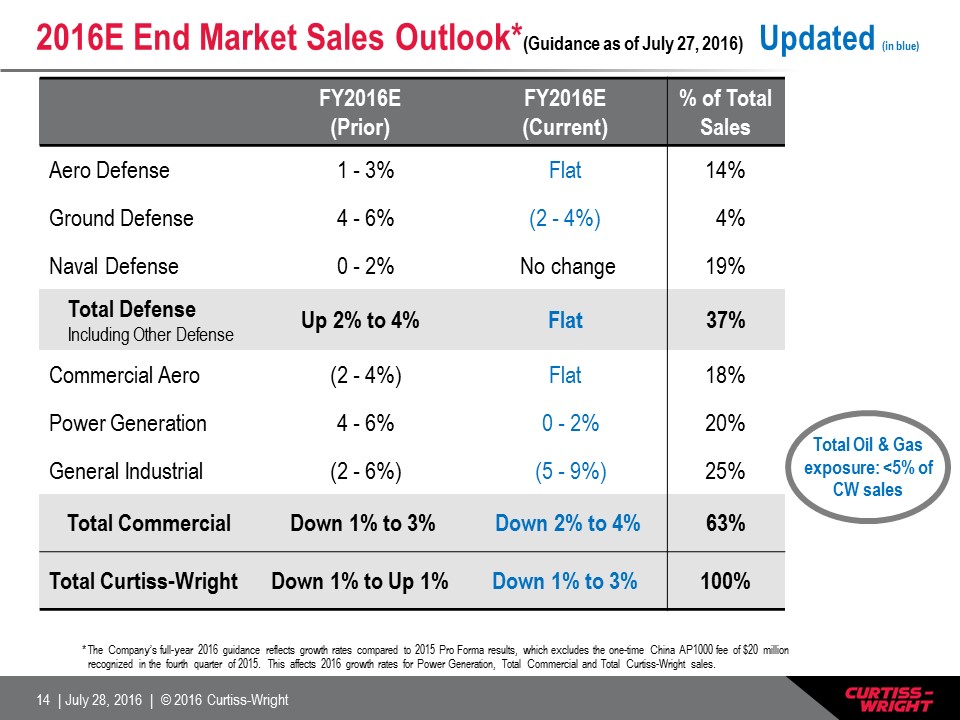
2016E End Market Sales Outlook*(Guidance as of July 27, 2016) Updated (in blue) FY2016E(Prior) FY2016E(Current) % of Total Sales Aero Defense 1 - 3% Flat 14% Ground Defense 4 - 6% (2 - 4%) 4% Naval Defense 0 - 2% No change 19% Total DefenseIncluding Other Defense Up 2% to 4% Flat 37% Commercial Aero (2 - 4%) Flat 18% Power Generation 4 - 6% 0 - 2% 20% General Industrial (2 - 6%) (5 - 9%) 25% Total Commercial Down 1% to 3% Down 2% to 4% 63% Total Curtiss-Wright Down 1% to Up 1% Down 1% to 3% 100% * The Company’s full-year 2016 guidance reflects growth rates compared to 2015 Pro Forma results, which excludes the one-time China AP1000 fee of $20 million recognized in the fourth quarter of 2015. This affects 2016 growth rates for Power Generation, Total Commercial and Total Curtiss-Wright sales. Total Oil & Gas exposure: <5% of CW sales
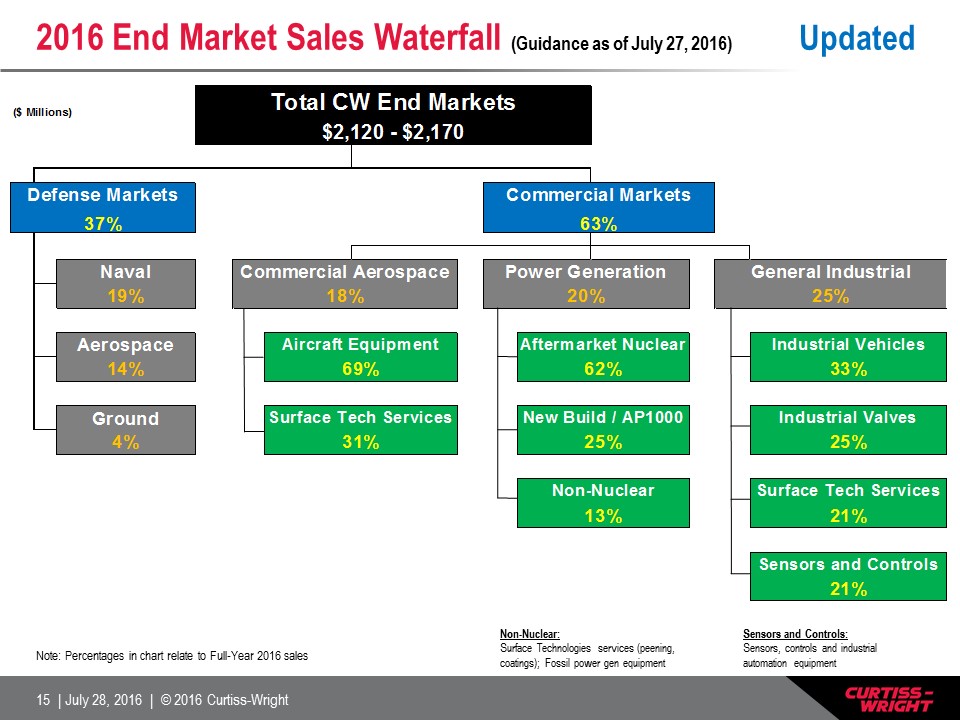
2016 End Market Sales Waterfall (Guidance as of July 27, 2016) Updated Sensors and Controls:Sensors, controls and industrial automation equipment Non-Nuclear:Surface Technologies services (peening, coatings); Fossil power gen equipment Note: Percentages in chart relate to Full-Year 2016 sales
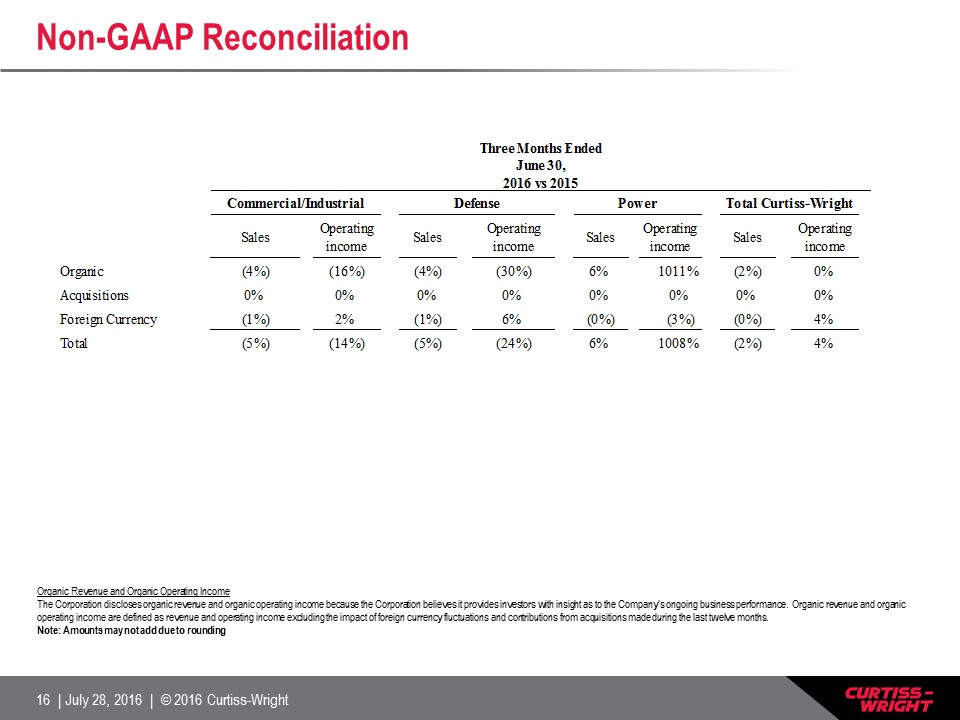
Non-GAAP Reconciliation Organic Revenue and Organic Operating Income The Corporation discloses organic revenue and organic operating income because the Corporation believes it provides investors with insight as to the Company’s ongoing business performance. Organic revenue and organic operating income are defined as revenue and operating income excluding the impact of foreign currency fluctuations and contributions from acquisitions made during the last twelve months. Note: Amounts may not add due to rounding