Attached files
| file | filename |
|---|---|
| EX-99.1 - PRESS RELEASE - CIT GROUP INC | e70574ex99-1.htm |
| 8-K - CURRENT REPORT - CIT GROUP INC | e70574_8k.htm |
Exhibit 99.2

Second Quarter 2016 Financial Results July 28, 2016
1 Important Notices This presentation contains forward - looking statements within the meaning of applicable federal securities laws that are based upon our current expectations and assumptions concerning future events, which are subject to a number of risks and uncertainties that could cause actual results to differ materially from those anticipated . The words “expect,” “anticipate,” “estimate,” “forecast,” “initiative,” “objective,” “plan,” “goal,” “project,” “outlook,” “priorities,” “target,” “intend,” “evaluate,” “pursue,” “commence,” “seek,” “may,” “would,” “could,” “should,” “believe,” “potential,” and “continue,” or the negative of any of those words or similar expressions are intended to identify forward - looking statements . All statements contained in this presentation, other than statements of historical fact, including without limitation, statements about our plans, strategies, prospects and expectations regarding future events and our financial performance, are forward - looking statements that involve certain risks and uncertainties . While these statements represent our current judgment on what the future may hold, and we believe these judgments are reasonable, these statements are not guarantees of any events or financial results, and our actual results may differ materially . Important factors that could cause our actual results to be materially different from our expectations include, among others, the risk that CIT is unsuccessful in implementing its strategy and business plan, the risk that CIT is unable to react to and address key business and regulatory issues, the risk that CIT is unable to achieve the projected revenue growth from its new business initiatives or the projected expense reductions from efficiency improvements, and the risk that CIT becomes subject to liquidity constraints and higher funding costs . We describe these and other risks that could affect our results in Item 1 A, “Risk Factors,” of our latest Annual Report on Form 10 - K for the year ended December 31 , 2015 , which was filed with the Securities and Exchange Commission . Accordingly, you should not place undue reliance on the forward - looking statements contained in this presentation . These forward - looking statements speak only as of the date on which the statements were made . CIT undertakes no obligation to update publicly or otherwise revise any forward - looking statements, except where expressly required by law . This presentation is to be used solely as part of CIT management’s continuing investor communications program . This presentation shall not constitute an offer or solicitation in connection with any securities . | 2Q16 Earnings

2 Executing on Our 2016 Priorities 1 Focus on Our Core Businesses 3 Maintain Strong Risk Management | 2Q16 Earnings 2 Improve Profitability and Return Capital (1) Commercial allowance for loan losses plus principal loss discount as % of commercial finance receivables (before the prin cip al loss discount). (2) Reflects the purchase accounting discount for loans acquired from OneWest Bank and the allowance for loan losses. ▪ Announced sale of Canada Equipment and Corporate Finance business ▪ China business exit progressing ▪ Filed initial Form 10 Registration Statement for C2 Aviation Capital and progressed to second round of bidding in conjunction with dual track process for separation of Commercial A ir ▪ Transferred remaining ~$100 million of Business Air portfolio into assets held for sale (AHFS) ▪ Expect to complete 30% of $125 million annual expense save target by year - end ▪ Deposits represent approximately 65% of total funding; deposit costs remained stable ▪ Grew Commercial Banking deposits by 12% from first quarter ▪ Commercial credit reserve (1) 1.8% of finance receivables ▪ Non - accruals 0.9% of finance receivables ▪ 10.5% coverage (2) on energy loans ▪ Common Equity Tier 1 ratio 13.4% up ~ 3 0 bps

3 Key Performance Metrics (1) As % of average earnings assets . (2) Operating expenses exclusive of restructuring costs and intangible assets amortization. (3) Total operating expenses exclusive of restructuring charges and amortization of intangibles divided by total revenue (net finance margin and other income). (4) Capital ratios are preliminary as of 6/30/16 and based on fully phased - in Basel III estimates. (5) Return on average tangible common equity is adjusted to remove the impact of intangible amortization, goodwill impairment and th e impact from valuation allowance reversals from income from continuing operations, while the average tangible common equity is reduced for disallowed deferred tax assets. See Appendix page 20 for calculation . (6) Includes impact of $163 million after tax charge related to the Financial Freedom interest curtailment reserve. 1Q16 2Q16 2016 Outlook Commentary Post Air Separation 2018 Target Net Finance Margin (1) 3.7% 3.7% ▪ Expect to trend towards 3.5% 3.0 – 3.5% Credit provision (1) 0.7% 0.2% ▪ Expect to be in the high end of the range with variability 0.25 – 0.50% Other income (1) 0.7% 0.7% ▪ Continued impact from strategic initiatives 0.6 – 0.75% Operating Expenses (1)(2) 2.2% 2.2% ▪ Implementation of $125 million cost reduction program progressing ▪ Benefits of cost reduction plan expected to be offset by strategic initiative costs 1.9 – 2.2% Net Efficiency Ratio (3) 49.2% 49.8% Low 50s Tax Rate 26% 34% ▪ Low 30% range excluding discrete items <40% CET1 Ratio (4) 13.1% 13.4% - 10 – 11% Adjusted ROATCE (5) 7.1% 8.3% / 0.6% (6) - 10% | 2Q16 Earnings

4 (1) Includes U.S . VA reversal impact of $647 million, $3.37 diluted EPS in 3Q15. (2) Average earning assets (AEA) components include interest earning cash, investments, securities and indemnification assets, loans and operating lease equip men t. (3) Excluding transaction costs, 3Q15 net efficiency ratio of 57.6%. Total o perating e xpenses exclusive of r estructuring charges and amortization of intangibles divided by total revenue (Net finance margin and other income). (4) Average finance receivables (AFR) is computed using month - end balances and is the average of finance receivables which inclu des loans, direct finance lease and leverage lease receivables and factoring receivables. It excludes operating lease equipment. (5 ) Beginning in 3Q15 , the ratio is calculated to include the impact of the principal loss discount associated with acquired OneWest receivables and is ALL plus principal loss discount on Commercial loans divided by Commercial Finance Receivables before the impact of the principal loss discount. (6) Capital ratios are preliminary as of 6/30/16 and based on fully phased - in Basel III estimates. At or For the Period Ended 2Q16 1Q16 4Q15 3Q15 2Q15 EPS (Diluted) – Total (1) $0.07 $0.73 $0.72 $3.61 $0.66 EPS (Diluted) – Continuing Ops. (1) $0.90 $0.75 $0.75 $3.63 $0.66 EPS (Diluted) impact from VA Reversal - - - $3.37 - Book Value Per Share $55.07 $55.16 $54.61 $53.74 $50.91 Tangible Book Value Per Share (TBVPS) $48.45 $48.39 $47.77 $47.09 $47.51 Pre - tax r eturn on Average Earning Assets (ROAEA) – Continuing Ops. (2) 1.86% 1.38% 0.95% 1.04% 1.49% After - tax r eturn on Average Earning Assets (ROAEA) – Continuing Ops. (2) 1.22% 1.02% 0.98% 5.29% 1.12% Net Finance Margin – Continuing Ops. 3.65% 3.74% 3.57% 3.67% 3.33% Net Efficiency Ratio – Continuing Ops. (3) 49.8% 49.2% 53.3% 62.2% 57.4% Adjusted ROATCE – Continuing Ops. 8.3% 7.1% 7.1% 2.6% 5.9% Net Charge - offs (% of AFR (4) ) 0.53% 0.65% 0.40% 0.86% 0.48% A llowance for loan losses as % of Finance Receivables for Commercial assets (5) 1.83% 1.87% 1.79% 1.82% 1.79% CET1 Ratio/Tier 1 Capital Ratio (6) 13.4% 13.1% 12.7% 12.5% 14.4% Total Capital Ratio (6) 14.1% 13.8% 13.2% 13.0% 15.1% Performance Highlights & Trends | 2Q16 Earnings

5 ($ Millions, except per share data) Noteworthy Items in 2Q16 Items in 2Q16 Results Continuing Operations Reported Diluted EPS (Continuing) $0.90 Impact Segment Item Line Item Total Pre - tax After tax Per share Corporate Restructuring Operating Expenses ($10) ($6) ($0.03) Transportation Finance Business Air Goodwill Impairment Other Income ($4) ($3) ($0.01) EPS based on 202.3 million average diluted shares outstanding, $ impacts are rounded. | 2Q16 Earnings (1) Currency translation adjustment. Discontinued Operations Reported Diluted EPS (Total) $0.07 Impact Item Total Pre - tax After tax Per share Financial Freedom Interest Curtailment Reserve ($230) ($163) ($0.80)

6 Financing & Leasing Assets (FLA) Highlights 15.4 22.3 21.6 22.0 21.5 18.3 18.7 20.0 19.9 20.0 7.3 7.2 7.2 7.2 2.1 1.8 1.6 1.2 1.1 0 20 40 60 2Q15 3Q15 4Q15 1Q16 2Q16 ($ Billions) | 2Q16 Earnings ▪ Total FLA decreased as asset sales and run - off were partially offset by new originations ▪ Commercial Banking: Decreased 2%, primarily driven by Commercial Finance prepayments and asset sales ▪ Transportation Finance: Transferred remaining Business A ir portfolio of ~$100 million into AHFS ▪ Consumer and Community Banking: Legacy Consumer Mortgages annualized run - off of 12% in the quarter was partially offset by growth in other consumer banking originations Consumer and Community Banking Transportation Finance Commercial Banking Non - Strategic Portfolios $35.8 $50.1 $50.4 $50.3 $49.7 Total Reported

7 ▪ Net Finance Revenue reflects increase in earning assets from OneWest acquisition in 3Q 2015 ▪ Other items primarily include purchase accounting accretion based on unpaid principal balance of the loans (vs. OneWest’s carrying value) ▪ Decrease in Net Finance Margin from prior quarter primarily reflects: - ~10 bps reduction from higher operating lease maintenance/expense in both Air & Rail and lower Rail rents - ~10 bps reduction from loan mix primarily due to run - off in NSP and Consumer and Community Banking segments + ~5 bps benefit from interest recoveries & prepayments in Commercial Banking + ~5 bps benefit from other items 335 421 447 482 458 3.33% 3.67% 3.57% 3.74% 3.65% 2Q15 3Q15 4Q15 1Q16 2Q16 Net Finance Revenue less other items Other Items NFM Net Finance Margin Trends – (Continuing Operations) ($ Millions) Yield Analysis (2) 2Q16 1Q16 2Q15 bps 1Q16 bps 2Q15 Interest bearing deposits and investments 1.24% 1.23% 0.51% 0.01 0.73 Loans 5.96 5.84 5.83 0.12 0.13 Operating leases (net) 7.75 8.23 8.49 (0.48) (0.74) Indemnification assets (9.06) (3.09) - (6.13) (9.22) Earning assets 5.56 5.67 5.91 (0.11) (0.35) Deposits 1.26 1.25 1.71 0.01 (0.45) Borrowings 4.10 4.11 4.70 (0.01) (0.60) Interest - bearing liabilities 2.28 2.29 3.19 (0.01) (0.91) Net Finance Revenue & Net Finance Margin 343 482 528 553 (1) Other items include suspended depreciation, interest recoveries/prepayments and other loan and debt FSA. 2Q16, 1Q16, 4Q15 , 3 Q15 and 2Q15 other items also includes purchase accounting accretion. (2) More detail is available in the average balance sheet within the second quarter 2016 press release. (1) Highlights | 2Q16 Earnings 541

8 27 31 29 26 24 25 30 35 33 28 22 31 17 11 28 (10) (52) (50) 31 24 -55 -30 -5 20 45 70 95 120 145 Other Income Trends – Components (Continuing Operations) Factoring commissions Fee revenues Gains on sales of leasing equipment All other income ($ Millions) 2 Q15 4 Q15 1Q 16 2Q16 3 Q15 Total Reported ▪ Lower factoring commissions primarily driven by lower volume ▪ Higher gains on sales of leasing equipment primarily driven by railcar sales mostly offset by impairments in all other income ▪ All other income primarily reflects: ▪ TRS mark - to - market benefit of $9 million ▪ Mortgage Backed Securities mark - to - market benefit of $5 million ▪ Business Air goodwill impairment charge of $4 million Highlights $64 $39 $30 $101 $104 | 2Q16 Earnings

9 Asset Quality Trends – (Continuing Operations) ($ Millions) 198 215 268 295 283 0.5% 0.9% 0.4% 0.7% 0.5% 2Q15 3Q15 4Q15 1Q16 2Q16 Non-accrual Loans Net Charge-offs % to AFR 351 334 350 390 379 1.8% 1.3% 1.4% 1.6% 1.6% 1.8% 1.8% 1.8% 1.9% 1.8% 2Q15 3Q15 4Q15 1Q16 2Q16 Princ. Loss Disc Allowance for Loan Losses (ALL) ALL % to FR ALL + Princ Loss Disc. % to FR before principle loss discount (1) (1) 2Q16, 1Q16, 4Q15, 3Q15, and 2Q15, included approximately $25 million, $9 million, $19 million, $40 million, and $2 million respectively, of charge - offs related to the transfer of loans to held for sale; exclusive of these charge - offs, net charge - offs as a % to AFR would have been 20 bps, 53 bps, 16 bps, 17 bps, and 44 bps respectively. (2) Reflects the purchase accounting discount for loans acquired from OneWest Bank and the allowance for loan losses. Non - accrual Loans & Net Charge - offs Allowance for Loan Losses - Commercial ▪ N on - accrual balances decreased from the prior quarter as charge - offs and asset sales generally offset new non - accruals ▪ If current market conditions persist, CIT could experience an additional ~$75 million in energy related non - accruals over the remainder of 2016 ▪ Resulting in an incremental provision of ~$15 - $25 million ▪ Allowance for loan losses decreased primarily due to energy related charge - offs and a reduction in overall loans partially offset by an increase in the reserve for Maritime Finance ▪ The reduction in Net Charge - Offs reflected lower energy charge - offs, the prior quarter included two discrete charge - offs related to Aerospace loans ▪ ALL as a % of finance receivables on commercial loans remained flat at 1.6% ▪ Including the principal loss discount, ALL as a % of finance receivables is 1.8% ▪ 10.5% coverage (2) on energy loans – see page 16 for more detail Highlights | 2Q16 Earnings Non - accrual Loans % of FR 1.0% 0.7% 0.9% 0.9% 0.9%

10 310 312 305 15 10 17 4Q15 Normalized 1Q16 Comp & Benefits Elevated REO expenses OWB & Other Strategic Initiatives 2Q16 ▪ Expect to complete 30% of $125 million annual expense save target by year - end ▪ Progress on cost reduction initiatives in 2016 will be offset by higher costs related to strategic initiatives (e.g. OneWest Ban k Integration & Commercial Air Separation) ▪ 3Q15 included two months of OneWest Bank operating expenses; all periods thereafter reflect full impact All Other Operating Expenses Costs Related to OneWest Acquisition & Other Strategic Initiatives Amortization of Intangibles Restructuring Charges Operating Expenses Trends – (Continuing Operations) ($ Millions) (1) Total operating e xpenses exclusive of restructuring charges and amortization of intangibles divided by t otal r evenue (Net finance margin and other i ncome). Excluding transaction costs, net efficiency ratio of 57.6% in 3Q15. (2) Exclusive of amortization of intangibles and restructuring charges. (3) Includes reversal of accrued compensation and benefits of $19 million and other general administrative expenses of $8 mil lio n. Highlights 57.4% 62.2% 53.3% 49.2% 49.8% Net Efficiency Ratio (1) | 2Q16 Earnings 226 292 283 312 305 7 32 15 10 17 235 334 358 349 338 2Q15 3Q15 4Q15 1Q16 2Q16 2Q16 Walk (2) 322 321 (16) 8 7 325 (3)

11 Commercial Banking $ Inc/ (Dec) ($ in millions) 2Q16 1Q16 2Q15 1Q16 2Q15 Interest Income 289 287 186 2 103 Net Rental Income 7 7 6 - 1 Interest Expense 75 74 65 (1) 10 Net Finance Revenue 222 221 128 1 94 Other Income 61 56 67 5 (6) Credit Provision 11 74 18 62 (7) Operating Expenses 149 158 133 10 16 Pre - tax Income 122 44 44 78 78 ▪ Other Income increased due to gains on asset sales and net recoveries on assets held for sale ▪ Credit Provision decreased from 1Q16, which included higher reserves and charge - offs related to the energy portfolio ▪ Operating Expenses decreased due to lower legal expenses in Commercial Finance and lower sales and local taxes in Business Capital ▪ Prior year comparisons are impacted by the OneWest Bank acquisition in 3Q15 which resulted in lower interest expense and improved NFM Key Metrics 2Q16 1Q16 2Q15 1Q16 2Q15 AEA 20,575 20,727 14,502 (152) 6,073 NFM 4.3% 4.3% 3.5% 0.1% 0.8% Net Efficiency Ratio 52.1 % 56.8% 67.9% 4.7% 15.8% PTI - ROAEA 2.4% 0.9% 1.2% 1.5% 1.2% | 2Q16 Earnings 2Q15 does not reflect OneWest Bank results. Certain balances may not sum due to rounding. vs. Prior Quarter vs. Year - ago Quarter Commentary

12 Commentary $ Inc/ (Dec) ($ in millions) 2Q16 1Q16 2Q15 1Q16 2Q15 Interest Income 50 53 44 (3) 6 Net Rental Income 382 390 361 (7) 20 Interest Expense 147 148 149 (2) (2) Maintenance & Other 65 56 49 9 16 Net Finance Revenue 220 238 208 (17) 13 Other Income 12 19 14 (7) (2) Credit Provision 16 23 1 (7) 15 Operating Expenses 62 61 64 2 (2) Pre - tax Income 154 173 157 (19) (2) ▪ Net Finance Revenue decreased due to higher maintenance and other operating lease expenses and lower rentals offset by lower funding costs ▪ Credit Provision decreased and continue to reflect reserve increases in Maritime and elevated charges in the Business Air portfolio related to the assets transferred to held for sale ▪ Operating Expenses were relatively flat as higher costs related to the Commercial A ir separation offset lower employee costs ▪ Net Finance Revenue increased due to higher average operating lease assets partially offset by higher maintenance and other operating lease expenses ▪ Other Income decreased largely reflecting higher gains on asset sales in rail, which were offset by impairments, including a $4 million goodwill impairment charge related to the business aircraft assets transferred to held - for - sale ▪ Credit Provision increased primarily due to the Maritime reserve Key Metrics 2Q16 1Q16 2Q15 1Q16 2Q15 AEA 20,946 20,620 18,957 326 1,989 NFM 4.2% 4.6% 4.4% (0.4%) (0.2%) Net Efficiency Ratio 26.1% 23.7% 28.8% (2.4%) 2.7% PTI - ROAEA 2.9% 3.4% 3.3% (0.4%) (0.4%) | 2Q16 Earnings Transportation Finance Certain balances may not sum due to rounding. vs. Prior Quarter vs. Year - ago Quarter

13 Commentary $ Inc/ (Dec) ($ in millions) 2Q16 1Q16 2Q15 1Q16 2Q15 Interest Income 105 103 - 2 105 Interest Expense 6 9 - 3 6 Net Finance Revenue 100 94 - 5 100 Other Income 12 8 - 4 12 Credit Provision 1 3 - (2) 1 Operating Expenses 93 82 - 11 93 Pre - tax Income 17 17 - - 17 ▪ Pre - Tax Income remained flat, reflecting higher other income from gains on REO, higher net finance revenue, and lower credit provision, were offset by higher operating expenses primarily from REO expenses ▪ Prior year comparisons are impacted by the OneWest Bank acquisition in 3Q15 Key Metrics 2Q16 1Q16 2Q15 1Q16 2Q15 AEA 7,729 7,758 - (29) 7,729 NFM 5.2% 4.9% - 0.3% 5.2% Net Efficiency Ratio 79.6% 75.8% - (3.8%) 79.6% PTI - ROAEA 0.9% 0.9% - - 0.9% | 2Q16 Earnings Consumer and Community Banking 2Q15 does not reflect OneWest Bank results. Certain balances may not sum due to rounding. vs. Prior Quarter vs. Year - ago Quarter

14 15.1% 13.0% 13.2% 13.8% 14.1% 14.4% 12.5% 12.7% 13.1% 13.4% 17.1% 15.1% 13.4% 13.8% 13.9% 2Q15 3Q15 4Q15 1Q16 2Q16 Total Capital Ratio CET1 Ratio Tier 1 Leverage Ratio Strong Capital Position 8.2 9.5 9.6 9.8 9.8 8.0 8.8 8.9 9.1 9.1 2Q15 3Q15 4Q15 1Q16 2Q16 TBV CET1 Capital Tangible Book Value / CET1 Risk Based Capital Ratios (1) ▪ Total capital comprised mostly of high quality CET1 capital ▪ All regulatory capital ratios increased sequentially reflecting reduction in disallowed items and a reduction in RWA - RWA primarily reflects the reduction in assets Highlights | 2Q16 Earnings (1) Capital ratios are preliminary as of 6/30/16 and based on fully phased - in Basel III estimates. ($ Billions) 55.7 70.3 70.2 69.2 67.7 2Q15 3Q15 4Q15 1Q16 2Q16 Risk Weighted Assets (RWA) ($ Billions)

15 APPENDIX | 2Q16 Earnings

16 Exposure to Energy – Oil & Gas Loans ($ Billions) (1) Reflects the purchase accounting discount for loans acquired from OneWest Bank and the allowance for loan losses. (2) 65% line utilization in 1Q16 (3) Line Utilization % at 1Q16: E&P 68%, Midstream 62%, Energy Services 65% (4) Criticized % at 1Q16: E&P 66%, Midstream 2 %, Energy Services 45%. | 2Q16 Earnings Outstanding Line Utilization (3) Criticized (4) Commentary E & P $408 72% 62% ▪ Geographically diversified across the major producing basins ▪ Oil 43%/Gas 57% Midstream $224 71% 10% ▪ Long - lived infrastructure that store and transport essential commodity products Energy Services $200 66% 61% ▪ Geographically diversified across the major producing basins ▪ Almost all loans are secured Total Loans: $30.5 Energy: ~$0.8 (2.7% of Total Loans) Commercial $22.5 Consumer $7.1 Midstream $0.2 Energy Services $0.2 Exploration & Production $0.4 ▪ $832 million or 2.7% of total loans ▪ Loss coverage of 10.5% ( 1) ▪ ~47% of loans are Criticized ▪ 70% Line Utilization (2) ▪ Non - accruals of ~$140 million – ~70% current ▪ ~90% are Shared National Credits ▪ Less than 5% are Leveraged Loans ▪ Majority of portfolio is secured by: ▪ Traditional reserve - based lending assets ▪ Working capital assets ▪ Long - lived fixed assets ($ Millions)

17 GAAP Tax vs. Economic Tax – (Continuing Operations ) 2Q16 1Q16 FY15 Pre - tax Income $275 $204 $579 (1) GAAP tax provision includes discrete tax items of $4 million, $11 million and $624 million for 2Q16, 1Q16 and FY15, respectively. (2) EPS based on 202.3 million, 202.1 million and 186.4 million for 2Q16, 1Q16, and FY15, respectively. $ impacts are rounded. ($ Millions, except per share data) GAAP Tax Benefit (Provision) (1) ($94) ($53) $488 Net Income $181 $152 $1,067 Reported EPS (2) $0.90 $0.75 $5.72 Effective Tax Rate 34% 26% (84%) Cash Taxes ($6) ($2) ($10) Effective Tax Rate (Cash) 2% 1% 2% ▪ Reset of GAAP effective tax rate in 2015 due to prior year partial valuation allowance reversal ▪ 2 Q16 GAAP taxes reflect discrete items of $4 million ▪ Excluding discrete items effective tax rate of 33% ▪ 2 Q16 C ash taxes were $6 million Commentary | 2Q16 Earnings
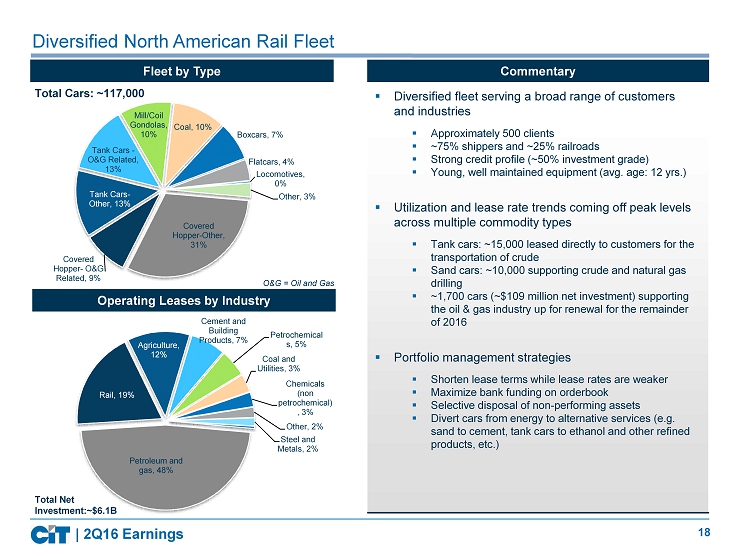
18 Petroleum and gas, 48% Rail, 19% Agriculture, 12% Cement and Building Products, 7% Petrochemical s, 5% Coal and Utilities, 3% Chemicals (non petrochemical) , 3% Other, 2% Steel and Metals, 2% Covered Hopper - Other, 31% Covered Hopper - O&G Related, 9% Tank Cars - Other, 13% Tank Cars - O&G Related, 13% Mill/Coil Gondolas, 10% Coal, 10% Boxcars, 7% Flatcars, 4% Locomotives, 0% Other, 3% Total Cars: ~117,000 Diversified North American Rail Fleet Operating Leases by Industry | 2Q16 Earnings Fleet by Type ▪ Diversified fleet serving a broad range of customers and industries ▪ Approximately 500 clients ▪ ~75% shippers and ~25% railroads ▪ Strong credit profile (~50% investment grade) ▪ Young, well maintained equipment ( avg. age: 12 yrs.) ▪ Utilization and lease rate trends coming off peak levels across multiple commodity types ▪ Tank cars: ~15,000 leased directly to customers for the transportation of crude ▪ Sand c ars: ~10,000 supporting crude and natural gas drilling ▪ ~1,700 cars (~$109 million net investment) supporting the oil & gas industry up for renewal for the remainder of 2016 ▪ Portfolio management strategies ▪ Shorten lease terms while lease rates are weaker ▪ Maximize bank funding on orderbook ▪ Selective disposal of non - performing assets ▪ Divert cars from energy to alternative services (e.g. sand to cement, tank cars to ethanol and other refined products, etc.) Total Net Investment:~$6.1B Commentary O&G = Oil and Gas

19 Financial Freedom | 2Q16 Earnings Financial Freedom is a reverse mortgage servicing operation that was part of the OneWest Bank acquisition in 2015. Financial Freedom services Federal Housing Administration (FHA) insured Home Equity Conversion Mortgages (HECM) on behalf of third party investors for which it receives a servicing fee. When a loan has a maturity event 1 , the steps required to be taken in the foreclosure process and the timelines within which they must be completed, are mandated by the Department of Housing and Urban Development (HUD). As long as the servicer satisfies the requirements in the mandated timeframes, HUD will reimburse the investor for debenture interest 2 from the onset of a maturity event through the date on which the claim is paid. – If however, the servicer fails to complete a required step on time, the interest will be curtailed, and Financial Freedom will be required to reimburse the investor for the unpaid debenture interest. What is Financial Freedom? (1) Maturity events include, but are not limited to; the borrower passing away, vacating the home, failing to make property t ax or insurance payments, etc. (2) Debenture interest is the interest rate paid on debentures issued with respect to a loan insured by the FHA. F ailure to satisfy the requirements of the HUD guidelines constitutes servicer error. Servicers are responsible for making payment to the investors for any debenture interest that is not payable by HUD as a result of servicer error. Each quarter CIT evaluates the level of servicing errors and records a liability for the amount of debenture interest that it expects to be required to pay the third parties. What is an Interest Curtailment Reserve?

20 Adjusted ROTCE Calculation | 2Q16 Earnings Current quarter capital amounts are preliminary. (1) Before discrete items. Adjusted ROTCE Calculation 2Q16 1Q16 4Q15 3Q15 2Q15 ($ in millions) A Net Income (Continuing Ops) $181 $152 $151 $697 $115 Goodwill Impairment $0 $0 $0 $0 $0 Amortization of Intangibles $6 $6 $7 $5 $1 B Tax Effected Goodwill Impairment and Amortization of Intangibles $4 $4 $6 $4 $1 Effective Tax Rate (for respective quarter) 33% 31% 9% 24% 29% C Valuation Allowance Reversal $0 $0 $4 $647 $0 A + B - CNet Income After Adjustments $185 $156 $153 $54 $116 D Annualized Net Income After Adjustments $741 $625 $613 $215 $463 Average Tangible Common Equity $9,830 $9,714 $9,561 $8,991 $8,200 Less: Average Disallowed DTA $858 $889 $886 $604 $349 E Adjusted Average TCE $8,972 $8,825 $8,675 $8,387 $7,851 D / E Adjusted ROTCE 8.26% 7.08% 7.08% 2.56% 5.89% (1)

21