Attached files
| file | filename |
|---|---|
| EX-99.1 - EXHIBIT 99.1 - CENTRUE FINANCIAL CORP | pressreleaseq2-2016.htm |
| 8-K - 8-K - CENTRUE FINANCIAL CORP | centrue2016q28-k.htm |

Centrue Financial Corporation
Earnings Presentation
June 30, 2016
NASDAQ: CFCB
1

This presentation contains forward-looking statements within the meaning of the Private Securities Litigation Reform Act of 1995.
Forward-looking statements include statements concerning plans, objectives, goals, strategies, expectations, intentions, projections,
developments, future events, performance or products, underlying assumptions, and other statements which are other than
statements of historical facts.
In some cases, you can identify forward-looking statements by terminology such as ''may,'' ''will,'' ''should,'' “hope,'' "expects,''
''intends,'' ''plans,'' ''anticipates,'' "contemplates," ''believes,'' ''estimates,'' ''predicts,'' ''projects,'' ''potential,'' ''continue,'' and other similar
terminology or the negative of these terms. From time to time, we may publish or otherwise make available forward-looking statements
of this nature. All such forward-looking statements, whether written or oral, and whether made by us or on our behalf, are expressly
qualified by the cautionary statements described on this message including those set forth below. In addition, we undertake no
obligation to update or revise any forward-looking statements to reflect events, circumstances, or new information after the date of the
information or to reflect the occurrence or likelihood of unanticipated events, and we disclaim any such obligation.
Forward-looking statements are only predictions that relate to future events or our future performance and are subject to known and
unknown risks, uncertainties, assumptions, and other factors, many of which are beyond our control, that may cause actual results,
outcomes, levels of activity, performance, developments, or achievements to be materially different from any future results, outcomes,
levels of activity, performance, developments, or achievements expressed, anticipated, or implied by these forward-looking
statements. As a result, we cannot guarantee future results, performance, developments, or achievements, and there can be no
assurance that our expectations, intentions, anticipations, beliefs, or projections will result or be achieved or accomplished. These
forward-looking statements are made as of the date hereof and are based on current expectations, estimates, forecasts and
projections as well as the beliefs and assumptions of management. Centrue’s actual results could differ materially from those stated or
implied in forward-looking statements. Past performance is not necessarily indicative of future results. We do not intend to update
these forward looking statements even though our situation may change in the future. We encourage you to review the risks that we
face and other information about us in our filings with the SEC, including our Annual Report on Form 10-K. These filings are available
at www.SEC.gov.
Non-GAAP Financial Measures: Certain financial information Included In this presentation may include Non-GAAP Financial
Measures. Centrue’s management uses Non-GAAP Financial Measures to evaluate Centrue’s performance and provides is
information as a supplement to Centrue’s reported results because management believes this information provides additional insight
Into Centrue’s operating performance. Reconciliations for any Non-GAAP Financial Measures may be found in the schedules
accompanying Centrue’s earnings releases.
General Information and Limitations
2

Corporate Profile – June 30, 2016
Platform
Headquarters: Ottawa, IL
Product Lines: Commercial, Retail,
Mortgage, Treasury
Management
Branches: 20
Employees (FTE): 221.0
Market Data*
NASDAQ Ticker: CFCB
Market Cap: $112.4 million
Price: $17.25
Tangible Book Value: $18.72
Price/ TBV: 92.1%
52 Week Range: $14.95 - $18.36
Shares Outstanding: 6,513,694
Market Makers: Boenning & Skattergood
Keefe, Bruyette & Woods
Sandler O'Neill + Partners
*Market Data as of 7/27/2016
Balance Sheet
Assets: $953 million
Loans: $658 million
Deposits: $716 million
Profitability (YTD)
Net Income: $3.0 million
Return on Average Assets: 0.62%
Return on Average Equity: 5.00%
Net interest Margin: 3.48% (FTE)
Efficiency Ratio: 80.26%
Capital Ratios
Risk-based Capital Ratio: 16.46%
Leverage Ratio: 12.17%
Texas Ratio: 7.10%
Asset Quality
NPA’s/ Assets: 0.98%
Delinquency Ratio: 0.37%
Allowance / Gross Loans: 1.36%
Allowance / NPL’s: 353.33%
3

Franchise Value
• One hundred forty-two year-old community bank offering commercial, retail, and
mortgage banking services
• Attractive branch network with solid market share in its core markets and a
foothold in two large markets
– Top 5 deposit market share in its two core markets (Kankakee and LaSalle County)
– The Company has a portion of its branches in Chicago and St. Louis MSAs
• Desirable deposit franchise with 17 bps cost of total deposits
– Core deposits (checking, savings, NOW, and money markets) account for 71.5% of deposits
– Weighted average life of core deposits is 6.9 years
• Scalable bank platform
– $953 million in assets and 20 total branches (6 branches in Chicago MSA)
– Potential to further capitalize on attractive Chicago market
• Experienced management team with proven track record
• Historically profitable core franchise
• Strong credit underwriting and asset quality metrics
• Diverse loan portfolio
4

Second Quarter Highlights
Assets
Asset decreased $8.6MM from year-end 2015
Loan portfolio:
o Grew $12.1MM, or 1.9%, from year-end 2015
o Three year compound annual growth rate of 4.3%
Liabilities & Capital
Deposit portfolio:
o Fell $2.1MM, or 0.3%, from year-end 2015
o Total cost of deposits equals 17 bps
Core deposit portfolio (checking, savings, NOW, money market):
o Weighted average life totals 6.9 years
o Totals 71.5% of deposits
Borrowings decreased $9.2MM
Asset Quality
Nonperforming assets:
o Decreased $5.1MM, or 35.4%, from year-end 2015
o NPA ratio fell to 0.98% from 1.50%
Allowance to nonperforming loans improved to 353.33%
Largest nonperforming loan of $3.1MM was paid off during the quarter
5

Second Quarter Highlights
Income Statement
Comparing second quarter 2016 to second quarter 2015:
o Net interest income increased $0.8MM, or 11.9%
o Net interest margin increased 1 basis points
o Core noninterest income (Excluding gains related to the sale of
OREO, branches, securities and other non-recurring gains)
decreased $0.2MM
o Noninterest expense increased $0.1MM, or 1.3%
Ratios & Per Share
Data
Earnings per share was $0.31
Excluding $0.17 related to the sale of the branch sales, earnings per share
equaled $0.14
Tangible book value per share was $18.72
Return on average assets improved to 0.88%
Return on average equity improved to 6.96%
Efficiency ratio decreased to 80.57%
Other
Completed the sale of three southern Illinois branch sales
o $49.3MM deposits
o $13.1MM loans
o $5.1MM fixed assets
o $1.1MM net after tax gain on sale
6

2014-2016 Quarterly Financial Summary (Unaudited)
Quarterly Financial Summary
Q2 Q3 Q4 Q1 Q2 Q3 Q4 Q1 Q2
Balance Sheet ($000)
Total Assets 869,350$ 854,090$ 817,089$ 873,568$ 891,015$ 943,676$ 961,218$ 969,017$ 952,657$
Total Loans (1) 579,612 575,860 553,564 569,748 586,978 612,132 645,807 661,083 657,941
Total Deposits 742,677 728,940 698,824 712,673 700,118 709,535 718,504 729,269 716,424
Profitability (%) (2)
Net Income ($000) 374$ 573$ (6,016)$ 1,867$ 1,053$ 1,088$ 38,594$ 918$ 2,128$
ROAA 0.17 0.26 (2.85) 0.91 0.49 0.47 16.25 0.38 0.88
ROAE 4.15 6.24 (65.13) 24.16 5.08 5.17 182.21 3.03 6.96
Net Interest Margin 3.29 3.33 3.37 3.44 3.48 3.34 3.37 3.48 3.49
Efficiency Ratio 83.78 81.55 92.15 92.20 83.83 80.16 82.77 79.96 80.57
Capital Ratios (%)
Risk-based Capital Ratio 10.01 10.18 9.64 16.84 16.41 15.71 15.64 15.63 16.46
Leverage Ratio 5.48 5.52 4.93 12.45 12.14 11.49 12.10 11.72 12.17
Texas Ratio 392.27 382.54 1,532.34 20.00 18.28 17.86 11.40 10.13 7.10
Asset Quality (%) (2)
NPA's/ Assets 5.76 5.14 2.20 1.99 1.80 1.67 1.50 1.34 0.98
NPL's/ Loans 4.97 4.11 1.40 1.29 1.06 0.99 0.93 0.85 0.38
Delinquency Ratio 3.61 2.55 0.94 1.66 1.24 1.47 1.37 1.04 0.37
NCO's/ Avg. Loans 0.11 0.05 1.22 - (0.11) 0.04 0.03 (0.01) 0.01
Allowance/ Gross Loans 2.15 2.23 1.44 1.40 1.47 1.37 1.33 1.36 1.36
Allowance/ NPL's 43.24 54.32 102.99 108.85 139.01 139.24 143.02 158.97 353.33
Source: Internal Management Reporting
2014 2015 2016
1. Includes loans held for sale.
2. In Q4 ’14, a bulk asset sale was completed in which a combined $35.2 million of problem assets were sold resulting in a charge
against earnings of $3.9 million.
7

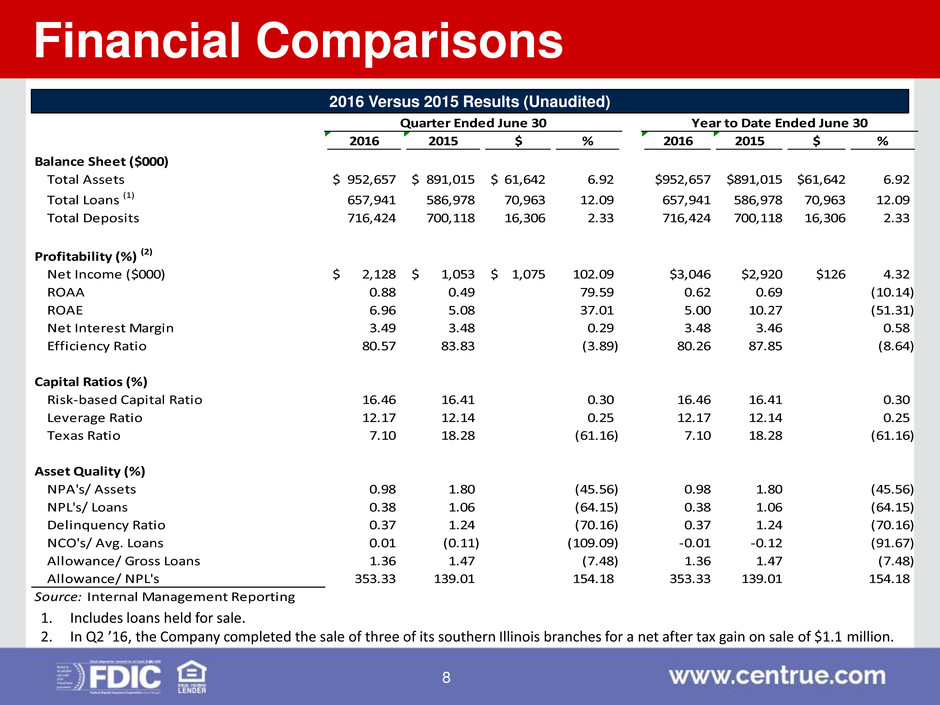
2016 Versus 2015 Results (Unaudited)
Financial Comparisons
2016 2015 $ % 2016 2015 $ %
Balance Sheet ($000)
Total Assets 952,657$ 891,015$ 61,642$ 6.92 $952,657 $891,015 $61,642 6.92
Total Loans (1) 657,941 586,978 70,963 12.09 657,941 586,978 70,963 12.09
Total Deposits 716,424 700,118 16,306 2.33 716,424 700,118 16,306 2.33
Profitability (%) (2)
Net Income ($000) 2,128$ 1,053$ 1,075$ 102.09 $3,046 $2,920 $126 4.32
ROAA 0.88 0.49 0.39 79.59 0.62 0.69 -0.07 (10.14)
ROAE 6.96 5.08 1.88 37.01 5.00 10.27 -5.27 (51.31)
Net Interest Margin 3.49 3.48 0.01 0.29 3.48 3.46 0.02 0.58
Efficiency Ratio 80.57 83.83 (3.26) (3.89) 80.26 87.85 -7.59 (8.64)
Capital Ratios (%)
Risk-based Capital Ratio 16.46 16.41 0.05 0.30 16.46 16.41 0.05 0.30
Leverage Ratio 12.17 12.14 0.03 0.25 12.17 12.14 0.03 0.25
Texas Ratio 7.10 18.28 (11.18) (61.16) 7.10 18.28 -11.18 (61.16)
Asset Quality (%)
NPA's/ Assets 0.98 1.80 (0.82) (45.56) 0.98 1.80 -0.82 (45.56)
NPL's/ Loans 0.38 1.06 (0.68) (64.15) 0.38 1.06 -0.68 (64.15)
Delinquency Ratio 0.37 1.24 (0.87) (70.16) 0.37 1.24 -0.87 (70.16)
NCO's/ Avg. Loans 0.01 (0.11) 0.12 (109.09) -0.01 -0.12 0.11 (91.67)
Allowance/ Gross Loans 1.36 1.47 (0.11) (7.48) 1.36 1.47 -0.11 (7.48)
Allowance/ NPL's 353.33 139.01 214.32 154.18 353.33 139.01 214.32 154.18
Source: Internal Management Reporting
Quarter Ended June 30 Year to Date Ended June 30
1. Includes loans held for sale.
2. In Q2 ’16, the Company completed the sale of three of its southern Illinois branches for a net after tax gain on sale of $1.1 million.
8

Commercial
12.6%
AG and
AGRE
6.2%
Commercial
RE
69.5%
1-4 Family
11.3%
Consumer
0.5%
Loans
Loan and Deposit Portfolios
Source: Internal Management Reporting
Checking
20.5%
NOW
18.1%
Money
Market
16.1%
Savings
16.8%
Time
28.5%
Deposits
9

Loan Portfolio
Source: Internal Management Reporting
$579.6 $575.9
$553.6
$569.7
$587.0
$612.1
$645.8
$661.1 $657.9
78.0%
79.0% 79.2%
79.9%
83.8%
86.3%
89.9% 90.7%
91.8%
60.0%
65.0%
70.0%
75.0%
80.0%
85.0%
90.0%
95.0%
$480.0
$500.0
$520.0
$540.0
$560.0
$580.0
$600.0
$620.0
$640.0
$660.0
$680.0
Q2/14 Q3/14 Q4/14 Q1/15 Q2/15 Q3/15 Q4/15 Q1/16 Q2/16
($ in millions)
Loans (including held for sale) Loan/ Deposit Ratio
10

Deposit Portfolio
$498.8 $493.5 $492.1 $512.0 $503.6 $513.0
$531.2 $524.4 $512.3
$243.9 $235.4 $206.7 $200.6 $196.5 $196.5
$187.3 $204.9 $204.1
0.29%
0.26%
0.22%
0.19%
0.17% 0.17%
0.16%
0.15%
0.17%
0.00%
0.05%
0.10%
0.15%
0.20%
0.25%
0.30%
0.35%
$-
$100.0
$200.0
$300.0
$400.0
$500.0
$600.0
$700.0
$800.0
Q2/14 Q3/14 Q4/14 Q1/15 Q2/15 Q3/15 Q4/15 Q1/16 Q2/16
($ in millions)
Core Deposits (Checking, Savings, NOW, Money Market) Time Rate
Source: Internal Management Reporting
11

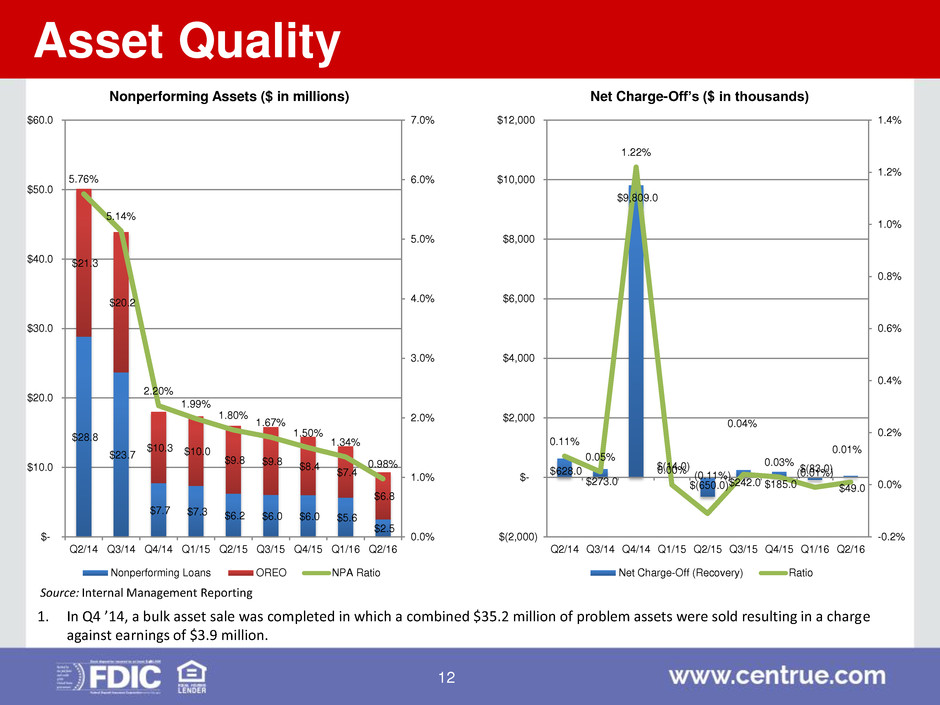
Asset Quality
Source: Internal Management Reporting
$28.8
$23.7
$7.7 $7.3 $6.2 $6.0 $6.0 $5.6
$2.5
$21.3
$20.2
$10.3 $10.0
$9.8 $9.8 $8.4
$7.4
$6.8
5.76%
5.14%
2.20%
1.99%
1.80%
1.67%
1.50%
1.34%
0.98%
0.0%
1.0%
2.0%
3.0%
4.0%
5.0%
6.0%
7.0%
$-
$10.0
$20.0
$30.0
$40.0
$50.0
$60.0
Q2/14 Q3/14 Q4/14 Q1/15 Q2/15 Q3/15 Q4/15 Q1/16 Q2/16
Nonperforming Assets ($ in millions)
Nonperforming Loans OREO NPA Ratio
$628.0
$273.0
$9,809.0
$(14.0)
$(650.0) $242.0 $185.0
$(83.0)
$49.0
0.11%
0.05%
1.22%
0.00%
(0.11%)
0.04%
0.03%
(0.01%)
0.01%
-0.2%
0.0%
0.2%
0.4%
0.6%
0.8%
1.0%
1.2%
1.4%
$(2,000)
$-
$2,000
$4,000
$6,000
$8,000
$10,000
$12,000
Q2/14 Q3/14 Q4/14 Q1/15 Q2/15 Q3/15 Q4/15 Q1/16 Q2/16
Net Charge-Off’s ($ in thousands)
Net Charge-Off (Recovery) Ratio
1. In Q4 ’14, a bulk asset sale was completed in which a combined $35.2 million of problem assets were sold resulting in a charge
against earnings of $3.9 million.
12

Capital
10.0% 10.2%
9.6%
16.8%
16.4%
15.7% 15.6% 15.6%
16.5%
7.0%
9.0%
11.0%
13.0%
15.0%
17.0%
19.0%
Q2/14 Q3/14 Q4/14 Q1/15 Q2/15 Q3/15 Q4/15 Q1/16 Q2/16
Total Risk-Based Capital Ratio
5.5% 5.5%
4.9%
12.5%
12.1%
11.5%
12.1%
11.7%
12.2%
4.0%
5.0%
6.0%
7.0%
8.0%
9.0%
10.0%
11.0%
12.0%
13.0%
Q2/14 Q3/14 Q4/14 Q1/15 Q2/15 Q3/15 Q4/15 Q1/16 Q2/16
Tier 1 Leverage Ratio
0.04% (0.16%)
(0.84%)
9.03%
8.87% 8.49%
12.27% 12.35%
12.82%
-2.0%
0.0%
2.0%
4.0%
6.0%
8.0%
10.0%
12.0%
14.0%
Q2/14 Q3/14 Q4/14 Q1/15 Q2/15 Q3/15 Q4/15 Q1/16 Q2/16
Tangible Common Equity/ Tangible Assets
392.3% 382.5% 1532.3% 20.0%
18.3% 17.9%
11.4%
10.1%
7.1%
0.0%
5.0%
10.0%
15.0%
20.0%
25.0%
Q2/14 Q3/14 Q4/14 Q1/15 Q2/15 Q3/15 Q4/15 Q1/16 Q2/16
Texas Ratio
Note: A $76 million recapitalization occurred in March of 2015.
13
Source: Internal Management Reporting

Profitability
0.17% 0.26%
(2.85%)
0.91% 0.49% 0.47% 16.25% 0.38% 0.88%
-1.0%
-0.5%
0.0%
0.5%
1.0%
1.5%
Q2/14 Q3/14 Q4/14 Q1/15 Q2/15 Q3/15 Q4/15 Q1/16 Q2/16
Return on Assets
83.8%
81.6%
92.2% 92.2%
83.8%
80.2%
82.8%
80.0% 80.6%
72.0%
74.0%
76.0%
78.0%
80.0%
82.0%
84.0%
86.0%
88.0%
90.0%
92.0%
94.0%
Q2/14 Q3/14 Q4/14 Q1/15 Q2/15 Q3/15 Q4/15 Q1/16 Q2/16
Efficiency Ratio
$6.0 $6.1 $6.0 $6.0 $6.4 $6.7 $7.1 $7.3 $7.2
3.29%
3.33%
3.37%
3.44%
3.48%
3.34%
3.37%
3.48% 3.49%
3.2%
3.2%
3.3%
3.3%
3.4%
3.4%
3.5%
3.5%
3.6%
$-
$1.0
$2.0
$3.0
$4.0
$5.0
$6.0
$7.0
$8.0
Q2/14 Q3/14 Q4/14 Q1/15 Q2/15 Q3/15 Q4/15 Q1/16 Q2/16
Net Interest Income – Net Interest Margin (%)
Net Interest Income ($ in millions) Net Interest Margin (%)
4.15% 6.24%
(65.13%)
24.16% 5.08% 5.17% 182.21% 3.03% 6.96%
-3.5%
-1.5%
0.5%
2.5%
4.5%
6.5%
8.5%
Q2/14 Q3/14 Q4/14 Q1/15 Q2/15 Q3/15 Q4/15 Q1/16 Q2/16
Return on Equity
Source: Internal Management Reporting
14

Noninterest Income
Source: Internal Management Reporting
$4,027
$2,576
$3,237
$2,587
$2,263
$4,242
$2,156 $2,395 $2,386 $2,279 $2,099 $2,217
1.96%
1.20%
1.40%
1.09%
0.92%
1.75%
1.05%
1.11%
1.03%
0.96%
0.85%
0.92%
0.00%
0.50%
1.00%
1.50%
2.00%
2.50%
$0
$500
$1,000
$1,500
$2,000
$2,500
$3,000
$3,500
$4,000
$4,500
Q1/15 Q2/15 Q3/15 Q4/15 Q1/16 Q2/16
Total NII Core NII NII/Avg Assets Core NII/Avg Assets
15

Noninterest Expense
Source: Internal Management Reporting
$8,183 $7,952
$8,842
$8,261 $7,866 $8,112
$7,485 $7,408 $7,276 $7,732 $7,672 $7,761
3.98%
3.69%
3.81%
3.48%
3.21%
3.34%
3.64%
3.44%
3.14%
3.26%
3.13% 3.19%
0.00%
0.50%
1.00%
1.50%
2.00%
2.50%
3.00%
3.50%
4.00%
4.50%
$0
$1,000
$2,000
$3,000
$4,000
$5,000
$6,000
$7,000
$8,000
$9,000
$10,000
Q1/15 Q2/15 Q3/15 Q4/15 Q1/16 Q2/16
Total NIE Core NIE NIE/Avg Assets Core NIE/Avg Assets
16

Stock Price
$11.40
$15.00 $14.55
$16.64 $17.40 $17.40
$12.14 $12.16 $12.33 $18.08 $18.35 $18.72
93.9%
123.6%
139.8%
134.9%
96.2%
92.9%
50.0%
60.0%
70.0%
80.0%
90.0%
100.0%
110.0%
120.0%
130.0%
140.0%
150.0%
$0.0
$2.0
$4.0
$6.0
$8.0
$10.0
$12.0
$14.0
$16.0
$18.0
$20.0
Q1/15 Q2/15 Q3/15 Q4/15 Q1/16 Q2/16
Closing Stock Price Tangible Book Value Price/ TBV
Source: Internal Management Reporting
17

Review of Branch Footprint
• Top 5 market share in
Kankakee and LaSalle
counties
• Top 10 market share in 6 of
the 10 counties in which the
Company operates
• 14 branches in North-Central
Illinois with strong market
share
• 6 branches in the southern
suburbs of Chicago
• 1 branches in St. Louis MSA
Highlights
2015 Market
Rank Company Brchs. Deposits ($) Share (%)
1 HomeStar Financial Group Inc. (IL) 4 298,099$ 15.64
2 Centrue Financial Corporation (IL) 6 233,224 12.24
3 PNC Financial Services Group (PA) 4 208,228 10.93
4 Municipal Trust & SB (IL) 3 202,783 10.64
5 First American Bank Corp. (IL) 2 186,737 9.80
6 First Trust Financial Corp. (IL) 4 176,561 9.27
7 Romy Hammes Inc. (IN) 2 155,712 8.17
8 Foresight Fnl Group Inc. (IL) 2 117,379 6.16
9 Illinois State Bancorp Inc. (IL) 1 76,545 4.02
10 MainSource Financial Group (IN) 3 71,171 3.73
Total For Institutions In Market 41 1,905,547$
2015 Market
Rank Company Brchs. Deposits ($) Share (%)
1 Tri-County Finl Group Inc. (IL) 5 434,888$ 17.49
2 Eureka Savings Bank (IL) 4 288,476 11.60
3 First Ottawa Bancshares (IL) 6 222,626 8.95
4 First FSB (IL) 6 184,305 7.41
5 Centrue Financial Corporation (IL) 7 181,235 7.29
6 Ottawa Savings Bancorp (MHC) (IL) 2 165,269 6.65
7 LaSalle Bancorp Inc. (IL) 2 148,774 5.98
8 Streator Home SB (IL) 1 129,001 5.19
9 Peru FSB (IL) 2 121,866 4.90
10 Heartland Bancorp Inc. (IL) 2 96,484 3.88
Total For Institutions In Market 59 2,486,502$
Kankakee County - Top 10
LaSalle County - Top 10
18

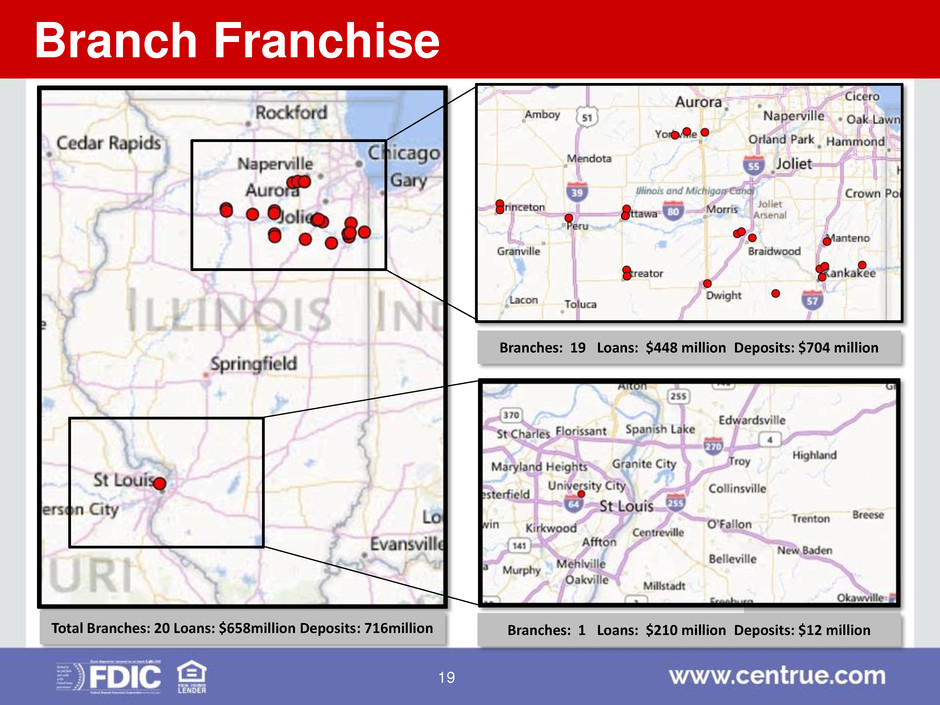
Branches: 19 Loans: $448 million Deposits: $704 million
Branches: 1 Loans: $210 million Deposits: $12 million Total Branches: 20 Loans: $658million Deposits: 716million
Branch Franchise
19

Scorecard – Previous Two Years
Bulk Asset Sale
$76 Million Recap
Went Public on NASDAQ
Recovery of DTA
Termination of Joint Regulatory
Agreement
Strengthened Balance Sheet
Improvement in Core Run Rate
Sale of Branches
Build
Shareholder
Value
20

Strategic Priorities
Increase Core Earnings
Strengthen Balance Sheet Through Quality Loan and
Core Deposit Growth
Maintain Credit Quality
Create a Leaner, More Efficient Organization
Utilize and Protect Deferred Tax Asset
Explore Opportunities to Utilize Excess Capital
Invest in Talent
21
