Attached files
| file | filename |
|---|---|
| 8-K - TMUS FORM 8-K - T-Mobile US, Inc. | tmus06302016form8-k.htm |
| EX-99.1 - TMUS EXHIBIT 99.1 - T-Mobile US, Inc. | tmus06302016ex991.htm |
EXHIBIT 99.2

1

CUSTOMER METRICS
Branded Postpaid Customers
▪ | Branded postpaid net customer additions were 890,000 in the second quarter of 2016 compared to 1,041,000 in the first quarter of 2016 and 1,008,000 in the second quarter of 2015. The sequential and year-over-year decline in branded postpaid net customer additions was primarily due to the absence of iconic device launches in the period. |
▪ | Branded postpaid phone net customer additions were 646,000 in the second quarter of 2016, compared to 877,000 in the first quarter of 2016 and 760,000 in the second quarter of 2015. T-Mobile led the industry in branded postpaid phone net customer additions for the 10th consecutive quarter. |
▪ | Branded postpaid mobile broadband net customer additions were 244,000 in the second quarter of 2016, compared to 164,000 in the first quarter of 2016 and 248,000 in the second quarter of 2015. |
▪ | Branded postpaid phone churn was 1.27% in the second quarter of 2016, down 6 basis points from 1.33% in the first quarter of 2016 and down 5 basis points from 1.32% in the second quarter of 2015. This quarter marked the best ever branded postpaid phone churn performance in the Company’s history. The sequential and year-over-year decline in churn reflects a reduction in promotional activity across the industry in the second quarter of 2016 as well as ongoing improvements in the Company’s network, customer service, and the overall value of its offerings in the marketplace, resulting in increased customer satisfaction and loyalty. |
▪ | In June 2016, T-Mobile entered into an agreement under which the Company agreed to sell its marketing and distribution rights to certain existing T-Mobile co-branded customers to a current MVNO partner. The transaction, expected to close late third quarter of 2016, is subject to regulatory approval and other closing conditions. Assuming closing, approximately 1.4 million branded postpaid phone customers and approximately 0.3 million branded prepaid customers would transition to being reported as wholesale customers. The customer transition is expected to have a significant impact on reported branded postpaid phone churn following closing. For example, on a pro-forma basis as if the transaction closed at the beginning of the second quarter of 2016, reported branded postpaid phone churn would have been 18 basis points lower at 1.09%. |


2
Branded Prepaid Customers
▪ | Branded prepaid net customer additions were 476,000 in the second quarter of 2016, compared to 807,000 in the first quarter of 2016 and 178,000 in the second quarter of 2015. The sequential decline was primarily due to seasonal factors. The year-over-year increase was primarily driven by successful MetroPCS promotional activities and continued growth in new markets. |
▪ | Migrations to branded postpaid plans reduced branded prepaid net customer additions in the second quarter of 2016 by approximately 210,000, up from 200,000 in the first quarter of 2016 and 175,000 in the second quarter of 2015. |
▪ | Branded prepaid churn was 3.91% in the second quarter of 2016, compared to 3.84% in the first quarter of 2016 and 4.93% in the second quarter of 2015. The sequential increase was primarily due to seasonal factors. The year-over-year decline was primarily impacted by strong performance at the MetroPCS brand and a methodology change that occurred in the third quarter of 2015. |


Total Branded Customers
▪ | Total branded net customer additions were 1,366,000 in the second quarter of 2016 compared to 1,848,000 in the first quarter of 2016 and 1,186,000 in the second quarter of 2015. This was the 10th consecutive quarter in which branded net customer additions surpassed the one million milestone. |

3
Wholesale Customers
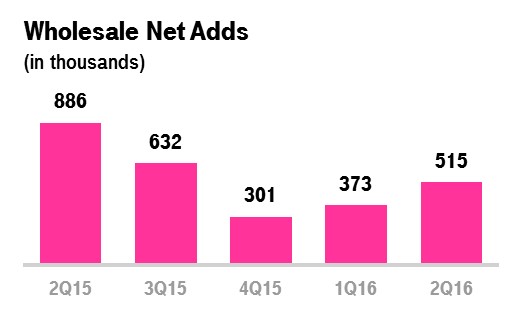
▪ | Wholesale net customer additions were 515,000 in the second quarter of 2016 compared to 373,000 in the first quarter of 2016 and 886,000 in the second quarter of 2015. |
Total Customers
▪ | Total net customer additions were 1,881,000 in the second quarter of 2016 compared to 2,221,000 in the first quarter of 2016 and 2,072,000 in the second quarter of 2015. This was the 13th consecutive quarter in which total net customer additions exceeded one million. |
▪ | T-Mobile ended the second quarter of 2016 with 67.4 million total customers, up more than 24 million customers on a pro forma combined basis from the end of the first quarter of 2013, when T-Mobile launched the first Un-carrier initiative. |

NETWORK
Network Modernization Update
▪ | T-Mobile now provides 4G LTE coverage to 311 million people. This is up from 308 million as of the first quarter 2016 earnings, and 290 million as of the second quarter 2015 earnings. |
▪ | Wideband LTE, which refers to markets that have bandwidth of at least 15+15 MHz dedicated to 4G LTE, is now available nationwide, covering 224 million people. |
▪ | Voice over LTE (“VoLTE”) comprised 57% of total voice call minutes in the second quarter of 2016 compared to 16% in the second quarter of 2015. Moving voice traffic to VoLTE frees up capacity and allows for an accelerated re-farming of spectrum currently used for 2G and 3G. T-Mobile is leading the US wireless industry in terms of VoLTE migration. |
4
Network Speed
▪ | T-Mobile continues to have the fastest nationwide 4G LTE network in the U.S. based on download speeds from millions of user-generated tests. This is the tenth consecutive quarter that T-Mobile has led the industry in average download speeds. |
▪ | In the second quarter of 2016, T-Mobile’s average 4G LTE download speed was 22.4 Mbps compared to Verizon at 21.6 Mbps, AT&T at 20.7 Mbps, and Sprint at 16.1 Mbps. |


Spectrum
▪ | At the end of the second quarter of 2016, T-Mobile owns or has agreements to own an average of 86 MHz of spectrum across the top 25 markets in the U.S. The spectrum is comprised of an average of 12 MHz in the 700 MHz band, 30 MHz in the 1900 MHz PCS band, and 44 MHz in the AWS band. |
▪ | During the first and second quarters of 2016, T-Mobile entered into agreements with multiple parties to acquire 700 MHz A-Block spectrum licenses covering approximately 59 million POPs for $1.1 billion. These transactions, the majority of which are expected to close in the second half of 2016, will increase T-Mobile’s low-band spectrum holdings from 210 million POPs to 269 million POPs upon closing and include the cities of Chicago, Nashville, Salt Lake City and Columbus. |
▪ | The Company is a qualified bidder in the 600 MHz broadcast incentive auction. |
5

A-Block Update
▪ | T-Mobile owns or has agreements to own 700 MHz A-Block spectrum covering 269 million people or approximately 83% of the U.S. population. The spectrum covers all of the top 10 market areas and 29 of the top 30 market areas in the U.S. |
▪ | T-Mobile has deployed its 700 MHz A-Block spectrum in 350 market areas covering more than 200 million people under the brand name “Extended Range LTE.” Extended Range LTE travels up to twice as far as mid-band spectrum and works up to four times better in buildings. The Company expects to continue to aggressively roll-out new 700 MHz sites in 2016 including the cities of San Francisco, Phoenix, San Diego, and Las Vegas. |
UN-CARRIER INITIATIVES
▪ | At the end of the second quarter of 2016, 95% of the branded postpaid customer base was on a Simple Choice plan, up from 94% at the end of the first quarter of 2016 and 93% at the end of the second quarter of 2015. |
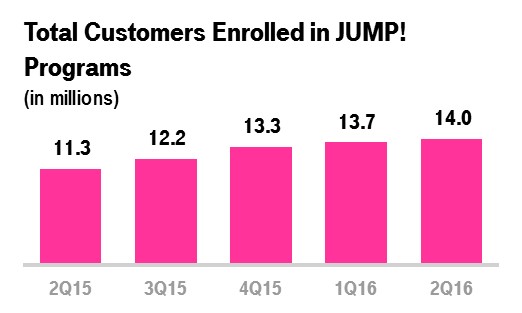
▪ | At the end of the second quarter of 2016, 14.0 million customers were enrolled in T-Mobile's JUMP! programs, up from 13.7 million at the end of the first quarter of 2016 and 11.3 million at the end of the second quarter of 2015. |
6
Un-carrier Updates
▪ | Un-carrier 11: GET THANKED: On June 6, 2016, T-Mobile introduced its eleventh Un-carrier move, a set of initiatives dedicated exclusively to thanking T-Mobile customers. It was the biggest Un-carrier yet in terms of media coverage and social media discussions. |
▪ | Stock UpTM is a program that provides eligible T-Mobile customers the opportunity to become T-Mobile owners by offering every existing and new account holder a full share of T-Mobile common stock. Customers can also grow their ownership by up to 100 shares per year by earning one share for every new active account they refer. |
▪ | As part of Un-carrier 11, the Company also launched T-Mobile Tuesdays, a program that thanks all of our eligible customers with free stuff and a chance to win epic prizes every Tuesday. All customers need to do to get thanked is to download the T-Mobile Tuesdays app and check in every Tuesday to claim their gifts. Since T-Mobile Tuesdays launched, the app was ranked #1 on the Apple App Store and has been downloaded nearly 5 million times, and customers have hit the redemption button 8 million times to receive their gifts. |
▪ | T-Mobile continues to add new and exciting gifts and prizes to the T-Mobile Tuesdays line-up. Most recently, the Company added free, unlimited data for Pokemon Go for a full year. |
▪ | Binge On Amped: T-Mobile has continued to expand its popular video initiative to include even more services that can stream without using up customers’ high-speed data allotment. More than 100 video services now qualify including new services like PBS, ABC and Disney Channel in addition to initial program participants like Netflix, Hulu and HBO GO. T-Mobile customers have streamed more than three quarters of a billion hours of video without using their high-speed data allowance since the launch of Binge On in November 2015. |

DEVICES
▪ | Total devices sold or leased were 8.9 million units in the second quarter of 2016 compared to 9.4 million units in the first quarter of 2016 and 8.3 million units in the second quarter of 2015. |
▪ | Total smartphones sold or leased were 8.1 million units in the second quarter of 2016 compared to 8.8 million units in the first quarter of 2016 and 7.4 million units in the second quarter of 2015. |
▪ | The upgrade rate for branded postpaid customers was approximately 6% in the second quarter of 2016 compared to approximately 7% in the first quarter of 2016 and approximately 9% in the second quarter of 2015. |
7

DEVICE FINANCING
Equipment Installment Plans (EIP)
▪ | T-Mobile financed $1.562 billion of equipment sales on EIP in the second quarter of 2016, up 25.4% from $1.246 billion in the first quarter of 2016 and down 8.0% from $1.697 billion in the second quarter of 2015. The sequential increase was primarily due to the mix shift back to the EIP program which started in the first quarter of 2016 and continued in the second quarter of 2016. The year-over-year decrease was primarily due to promotions for devices, the impact of the JUMP! On Demand program launched at the end of the second quarter of 2015, and a lower upgrade rate for branded postpaid customers. |
▪ | Customers on Simple Choice plans had associated EIP billings of $1.344 billion in the second quarter of 2016, up 1.5% compared to $1.324 billion in the first quarter of 2016 and down 3.5% from $1.393 billion in the second quarter of 2015. The sequential increase was primarily due to a higher level of devices financed using EIP plans. The year-over-year decline was primarily due to promotions for devices, the impact of the JUMP! On Demand program launched at the end of the second quarter of 2015, and a lower upgrade rate for branded postpaid customers in the second quarter of 2016. |
▪ | Total EIP receivables, net of imputed discount and allowances for credit losses, was $2.662 billion at the end of the second quarter of 2016 compared to $3.053 billion at the end of the first quarter of 2016 and $5.114 billion at the end of the second quarter of 2015. The sequential and year-over-year decline in the total EIP receivables, net was primarily due to sales of certain EIP receivables and the impact of the JUMP! On Demand program launched at the end of the second quarter of 2015. |
▪ | In the second quarter of 2016, T-Mobile amended the terms of its arrangement to sell certain EIP accounts receivable to increase its maximum funding commitment thereunder from $800 million to $1.3 billion. As of June 30, 2016, the arrangement provided funding of $1.2 billion, an increase of $0.4 billion, compared to March 31, 2016. T-Mobile will continue to service the customers and the related receivables, including facilitating customer payment collection, in exchange for a monthly fee. |
8

Leasing Plans
▪ | Leased devices transferred from inventory to property and equipment, net was $52 million in the second quarter of 2016 compared to $653 million in the first quarter of 2016. The sequential decline was primarily due to the continued mix shift back to the EIP program in the second quarter of 2016. |
▪ | Depreciation expense associated with leased devices was $397 million in the second quarter of 2016 compared to $403 million in the first quarter of 2016. |
▪ | Leased devices included in property and equipment, net were $1.878 billion at the end of the second quarter of 2016 compared to $2.223 billion at the end of the first quarter of 2016. |
▪ | Lease revenues were $367 million in the second quarter of 2016 compared to $342 million in the first quarter of 2016. |
▪ | Original consideration received and lease revenues, net were $327 million in the second quarter of 2016, down from $377 million in the first quarter of 2016. Original consideration represents cash down payments received from customers at operating lease inception, which is amortized over the term of the lease. Lease revenues, net exclude amortization of the original consideration. |
▪ | The difference between the original consideration received and lease revenues, net, and the amount of leased devices transferred from inventory to property and equipment, net of returns approximates the working capital impact of leasing. |
▪ | Future minimum lease payments expected to be received over the lease term were $1.178 billion at the end of the second quarter of 2016, down from $1.425 billion at the end of the first quarter of 2016. Future minimum lease payments exclude optional residual buy-out amounts at the end of the lease term. |
9
CUSTOMER QUALITY
▪ | Total bad debt expense and losses from sales of receivables was $165 million in the second quarter of 2016 compared to $173 million in the first quarter of 2016 and $156 million in the second quarter of 2015. |
▪ | As a percentage of total revenues, total bad debt expense and losses from sales of receivables was 1.79% in the second quarter of 2016 compared to 2.01% in the first quarter of 2016 and 1.91% in the second quarter of 2015. |
▪ | Total bad debt expense and losses from sales of receivables was sequentially lower in the second quarter of 2016. Typically, bad debt expense tends to increase seasonally in the second half of the year compared to the first half. |
▪ | EIP receivables classified as Prime were 42% of total EIP receivables at the end of the second quarter of 2016, down compared to 47% at the end of the first quarter of 2016 and 52% at the end of the second quarter of 2015. The sequential and year-over-year decline in EIP receivables classified as Prime was due to the continued sales of certain EIP receivables and the additional EIP securitization in the second quarter of 2016. Including the EIP receivables sold, total EIP receivables classified as Prime were 53% at the end of the second quarter of 2016, compared to 52% at the end of the first quarter of 2016. |

10
REVENUE METRICS
Branded Postpaid Phone ARPU
▪ | Branded postpaid phone ARPU was $47.11 in the second quarter of 2016, up 1.9% from $46.21 in the first quarter of 2016 and down 2.2% from $48.19 in the second quarter of 2015. As noted in prior quarters, branded postpaid phone ARPU in the second quarter of 2016 was impacted by the non-cash net revenue deferral for Data Stash. |
▪ | Excluding the impact of Data Stash, branded postpaid phone ARPU in the second quarter of 2016 increased by 0.8% sequentially and declined by 0.4% year-over-year. Branded postpaid phone ARPU was generally stable as continued strategic focus on family plan penetration, promotional activity, and Un-carrier initiatives were offset by higher data attach rates and growth in insurance programs revenue. |

Branded Postpaid ABPU
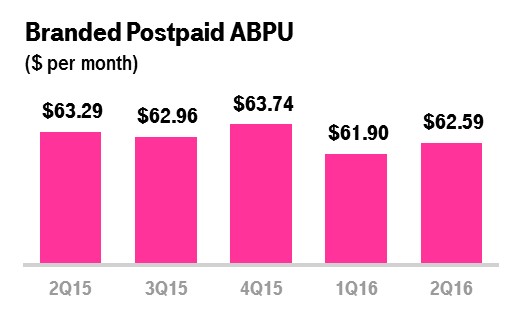
▪ | Branded postpaid ABPU was $62.59 in the second quarter of 2016, up 1.1% from $61.90 in the first quarter of 2016 and down 1.1% from $63.29 in the second quarter of 2015. Branded postpaid ABPU in the second quarter of 2016 was impacted by the non-cash net revenue deferral for Data Stash. |
▪ | Excluding the impact of Data Stash, branded postpaid ABPU in the second quarter of 2016 increased by 0.3% sequentially and by 0.3% year-over-year. Sequentially and year-over-year, the slight increase in branded postpaid ABPU was primarily due to stability in branded postpaid phone ARPU. Growth in total lease revenues and EIP billings on a per user basis also contributed to the year-over-year increase. |
11
Branded Postpaid Customers per Account
▪ | Branded postpaid customers per account was 2.64 at the end of the second quarter of 2016, compared to 2.59 at the end of the first quarter of 2016 and 2.43 at the end of the second quarter of 2015. The sequential and year-over-year increase was primarily due to ongoing service promotions targeting families and increased penetration of mobile broadband devices. |

Branded Prepaid ARPU
▪ | Branded prepaid ARPU was $37.86 in the second quarter of 2016, up 0.7% from $37.58 in the first quarter of 2016 and flat compared to $37.83 in the second quarter of 2015. Sequentially and year-over-year, the slight increases were primarily due to an increase in the mix of branded prepaid customers choosing plans with more data, partially offset by dilution from growth of customers on rate plan promotions. |

REVENUES
Service Revenues
▪ | T-Mobile once again led the industry in year-over-year service revenue percentage growth in the second quarter of 2016. This marks the ninth consecutive quarter that T-Mobile has led the industry in year-over-year service revenue percentage growth. |
▪ | Service revenues were $6.888 billion in the second quarter of 2016, up 4.7% from $6.578 billion in the first quarter of 2016 and up 12.1% from $6.144 billion in the second quarter of 2015. |
12
▪ | Sequentially, the increase in service revenues was primarily due to growth in the Company’s customer base from the continued success of T-Mobile’s Un-carrier initiatives and the Company’s prepaid brands, strong customer response to promotional activities targeting families, growth in insurance programs revenue, and a sequentially lower non-cash net revenue deferral from Data Stash, which totaled $88 million in the second quarter of 2016, compared to $138 million in the first quarter of 2016. |
▪ | Year-over-year, the increase in service revenues was primarily due to growth in the Company’s customer base from the continued success of T-Mobile’s Un-carrier initiatives and the Company’s prepaid brands, strong customer response to promotional activities targeting families, and growth in insurance programs revenue. These increases were partially offset by a higher non-cash net revenue deferral from Data Stash, which totaled $88 million in the second quarter of 2016, compared to $3 million in the second quarter of 2015. |


Equipment Revenues
▪ | Equipment revenues were $2.188 billion in the second quarter of 2016, up 18.2% from $1.851 billion in the first quarter of 2016 and up 14.3% from $1.915 billion in the second quarter of 2015. Equipment revenues in the second quarter of 2016 were comprised of lease revenues of $367 million and non-leased revenues of $1.821 billion. |
▪ | Sequentially, the increase in equipment revenues was primarily due to the continued mix shift back to the EIP program during the second quarter of 2016, which resulted in an increase in the average revenue per device sold and the number of devices sold. Under the EIP program, equipment revenues are recognized when the device is delivered to the customer rather than over the term of a lease, resulting in higher equipment revenues for the quarter. |
▪ | Year-over-year, the increase in equipment revenues was primarily due to an increase in lease revenues and a higher number of devices sold, partially offset by a lower average revenue per device sold due to promotions for devices and the impact from the JUMP! On Demand program, which launched at the end of the second quarter of 2015. |
13

Total Revenues
▪ | T-Mobile once again led the industry in year-over-year total revenue percentage growth in the second quarter of 2016. This marks the twelfth time in the past thirteen quarters that T-Mobile has led the industry in year-over-year total revenue percentage growth. |
▪ | Total revenues were $9.222 billion in the second quarter of 2016, up 7.2% from $8.599 billion in the first quarter of 2016 and up 12.8% from $8.179 billion in the second quarter of 2015. |
▪ | Sequentially, the increase in total revenues was primarily due to higher equipment revenues from the continued mix shift back to the EIP program and an increase in service revenues in the second quarter of 2016. |
▪ | Year-over-year, the increase in total revenues was primarily due to higher service revenues from growth in the customer base and higher equipment revenues. |

OPERATING EXPENSES
Cost of Services
▪ | Cost of services was $1.429 billion in the second quarter of 2016, up 0.6% from $1.421 billion in the first quarter of 2016 and up 2.3% from $1.397 billion in the second quarter of 2015. |
▪ | Year-over-year, the increase in cost of services was primarily due to the network expansion, 700 MHz A-Block build-out, higher lease expense and higher regulatory program costs, partially offset by lower domestic customer roaming and lower long distance costs. |
14

Cost of Equipment Sales
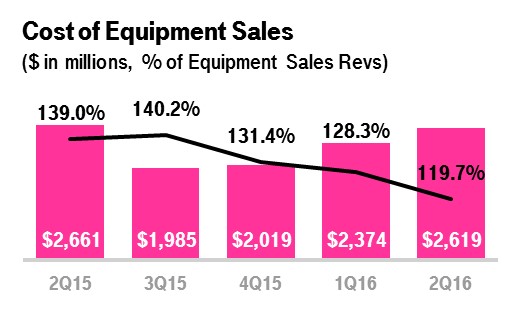
▪ | Cost of equipment sales was $2.619 billion in the second quarter of 2016, up 10.3% from $2.374 billion in the first quarter of 2016 and down 1.6% from $2.661 billion in the second quarter of 2015. |
▪ | Sequentially, the increase in cost of equipment sales was primarily due to the continued mix shift back to the EIP program during the second quarter of 2016, which resulted in an increase in the average cost per device sold and the number of devices sold. Under the EIP program, the cost of a device is recognized as cost of equipment sales at the time the device is delivered to the customer rather than recognized as depreciation expense over the term of the lease, resulting in higher cost of equipment sales for the quarter. |
▪ | Year-over-year, the decrease was primarily driven by a lower average cost per device sold due in part to the impact from the JUMP! On Demand program which launched at the end of the second quarter of 2015, partially offset by an increase in the number of devices sold. |
Selling, General and Admin. (SG&A) Expenses
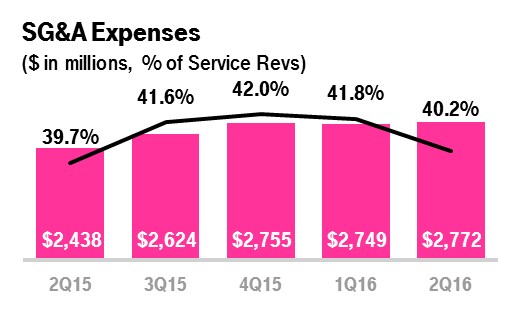
▪ | SG&A expenses were $2.772 billion in the second quarter of 2016, up 0.8% from $2.749 billion in the first quarter of 2016 and up 13.7% from $2.438 billion in the second quarter of 2015. |
▪ | Sequentially, the slight increase in SG&A expenses was primarily due to strategic investments to support growing the customer base, partially offset by lower commissions due to lower branded customer additions. |
▪ | Year-over-year, the increase was primarily due to strategic investments to support the growing customer base including higher promotional costs, employee-related expenses and commissions driven by higher branded customer additions. |
15
Depreciation and Amortization (D&A)
▪ | D&A was $1.575 billion in the second quarter of 2016, up 1.5% from $1.552 billion in the first quarter of 2016 and up 46.5% from $1.075 billion in the second quarter of 2015. D&A in the second quarter of 2016 was comprised of device lease-related D&A of $397 million and non-device lease-related D&A of $1.178 billion. |
▪ | Sequentially, the increase in D&A was primarily due to an increase in non-device lease related D&A related to the continued build-out of the Company’s 4G LTE network, partially offset by a decrease in device lease-related D&A. |
▪ | Year-over-year, the increase was primarily due to the impact of leasing. Under leasing, the cost of the leased device is recognized as depreciation expense over the term of the lease rather than recognized as cost of equipment sales when the device is delivered to the customer. The total number of leased devices was higher year-over-year, resulting in higher depreciation expense. |

ADJUSTED EBITDA
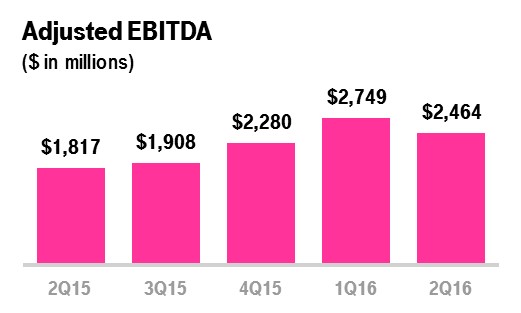
▪ | T-Mobile led the industry in year-over-year Adjusted EBITDA percentage growth in the second quarter of 2016. |
▪ | Adjusted EBITDA was $2.464 billion in the second quarter of 2016, down 10.4% from $2.749 billion in the first quarter of 2016 and up 35.6% from $1.817 billion in the second quarter of 2015. |
▪ | Excluding spectrum gains from the first quarter of 2016 and the second quarter of 2015, Adjusted EBITDA increased by 16.6% sequentially and by 37.3% year-over-year. |
16
▪ | Sequentially, the decline in Adjusted EBITDA was primarily due to the spectrum gain recorded in the first quarter of 2016. Excluding the spectrum gain, Adjusted EBITDA increased primarily due to growth in the customer base and lower losses on equipment, and a sequentially lower non-cash impact of Data Stash. |
▪ | Year-over-year, the increase in Adjusted EBITDA was primarily due to growth in the customer base and lower losses on equipment, partially offset by higher SG&A expenses due to strategic investments to support the growing customer base and a higher non-cash impact of Data Stash. |
▪ | Adjusted EBITDA margin was 36% in the second quarter of 2016 compared to 42% in the first quarter of 2016 and 30% in the second quarter of 2015. Excluding spectrum gains from the first quarter of 2016 and the second quarter of 2015, Adjusted EBITDA margin was 36% in the second quarter of 2016, compared to 32% in the first quarter of 2016 and 29% in the second quarter of 2015. |
▪ | The aggregate impact from leasing and Data Stash on Adjusted EBITDA in the second quarter of 2016 was $279 million. Lease revenues were $367 million and the net impact from Data Stash was $88 million in the second quarter of 2016. |
NET INCOME AND EARNINGS PER SHARE
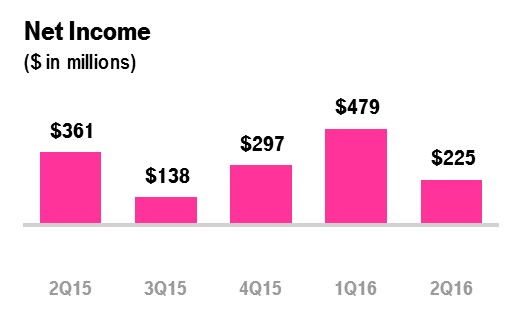
▪ | Net income was $225 million in the second quarter of 2016 compared to net income of $479 million in the first quarter of 2016 and $361 million in the second quarter of 2015. |
▪ | Earnings per share was $0.25 in the second quarter of 2016 compared to earnings per share of $0.56 in the first quarter of 2016 and $0.42 in the second quarter of 2015. Sequentially the decrease was primarily due to the after-tax impact of the spectrum gain of $0.46 in the first quarter of 2016. Year-over-year, the decrease was due to several factors: higher interest expense related to higher debt balances with third parties, lower interest income, and lower income tax expense in the second quarter of 2015 due to the impact of income tax benefits for discrete income tax items recognized in 2015. These decreases were offset by higher operating income. |
17
CAPITAL EXPENDITURES
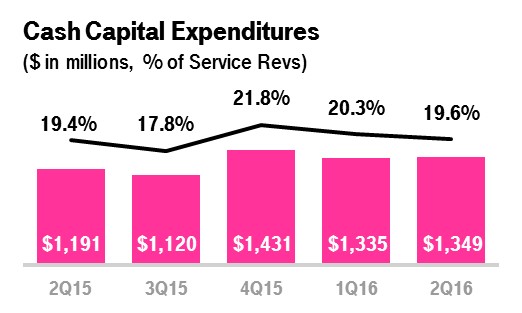
▪ | Cash capital expenditures for property and equipment were $1.349 billion in the second quarter of 2016 compared to $1.335 billion in the first quarter of 2016 and $1.191 billion in the second quarter of 2015. The sequential and year-over-year increases were primarily due to the timing of network spend in connection with T-Mobile’s build out of its 4G LTE network. |
▪ | Cash capital expenditures for property and equipment for the six months ended were $2.684 billion in 2016 compared to $2.173 billion for the same period in 2015, an increase of $511 million. |
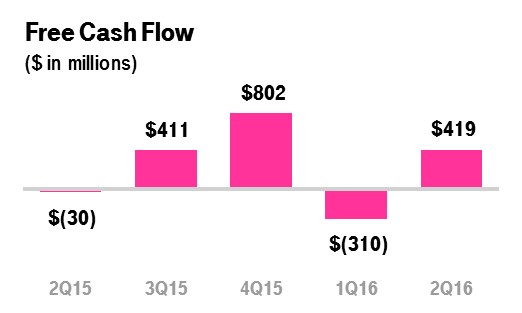
FREE CASH FLOW
▪ | Net cash provided by operating activities was $1.768 billion in the second quarter of 2016, compared to $1.025 billion in the first quarter of 2016 and $1.161 billion in the second quarter of 2015. |
▪ | Free Cash Flow was $419 million in the second quarter of 2016, compared to an outflow of $310 million in the first quarter of 2016 and an outflow of $30 million in the second quarter of 2015. Sequentially, the increase in free cash flow was primarily due to an increase in net cash provided by operating activities including sales of certain EIP receivables. Year-over-year, the increase in free cash flow was primarily due to an increase in net cash provided by operating activities, partially offset by an increase in cash capital expenditures. Sequentially and year-over-year, the net cash proceeds related to sales of certain EIP receivables increased by $0.4 billion. |
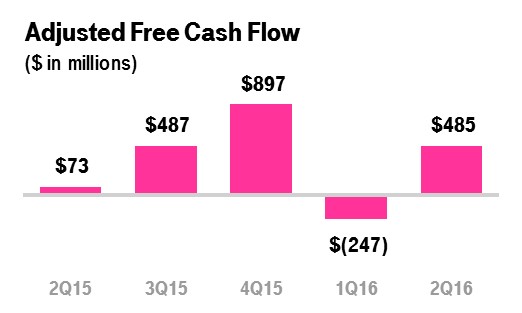
▪ | Adjusted Free Cash Flow was $485 million in the second quarter of 2016, compared to an outflow of $247 million in the first quarter of 2016 and an inflow of $73 million in the second quarter of 2015. Adjusted Free Cash Flow excludes decommissioning payments related to the one-time shutdown of the CDMA portion of the MetroPCS network. Decommissioning payments in the second quarter of 2016 were $66 million, compared to $63 million in the first quarter of 2016 and $103 million in the second quarter of 2015. |
▪ | Adjusted Free Cash Flow for the six months ended was $238 million in 2016 compared to an outflow of $349 million for the same period in 2015 in spite of cash capital expenditures which increased by $511 million, and the paydown of Accounts payable and accrued liabilities amounting to $837 million in the first half of 2016, compared to $546 million in the first half of 2015. |
18
CAPITAL STRUCTURE
▪ | Net debt, excluding tower obligations, at the end of the second quarter of 2016 was $21.894 billion. |
▪ | Total debt, excluding tower obligations, at the end of the second quarter of 2016 was $27.432 billion and was comprised of short-term debt of $258 million, long-term debt to affiliates of $5.600 billion, and long-term debt of $21.574 billion. |
▪ | The ratio of net debt, excluding tower obligations, to Adjusted EBITDA for the trailing last twelve month (“LTM”) period was 2.3x at the end of the second quarter of 2016 compared to 2.3x at the end of the first quarter of 2016 and 3.1x at the end of the second quarter of 2015. |
▪ | The Company’s cash position remains strong with $5.538 billion in cash and cash equivalents at the end of the second quarter of 2016. The cash and short-term investments balance decreased in the second quarter of 2016 compared to the first quarter of 2016 primarily due to the Company making a refundable deposit of $2.203 billion to a third party in connection with a potential asset purchase. |
▪ | On April 1, 2016, T-Mobile issued $1.0 billion of 6% Senior Notes due 2024 in a registered public offering. |
▪ | On April 25, 2016, T-Mobile entered into a purchase agreement with Deutsche Telekom AG (“Deutsche Telekom”), under which T-Mobile may, at its option, issue and sell to Deutsche Telekom up to $1.35 billion of 6.000% Senior Notes due 2024. |
▪ | On April 29, 2016, T-Mobile and certain of its affiliates, as guarantors, entered into another purchase agreement with Deutsche Telekom, under which T-Mobile may, at its option, issue and sell to Deutsche Telekom up to an additional $650 million of 6.000% Senior Notes due 2024. |
▪ | T-Mobile expects to use the net proceeds from these offerings for the purchase of spectrum licenses, or if not used for spectrum purchases, refinancing of existing debt, or general corporate purposes. |

19
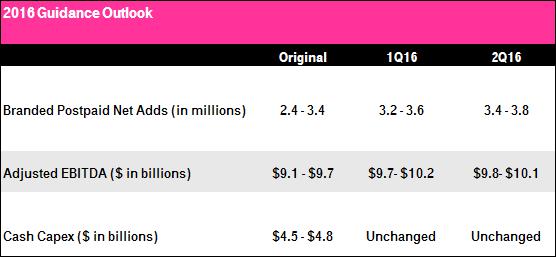
GUIDANCE
▪ | T-Mobile expects to drive further customer momentum while delivering strong growth in Adjusted EBITDA and free cash flow in 2016. |
▪ | Branded postpaid net customer additions for full-year 2016 are now expected to be between 3.4 and 3.8 million, an increase from the previous guidance range of 3.2 to 3.6 million. |
▪ | For full-year 2016, T-Mobile now expects Adjusted EBITDA to be in the range of $9.8 to $10.1 billion, narrowing the previous guidance range of $9.7 to $10.2 billion. This guidance includes the aggregate impact from leasing and Data Stash now expected to be approximately $0.8 to $1.0 billion, and the spectrum gain of $0.6 billion recognized in the first quarter of 2016. |
▪ | Cash capital expenditures for full-year 2016 are expected to be in the range of $4.5 to $4.8 billion, unchanged from previous guidance. |
UPCOMING EVENTS (All dates and attendance tentative)
▪ | Oppenheimer 19th Annual Technology, Internet & Communications Conference, August 9-10, 2016, Boston, MA |
▪ | Goldman Sachs 25th Annual Communacopia Conference, September 20-22, 2016, New York, NY |
▪ | Deutsche Bank Leveraged Finance Conference, September 26-28, 2016, Scottsdale, AZ |
20
CONTACT INFORMATION
Press:
Media Relations
T-Mobile US, Inc.
mediarelations@t-mobile.com
http://newsroom.t-mobile.com
Investor Relations:
Nils Paellmann, nils.paellmann@t-mobile.com
Ben Barrett, ben.barrett@t-mobile.com
Jon Perachio, jonathan.perachio@t-mobile.com
Cristal Dunkin, cristal.dunkin@t-mobile.com
877-281-TMUS or 212-358-3210
investor.relations@t-mobile.com
http://investor.t-mobile.com
21
T-Mobile US, Inc.
Condensed Consolidated Balance Sheets
(Unaudited)
(in millions, except share and per share amounts) | June 30, 2016 | December 31, 2015 | |||||
Assets | |||||||
Current assets | |||||||
Cash and cash equivalents | $ | 5,538 | $ | 4,582 | |||
Short-term investments | — | 2,998 | |||||
Accounts receivable, net of allowances of $125 and $116 | 1,866 | 1,788 | |||||
Equipment installment plan receivables, net | 1,831 | 2,378 | |||||
Accounts receivable from affiliates | 39 | 36 | |||||
Inventories | 1,388 | 1,295 | |||||
Asset purchase deposit | 2,203 | — | |||||
Other current assets | 1,415 | 1,813 | |||||
Total current assets | 14,280 | 14,890 | |||||
Property and equipment, net | 20,570 | 20,000 | |||||
Goodwill | 1,683 | 1,683 | |||||
Spectrum licenses | 25,536 | 23,955 | |||||
Other intangible assets, net | 486 | 594 | |||||
Equipment installment plan receivables due after one year, net | 831 | 847 | |||||
Other assets | 582 | 444 | |||||
Total assets | $ | 63,968 | $ | 62,413 | |||
Liabilities and Stockholders' Equity | |||||||
Current liabilities | |||||||
Accounts payable and accrued liabilities | $ | 6,985 | $ | 8,084 | |||
Payables to affiliates | 203 | 135 | |||||
Short-term debt | 258 | 182 | |||||
Deferred revenue | 936 | 717 | |||||
Other current liabilities | 370 | 410 | |||||
Total current liabilities | 8,752 | 9,528 | |||||
Long-term debt | 21,574 | 20,461 | |||||
Long-term debt to affiliates | 5,600 | 5,600 | |||||
Tower obligations | 2,634 | 2,658 | |||||
Deferred tax liabilities | 4,427 | 4,061 | |||||
Deferred rent expense | 2,548 | 2,481 | |||||
Other long-term liabilities | 1,038 | 1,067 | |||||
Total long-term liabilities | 37,821 | 36,328 | |||||
Commitments and contingencies | |||||||
Stockholders' equity | |||||||
5.50% Mandatory Convertible Preferred Stock Series A, par value $0.00001 per share, 100,000,000 shares authorized; 20,000,000 and 20,000,000 shares issued and outstanding; $1,000 and $1,000 aggregate liquidation value | — | — | |||||
Common Stock, par value $0.00001 per share, 1,000,000,000 shares authorized; 824,116,744 and 819,773,724 shares issued, 822,704,856 and 818,391,219 shares outstanding | — | — | |||||
Additional paid-in capital | 38,763 | 38,666 | |||||
Treasury stock, at cost, 1,411,888 and 1,382,505 shares issued | (1 | ) | — | ||||
Accumulated other comprehensive loss | (1 | ) | (1 | ) | |||
Accumulated deficit | (21,366 | ) | (22,108 | ) | |||
Total stockholders' equity | 17,395 | 16,557 | |||||
Total liabilities and stockholders' equity | $ | 63,968 | $ | 62,413 | |||
22
T-Mobile US, Inc.
Condensed Consolidated Statements of Comprehensive Income
(Unaudited)
Three Months Ended | Six Months Ended June 30, | ||||||||||||||||||
(in millions, except share and per share amounts) | June 30, 2016 | March 31, 2016 | June 30, 2015 | 2016 | 2015 | ||||||||||||||
Revenues | |||||||||||||||||||
Branded postpaid revenues | $ | 4,509 | $ | 4,302 | $ | 4,075 | $ | 8,811 | $ | 7,849 | |||||||||
Branded prepaid revenues | 2,119 | 2,025 | 1,861 | 4,144 | 3,703 | ||||||||||||||
Wholesale revenues | 207 | 200 | 164 | 407 | 322 | ||||||||||||||
Roaming and other service revenues | 53 | 51 | 44 | 104 | 89 | ||||||||||||||
Total service revenues | 6,888 | 6,578 | 6,144 | 13,466 | 11,963 | ||||||||||||||
Equipment revenues | 2,188 | 1,851 | 1,915 | 4,039 | 3,766 | ||||||||||||||
Other revenues | 146 | 170 | 120 | 316 | 228 | ||||||||||||||
Total revenues | 9,222 | 8,599 | 8,179 | 17,821 | 15,957 | ||||||||||||||
Operating expenses | |||||||||||||||||||
Cost of services, exclusive of depreciation and amortization shown separately below | 1,429 | 1,421 | 1,397 | 2,850 | 2,792 | ||||||||||||||
Cost of equipment sales | 2,619 | 2,374 | 2,661 | 4,993 | 5,340 | ||||||||||||||
Selling, general and administrative | 2,772 | 2,749 | 2,438 | 5,521 | 4,810 | ||||||||||||||
Depreciation and amortization | 1,575 | 1,552 | 1,075 | 3,127 | 2,162 | ||||||||||||||
Cost of MetroPCS business combination | 59 | 36 | 34 | 95 | 162 | ||||||||||||||
Gains on disposal of spectrum licenses | — | (636 | ) | (23 | ) | (636 | ) | (23 | ) | ||||||||||
Total operating expenses | 8,454 | 7,496 | 7,582 | 15,950 | 15,243 | ||||||||||||||
Operating income | 768 | 1,103 | 597 | 1,871 | 714 | ||||||||||||||
Other income (expense) | |||||||||||||||||||
Interest expense | (368 | ) | (339 | ) | (257 | ) | (707 | ) | (518 | ) | |||||||||
Interest expense to affiliates | (93 | ) | (79 | ) | (92 | ) | (172 | ) | (156 | ) | |||||||||
Interest income | 68 | 68 | 114 | 136 | 226 | ||||||||||||||
Other income (expense), net | (3 | ) | (2 | ) | 1 | (5 | ) | (7 | ) | ||||||||||
Total other expense, net | (396 | ) | (352 | ) | (234 | ) | (748 | ) | (455 | ) | |||||||||
Income before income taxes | 372 | 751 | 363 | 1,123 | 259 | ||||||||||||||
Income tax (expense) benefit | (147 | ) | (272 | ) | (2 | ) | (419 | ) | 39 | ||||||||||
Net income | 225 | 479 | 361 | 704 | 298 | ||||||||||||||
Dividends on preferred stock | (14 | ) | (14 | ) | (14 | ) | (28 | ) | (28 | ) | |||||||||
Net income attributable to common stockholders | $ | 211 | $ | 465 | $ | 347 | $ | 676 | $ | 270 | |||||||||
Net income | $ | 225 | $ | 479 | $ | 361 | $ | 704 | $ | 298 | |||||||||
Other comprehensive gain (loss), net of tax | |||||||||||||||||||
Unrealized gain (loss) on available-for-sale securities, net of tax effect of $2, ($2), $0, $0 and $0 | 3 | (3 | ) | — | — | — | |||||||||||||
Other comprehensive income (loss) | 3 | (3 | ) | — | — | — | |||||||||||||
Total comprehensive income | $ | 228 | $ | 476 | $ | 361 | $ | 704 | $ | 298 | |||||||||
Earnings per share | |||||||||||||||||||
Basic | $ | 0.26 | $ | 0.57 | $ | 0.43 | $ | 0.82 | $ | 0.33 | |||||||||
Diluted | $ | 0.25 | $ | 0.56 | $ | 0.42 | $ | 0.81 | $ | 0.33 | |||||||||
Weighted average shares outstanding | |||||||||||||||||||
Basic | 822,434,490 | 819,431,761 | 811,605,031 | 820,933,126 | 810,113,564 | ||||||||||||||
Diluted | 829,752,956 | 859,382,827 | 821,122,537 | 829,662,053 | 819,548,539 | ||||||||||||||
23
T-Mobile US, Inc.
Condensed Consolidated Statements of Cash Flows
(Unaudited)
Three Months Ended | Six Months Ended June 30, | ||||||||||||||||||
(in millions) | June 30, 2016 | March 31, 2016 | June 30, 2015 | 2016 | 2015 | ||||||||||||||
Operating activities | |||||||||||||||||||
Net income | $ | 225 | $ | 479 | $ | 361 | $ | 704 | $ | 298 | |||||||||
Adjustments to reconcile net income to net cash provided by operating activities | |||||||||||||||||||
Depreciation and amortization | 1,575 | 1,552 | 1,075 | 3,127 | 2,162 | ||||||||||||||
Stock-based compensation expense | 60 | 52 | 56 | 112 | 111 | ||||||||||||||
Deferred income tax expense (benefit) | 140 | 264 | (2 | ) | 404 | (52 | ) | ||||||||||||
Bad debt expense | 119 | 121 | 108 | 240 | 212 | ||||||||||||||
Losses from sales of receivables | 46 | 52 | 48 | 98 | 113 | ||||||||||||||
Deferred rent expense | 33 | 32 | 47 | 65 | 88 | ||||||||||||||
Gains on disposal of spectrum licenses | — | (636 | ) | (23 | ) | (636 | ) | (23 | ) | ||||||||||
Changes in operating assets and liabilities | |||||||||||||||||||
Accounts receivable | (105 | ) | (202 | ) | 62 | (307 | ) | (108 | ) | ||||||||||
Equipment installment plan receivables | 343 | 109 | (350 | ) | 452 | (579 | ) | ||||||||||||
Inventories | 3 | (801 | ) | 87 | (798 | ) | (58 | ) | |||||||||||
Deferred purchase price from sales of receivables | (204 | ) | 21 | (17 | ) | (183 | ) | (12 | ) | ||||||||||
Other current and long-term assets | (56 | ) | 185 | 35 | 129 | 126 | |||||||||||||
Accounts payable and accrued liabilities | (345 | ) | (492 | ) | (153 | ) | (837 | ) | (546 | ) | |||||||||
Other current and long-term liabilities | (74 | ) | 288 | (182 | ) | 214 | (90 | ) | |||||||||||
Other, net | 8 | 1 | 9 | 9 | 8 | ||||||||||||||
Net cash provided by operating activities | 1,768 | 1,025 | 1,161 | 2,793 | 1,650 | ||||||||||||||
Investing activities | |||||||||||||||||||
Purchases of property and equipment | (1,349 | ) | (1,335 | ) | (1,191 | ) | (2,684 | ) | (2,173 | ) | |||||||||
Purchases of spectrum licenses and other intangible assets, including deposits | (2,245 | ) | (594 | ) | (148 | ) | (2,839 | ) | (1,844 | ) | |||||||||
Sales of short-term investments | 2,923 | 75 | — | 2,998 | — | ||||||||||||||
Other, net | 4 | (6 | ) | 2 | (2 | ) | (12 | ) | |||||||||||
Net cash used in investing activities | (667 | ) | (1,860 | ) | (1,337 | ) | (2,527 | ) | (4,029 | ) | |||||||||
Financing activities | |||||||||||||||||||
Proceeds from issuance of long-term debt | 997 | — | — | 997 | — | ||||||||||||||
Repayments of capital lease obligations | (43 | ) | (36 | ) | (6 | ) | (79 | ) | (11 | ) | |||||||||
Repayments of short-term debt for purchases of inventory, property and equipment, net | (150 | ) | — | (185 | ) | (150 | ) | (248 | ) | ||||||||||
Repayments of long-term debt | (5 | ) | (5 | ) | — | (10 | ) | — | |||||||||||
Tax withholdings on share-based awards | (3 | ) | (46 | ) | (70 | ) | (49 | ) | (98 | ) | |||||||||
Dividends on preferred stock | (14 | ) | (14 | ) | (14 | ) | (28 | ) | (28 | ) | |||||||||
Other, net | 8 | 1 | 61 | 9 | 91 | ||||||||||||||
Net cash provided by (used in) financing activities | 790 | (100 | ) | (214 | ) | 690 | (294 | ) | |||||||||||
Change in cash and cash equivalents | 1,891 | (935 | ) | (390 | ) | 956 | (2,673 | ) | |||||||||||
Cash and cash equivalents | |||||||||||||||||||
Beginning of period | 3,647 | 4,582 | 3,032 | 4,582 | 5,315 | ||||||||||||||
End of period | $ | 5,538 | $ | 3,647 | $ | 2,642 | $ | 5,538 | $ | 2,642 | |||||||||
24
T-Mobile US, Inc. Supplementary Operating and Financial Data
Quarter | Six Months Ended June 30, | ||||||||||||||||||||||
(in thousands) | Q1 2015 | Q2 2015 | Q3 2015 | Q4 2015 | Q1 2016 | Q2 2016 | 2015 | 2016 | |||||||||||||||
Customers, end of period | |||||||||||||||||||||||
Branded postpaid phone customers | 26,835 | 27,595 | 28,438 | 29,355 | 30,232 | 30,878 | 27,595 | 30,878 | |||||||||||||||
Branded postpaid mobile broadband customers | 1,475 | 1,723 | 1,965 | 2,340 | 2,504 | 2,748 | 1,723 | 2,748 | |||||||||||||||
Total branded postpaid customers | 28,310 | 29,318 | 30,403 | 31,695 | 32,736 | 33,626 | 29,318 | 33,626 | |||||||||||||||
Branded prepaid customers | 16,389 | 16,567 | 17,162 | 17,631 | 18,438 | 18,914 | 16,567 | 18,914 | |||||||||||||||
Total branded customers | 44,699 | 45,885 | 47,565 | 49,326 | 51,174 | 52,540 | 45,885 | 52,540 | |||||||||||||||
Wholesale customers | 12,137 | 13,023 | 13,655 | 13,956 | 14,329 | 14,844 | 13,023 | 14,844 | |||||||||||||||
Total customers, end of period | 56,836 | 58,908 | 61,220 | 63,282 | 65,503 | 67,384 | 58,908 | 67,384 | |||||||||||||||
Quarter | Six Months Ended June 30, | ||||||||||||||||||||||
(in thousands) | Q1 2015 | Q2 2015 | Q3 2015 | Q4 2015 | Q1 2016 | Q2 2016 | 2015 | 2016 | |||||||||||||||
Net customer additions | |||||||||||||||||||||||
Branded postpaid phone customers | 991 | 760 | 843 | 917 | 877 | 646 | 1,751 | 1,523 | |||||||||||||||
Branded postpaid mobile broadband customers | 134 | 248 | 242 | 375 | 164 | 244 | 382 | 408 | |||||||||||||||
Total branded postpaid customers | 1,125 | 1,008 | 1,085 | 1,292 | 1,041 | 890 | 2,133 | 1,931 | |||||||||||||||
Branded prepaid customers | 73 | 178 | 595 | 469 | 807 | 476 | 251 | 1,283 | |||||||||||||||
Total branded customers | 1,198 | 1,186 | 1,680 | 1,761 | 1,848 | 1,366 | 2,384 | 3,214 | |||||||||||||||
Wholesale customers | 620 | 886 | 632 | 301 | 373 | 515 | 1,506 | 888 | |||||||||||||||
Total net customer additions | 1,818 | 2,072 | 2,312 | 2,062 | 2,221 | 1,881 | 3,890 | 4,102 | |||||||||||||||
Quarter | Six Months Ended June 30, | ||||||||||||||||||||||
Q1 2015 | Q2 2015 | Q3 2015 | Q4 2015 | Q1 2016 | Q2 2016 | 2015 | 2016 | ||||||||||||||||
Branded postpaid phone churn | 1.30 | % | 1.32 | % | 1.46 | % | 1.46 | % | 1.33 | % | 1.27 | % | 1.31 | % | 1.30 | % | |||||||
Branded prepaid churn | 4.62 | % | 4.93 | % | 4.09 | % | 4.20 | % | 3.84 | % | 3.91 | % | 4.78 | % | 3.88 | % | |||||||
25
T-Mobile US, Inc. Supplementary Operating and Financial Data (continued)
Quarter | Six Months Ended June 30, | ||||||||||||||
Q1 2015 | Q2 2015 | Q3 2015 | Q4 2015 | Q1 2016 | Q2 2016 | 2015 | 2016 | ||||||||
Financial Metrics | |||||||||||||||
Service revenues (in millions) | $5,819 | $6,144 | $6,302 | $6,556 | $6,578 | $6,888 | $11,963 | $13,466 | |||||||
Total revenues (in millions) | $7,778 | $8,179 | $7,849 | $8,247 | $8,599 | $9,222 | $15,957 | $17,821 | |||||||
Adjusted EBITDA (in millions) | $1,388 | $1,817 | $1,908 | $2,280 | $2,749 | $2,464 | $3,205 | $5,213 | |||||||
Adjusted EBITDA margin | 24% | 30% | 30% | 35% | 42% | 36% | 27% | 39% | |||||||
Net income (loss) (in millions) | $(63) | $361 | $138 | $297 | $479 | $225 | $298 | $704 | |||||||
Cash capex - Property & Equipment (in millions) | $982 | $1,191 | $1,120 | $1,431 | $1,335 | $1,349 | $2,173 | $2,684 | |||||||
Free Cash Flow (in millions) | $(493) | $(30) | $411 | $802 | $(310) | $419 | $(523) | $109 | |||||||
Adjusted Free Cash Flow (in millions) | $(422) | $73 | $487 | $897 | $(247) | $485 | $(349) | $238 | |||||||
Revenue Metrics | |||||||||||||||
Branded postpaid phone ARPU | $46.43 | $48.19 | $47.99 | $48.05 | $46.21 | $47.11 | $47.33 | $46.67 | |||||||
Branded postpaid ABPU | $60.94 | $63.29 | $62.96 | $63.74 | $61.90 | $62.59 | $62.14 | $62.25 | |||||||
Branded prepaid ARPU | $37.81 | $37.83 | $37.46 | $37.63 | $37.58 | $37.86 | $37.82 | $37.72 | |||||||
Branded postpaid accounts, end of period (in thousands) | 11,831 | 12,061 | 12,250 | 12,456 | 12,639 | 12,753 | 12,061 | 12,753 | |||||||
Branded postpaid customers per account | 2.39 | 2.43 | 2.48 | 2.54 | 2.59 | 2.64 | 2.43 | 2.64 | |||||||
Device Sales and Leased Devices | |||||||||||||||
Smartphone units (in millions) | 8.0 | 7.4 | 8.1 | 10.0 | 8.8 | 8.1 | 15.4 | 16.9 | |||||||
Branded postpaid handset upgrade rate | 8% | 9% | 9% | 10% | 7% | 6% | 17% | 13% | |||||||
Device Financing | |||||||||||||||
EIP financed (in millions) | $1,483 | $1,697 | $1,107 | $926 | $1,246 | $1,562 | $3,180 | $2,808 | |||||||
EIP billings (in millions) | $1,292 | $1,393 | $1,409 | $1,400 | $1,324 | $1,344 | $2,685 | $2,668 | |||||||
EIP receivables, net (in millions) | $4,842 | $5,114 | $4,771 | $3,225 | $3,053 | $2,662 | $5,114 | $2,662 | |||||||
Lease revenues (in millions) | $— | $— | $30 | $194 | $342 | $367 | $— | $709 | |||||||
Leased devices transferred from inventory to property and equipment, net of returns (in millions) | $— | $— | $822 | $1,463 | $653 | $52 | $— | $705 | |||||||
Customer Quality | |||||||||||||||
EIP receivables classified as prime | 52% | 52% | 52% | 48% | 47% | 42% | 52% | 42% | |||||||
Total bad debt expense and losses from sales of receivables (in millions) | $169 | $156 | $198 | $228 | $173 | $165 | $325 | $338 | |||||||
26
T-Mobile US, Inc.
Reconciliation of Non-GAAP Financial Measures to GAAP Financial Measures
(Unaudited)
This Investor Factbook includes non-GAAP financial measures. The non-GAAP financial measures should be considered in addition to, but not as a substitute for, the information provided in accordance with GAAP. Reconciliations for the non-GAAP financial measures to the most directly comparable GAAP financial measures are provided below. As T-Mobile does not or cannot predict or forecast certain of the expenses which are excluded from Adjusted EBITDA, but which would be required for the presentation of projected net income, T-Mobile does not provide projected net income or reconciliations to GAAP in the forward-looking financial measures.
Adjusted EBITDA is reconciled to net income (loss) as follows:
Quarter | Six Months Ended June 30, | ||||||||||||||||||||||||||||||
(in millions) | Q1 2015 | Q2 2015 | Q3 2015 | Q4 2015 | Q1 2016 | Q2 2016 | 2015 | 2016 | |||||||||||||||||||||||
Net income (loss) | $ | (63 | ) | $ | 361 | $ | 138 | $ | 297 | $ | 479 | $ | 225 | $ | 298 | $ | 704 | ||||||||||||||
Adjustments: | |||||||||||||||||||||||||||||||
Interest expense | 261 | 257 | 262 | 305 | 339 | 368 | 518 | 707 | |||||||||||||||||||||||
Interest expense to affiliates | 64 | 92 | 121 | 134 | 79 | 93 | 156 | 172 | |||||||||||||||||||||||
Interest income | (112 | ) | (114 | ) | (109 | ) | (85 | ) | (68 | ) | (68 | ) | (226 | ) | (136 | ) | |||||||||||||||
Other expense (income), net | 8 | (1 | ) | 1 | 3 | 2 | 3 | 7 | 5 | ||||||||||||||||||||||
Income tax expense (benefit) | (41 | ) | 2 | 100 | 184 | 272 | 147 | (39 | ) | 419 | |||||||||||||||||||||
Operating income | 117 | 597 | 513 | 838 | 1,103 | 768 | 714 | 1,871 | |||||||||||||||||||||||
Depreciation and amortization | 1,087 | 1,075 | 1,157 | 1,369 | 1,552 | 1,575 | 2,162 | 3,127 | |||||||||||||||||||||||
Cost of MetroPCS business combination | 128 | 34 | 193 | 21 | 36 | 59 | 162 | 95 | |||||||||||||||||||||||
Stock-based compensation (1) | 56 | 71 | 43 | 52 | 53 | 61 | 127 | 114 | |||||||||||||||||||||||
Other, net | — | 40 | 2 | — | 5 | 1 | 40 | 6 | |||||||||||||||||||||||
Adjusted EBITDA | $ | 1,388 | $ | 1,817 | $ | 1,908 | $ | 2,280 | $ | 2,749 | $ | 2,464 | $ | 3,205 | $ | 5,213 | |||||||||||||||
(1) | Stock-based compensation includes payroll tax impacts and may not agree to stock-based compensation expense in the condensed consolidated financial statements. |
27
T-Mobile US, Inc.
Reconciliation of Non-GAAP Financial Measures to GAAP Financial Measures (continued)
(Unaudited)
The following tables illustrate the calculation of ARPU and ABPU and reconcile these measures to the related service revenues, which we consider to be the most directly comparable GAAP financial measure to ARPU and ABPU:
Quarter | Six Months Ended June 30, | ||||||||||||||||||||||||||||||
(in millions, except average number of customers, ARPU and ABPU) | Q1 2015 | Q2 2015 | Q3 2015 | Q4 2015 | Q1 2016 | Q2 2016 | 2015 | 2016 | |||||||||||||||||||||||
Calculation of Branded Postpaid Phone ARPU | |||||||||||||||||||||||||||||||
Branded postpaid service revenues | $ | 3,774 | $ | 4,075 | $ | 4,197 | $ | 4,337 | $ | 4,302 | $ | 4,509 | $ | 7,849 | $ | 8,811 | |||||||||||||||
Less: Branded postpaid mobile broadband revenues | (109 | ) | (135 | ) | (165 | ) | (179 | ) | (182 | ) | (193 | ) | (244 | ) | (375 | ) | |||||||||||||||
Branded postpaid phone service revenues | $ | 3,665 | $ | 3,940 | $ | 4,032 | $ | 4,158 | $ | 4,120 | $ | 4,316 | $ | 7,605 | $ | 8,436 | |||||||||||||||
Divided by: Average number of branded postpaid phone customers (in thousands) and number of months in period | 26,313 | 27,250 | 28,003 | 28,849 | 29,720 | 30,537 | 26,781 | 30,128 | |||||||||||||||||||||||
Branded postpaid phone ARPU | $ | 46.43 | $ | 48.19 | $ | 47.99 | $ | 48.05 | $ | 46.21 | $ | 47.11 | $ | 47.33 | $ | 46.67 | |||||||||||||||
Calculation of Branded Postpaid ABPU | |||||||||||||||||||||||||||||||
Branded postpaid service revenues | $ | 3,774 | $ | 4,075 | $ | 4,197 | $ | 4,337 | $ | 4,302 | $ | 4,509 | $ | 7,849 | $ | 8,811 | |||||||||||||||
EIP billings | 1,292 | 1,393 | 1,409 | 1,400 | 1,324 | 1,344 | 2,685 | 2,668 | |||||||||||||||||||||||
Lease revenues | — | — | 30 | 194 | 342 | 367 | — | 709 | |||||||||||||||||||||||
Total billings for branded postpaid customers | $ | 5,066 | $ | 5,468 | $ | 5,636 | $ | 5,931 | $ | 5,968 | $ | 6,220 | $ | 10,534 | $ | 12,188 | |||||||||||||||
Divided by: Average number of branded postpaid customers (in thousands) and number of months in period | 27,717 | 28,797 | 29,838 | 31,013 | 32,140 | 33,125 | 28,257 | 32,633 | |||||||||||||||||||||||
Branded postpaid ABPU | $ | 60.94 | $ | 63.29 | $ | 62.96 | $ | 63.74 | $ | 61.90 | $ | 62.59 | $ | 62.14 | $ | 62.25 | |||||||||||||||
Calculation of Branded Prepaid ARPU | |||||||||||||||||||||||||||||||
Branded prepaid service revenues | $ | 1,842 | $ | 1,861 | $ | 1,894 | $ | 1,956 | $ | 2,025 | $ | 2,119 | $ | 3,703 | $ | 4,144 | |||||||||||||||
Divided by: Average number of branded prepaid customers (in thousands) and number of months in period | 16,238 | 16,396 | 16,853 | 17,330 | 17,962 | 18,662 | 16,317 | 18,312 | |||||||||||||||||||||||
Branded prepaid ARPU | $ | 37.81 | $ | 37.83 | $ | 37.46 | $ | 37.63 | $ | 37.58 | $ | 37.86 | $ | 37.82 | $ | 37.72 | |||||||||||||||
Net debt (excluding Tower Obligations) to last twelve months adjusted EBITDA ratio is calculated as follows:
(in millions, except net debt ratio) | Mar 31, 2015 | Jun 30, 2015 | Sep 30, 2015 | Dec 31, 2015 | Mar 31, 2016 | Jun 30, 2016 | |||||||||||||||||
Short-term debt | $ | 467 | $ | 386 | $ | 114 | $ | 182 | $ | 365 | $ | 258 | |||||||||||
Long-term debt to affiliates | 5,600 | 5,600 | 5,600 | 5,600 | 5,600 | 5,600 | |||||||||||||||||
Long-term debt (1) | 16,248 | 16,373 | 16,430 | 20,461 | 20,505 | 21,574 | |||||||||||||||||
Less: Cash and cash equivalents | (3,032 | ) | (2,642 | ) | (2,633 | ) | (4,582 | ) | (3,647 | ) | (5,538 | ) | |||||||||||
Less: Short-term investments | — | — | — | (2,998 | ) | (2,925 | ) | — | |||||||||||||||
Net Debt (excluding Tower Obligations) | $ | 19,283 | $ | 19,717 | $ | 19,511 | $ | 18,663 | $ | 19,898 | $ | 21,894 | |||||||||||
Divided by: Last twelve months Adjusted EBITDA | $ | 5,936 | $ | 6,302 | $ | 6,864 | $ | 7,393 | $ | 8,754 | $ | 9,401 | |||||||||||
Net Debt (excluding Tower Obligations) to Last Twelve Months Adjusted EBITDA Ratio | 3.2 | 3.1 | 2.8 | 2.5 | 2.3 | 2.3 | |||||||||||||||||
(1) | Long-term debt as of March 31, 2015 through December 31, 2015 has been restated for the adoption of Accounting Standards Update 2015-03, “Simplifying the Presentation of Debt Issuance Costs” in the first quarter of 2016. The impact to the Net Debt (excluding Tower Obligations) to Last Twelve Months Adjusted EBITDA Ratio was not significant. |
28
T-Mobile US, Inc.
Reconciliation of Non-GAAP Financial Measures to GAAP Financial Measures (continued)
(Unaudited)
Free cash flow and adjusted free cash flow are calculated as follows:
Quarter | Six Months Ended June 30, | ||||||||||||||||||||||||||||||
(in millions) | Q1 2015 | Q2 2015 | Q3 2015 | Q4 2015 | Q1 2016 | Q2 2016 | 2015 | 2016 | |||||||||||||||||||||||
Net cash provided by operating activities | $ | 489 | $ | 1,161 | $ | 1,531 | $ | 2,233 | $ | 1,025 | $ | 1,768 | $ | 1,650 | $ | 2,793 | |||||||||||||||
Cash purchases of property and equipment | (982 | ) | (1,191 | ) | (1,120 | ) | (1,431 | ) | (1,335 | ) | (1,349 | ) | (2,173 | ) | (2,684 | ) | |||||||||||||||
Free Cash Flow | (493 | ) | (30 | ) | 411 | 802 | (310 | ) | 419 | (523 | ) | 109 | |||||||||||||||||||
MetroPCS CDMA network decommissioning payments | 71 | 103 | 76 | 95 | 63 | 66 | 174 | 129 | |||||||||||||||||||||||
Adjusted Free Cash Flow | $ | (422 | ) | $ | 73 | $ | 487 | $ | 897 | $ | (247 | ) | $ | 485 | $ | (349 | ) | $ | 238 | ||||||||||||
29
Definitions of Terms
Operating and financial measures are utilized by T-Mobile's management to evaluate its operating performance and, in certain cases, its ability to meet liquidity requirements. Although companies in the wireless industry may not define measures in precisely the same way, T-Mobile believes the measures facilitate key operating performance comparisons with other companies in the wireless industry to provide management, investors and analysts with useful information to assess and evaluate past performance and assist in forecasting future performance.
1. | Customer - SIM card with a unique T-Mobile mobile identity number which generates revenue. Branded customers generally include customers that are qualified either for postpaid service, where they generally pay after incurring service, or prepaid service, where they generally pay in advance. Wholesale customers include Machine-to-Machine (M2M) and Mobile Virtual Network Operator (MVNO) customers that operate on T-Mobile's network, but are managed by wholesale partners. |
2. | Churn - Number of customers whose service was disconnected as a percentage of the average number of customers during the specified period. The number of customers whose service was disconnected is presented net of customers that subsequently have their service restored within a certain period of time. |
3. | Customers per account - The number of branded postpaid customers as of the end of the period divided by the number of branded postpaid accounts as of the end of the period. An account may include branded postpaid phone and mobile broadband customers. |
4. | Average Revenue Per User (ARPU) - Average monthly service revenue earned from customers. Service revenues for the specified period divided by the average customers during the period, further divided by the number of months in the period. |
Branded postpaid phone ARPU excludes mobile broadband customers and related revenues.
Average Billings per User (ABPU) - Average monthly branded postpaid service revenue earned from customers plus monthly EIP billings and lease revenues divided by the average branded postpaid customers during the period, further divided by the number of months in the period. T-Mobile believes branded postpaid ABPU is indicative of estimated cash collections, including device financing payments, from T-Mobile's customers each month.
Service revenues - Branded postpaid, including handset insurance, branded prepaid, wholesale, and roaming and other service revenues.
5. | Cost of services - Costs directly attributable to providing wireless service through the operation of T-Mobile's network, including direct switch and cell site costs, such as rent, network access and transport costs, utilities, maintenance, associated labor costs, long distance costs, regulatory program costs, roaming fees paid to other carriers and data content costs. |
Cost of equipment sales - Costs of devices and accessories sold to customers and dealers, device costs to fulfill insurance and warranty claims, write-downs of inventory related to shrinkage and obsolescence, and shipping and handling costs.
Selling, general and administrative expenses - Costs not directly attributable to providing wireless service for the operation of sales, customer care and corporate activities. These include commissions paid to dealers and retail employees for activations and upgrades, labor and facilities costs associated with retail sales force and administrative space, marketing and promotional costs, customer support and billing, bad debt expense and administrative support activities.
6. | Adjusted EBITDA - Earnings before interest expense (net of interest income), tax, depreciation, amortization, stock-based compensation and expenses not reflective of T-Mobile's ongoing operating performance. Adjusted EBITDA margin represents Adjusted EBITDA divided by service revenues. Adjusted EBITDA is a non-GAAP financial measure utilized by T-Mobile's management to monitor the financial performance of its operations. T-Mobile uses Adjusted EBITDA internally as a metric to evaluate and compensate its personnel and management for their performance, and as a benchmark to evaluate T-Mobile's operating performance in comparison to its competitors. Management believes analysts and investors use Adjusted EBITDA as a supplemental measure to evaluate overall operating performance and facilitate comparisons with other wireless communications companies because it is more indicative of T-Mobile's ongoing performance and trends by excluding certain expenses which are either nonrecurring or may not be indicative of T-Mobile's directly controllable operating results. Adjusted EBITDA has limitations as an analytical tool and should not be considered in isolation or as a substitute for income from operations, net income or any other measure of financial performance reported in accordance with GAAP. The reconciliation of Adjusted EBITDA to net income (loss) is detailed in the Reconciliation of Non-GAAP Financial Measures to GAAP Financial Measures schedule. |
7. | Cash capital expenditures - Amounts paid for construction and the purchase of property and equipment. |
8. | Smartphones - UMTS/HSPA/HSPA+ 21/HSPA+ 42/4G LTE enabled converged devices, which integrate voice and data services. |
9. | Free Cash Flow - Net cash provided by operating activities less cash capital expenditures for property and equipment. Free Cash Flow is utilized by T-Mobile's management, investors, and analysts to evaluate cash available to pay debt and provide further investment in the business. The reconciliation of Free Cash Flow to net cash provided by operating activities is detailed in the Reconciliation of Non-GAAP Financial Measures to GAAP Financial Measures schedule. |
10. | Adjusted Free Cash Flow - Free Cash Flow excluding decommissioning payments related to the shutdown of the CDMA portion of the MetroPCS network. |
11. | Net debt - Short-term debt, long-term debt to affiliates, and long-term debt (excluding tower obligations), less cash and cash equivalents and short-term investments. |
30
Forward-Looking Statements
This Investor Factbook includes "forward-looking statements" within the meaning of the U.S. federal securities laws. Any statements made herein that are not statements of historical fact, including statements about T-Mobile US, Inc.'s plans, outlook, beliefs, opinion, projections, guidance, strategy, expected network modernization and other advancements, are forward-looking statements. Generally, forward-looking statements may be identified by words such as "anticipate," "expect," "suggests," "plan," “project,” "believe," "intend," "estimates," "targets," "views," "may," "will," "forecast," and other similar expressions. The forward-looking statements speak only as of the date made, are based on current assumptions and expectations, and involve a number of risks and uncertainties. Important factors that could affect future results and cause those results to differ materially from those expressed in the forward-looking statements include, among others, the following: our ability to compete in the highly competitive U.S. wireless telecommunications industry; adverse conditions in the U.S. and international economies and markets; significant capital commitments and the capital expenditures required to effect our business plan; our ability to adapt to future changes in technology, enhance existing offerings, and introduce new offerings to address customers' changing demands; changes in legal and regulatory requirements, including any change or increase in restrictions on our ability to operate our network; our ability to successfully maintain and improve our network, and the possibility of incurring additional costs in doing so; major equipment failures; severe weather conditions or other force majeure events; and other risks described in our filings with the Securities and Exchange Commission, including those described in our most recently filed Annual Report on Form 10-K. You should not place undue reliance on these forward-looking statements. We do not undertake to update forward-looking statements, whether as a result of new information, future events or otherwise, except as required by law.
About T-Mobile US, Inc.
As America's Un-carrier, T-Mobile US, Inc. (NASDAQ: TMUS) is redefining the way consumers and businesses buy wireless services through leading product and service innovation. The Company's advanced nationwide 4G LTE network delivers outstanding wireless experiences to 67.4 million customers who are unwilling to compromise on quality and value. Based in Bellevue, Washington, T-Mobile US provides services through its subsidiaries and operates its flagship brands, T-Mobile and MetroPCS. For more information, please visit http://www.T-Mobile.com or join the conversation on Twitter using $TMUS.
31