Attached files
| file | filename |
|---|---|
| EX-99.1 - EXHIBIT 99.1 - ENTEGRIS INC | d232320dex991.htm |
| 8-K - FORM 8-K - ENTEGRIS INC | d232320d8k.htm |
Earnings Summary Second Quarter FY 2016 JULY 27, 2016 Exhibit 99.2
SAFE HARBOR Certain information contained in this presentation may constitute forward-looking statements within the meaning of the Private Securities Litigation Reform Act of 1995. These forward-looking statements involve substantial risks and uncertainties that could cause actual results to differ materially from the results expressed in, or implied by, these forward-looking statements. Statements that include such words as “anticipate,” “believe,” “estimate,” “expect,” “forecast,” “may,” “will,” “should” or the negative thereof and similar expressions as they relate to Entegris or our management are intended to identify such forward-looking statements. These statements are not guarantees of future performance and involve risks, uncertainties and assumptions that are difficult to predict. These risks include, but are not limited to, fluctuations in the market price of Entegris’ stock, Entegris’ future operating results, other acquisition and investment opportunities available to Entegris, general business and market conditions and other factors. Additional information concerning these and other risk factors may be found in previous financial press releases issued by Entegris and Entegris’ periodic public filings with the Securities and Exchange Commission, including discussions appearing under the headings “Risks Relating to our Business and Industry,” “Risks Related to Our Indebtedness,” “Manufacturing Risks,” “International Risks” and “Risks Related to Owning Our Common Stock” in Item 1A of our Annual Report on Form 10-K for the fiscal year ended December 31, 2015, filed with the Securities and Exchange Commission on February 29, 2016, as well as other matters and important factors disclosed previously and from time to time in the filings of Entegris with the U.S. Securities and Exchange Commission. Except as required under the federal securities laws and the rules and regulations of the Securities and Exchange Commission, we undertake no obligation to update publicly any forward-looking statements contained herein.
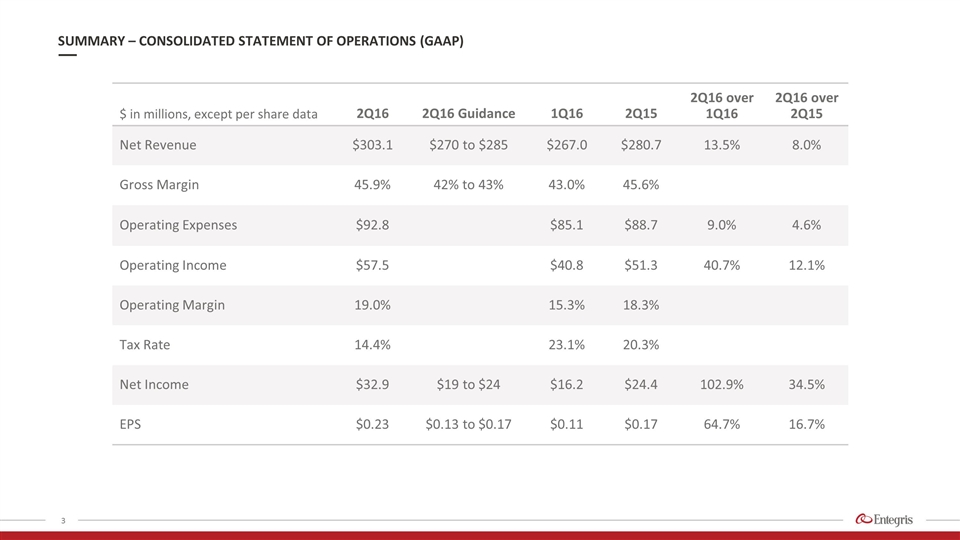
$ in millions, except per share data 2Q16 2Q16 Guidance 1Q16 2Q15 2Q16 over 1Q16 2Q16 over 2Q15 Net Revenue $303.1 $270 to $285 $267.0 $280.7 13.5% 8.0% Gross Margin 45.9% 42% to 43% 43.0% 45.6% Operating Expenses $92.8 $85.1 $88.7 9.0% 4.6% Operating Income $57.5 $40.8 $51.3 40.7% 12.1% Operating Margin 19.0% 15.3% 18.3% Tax Rate 14.4% 23.1% 20.3% Net Income $32.9 $19 to $24 $16.2 $24.4 102.9% 34.5% EPS $0.23 $0.13 to $0.17 $0.11 $0.17 64.7% 16.7% SUMMARY – CONSOLIDATED STATEMENT OF OPERATIONS (GAAP)
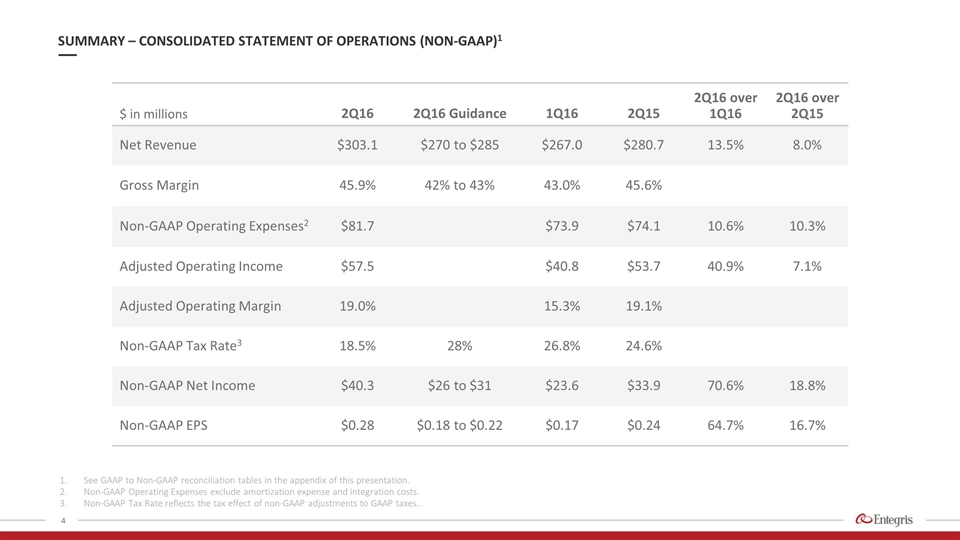
$ in millions 2Q16 2Q16 Guidance 1Q16 2Q15 2Q16 over 1Q16 2Q16 over 2Q15 Net Revenue $303.1 $270 to $285 $267.0 $280.7 13.5% 8.0% Gross Margin 45.9% 42% to 43% 43.0% 45.6% Non-GAAP Operating Expenses2 $81.7 $73.9 $74.1 10.6% 10.3% Adjusted Operating Income $57.5 $40.8 $53.7 40.9% 7.1% Adjusted Operating Margin 19.0% 15.3% 19.1% Non-GAAP Tax Rate3 18.5% 28% 26.8% 24.6% Non-GAAP Net Income $40.3 $26 to $31 $23.6 $33.9 70.6% 18.8% Non-GAAP EPS $0.28 $0.18 to $0.22 $0.17 $0.24 64.7% 16.7% SUMMARY – CONSOLIDATED STATEMENT OF OPERATIONS (NON-GAAP)1 See GAAP to Non-GAAP reconciliation tables in the appendix of this presentation. Non-GAAP Operating Expenses exclude amortization expense and integration costs. Non-GAAP Tax Rate reflects the tax effect of non-GAAP adjustments to GAAP taxes..
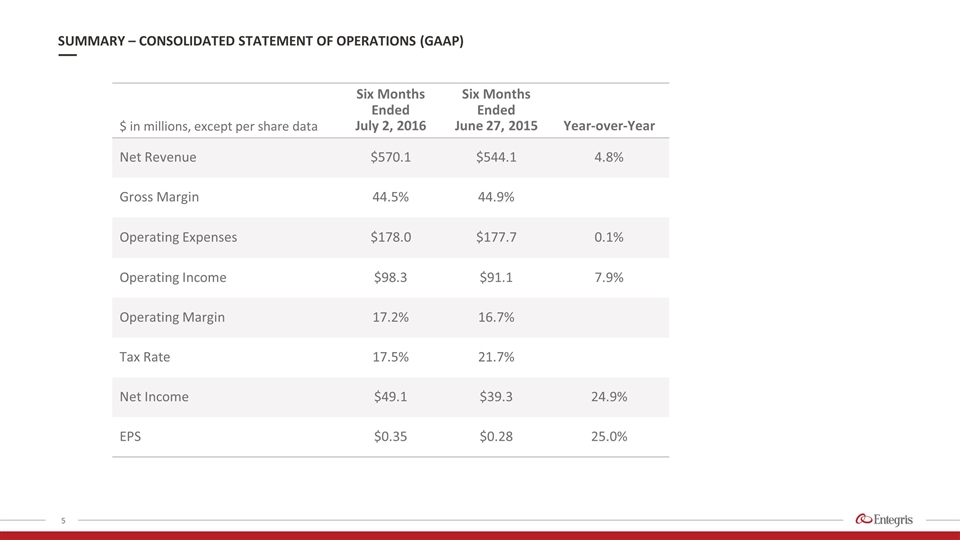
$ in millions, except per share data Six Months Ended July 2, 2016 Six Months Ended June 27, 2015 Year-over-Year Net Revenue $570.1 $544.1 4.8% Gross Margin 44.5% 44.9% Operating Expenses $178.0 $177.7 0.1% Operating Income $98.3 $91.1 7.9% Operating Margin 17.2% 16.7% Tax Rate 17.5% 21.7% Net Income $49.1 $39.3 24.9% EPS $0.35 $0.28 25.0% SUMMARY – CONSOLIDATED STATEMENT OF OPERATIONS (GAAP)
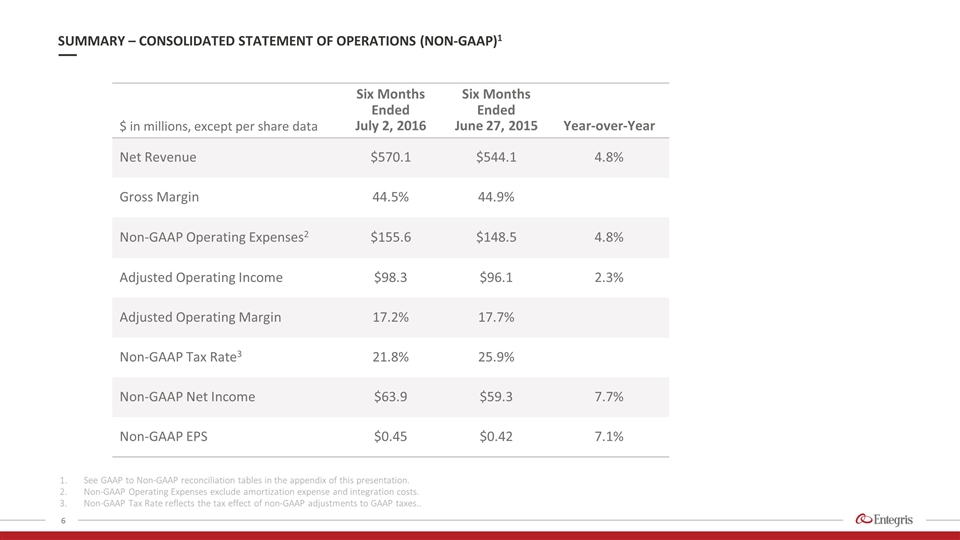
$ in millions, except per share data Six Months Ended July 2, 2016 Six Months Ended June 27, 2015 Year-over-Year Net Revenue $570.1 $544.1 4.8% Gross Margin 44.5% 44.9% Non-GAAP Operating Expenses2 $155.6 $148.5 4.8% Adjusted Operating Income $98.3 $96.1 2.3% Adjusted Operating Margin 17.2% 17.7% Non-GAAP Tax Rate3 21.8% 25.9% Non-GAAP Net Income $63.9 $59.3 7.7% Non-GAAP EPS $0.45 $0.42 7.1% SUMMARY – CONSOLIDATED STATEMENT OF OPERATIONS (NON-GAAP)1 See GAAP to Non-GAAP reconciliation tables in the appendix of this presentation. Non-GAAP Operating Expenses exclude amortization expense and integration costs. Non-GAAP Tax Rate reflects the tax effect of non-GAAP adjustments to GAAP taxes..
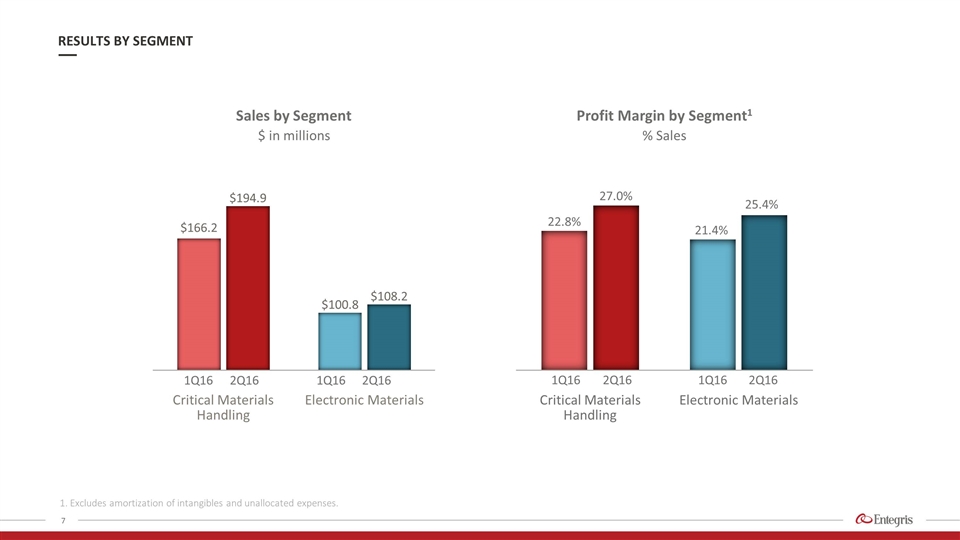
1. Excludes amortization of intangibles and unallocated expenses. RESULTS BY SEGMENT Sales by Segment 1Q16 2Q16 1Q16 2Q16 $ in millions Profit Margin by Segment1 1Q16 2Q16 1Q16 2Q16 % Sales
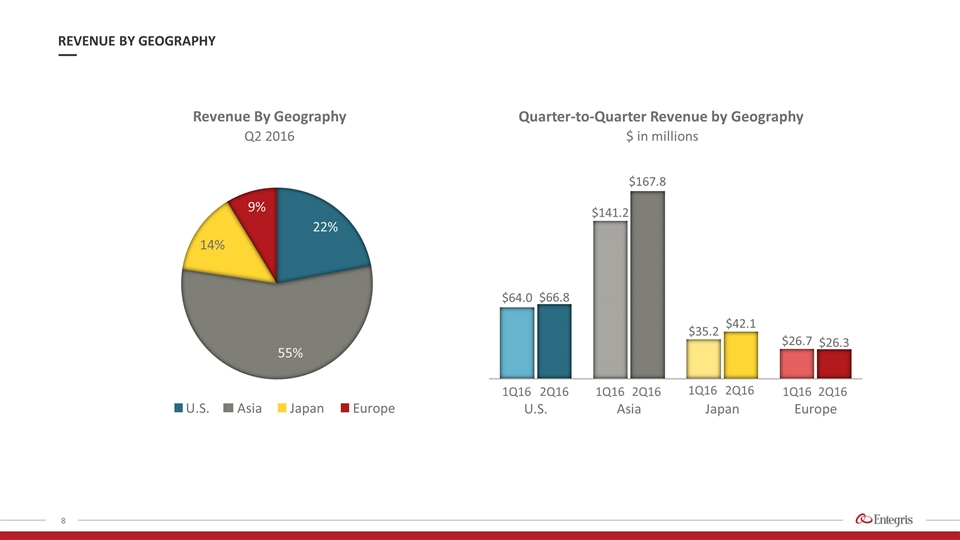
REVENUE BY GEOGRAPHY Revenue By Geography Asia Japan Europe U.S. Quarter-to-Quarter Revenue by Geography $ in millions 1Q16 2Q16 1Q16 2Q16 1Q16 2Q16 Q2 2016 1Q16 2Q16
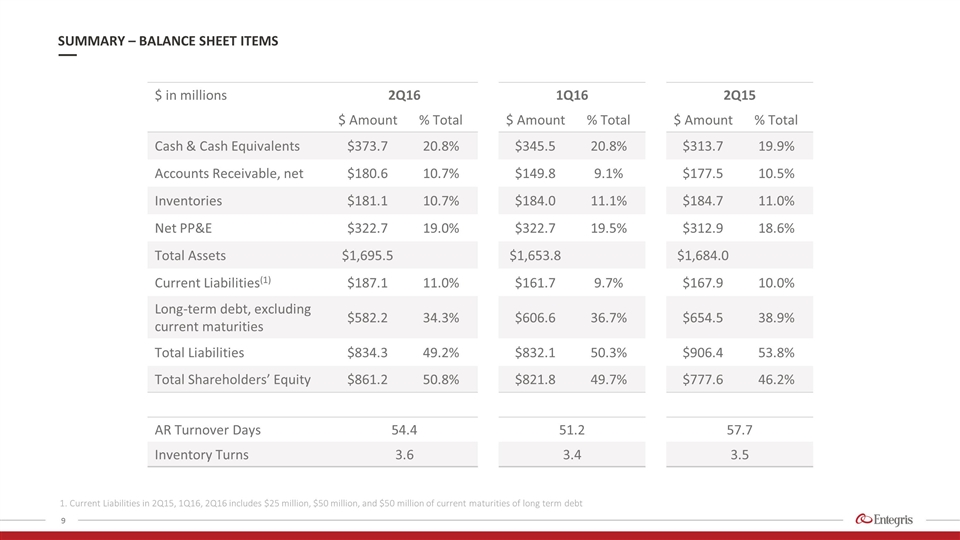
$ in millions 2Q16 1Q16 2Q15 $ Amount % Total $ Amount % Total $ Amount % Total Cash & Cash Equivalents $373.7 20.8% $345.5 20.8% $313.7 19.9% Accounts Receivable, net $180.6 10.7% $149.8 9.1% $177.5 10.5% Inventories $181.1 10.7% $184.0 11.1% $184.7 11.0% Net PP&E $322.7 19.0% $322.7 19.5% $312.9 18.6% Total Assets $1,695.5 $1,653.8 $1,684.0 Current Liabilities(1) $187.1 11.0% $161.7 9.7% $167.9 10.0% Long-term debt, excluding current maturities $582.2 34.3% $606.6 36.7% $654.5 38.9% Total Liabilities $834.3 49.2% $832.1 50.3% $906.4 53.8% Total Shareholders’ Equity $861.2 50.8% $821.8 49.7% $777.6 46.2% AR Turnover Days 54.4 51.2 57.7 Inventory Turns 3.6 3.4 3.5 SUMMARY – BALANCE SHEET ITEMS 1. Current Liabilities in 2Q15, 1Q16, 2Q16 includes $25 million, $50 million, and $50 million of current maturities of long term debt
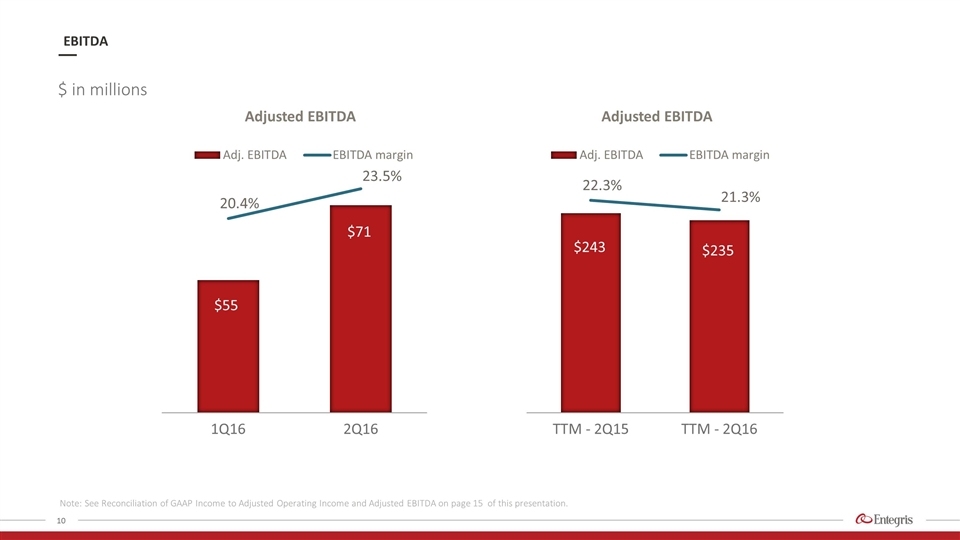
$ in millions Note: See Reconciliation of GAAP Income to Adjusted Operating Income and Adjusted EBITDA on page 15 of this presentation. EBITDA
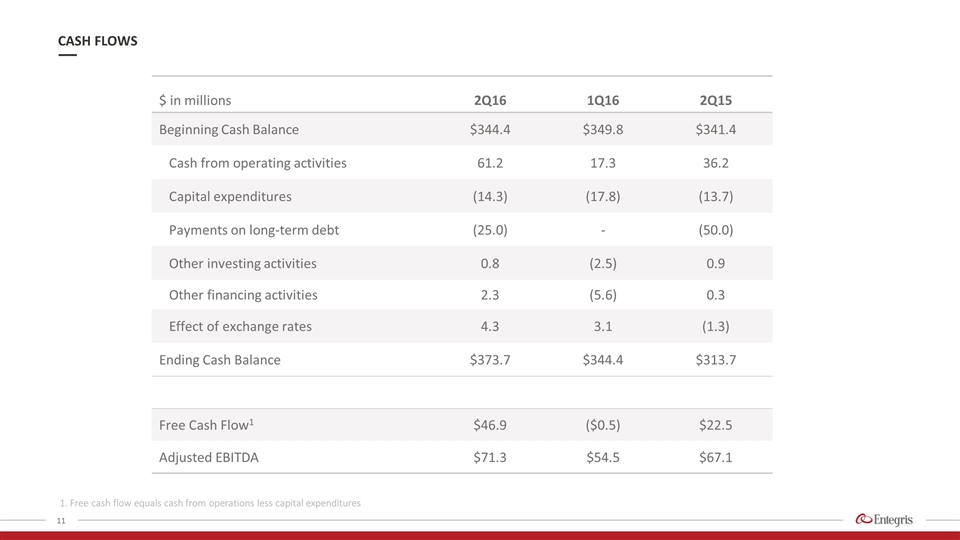
$ in millions 2Q16 1Q16 2Q15 Beginning Cash Balance $344.4 $349.8 $341.4 Cash from operating activities 61.2 17.3 36.2 Capital expenditures (14.3) (17.8) (13.7) Payments on long-term debt (25.0) - (50.0) Other investing activities 0.8 (2.5) 0.9 Other financing activities 2.3 (5.6) 0.3 Effect of exchange rates 4.3 3.1 (1.3) Ending Cash Balance $373.7 $344.4 $313.7 Free Cash Flow1 $46.9 ($0.5) $22.5 Adjusted EBITDA $71.3 $54.5 $67.1 CASH FLOWS 1. Free cash flow equals cash from operations less capital expenditures
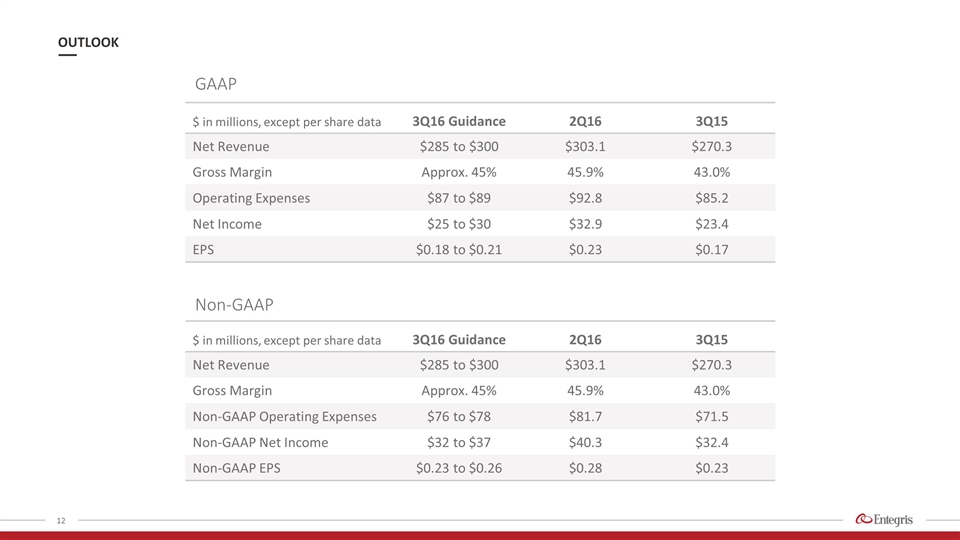
OUTLOOK GAAP $ in millions, except per share data 3Q16 Guidance 2Q16 3Q15 Net Revenue $285 to $300 $303.1 $270.3 Gross Margin Approx. 45% 45.9% 43.0% Operating Expenses $87 to $89 $92.8 $85.2 Net Income $25 to $30 $32.9 $23.4 EPS $0.18 to $0.21 $0.23 $0.17 $ in millions, except per share data 3Q16 Guidance 2Q16 3Q15 Net Revenue $285 to $300 $303.1 $270.3 Gross Margin Approx. 45% 45.9% 43.0% Non-GAAP Operating Expenses $76 to $78 $81.7 $71.5 Non-GAAP Net Income $32 to $37 $40.3 $32.4 Non-GAAP EPS $0.23 to $0.26 $0.28 $0.23 Non-GAAP
Entegris® and the Entegris Rings Design® are trademarks of Entegris, Inc. ©2016 Entegris, Inc. All rights reserved.

APPENDIX: NON-GAAP RECONCILIATION TABLES
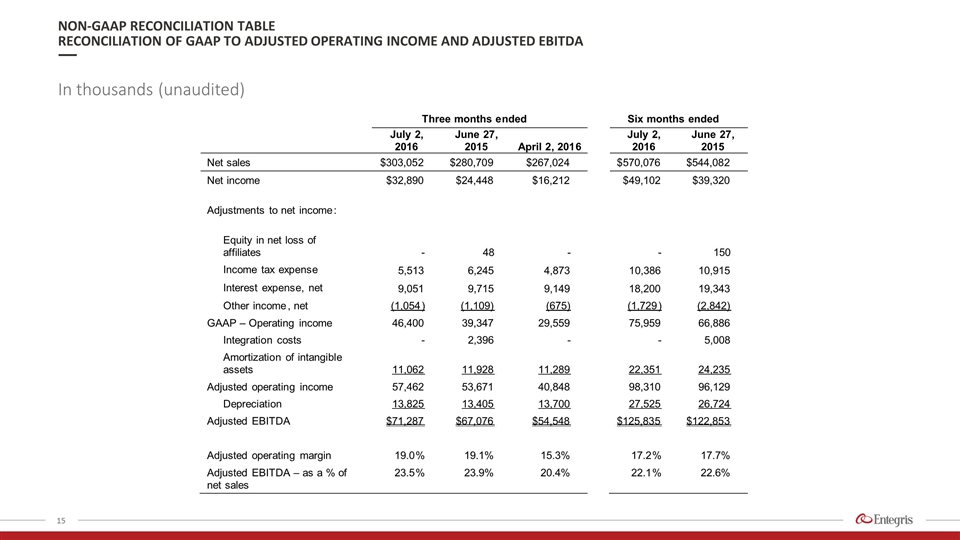
NON-GAAP RECONCILIATION TABLE RECONCILIATION OF GAAP TO ADJUSTED OPERATING INCOME AND ADJUSTED EBITDA In thousands (unaudited) Three months e nded Six months ended July 2, 2016 June 27 , 2015 April 2 , 201 6 July 2, 2016 June 27 , 2015 Net sales $303,052 $280,709 $267,024 $ 570,076 $544,082 Net income $32,890 $24,448 $16,212 $ 49,102 $39,320 Adjustments to net income : Equity in net loss of affiliates - 48 - - 150 Income tax expense 5,513 6,245 4,873 1 0,386 10,915 Interest expense, net 9,051 9,715 9,149 18,200 19,343 Other income , net (1,054 ) (1,109) (675) (1,729 ) (2,842) GAAP – Operating income 46,400 39,347 29,559 75,959 66,886 Integration costs - 2,396 - - 5,008 Amortization of intangible assets 11,062 11,928 11,289 22,351 24,235 Adjusted operating income 57,462 53,671 40,848 98,310 96,129 Depreciation 13,825 13,405 13,700 27,525 26,724 Adjusted EBITDA $71,287 $67,076 $54,548 $125,835 $122,853 Adjusted operating margin 19.0 % 19.1% 15.3% 17.2 % 17.7% Adjusted EBITDA – as a % of net sales 23.5 % 23.9% 20.4% 22.1 % 22.6%
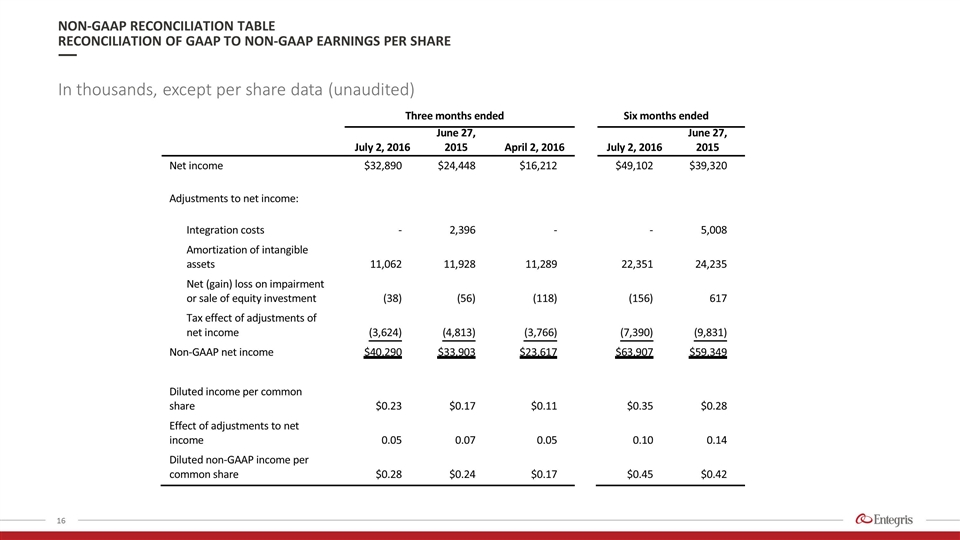
NON-GAAP RECONCILIATION TABLE RECONCILIATION OF GAAP TO NON-GAAP EARNINGS PER SHARE In thousands, except per share data (unaudited) T h r e e m o n t h s e n d e d S i x m o n t h s e n d e d J u l y 2 , 2 0 1 6 J u n e 2 7 , 2 0 1 5 A p r i l 2 , 2 0 1 6 J u l y 2 , 2 0 1 6 J u n e 2 7 , 2 0 1 5 N e t i n c o m e $ 3 2 , 8 9 0 $ 2 4 , 4 4 8 $ 1 6 , 2 1 2 $ 4 9 , 1 0 2 $ 3 9 , 3 2 0 A d j u s t m e n t s t o n e t i n c o m e : I n t e g r a t i o n c o s t s - 2 , 3 9 6 - - 5 , 0 0 8 A m o r t i z a t i o n o f i n t a n g i b l e a s s e t s 1 1 , 0 6 2 1 1 , 9 2 8 1 1 , 2 8 9 2 2 , 3 5 1 2 4 , 2 3 5 N e t ( g a i n ) l o s s o n i m p a i r m e n t o r s a l e o f e q u i t y i n v e s t m e n t ( 3 8 ) ( 5 6 ) ( 1 1 8 ) ( 1 5 6 ) 6 1 7 T a x e f f e c t o f a d j u s t m e n t s o f n e t i n c o m e ( 3 , 6 2 4 ) ( 4 , 8 1 3 ) ( 3 , 7 6 6 ) ( 7 , 3 9 0 ) ( 9 , 8 3 1 ) N o n - G A A P n e t i n c o m e $ 4 0 , 2 9 0 $ 3 3 , 9 0 3 $ 2 3 , 6 1 7 $ 6 3 , 9 0 7 $ 5 9 , 3 4 9 D i l u t e d i n c o m e p e r c o m m o n s h a r e $ 0 . 2 3 $ 0 . 1 7 $ 0 . 1 1 $ 0 . 3 5 $ 0 . 2 8 E f f e c t o f a d j u s t m e n t s t o n e t i n c o m e 0 . 0 5 0 . 0 7 0 . 0 5 0 . 1 0 0 . 1 4 D i l u t e d n o n - G A A P i n c o m e p e r c o m m o n s h a r e $ 0 . 2 8 $ 0 . 2 4 $ 0 . 1 7 $ 0 . 4 5 $ 0 . 4 2
