Attached files
| file | filename |
|---|---|
| 8-K - 8-K - BOK FINANCIAL CORP | a20160630pressreleaseslide.htm |

1
Second Quarter 2016
Earnings Conference Call
July 27, 2016

2
Forward-Looking Statements: This presentation contains statements that are based on management’s
beliefs, assumptions, current expectations, estimates, and projections about BOK Financial Corporation, the
financial services industry, and the economy generally. These remarks constitute forward-looking statements
within the meaning of the Private Securities Litigation Reform Act of 1995. Words such as “anticipates”,
“believes”, “estimates”, “expects”, “forecasts”, “plans”, “projects”, variations of such words, and similar
expressions are intended to identify such forward-looking statements. Management judgments relating to,
and discussion of the provision and allowance for credit losses involve judgments as to future events and are
inherently forward-looking statements. Assessments that BOK Financial’s acquisitions and other growth
endeavors will be profitable are necessary statements of belief as to the outcome of future events, based in
part on information provided by others which BOKF has not independently verified. These statements are not
guarantees of future performance and involve certain risks, uncertainties, and assumptions which are difficult
to predict with regard to timing, extent, likelihood and degree of occurrence. Therefore, actual results and
outcomes may materially differ from what is expressed, implied or forecasted in such forward-looking
statements. Internal and external factors that might cause such a difference include, but are not limited to,
changes in interest rates and interest rate relationships, demand for products and services, the degree of
competition by traditional and non-traditional competitors, changes in banking regulations, tax laws, prices,
levies, and assessments, the impact of technological advances, and trends in customer behavior as well as
their ability to repay loans. For a discussion of risk factors that may cause actual results to differ from
expectations, please refer to BOK Financial Corporation’s most recent annual and quarterly reports. BOK
Financial Corporation and its affiliates undertake no obligation to update, amend, or clarify forward-looking
statements, whether as a result of new information, future events, or otherwise.
Non-GAAP Financial Measures: This presentation may refer to non-GAAP financial measures. Additional
information on these financial measures is available in BOK Financial’s 10-Q and 10-K filings with the
Securities and Exchange Commission which can be accessed at www.BOKF.com.
All data is presented as of June 30, 2016 unless otherwise noted.

3
Steven G. Bradshaw
Chief Executive Officer

4
Second Quarter Summary:
• Noteworthy items impacting Q2 profitability:
• The energy credit environment has stabilized along with commodity prices. Loan loss provision fell
to $20 million this quarter, and should decline further in Q3 and Q4 assuming relative stability in
commodities market.
• Very strong quarter for fees and commissions income – record quarters for Brokerage and
Trading, Transaction Card, and Trust.
• Higher expenses – largely driven by higher revenue levels.
• BOKF’s core business continues to execute well and drive solid results.
• Repurchased 305,169 common shares at an average price of $58.23
Q2 2016 Q1 2016 Q2 2015
Diluted EPS $1.00 $0.64 $1.15
Net income before
taxes ($M)
$96.8 $62.4 $120.9
Net income
attributable to BOKF
shareholders ($M)
$65.8 $42.6 $79.2
$79.2
$74.9
$59.6
$42.6
$65.8
$1.15 $1.09
$0.89
$0.64
$1.00
2Q15 3Q15 4Q15 1Q16 2Q16
Net Income
Net income attributable to shareholders
Net income per share - diluted

5
Additional Details
($B)
Q2 2016
Quarterly
Growth
Annualized
Quarterly
Growth
Year over Year
Growth
Period-End Loans $16.4 2.4% 9.6% 8.5%
Average Loans $16.3 1.7% 6.8% 9.1%
Fiduciary Assets $39.9 2.1% 8.4% 3.0%
Assets Under Management
or in Custody
$73.0 1.6% 6.4% 6.4%
• Strong loan growth in Q2 driven by general C&I, healthcare, commercial real estate, and private
banking, offset in part by lower energy outstandings
• Strong continued asset gathering across the wealth management business, modest contribution from
overall market

6
Steven Nell
Chief Financial Officer
Financial Overview

7
Net Interest Revenue
Net Interest Margin
($mil)
Q2
2016
Q1
2016
Q4
2015
Q3
2015
Q2
2015
Net Interest Revenue $182.6 $182.6 $181.3 $178.6 $175.7
Provision For Credit Losses $ 20.0 $ 35.0 $ 22.5 $ 7.5 $ 4.0
Net Interest Revenue After Provision $162.6 $147.6 $158.8 $171.1 $171.7
Net Interest Margin * 2.63% 2.65% 2.64% 2.61% 2.61%
• Full quarter’s impact of nonaccrual loans negatively impacted NIR by $300,000
• Yield on AFS securities was 2.04%, down 4 basis points sequentially but up 10 basis points year over year
• Loan yields were 3.58%, up 1 basis point compared to the first quarter
* Note: 12 basis points of NIM dilution due to FHLB/Fed trade

8
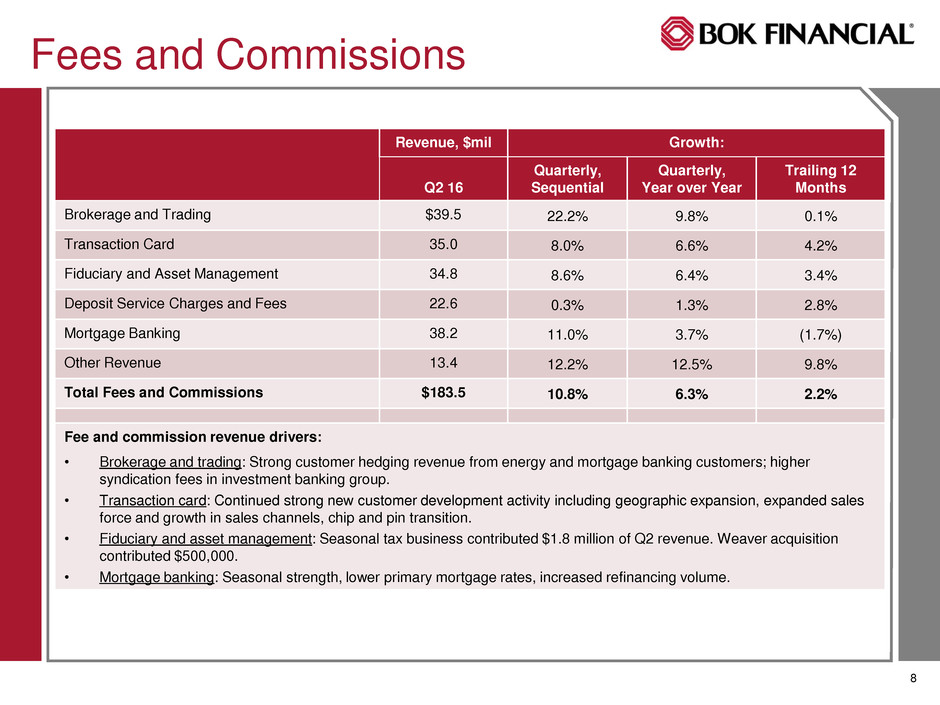
Fees and Commissions
Revenue, $mil Growth:
Q2 16
Quarterly,
Sequential
Quarterly,
Year over Year
Trailing 12
Months
Brokerage and Trading $39.5 22.2% 9.8% 0.1%
Transaction Card 35.0 8.0% 6.6% 4.2%
Fiduciary and Asset Management 34.8 8.6% 6.4% 3.4%
Deposit Service Charges and Fees 22.6 0.3% 1.3% 2.8%
Mortgage Banking 38.2 11.0% 3.7% (1.7%)
Other Revenue 13.4 12.2% 12.5% 9.8%
Total Fees and Commissions $183.5 10.8% 6.3% 2.2%
Fee and commission revenue drivers:
• Brokerage and trading: Strong customer hedging revenue from energy and mortgage banking customers; higher
syndication fees in investment banking group.
• Transaction card: Continued strong new customer development activity including geographic expansion, expanded sales
force and growth in sales channels, chip and pin transition.
• Fiduciary and asset management: Seasonal tax business contributed $1.8 million of Q2 revenue. Weaver acquisition
contributed $500,000.
• Mortgage banking: Seasonal strength, lower primary mortgage rates, increased refinancing volume.

9
Expenses
($mil)
Q2 2016
Q1 2016
Q2 2015
%Incr.
Seq.
%Incr.
YOY
Personnel Expense $142.5 $135.8 $132.7 4.9% 7.4%
Other Operating Expense $112.2 $109.1 $ 94.4 2.8% 18.9%
Total Operating Expense $254.7 $244.9 $227.1 4.0% 12.2%
• Increase in personnel expense largely due to higher variable compensation costs tied to revenue levels
• Increase in other operating expenses driven by mobank acquisition, increased FDIC expense, additional
mortgage banking expenses, and accounting adjustments related to a merchant banking acquisition.
• Overall, expenses are growing in line with revenue.
0
20,000
40,000
60,000
80,000
100,000
120,000
140,000
160,000
100,000
150,000
200,000
250,000
300,000
350,000
400,000
1Q14 2Q14 3Q14 4Q14 1Q15 2Q15 3Q15 4Q15 1Q16 2Q16
Total Revenue Personnel Expense
40,000
50,000
60,000
70,000
80,000
90,000
100,000
110,000
120,000
100,000
150,000
200,000
250,000
300,000
350,000
400,000
1Q14 2Q14 3Q14 4Q14 1Q15 2Q15 3Q15 4Q15 1Q16 2Q16
Total Revenue Total non-personnel expense

10
Other Balance Sheet Statistics
Q2 2016 Q1 2016 Q2 2015
Period End AFS Securities $8.8 billion $8.9 billion $9.0 billion
Average AFS securities $8.9 billion $9.0 billion $9.1 billion
Period End Deposits $20.8 billion $20.4 billion $21.1 billion
Average Deposits $20.5 billion $20.6 billion $21.1 billion
Common Equity Tier 1 11.9% 12.0% 13.0%
Tier 1 11.9% 12.0% 13.0%
Total Capital Ratio 13.5% 13.2% 14.1%
Leverage Ratio 9.1% 9.1% 9.8%
Tangible Common Equity Ratio 9.3% 9.3% 9.7%
Tangible Book Value per Share $44.68 $43.73 $42.70
• BOK Financial remains extremely well capitalized at quarter end.
• Balance sheet effectively neutral from an interest rate risk perspective at 6/30/16
• Completed $150 million subordinated debt offering in June 2016.
• 40 year ‘non-call 5’ structure at 5.375%
• Bond offering proceeds add 60 basis points to total capital ratio

11
2016 Assumptions
Mid-single-digit loan growth for the full year
No plans to materially reduce securities portfolio due to achievement of neutral balance sheet
Stable NIM
Increasing NII
Loan loss provision of $8-$12 million per quarter for balance of 2016
Total net chargeoffs in 2016 expected to be comfortably below the full year loan loss
provision amount
Mid-single-digit revenue growth from fee-generating businesses on a trailing twelve month basis
Revenue growth should continue to outpace core expense growth
Capital deployment through organic growth, acquisitions, dividends, and stock buybacks
Close MBT Bancshares acquisition before year end
$6 - $8 million of pretax consolidation-related charges post closing

12
Stacy Kymes
EVP-Corporate Banking

13
Loan Portfolio by Geography
($mil)
Jun 30
2016
Mar 31
2016
Seq.
Loan
Growth
Jun 30
2015
YOY
Loan
Growth
OK $6,141.6 $6,019.3 2.0% $5,749.0 6.8%
TX 5,668.9 5,576.8 1.7% 5,281.7 7.3%
NM 846.2 853.6 (0.9)% 819.6 3.2%
AR 164.3 154.6 6.3% 197.3 (16.7)%
CO 1,408.7 1,326.9 6.2% 1,333.7 5.6%
AZ 1,373.2 1,320.6 4.0% 1,094.9 25.4%
KC 803.8 770.8 4.3% 647.9 24.1%
Total $16,406.7 $16,022.6 2.4% $15,124.1 8.5%
• Healthy sequential and year-over-year growth in 7 of 8 geographies – strong
economy and share gain all across footprint

14
Commercial Loan Growth
($mil)
Jun 30
2016
Mar 31
2016
Seq.
Loan
Growth
Jun 30
2015
YOY
Loan
Growth
Energy $2,818.6 $3,029.4 (7.0)% $2,902.1 (2.9)%
Services 2,830.9 2,728.9 3.7% 2,681.1 5.6%
Healthcare 2,051.1 1,995.4 2.8% 1,646.0 24.6%
Wholesale/retail 1,533.0 1,451.8 5.6% 1,533.7 (0.1)%
Manufacturing 595.4 600.6 (0.9)% 579.6 2.7%
Other 527.4 482.2 9.4% 433.2 21.8%
Total Commercial $10,356.4 $10,288.4 0.7% $9,775.7 5.9%
• Energy loan outstandings down as expected
• Balance of commercial business continues to post healthy growth

15
Oil & Gas
Producers
79%
Midstream
& Other
12%
Energy
Services
9%
Energy
At 6/30/16:
$4.9 billion commitments and $2.8 billion O/S
$254 million new commitments booked in 2016
~60/40 split between oil and gas
E&P line utilization 60%, down from 64% in Q1
Allowance for credit losses to period end loans: 3.58%, or
over $100 million
Q2 energy chargeoffs $7.1 million
Cumulative chargeoffs in the 2014-2016 commodity cycle: $34 million
($M)
As of Sep 30,
2015
As of Dec 31,
2015
As of Mar 31,
2016
As of Jun 30,
2016
Pass Performing Loans 2,527.6 89.1% 2,580.7 83.3% 2,197.9 72.6% 2,032.1 72.1%
Spec. Mention 196.3 6.9% 325.7 10.5% 269.0 8.9% 197.5 7.0%
Potential Problem Loans 96.4 3.4% 129.8 4.2% 403.0 13.3% 421.0 14.9%
Nonaccrual Loans 17.9 0.6% 61.2 2.0% 159.5 5.3% 168.1 6.0%
Total Energy Loans $2,838.2 $3,097.3 $3,029.4 $2,818.7

16
Commercial Real Estate
($mil)
Jun 30
2016
Mar 31
2016
Seq.
Loan
Growth
Jun 30
2015
YOY
Loan
Growth
Residential Construction
and Land Development
$157.6 $171.9 (8.3%) $148.6 6.1%
Retail 795.4 810.5 (1.9%) 688.4 15.5%
Office 769.1 695.6 10.6% 563.1 36.6%
Multifamily 787.2 733.7 7.3% 711.3 10.7%
Industrial 645.6 564.5 14.4% 488.1 32.3%
Other CRE 427.1 394.3 8.3% 434.0 (1.6%)
Total CRE $3,582.0 $3,370.5 6.3% $3,033.5 18.1%
• Continued strong growth across the CRE business
• 50 percent of year over year growth outside of traditional BOKF footprint

17
Key Credit Quality Metrics
$84.1
$71.5
$85.9 $82.2 $79.1
$61.2
$159.6 $168.1
$90.9 $89.3
$147.1
$241.8
$247.2
$-
$50.0
$100.0
$150.0
$200.0
$250.0
2Q15 3Q15 4Q15 1Q16 2Q16
Nonaccrual Loans
Other Non-Accruals Energy Non-Accruals
Energy credit migration
has stabilized…
…and there are no signs
of credit weakness in
other lending areas
1.34%
1.35%
1.43%
1.50%
1.54%
1.20%
1.25%
1.30%
1.35%
1.40%
1.45%
1.50%
1.55%
1.60%
2Q15 3Q15 4Q15 1Q16 2Q16
Combined Allowance for Credit Losses
to Period End Loans
0.04% 0.03%
0.02%
-0.18%
-0.22%
-1.00%
-0.50%
0.00%
0.50%
1.00%
2Q15 3Q15 4Q15 1Q16 2Q16
TTM Net Recoveries (Charge Offs) to
Average Loans
Note: Long term NCO norm is 35-50 bps
Stable credit environment in Q2
No signs of contagion/spillover of energy issues to
other lending areas
61% of nonaccrual borrowers are current and are
paying as agreed
74% of energy nonaccruals current and are
paying as agreed

18
Steven G. Bradshaw
Chief Executive Officer
Closing Remarks

19
Question and Answer Session
