Attached files
| file | filename |
|---|---|
| EX-99.1 - EX-99.1 - Regional Management Corp. | d225546dex991.htm |
| 8-K - FORM 8-K - Regional Management Corp. | d225546d8k.htm |

2Q 2016 Earnings Call Presentation July 26, 2016 Exhibit 99.2
Safe Harbor Statement This presentation and the responses to various questions contain forward-looking statements, which reflect our current views with respect to, among other things, the Company’s operations and financial performance. You can identify these forward-looking statements by the use of words such as “outlook,” “believes,” “expects,” “potential,” “continues,” “may,” “will,” “should,” “seeks,” “approximately,” “predicts,” “intends,” “plans,” “estimates,” “anticipates” or the negative version of these words or other comparable words. Such forward-looking statements are subject to various risks and uncertainties. Accordingly, there are or will be important factors that could cause actual outcomes or results to differ materially from those indicated in these statements. These factors include but are not limited to those described under “Risk Factors” in the Company’s Annual Report on Form 10-K and Quarterly Reports on Form 10-Q. We cannot guarantee future events, results, actions, levels of activity, performance or achievements. Neither the Company nor any of its respective agents, employees or advisors undertake any duty or obligation to supplement, amend, update or revise any forward-looking statement, whether as a result of new information or otherwise. This presentation also contains certain non-GAAP measures. Because they adjust for certain non-operating and non-cash items, the Company believes that non-GAAP measures are useful to investors as supplemental financial measures that, when viewed with the Company’s GAAP financial information, provide information regarding trends in the Company’s results of operations and credit metrics, which is intended to help investors meaningfully evaluate and compare the Company’s results of operations and credit metrics between periods. Please refer to the Appendix accompanying this presentation for a reconciliation of non-GAAP measures to the most comparable GAAP measure. The information and opinions contained in this document are provided as of the date of this presentation and are subject to change without notice. This document has not been approved by any regulatory or supervisory authority.
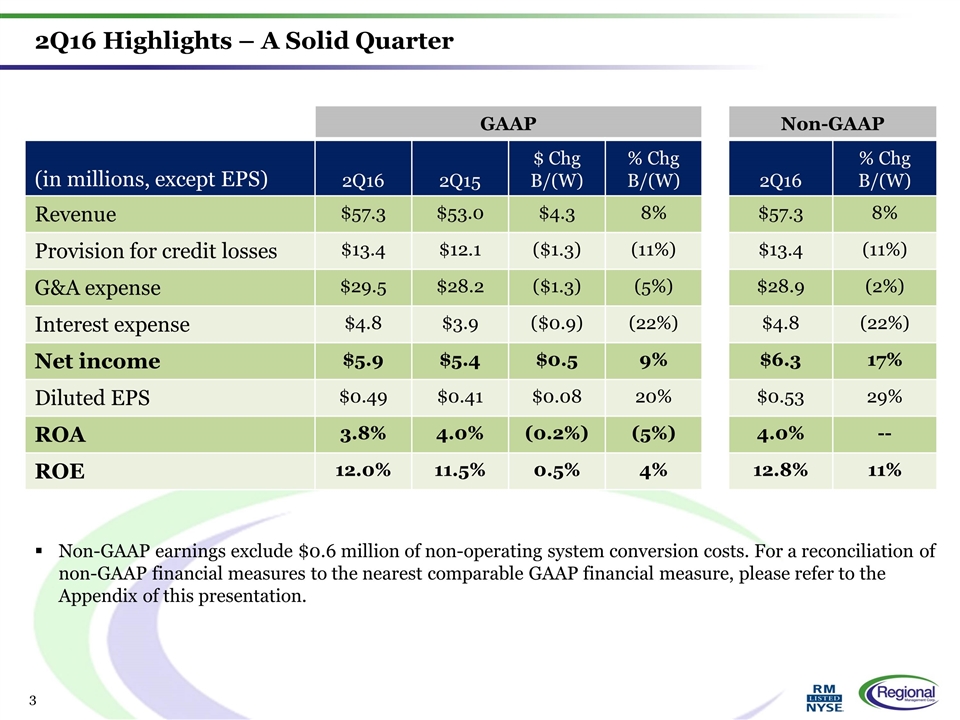
2Q16 Highlights – A Solid Quarter GAAP Non-GAAP (in millions, except EPS) 2Q16 2Q15 $ Chg B/(W) % Chg B/(W) 2Q16 % Chg B/(W) Revenue $57.3 $53.0 $4.3 8% $57.3 8% Provision for credit losses $13.4 $12.1 ($1.3) (11%) $13.4 (11%) G&A expense $29.5 $28.2 ($1.3) (5%) $28.9 (2%) Interest expense $4.8 $3.9 ($0.9) (22%) $4.8 (22%) Net income $5.9 $5.4 $0.5 9% $6.3 17% Diluted EPS $0.49 $0.41 $0.08 20% $0.53 29% ROA 3.8% 4.0% (0.2%) (5%) 4.0% -- ROE 12.0% 11.5% 0.5% 4% 12.8% 11% Non-GAAP earnings exclude $0.6 million of non-operating system conversion costs. For a reconciliation of non-GAAP financial measures to the nearest comparable GAAP financial measure, please refer to the Appendix of this presentation.
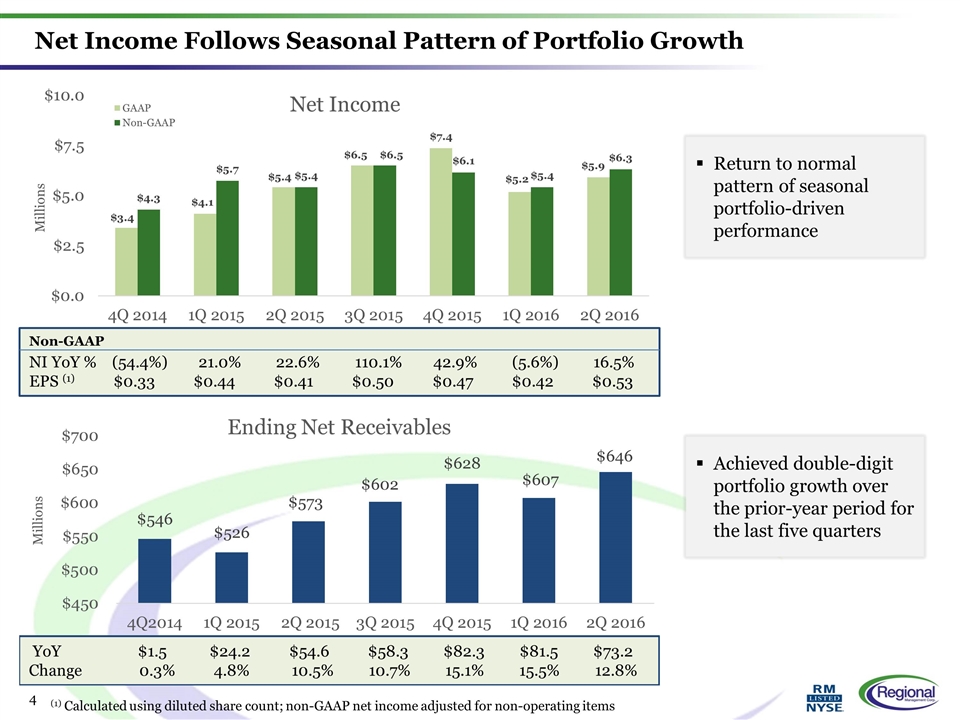
Net Income Follows Seasonal Pattern of Portfolio Growth Return to normal pattern of seasonal portfolio-driven performance Non-GAAP NI YoY % (54.4%) 21.0% 22.6% 110.1% 42.9% (5.6%) 16.5% EPS (1) $0.33 $0.44 $0.41 $0.50 $0.47 $0.42 $0.53 (1) Calculated using diluted share count; non-GAAP net income adjusted for non-operating items Achieved double-digit portfolio growth over the prior-year period for the last five quarters
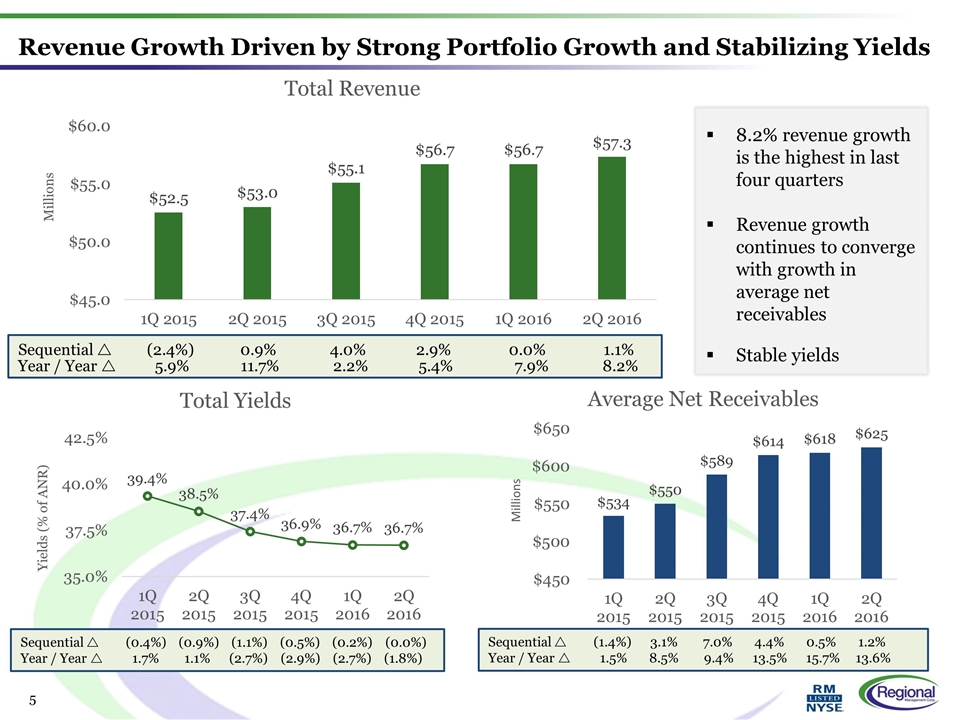
Sequential r (2.4%) 0.9% 4.0% 2.9% 0.0% 1.1% Year / Year r 5.9% 11.7% 2.2% 5.4% 7.9% 8.2% Revenue Growth Driven by Strong Portfolio Growth and Stabilizing Yields 8.2% revenue growth is the highest in last four quarters Revenue growth continues to converge with growth in average net receivables Stable yields Sequential r (0.4%) (0.9%) (1.1%) (0.5%) (0.2%) (0.0%) Year / Year r 1.7% 1.1% (2.7%) (2.9%) (2.7%) (1.8%) Sequential r (1.4%) 3.1% 7.0% 4.4% 0.5% 1.2% Year / Year r 1.5% 8.5% 9.4% 13.5% 15.7% 13.6%
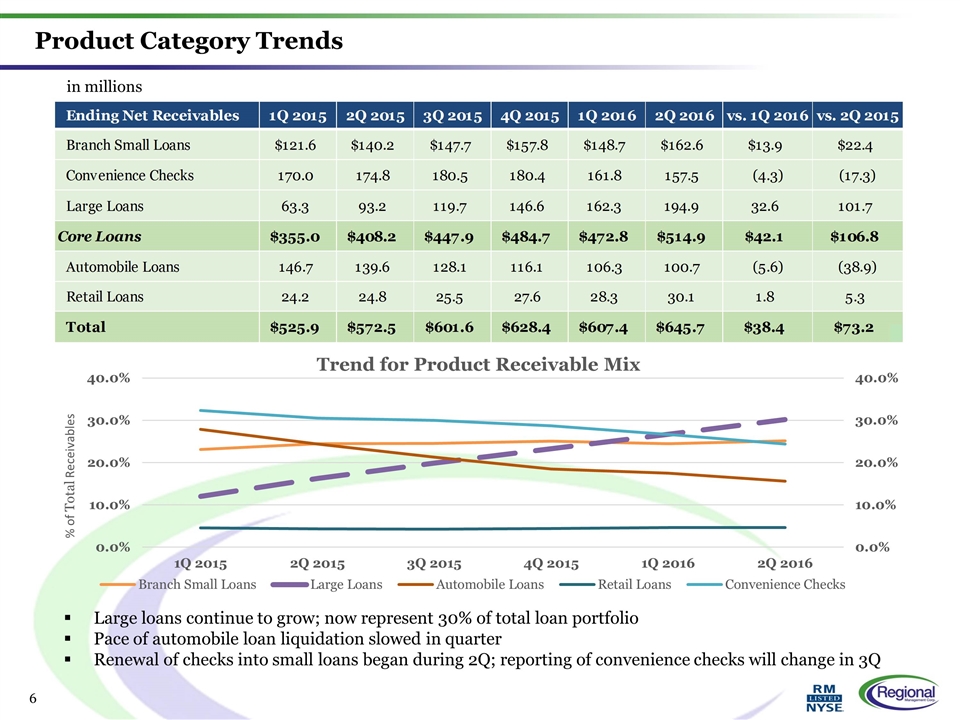
Product Category Trends in millions Large loans continue to grow; now represent 30% of total loan portfolio Pace of automobile loan liquidation slowed in quarter Renewal of checks into small loans began during 2Q; reporting of convenience checks will change in 3Q Ending Net Receivables 1Q 2015 2Q 2015 3Q 2015 4Q 2015 1Q 2016 2Q 2016 vs. 1Q 2016 vs. 2Q 2015 Branch Small Loans $121.6 $140.1646459599998 $147.66758053000009 $157.75950184000004 $148.70284013999995 $162.56415031999995 $13.861310180000004 $22.399504360000151 Convenience Checks 170.0033838899997 174.78562260000001 180.5430278000002 180.40153074000006 161.80241350999998 157.51545330999988 -4.2869602000000953 -17.270169290000126 Large Loans 63.338204740000009 93.203060620000016 119.73079753000003 146.55286949000001 162.30127855000003 194.85732522000009 32.556046670000057 101.65426460000008 Core Loans $355.00021294999971 $408.15332917999984 $447.94140586000032 $484.71390207000013 $472.80653220000005 $514.93692884999996 $42.130396649999909 $106.78359967000011 Automobile Loans 146.72435383999996 139.59287564000002 128.13134901000009 116.10880075999999 106.29675753999997 100.72084720000002 -5.5759103399999503 -38.872028439999994 Retail Loans 24.182632870000006 24.781931650000022 25.539203579999995 27.624603759999989 28.263118810000009 30.089081610000004 1.8259627999999957 5.3071499599999825 Total $525.90719966000017 $572.52474473999973 $601.6081068899997 $628.44401102999984 $607.36256799000046 $645.74442963000001 $38.381861639999556 $73.219684890000281 Ending Net Receivables 1Q 2015 2Q 2015 3Q 2015 4Q 2015 1Q 2016 2Q 2016 vs. 1Q 2016 vs. 2Q 2015 Branch Small Loans 0.23133097321856883 0.24481849430569619 0.24545477170074134 0.25103191226444693 0.2448337253184957 0.25174688756223002 .7% .7% Convenience Checks 0.32325738076966271 0.30528920226736278 0.30010072293292972 0.28706062524858444 0.26640168827899169 0.24392847399435319 -2.2% -6.1% Large Loans 0.12043608602610548 0.16279306960317716 0.19901792572069188 0.2331995641899817 0.26722305111281097 0.30175610702774447 3.5% 0.13896303742456731 Automobile Loans 0.2789928602134702 0.24381981202121356 0.21298142020122093 0.18475599850128469 0.17501367904804768 0.15597633146864506 -1.9% -8.8% Retail Loans 4.6% 4.3% 4.2% 4.4% 4.7% 4.7% 61780413328930972.6% .3% Total 100.0% 100.0% 100.0% 100.0% 100.0% 100.0% 0.0% 0.0% 1Q 2015 2Q 2015 3Q 2015 4Q 2015 1Q 2016 2Q 2016 vs. 4Q 2015 vs. 1Q 2015 Branch Small Loans ,121,658,624.32000002 ,140,164,645.9599998 ,147,667,580.53000009 ,157,759,501.84000003 ,148,702,840.13999996 ,162,564,150.31999996 Convenience Checks ,170,003,383.88999969 ,174,785,622.60000002 ,180,543,027.80000019 ,180,401,530.74000007 ,161,802,413.50999999 ,157,515,453.30999988 Large Loans 63,338,204.74000001 93,203,060.62000002 ,119,730,797.53000003 ,146,552,869.49000001 ,162,301,278.55000004 ,194,857,325.22000009 Core loan products ,355,000,212.94999969 ,408,153,329.17999983 ,447,941,405.86000031 ,484,713,902.7000011 ,472,806,532.20000005 ,514,936,928.84999996 Automobile Loans ,146,724,353.83999997 ,139,592,875.64000002 ,128,131,349.1000008 ,116,108,800.75999999 ,106,296,757.53999998 ,100,720,847.20000002 Retail Loans 24,182,632.870000005 24,781,931.650000021 25,539,203.579999994 27,624,603.75999999 28,263,118.81000001 30,089,081.610000003 Total ,525,907,199.66000015 ,572,524,744.73999977 ,601,608,106.88999975 ,628,444,011.2999985 ,607,362,567.99000049 ,645,744,429.63 1Q 2015 2Q 2015 3Q 2015 4Q 2015 1Q 2016 2Q 2016 Branch Small Loans 0.23133097321856883 0.24481849430569619 0.24545477170074134 0.25103191226444693 0.2448337253184957 0.25174688756223002 Convenience Checks 0.32325738076966271 0.30528920226736278 0.30010072293292972 0.28706062524858444 0.26640168827899169 0.24392847399435319 Large Loans 0.12043608602610548 0.16279306960317716 0.19901792572069188 0.2331995641899817 0.26722305111281097 0.30175610702774447 Automobile Loans 0.2789928602134702 0.24381981202121356 0.21298142020122093 0.18475599850128469 0.17501367904804768 0.15597633146864506 Retail Loans 4.6% 4.3% 4.2% 4.4% 4.7% 4.7%
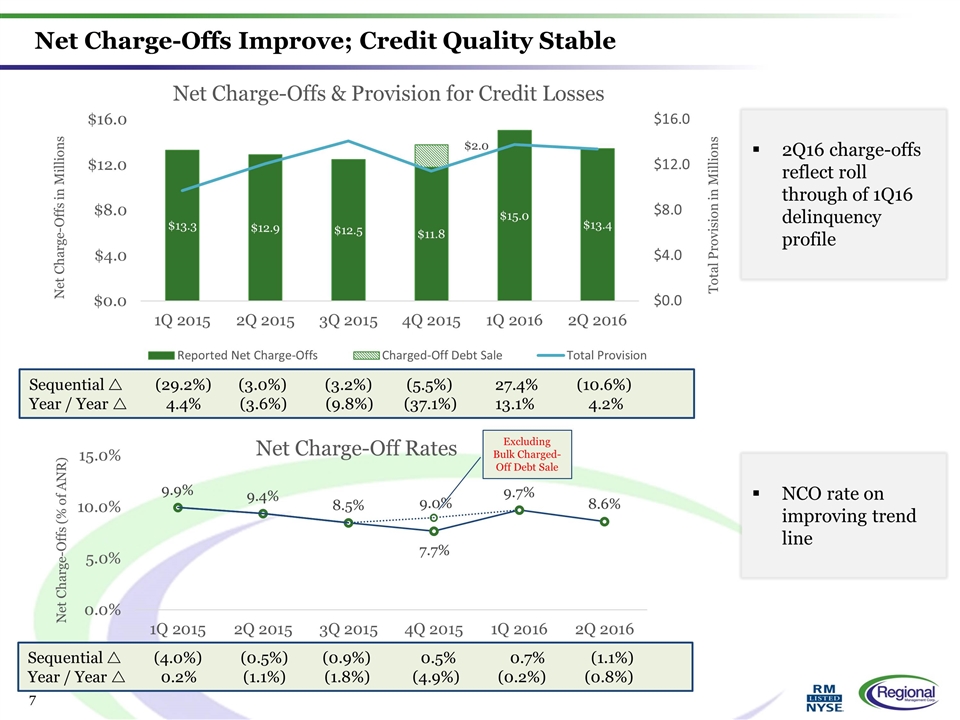
Net Charge-Offs Improve; Credit Quality Stable Excluding Bulk Charged-Off Debt Sale 2Q16 charge-offs reflect roll through of 1Q16 delinquency profile Sequential r (29.2%) (3.0%) (3.2%) (5.5%) 27.4% (10.6%) Year / Year r 4.4% (3.6%) (9.8%) (37.1%) 13.1% 4.2% Sequential r (4.0%) (0.5%) (0.9%) 0.5% 0.7% (1.1%) Year / Year r 0.2% (1.1%) (1.8%) (4.9%) (0.2%) (0.8%) NCO rate on improving trend line
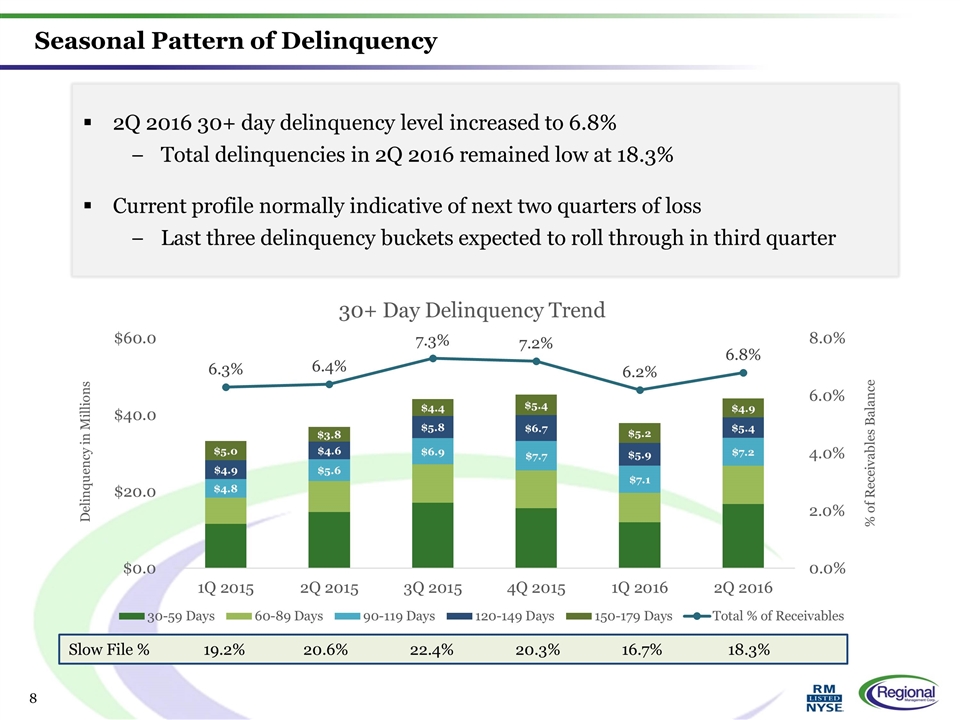
2Q 2016 30+ day delinquency level increased to 6.8% Total delinquencies in 2Q 2016 remained low at 18.3% Current profile normally indicative of next two quarters of loss Last three delinquency buckets expected to roll through in third quarter Seasonal Pattern of Delinquency Slow File % 19.2% 20.6% 22.4% 20.3% 16.7% 18.3%
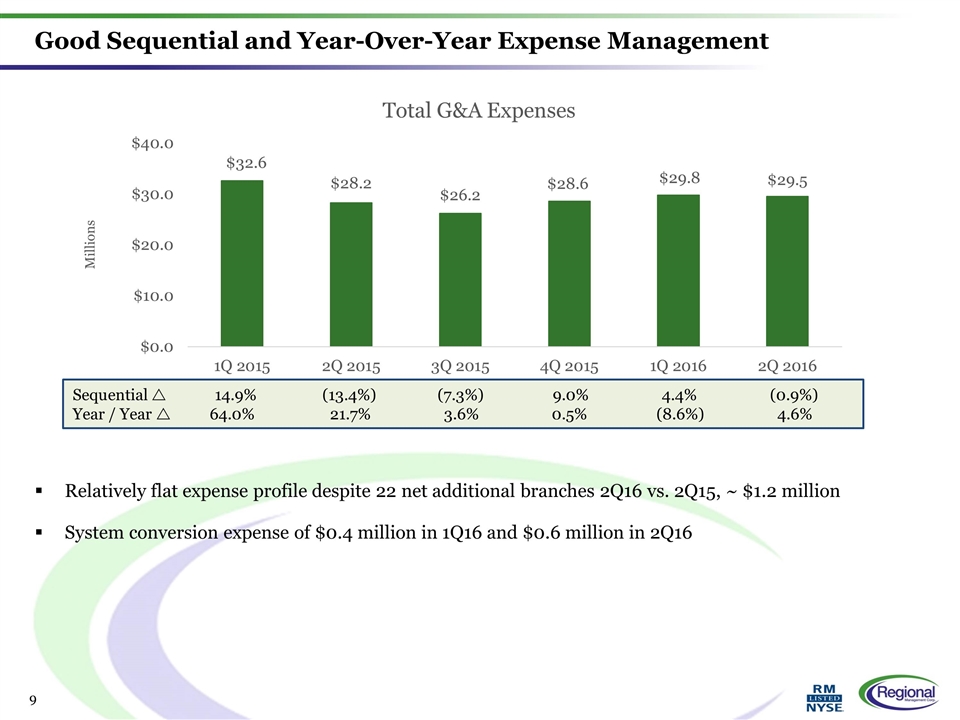
Good Sequential and Year-Over-Year Expense Management Relatively flat expense profile despite 22 net additional branches 2Q16 vs. 2Q15, ~ $1.2 million System conversion expense of $0.4 million in 1Q16 and $0.6 million in 2Q16 Sequential r 14.9% (13.4%) (7.3%) 9.0% 4.4% (0.9%) Year / Year r 64.0% 21.7% 3.6% 0.5% (8.6%) 4.6%
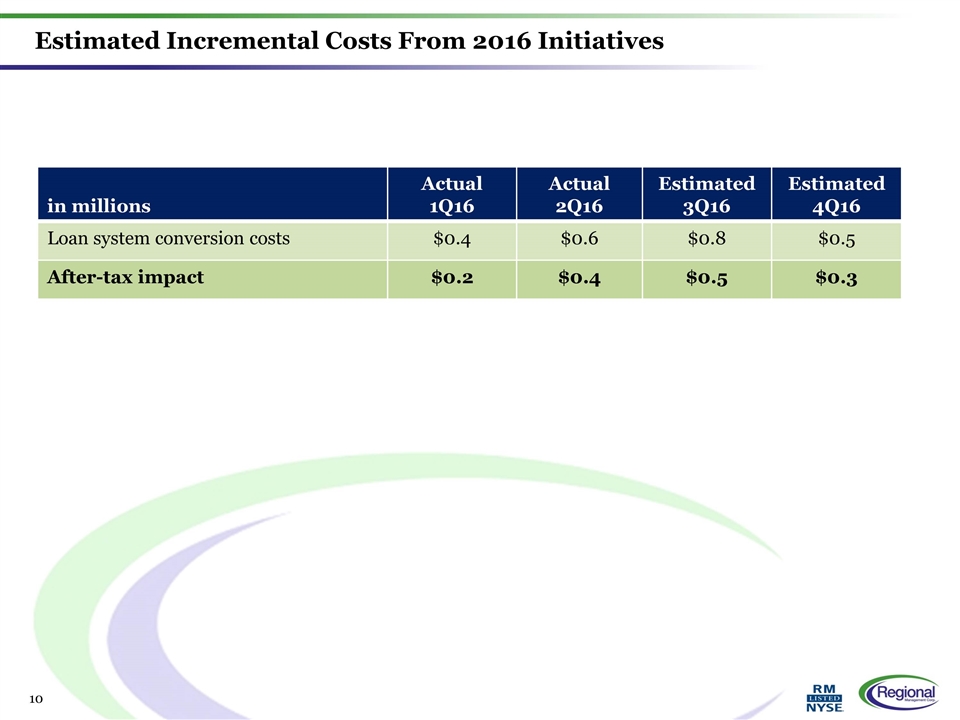
Estimated Incremental Costs From 2016 Initiatives in millions Actual 1Q16 Actual 2Q16 Estimated 3Q16 Estimated 4Q16 Loan system conversion costs $0.4 $0.6 $0.8 $0.5 After-tax impact $0.2 $0.4 $0.5 $0.3
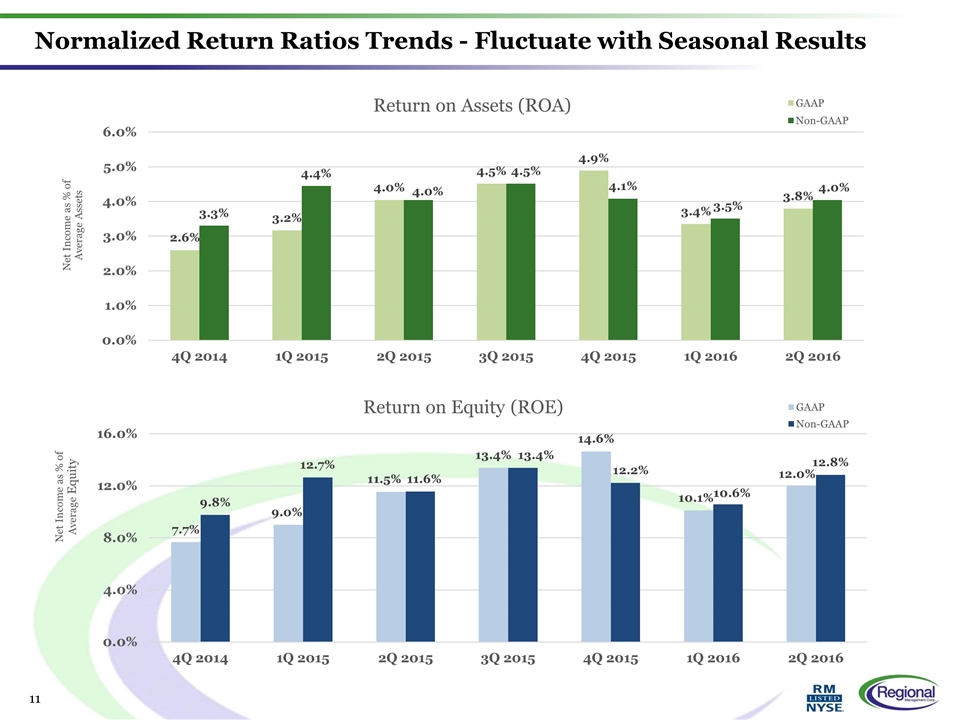
Normalized Return Ratios Trends - Fluctuate with Seasonal Results
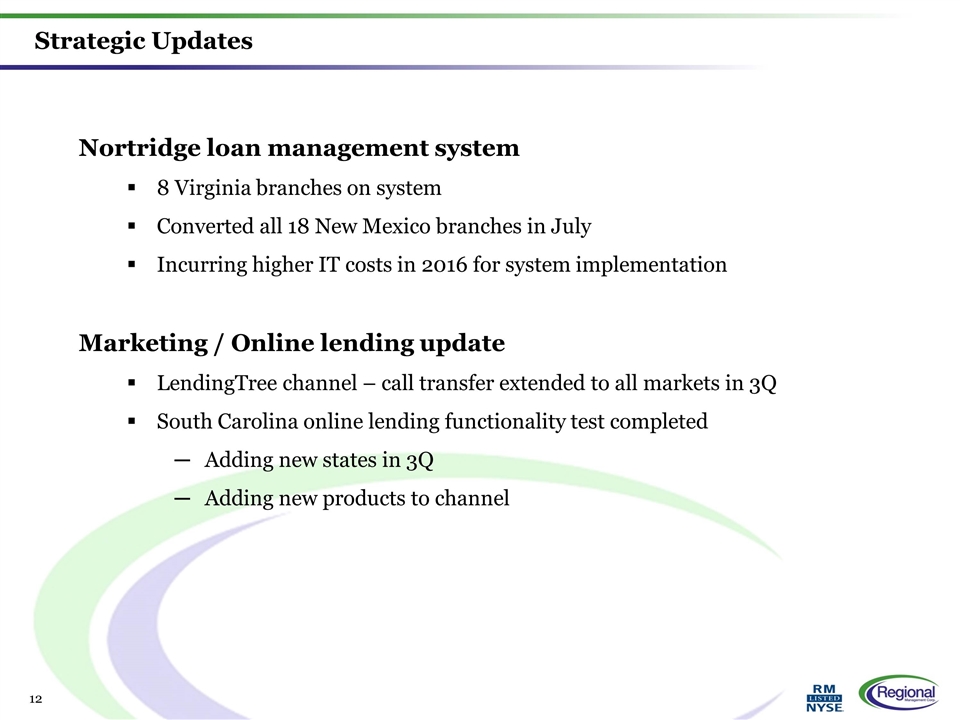
Strategic Updates Nortridge loan management system 8 Virginia branches on system Converted all 18 New Mexico branches in July Incurring higher IT costs in 2016 for system implementation Marketing / Online lending update LendingTree channel – call transfer extended to all markets in 3Q South Carolina online lending functionality test completed Adding new states in 3Q Adding new products to channel
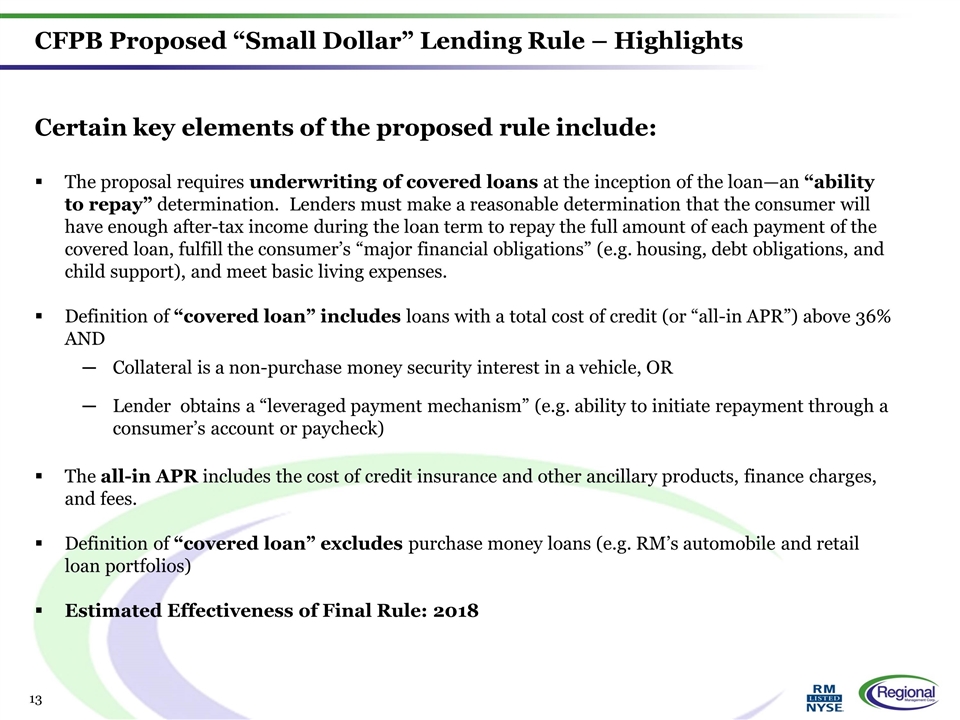
CFPB Proposed “Small Dollar” Lending Rule – Highlights Certain key elements of the proposed rule include: The proposal requires underwriting of covered loans at the inception of the loan—an “ability to repay” determination. Lenders must make a reasonable determination that the consumer will have enough after-tax income during the loan term to repay the full amount of each payment of the covered loan, fulfill the consumer’s “major financial obligations” (e.g. housing, debt obligations, and child support), and meet basic living expenses. Definition of “covered loan” includes loans with a total cost of credit (or “all-in APR”) above 36% AND Collateral is a non-purchase money security interest in a vehicle, OR Lender obtains a “leveraged payment mechanism” (e.g. ability to initiate repayment through a consumer’s account or paycheck) The all-in APR includes the cost of credit insurance and other ancillary products, finance charges, and fees. Definition of “covered loan” excludes purchase money loans (e.g. RM’s automobile and retail loan portfolios) Estimated Effectiveness of Final Rule: 2018
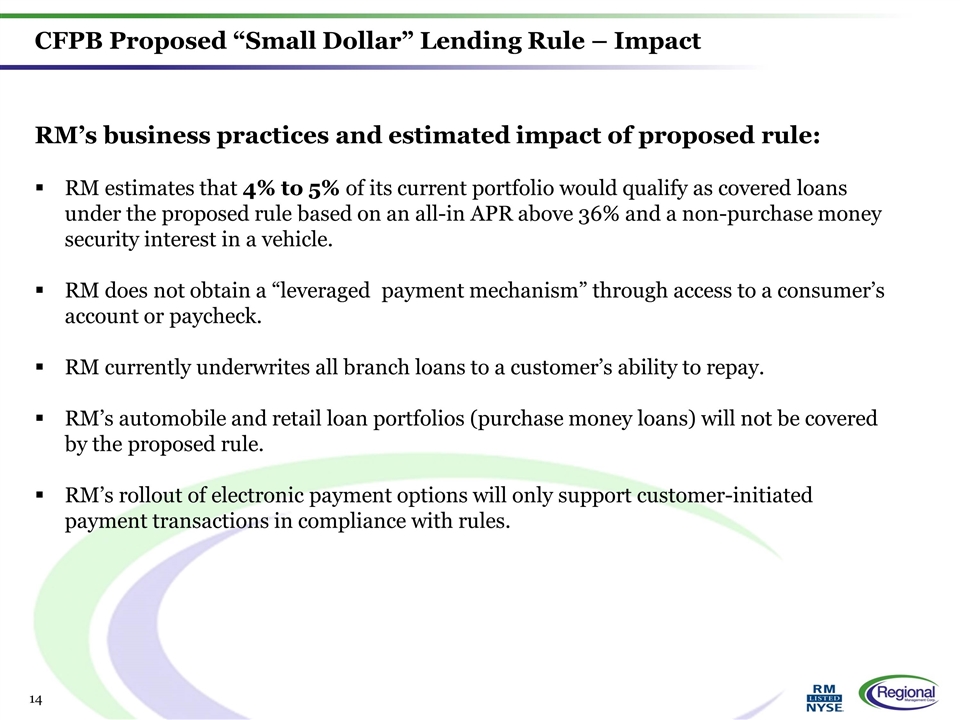
CFPB Proposed “Small Dollar” Lending Rule – Impact RM’s business practices and estimated impact of proposed rule: RM estimates that 4% to 5% of its current portfolio would qualify as covered loans under the proposed rule based on an all-in APR above 36% and a non-purchase money security interest in a vehicle. RM does not obtain a “leveraged payment mechanism” through access to a consumer’s account or paycheck. RM currently underwrites all branch loans to a customer’s ability to repay. RM’s automobile and retail loan portfolios (purchase money loans) will not be covered by the proposed rule. RM’s rollout of electronic payment options will only support customer-initiated payment transactions in compliance with rules.

Appendix
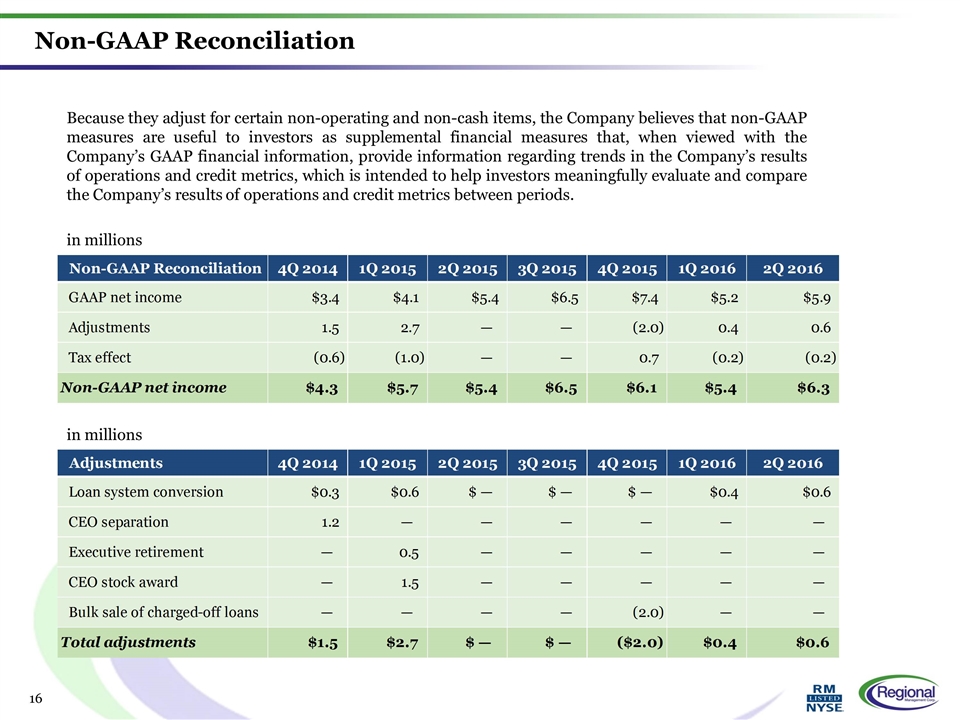
Non-GAAP Reconciliation in millions in millions Because they adjust for certain non-operating and non-cash items, the Company believes that non-GAAP measures are useful to investors as supplemental financial measures that, when viewed with the Company’s GAAP financial information, provide information regarding trends in the Company’s results of operations and credit metrics, which is intended to help investors meaningfully evaluate and compare the Company’s results of operations and credit metrics between periods. Non-GAAP Reconciliation 4Q 2014 1Q 2015 2Q 2015 3Q 2015 4Q 2015 1Q 2016 2Q 2016 3Q 2016 GAAP net income $3.4 $4.0999999999999996 $5.4 $6.5 $7.4 $5.2 $5.9 Adjustments 1.5 2.7 — — -2 0.4 0.6 Tax effect -0.6 -1 — — 0.7 -0.2 -0.2 Non-GAAP net income $4.3000000000000007 $5.6999999999999993 $5.4 $6.5 $6.1 $5.4 $6.3 Ending Net Receivables 1Q 2015 2Q 2015 3Q 2015 4Q 2015 1Q 2016 2Q 2016 vs. 1Q 2016 vs. 2Q 2015 Branch Small Loans 0.23133097321856883 0.24481849430569619 0.24545477170074134 0.25103191226444693 0.2448337253184957 0.25174688756223002 .7% .7% Convenience Checks 0.32325738076966271 0.30528920226736278 0.30010072293292972 0.28706062524858444 0.26640168827899169 0.24392847399435319 -2.2% -6.1% Large Loans 0.12043608602610548 0.16279306960317716 0.19901792572069188 0.2331995641899817 0.26722305111281097 0.30175610702774447 3.5% 0.13896303742456731 Automobile Loans 0.2789928602134702 0.24381981202121356 0.21298142020122093 0.18475599850128469 0.17501367904804768 0.15597633146864506 -1.9% -8.8% Retail Loans 4.6% 4.3% 4.2% 4.4% 4.7% 4.7% 61780413328930972.6% .3% Total 100.0% 100.0% 100.0% 100.0% 100.0% 100.0% 0.0% 0.0% 1Q 2015 2Q 2015 3Q 2015 4Q 2015 1Q 2016 2Q 2016 vs. 4Q 2015 vs. 1Q 2015 Branch Small Loans ,121,658,624.32000002 ,140,164,645.9599998 ,147,667,580.53000009 ,157,759,501.84000003 ,148,702,840.13999996 ,162,564,150.31999996 Convenience Checks ,170,003,383.88999969 ,174,785,622.60000002 ,180,543,027.80000019 ,180,401,530.74000007 ,161,802,413.50999999 ,157,515,453.30999988 Large Loans 63,338,204.74000001 93,203,060.62000002 ,119,730,797.53000003 ,146,552,869.49000001 ,162,301,278.55000004 ,194,857,325.22000009 Core loan products ,355,000,212.94999969 ,408,153,329.17999983 ,447,941,405.86000031 ,484,713,902.7000011 ,472,806,532.20000005 ,514,936,928.84999996 Automobile Loans ,146,724,353.83999997 ,139,592,875.64000002 ,128,131,349.1000008 ,116,108,800.75999999 ,106,296,757.53999998 ,100,720,847.20000002 Retail Loans 24,182,632.870000005 24,781,931.650000021 25,539,203.579999994 27,624,603.75999999 28,263,118.81000001 30,089,081.610000003 Total ,525,907,199.66000015 ,572,524,744.73999977 ,601,608,106.88999975 ,628,444,011.2999985 ,607,362,567.99000049 ,645,744,429.63 1Q 2015 2Q 2015 3Q 2015 4Q 2015 1Q 2016 2Q 2016 Branch Small Loans 0.23133097321856883 0.24481849430569619 0.24545477170074134 0.25103191226444693 0.2448337253184957 0.25174688756223002 Convenience Checks 0.32325738076966271 0.30528920226736278 0.30010072293292972 0.28706062524858444 0.26640168827899169 0.24392847399435319 Large Loans 0.12043608602610548 0.16279306960317716 0.19901792572069188 0.2331995641899817 0.26722305111281097 0.30175610702774447 Automobile Loans 0.2789928602134702 0.24381981202121356 0.21298142020122093 0.18475599850128469 0.17501367904804768 0.15597633146864506 Retail Loans 4.6% 4.3% 4.2% 4.4% 4.7% 4.7% Adjustments 4Q 2014 1Q 2015 2Q 2015 3Q 2015 4Q 2015 1Q 2016 2Q 2016 3Q 2016 Loan system conversion $0.3 $0.6 $ — $ — $ — $0.4 $0.6 CEO separation 1.2 — — — — — — Executive retirement — 0.5 — — — — — CEO stock award — 1.5 — — — — — Bulk sale of charged-off loans — — — — -2 — — Total adjustments $1.5 $2.7 $ — $ — $-2 $0.4 $0.6 Ending Net Receivables 1Q 2015 2Q 2015 3Q 2015 4Q 2015 1Q 2016 2Q 2016 vs. 1Q 2016 vs. 2Q 2015 Branch Small Loans 0.23133097321856883 0.24481849430569619 0.24545477170074134 0.25103191226444693 0.2448337253184957 0.25174688756223002 .7% .7% Convenience Checks 0.32325738076966271 0.30528920226736278 0.30010072293292972 0.28706062524858444 0.26640168827899169 0.24392847399435319 -2.2% -6.1% Large Loans 0.12043608602610548 0.16279306960317716 0.19901792572069188 0.2331995641899817 0.26722305111281097 0.30175610702774447 3.5% 0.13896303742456731 Automobile Loans 0.2789928602134702 0.24381981202121356 0.21298142020122093 0.18475599850128469 0.17501367904804768 0.15597633146864506 -1.9% -8.8% Retail Loans 4.6% 4.3% 4.2% 4.4% 4.7% 4.7% 61780413328930972.6% .3% Total 100.0% 100.0% 100.0% 100.0% 100.0% 100.0% 0.0% 0.0% 1Q 2015 2Q 2015 3Q 2015 4Q 2015 1Q 2016 2Q 2016 vs. 4Q 2015 vs. 1Q 2015 Branch Small Loans ,121,658,624.32000002 ,140,164,645.9599998 ,147,667,580.53000009 ,157,759,501.84000003 ,148,702,840.13999996 ,162,564,150.31999996 Convenience Checks ,170,003,383.88999969 ,174,785,622.60000002 ,180,543,027.80000019 ,180,401,530.74000007 ,161,802,413.50999999 ,157,515,453.30999988 Large Loans 63,338,204.74000001 93,203,060.62000002 ,119,730,797.53000003 ,146,552,869.49000001 ,162,301,278.55000004 ,194,857,325.22000009 Core loan products ,355,000,212.94999969 ,408,153,329.17999983 ,447,941,405.86000031 ,484,713,902.7000011 ,472,806,532.20000005 ,514,936,928.84999996 Automobile Loans ,146,724,353.83999997 ,139,592,875.64000002 ,128,131,349.1000008 ,116,108,800.75999999 ,106,296,757.53999998 ,100,720,847.20000002 Retail Loans 24,182,632.870000005 24,781,931.650000021 25,539,203.579999994 27,624,603.75999999 28,263,118.81000001 30,089,081.610000003 Total ,525,907,199.66000015 ,572,524,744.73999977 ,601,608,106.88999975 ,628,444,011.2999985 ,607,362,567.99000049 ,645,744,429.63 1Q 2015 2Q 2015 3Q 2015 4Q 2015 1Q 2016 2Q 2016 Branch Small Loans 0.23133097321856883 0.24481849430569619 0.24545477170074134 0.25103191226444693 0.2448337253184957 0.25174688756223002 Convenience Checks 0.32325738076966271 0.30528920226736278 0.30010072293292972 0.28706062524858444 0.26640168827899169 0.24392847399435319 Large Loans 0.12043608602610548 0.16279306960317716 0.19901792572069188 0.2331995641899817 0.26722305111281097 0.30175610702774447 Automobile Loans 0.2789928602134702 0.24381981202121356 0.21298142020122093 0.18475599850128469 0.17501367904804768 0.15597633146864506 Retail Loans 4.6% 4.3% 4.2% 4.4% 4.7% 4.7%
