Attached files
| file | filename |
|---|---|
| EX-99.1 - EXHIBIT 99.1 - FIRST BANCORP /PR/ | a51387963-ex991.htm |
| 8-K - FIRST BANCORP. 8-K - FIRST BANCORP /PR/ | a51387963.htm |
Exhibit 99.2

Financial Results2Q 2016
2 This presentation may contain “forward-looking statements” concerning the Corporation’s future economic and financial performance. The words or phrases “expect,” “anticipate,” “intend,” “look forward,” “should,” “would,” “believes” and similar expressions are meant to identify “forward-looking statements” within the meaning of Section 27A of the Securities Act of 1933, as amended, and Section 21E of the Securities Exchange Act of 1934, as amended, and are subject to the safe harbor created by such sections. The Corporation cautions readers not to place undue reliance on any such “forward-looking statements,” which speak only as of the date made, and advises readers that various factors, including, but not limited to, the following could cause actual results to differ materially from those expressed in, or implied by such forward-looking statements: the ability of the Puerto Rico government or any of its public corporations or other instrumentalities to repay its respective debt obligations, including the effect of the recent payment defaults on the Puerto Rico government general obligations, bonds of the Government Development Bank for Puerto Rico and certain bonds of government public corporations, recent and any future downgrades of the long-term and short-term debt ratings of the Puerto Rico government, which could exacerbate Puerto Rico’s adverse economic conditions and, in turn, further adversely impact the Corporation; uncertainties as to the ultimate outcomes of actions resulting from the enactment by the U.S. government of the Puerto Rico Oversight, Management, and Economic Stability Act (PROMESA) to address Puerto Rico’s financial problems; uncertainty about whether the Corporation will be able to continue to fully comply with the written agreement dated June 3, 2010 that the Corporation entered into with the Federal Reserve Bank of New York (the “New York Fed”) that, among other things, requires the Corporation to serve as a source of strength to FirstBank and that, except with the consent generally of the New York Fed and the Board of Governors of the Federal Reserve System (the “Federal Reserve Board”), prohibits the Corporation from paying dividends to stockholders or receiving dividends from FirstBank, making payments on trust preferred securities or subordinated debt and incurring, increasing or guaranteeing debt or repurchasing any capital securities; a decrease in demand for the Corporation’s products and services and lower revenues and earnings because of the continued recession in Puerto Rico; uncertainty as to the availability of certain funding sources, such as brokered CDs; the Corporation’s reliance on brokered CDs to fund operations and provide liquidity; the risk of not being able to fulfill the Corporation’s cash obligations or resume paying dividends to the Corporation’s stockholders in the future due to the Corporation’s need to receive approval from the New York Fed and the Federal Reserve Board to declare or pay any dividends and to take dividends or any other form of payment representing a reduction in capital from FirstBank or FirstBank’s failure to generate sufficient cash flow to make a dividend payment to the Corporation; the weakness of the real estate markets and of the consumer and commercial sectors and their impact on the credit quality of the Corporation’s loans and other assets, which has contributed and may continue to contribute to, among other things, high levels of non-performing assets, charge-offs and provisions for loan and lease losses and may subject the Corporation to further risk from loan defaults and foreclosures; the ability of FirstBank to realize the benefits of its deferred tax assets subject to the remaining valuation allowance; adverse changes in general economic conditions in Puerto Rico, the U.S., and the U.S. and British Virgin Islands, including the interest rate environment, market liquidity, housing absorption rates, real estate prices, and disruptions in the U.S. capital markets, which reduced interest margins and affected funding sources, and has affected demand for all of the Corporation’s products and services and reduced the Corporation’s revenues and earnings, and the value of the Corporation’s assets, and may continue to have these effects; an adverse change in the Corporation’s ability to attract new clients and retain existing ones; the risk that additional portions of the unrealized losses in the Corporation’s investment portfolio are determined to be other-than-temporary, including additional impairments on the Puerto Rico government’s obligations; uncertainty about regulatory and legislative changes for financial services companies in Puerto Rico, the U.S., and the U.S. and British Virgin Islands, which could affect the Corporation’s financial condition or performance and could cause the Corporation’s actual results for future periods to differ materially from prior results and anticipated or projected results; changes in the fiscal and monetary policies and regulations of the U.S. federal government and the Puerto Rico and other governments, including those determined by the Federal Reserve Board, the New York Fed, the FDIC, government-sponsored housing agencies, and regulators in Puerto Rico and the U.S. and British Virgin Islands; the risk of possible failure or circumvention of controls and procedures and the risk that the Corporation’s risk management policies may not be adequate; the risk that the FDIC may increase the deposit insurance premium and/or require special assessments to replenish its insurance fund, causing an additional increase in the Corporation’s non-interest expenses; the impact on the Corporation’s results of operations and financial condition of acquisitions and dispositions; a need to recognize impairments on the Corporation’s financial instruments, goodwill, or other intangible assets relating to acquisitions; the risk that downgrades in the credit ratings of the Corporation’s long-term senior debt will adversely affect the Corporation’s ability to access necessary external funds; the impact on the Corporation’s business, business practices and results of operations of a potential higher interest rate environment; and general competitive factors and industry consolidation. The Corporation does not undertake, and specifically disclaims any obligation, to update any “forward-looking statements” to reflect occurrences or unanticipated events or circumstances after the date of such statements, except as required by the federal securities laws. Forward-Looking Statements

Agenda Second Quarter 2016 Highlights Aurelio Alemán, President & Chief Executive OfficerSecond Quarter 2016 Results of Operations Orlando Berges, Executive Vice President & Chief Financial OfficerQuestions & Answers 3

Key Highlights 4 Second Quarter 2016 Results
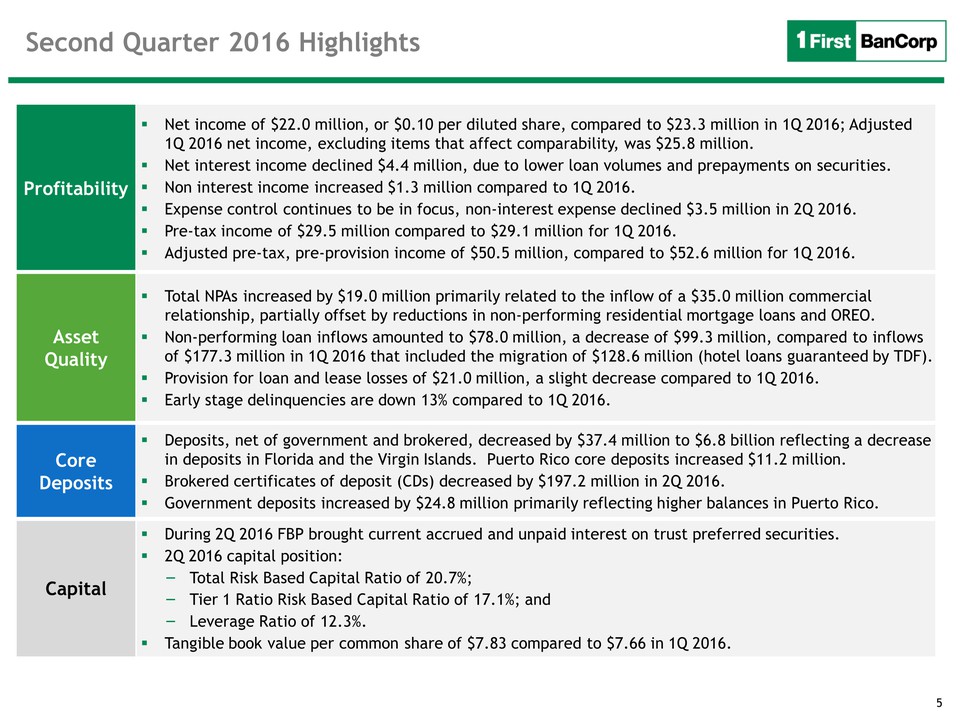
5 Profitability Net income of $22.0 million, or $0.10 per diluted share, compared to $23.3 million in 1Q 2016; Adjusted 1Q 2016 net income, excluding items that affect comparability, was $25.8 million.Net interest income declined $4.4 million, due to lower loan volumes and prepayments on securities.Non interest income increased $1.3 million compared to 1Q 2016.Expense control continues to be in focus, non-interest expense declined $3.5 million in 2Q 2016.Pre-tax income of $29.5 million compared to $29.1 million for 1Q 2016.Adjusted pre-tax, pre-provision income of $50.5 million, compared to $52.6 million for 1Q 2016. Asset Quality Total NPAs increased by $19.0 million primarily related to the inflow of a $35.0 million commercial relationship, partially offset by reductions in non-performing residential mortgage loans and OREO.Non-performing loan inflows amounted to $78.0 million, a decrease of $99.3 million, compared to inflows of $177.3 million in 1Q 2016 that included the migration of $128.6 million (hotel loans guaranteed by TDF). Provision for loan and lease losses of $21.0 million, a slight decrease compared to 1Q 2016.Early stage delinquencies are down 13% compared to 1Q 2016. Core Deposits Deposits, net of government and brokered, decreased by $37.4 million to $6.8 billion reflecting a decrease in deposits in Florida and the Virgin Islands. Puerto Rico core deposits increased $11.2 million.Brokered certificates of deposit (CDs) decreased by $197.2 million in 2Q 2016.Government deposits increased by $24.8 million primarily reflecting higher balances in Puerto Rico. Capital During 2Q 2016 FBP brought current accrued and unpaid interest on trust preferred securities.2Q 2016 capital position: Total Risk Based Capital Ratio of 20.7%;Tier 1 Ratio Risk Based Capital Ratio of 17.1%; andLeverage Ratio of 12.3%.Tangible book value per common share of $7.83 compared to $7.66 in 1Q 2016. Second Quarter 2016 Highlights
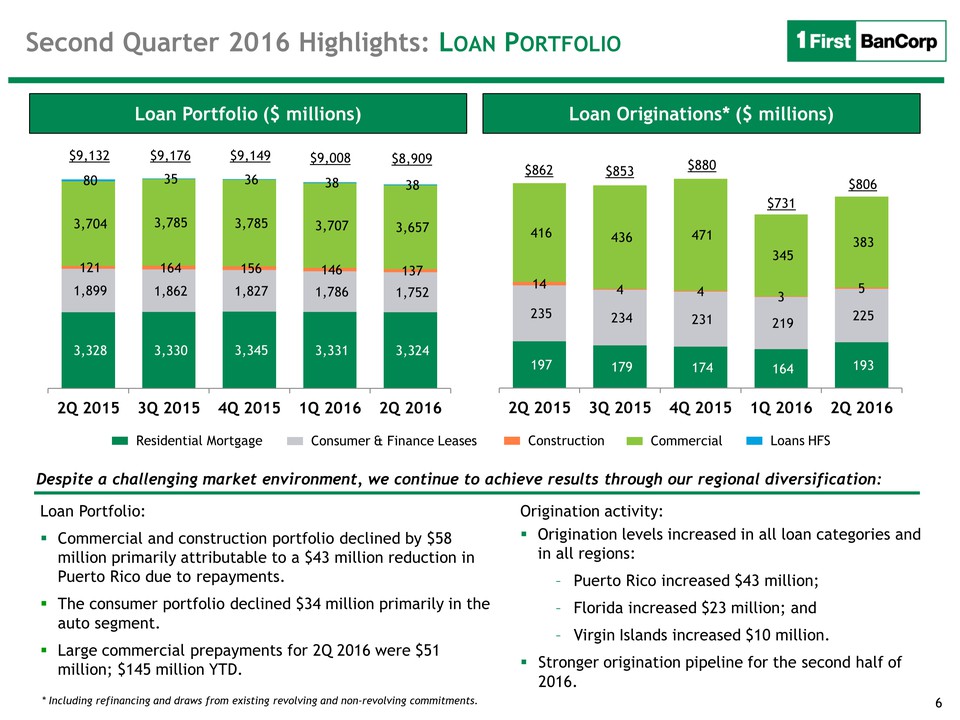
6 Loan Originations* ($ millions) Loan Portfolio ($ millions) $880 Residential Mortgage Consumer & Finance Leases Construction Commercial Loans HFS Loan Portfolio:Commercial and construction portfolio declined by $58 million primarily attributable to a $43 million reduction in Puerto Rico due to repayments.The consumer portfolio declined $34 million primarily in the auto segment.Large commercial prepayments for 2Q 2016 were $51 million; $145 million YTD. Origination activity:Origination levels increased in all loan categories and in all regions:Puerto Rico increased $43 million;Florida increased $23 million; andVirgin Islands increased $10 million.Stronger origination pipeline for the second half of 2016. Despite a challenging market environment, we continue to achieve results through our regional diversification: * Including refinancing and draws from existing revolving and non-revolving commitments. Second Quarter 2016 Highlights: Loan Portfolio $9,132 $862 $9,176 $853 $9,008 $731 $9,149 $8,909 $806
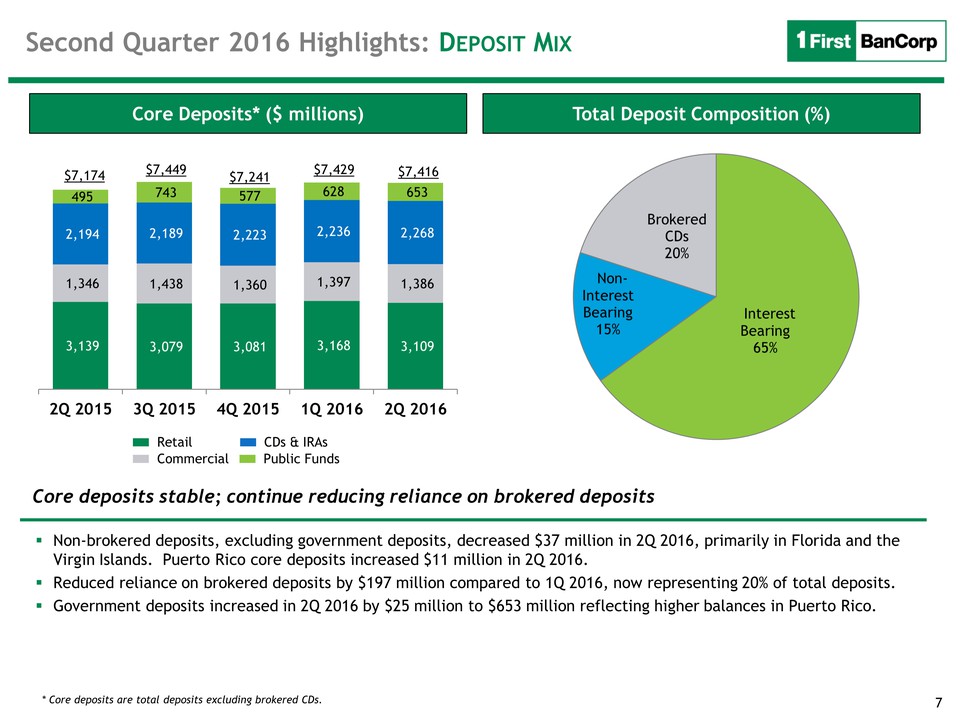
7 Total Deposit Composition (%) Core Deposits* ($ millions) * Core deposits are total deposits excluding brokered CDs. Non-brokered deposits, excluding government deposits, decreased $37 million in 2Q 2016, primarily in Florida and the Virgin Islands. Puerto Rico core deposits increased $11 million in 2Q 2016.Reduced reliance on brokered deposits by $197 million compared to 1Q 2016, now representing 20% of total deposits.Government deposits increased in 2Q 2016 by $25 million to $653 million reflecting higher balances in Puerto Rico. Core deposits stable; continue reducing reliance on brokered deposits Second Quarter 2016 Highlights: Deposit Mix Retail Commercial CDs & IRAs Public Funds $7,174 $7,449 $7,241 $7,429 $7,416
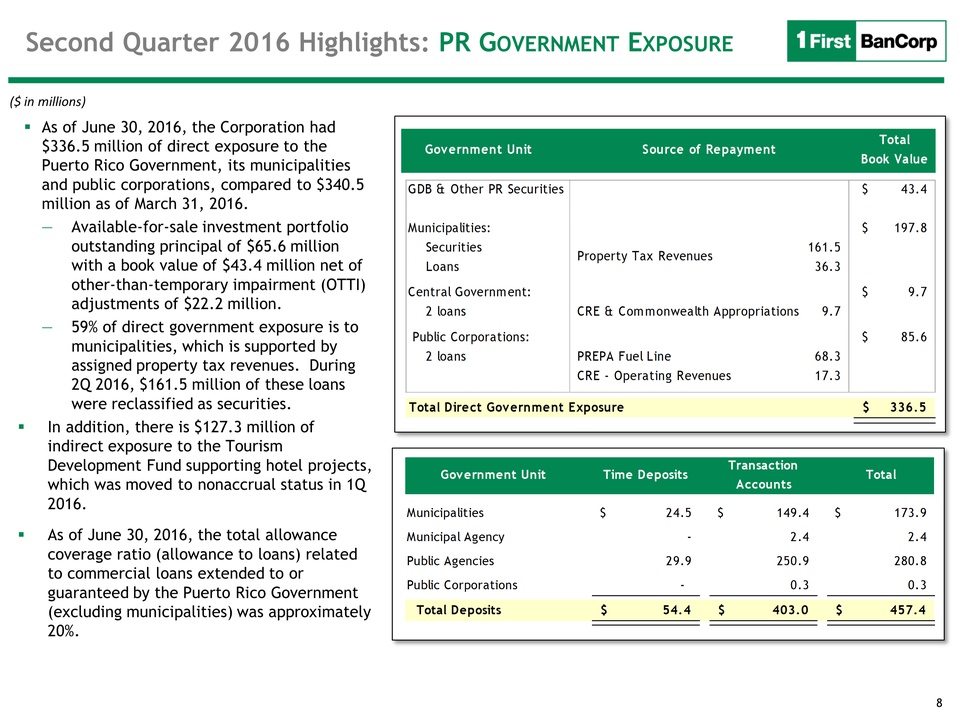
8 Second Quarter 2016 Highlights: PR Government Exposure As of June 30, 2016, the Corporation had $336.5 million of direct exposure to the Puerto Rico Government, its municipalities and public corporations, compared to $340.5 million as of March 31, 2016. Available-for-sale investment portfolio outstanding principal of $65.6 million with a book value of $43.4 million net of other-than-temporary impairment (OTTI) adjustments of $22.2 million.59% of direct government exposure is to municipalities, which is supported by assigned property tax revenues. During 2Q 2016, $161.5 million of these loans were reclassified as securities. In addition, there is $127.3 million of indirect exposure to the Tourism Development Fund supporting hotel projects, which was moved to nonaccrual status in 1Q 2016.As of June 30, 2016, the total allowance coverage ratio (allowance to loans) related to commercial loans extended to or guaranteed by the Puerto Rico Government (excluding municipalities) was approximately 20%. ($ in millions)

9 Results of Operations Second Quarter 2016 Results
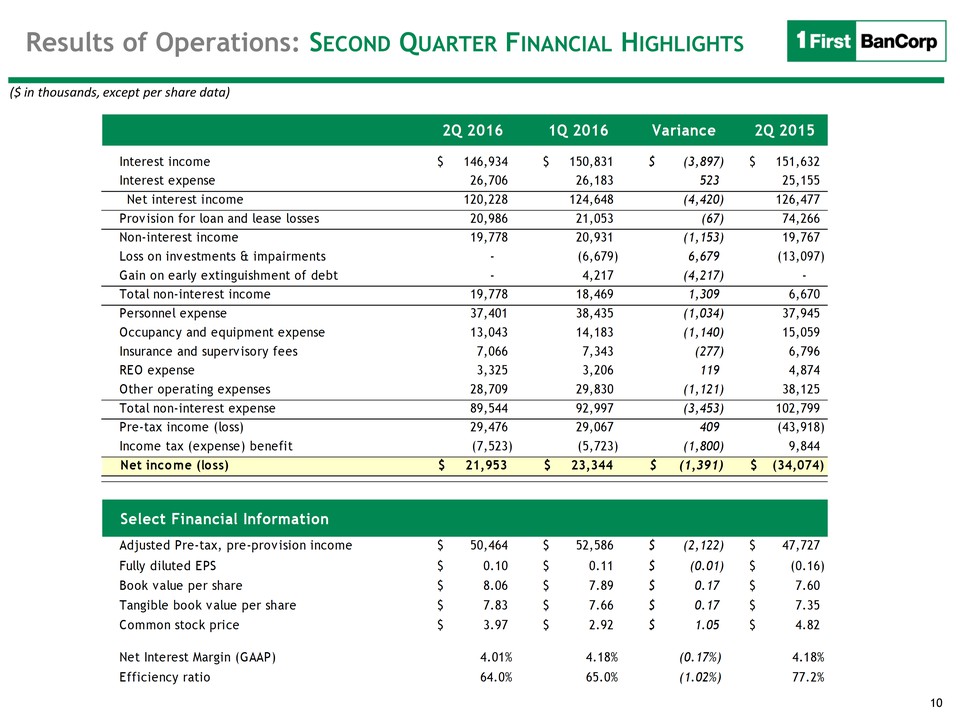
10 Results of Operations: Second Quarter Financial Highlights ($ in thousands, except per share data) Select Financial Information
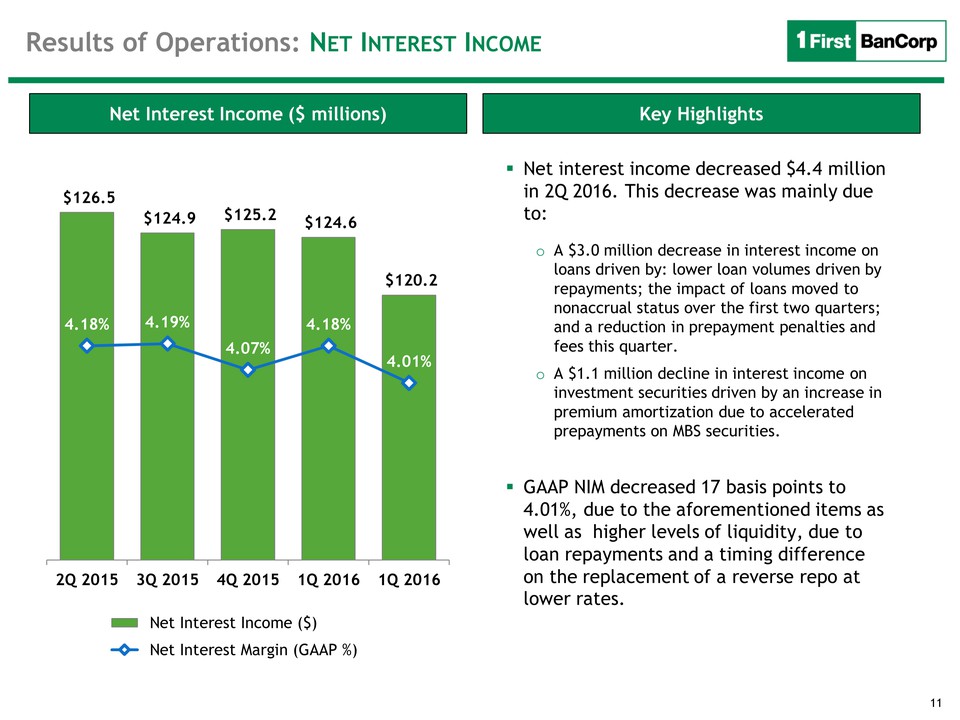
11 Key Highlights Net Interest Income ($ millions) Net interest income decreased $4.4 million in 2Q 2016. This decrease was mainly due to:A $3.0 million decrease in interest income on loans driven by: lower loan volumes driven by repayments; the impact of loans moved to nonaccrual status over the first two quarters; and a reduction in prepayment penalties and fees this quarter.A $1.1 million decline in interest income on investment securities driven by an increase in premium amortization due to accelerated prepayments on MBS securities.GAAP NIM decreased 17 basis points to 4.01%, due to the aforementioned items as well as higher levels of liquidity, due to loan repayments and a timing difference on the replacement of a reverse repo at lower rates. Results of Operations: Net Interest Income
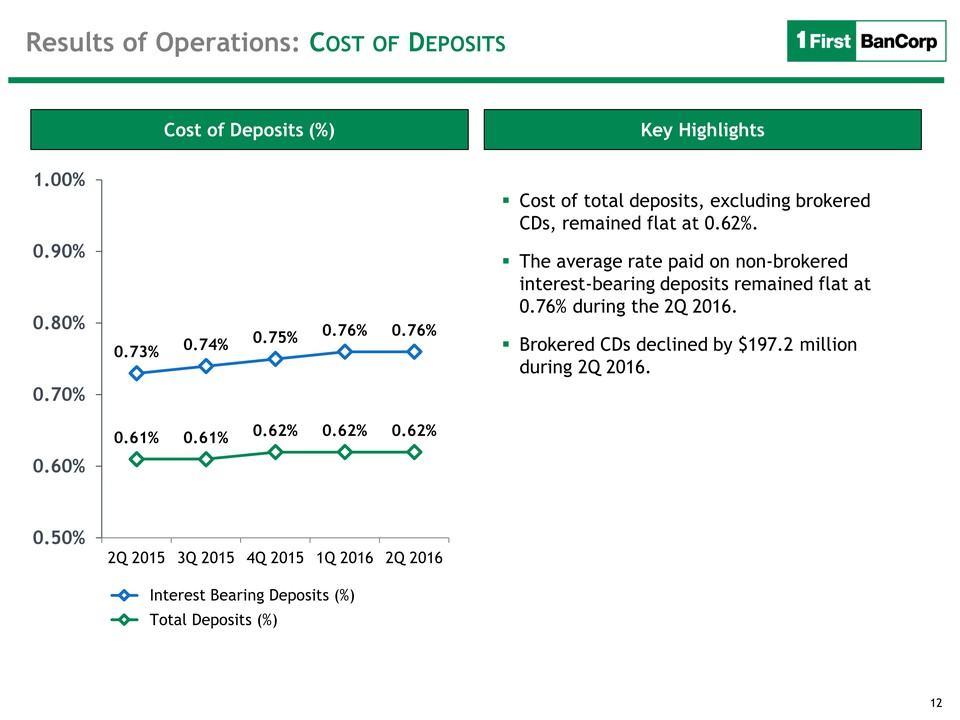
12 Key Highlights Cost of Deposits (%) Cost of total deposits, excluding brokered CDs, remained flat at 0.62%.The average rate paid on non-brokered interest-bearing deposits remained flat at 0.76% during the 2Q 2016.Brokered CDs declined by $197.2 million during 2Q 2016. Results of Operations: Cost of Deposits
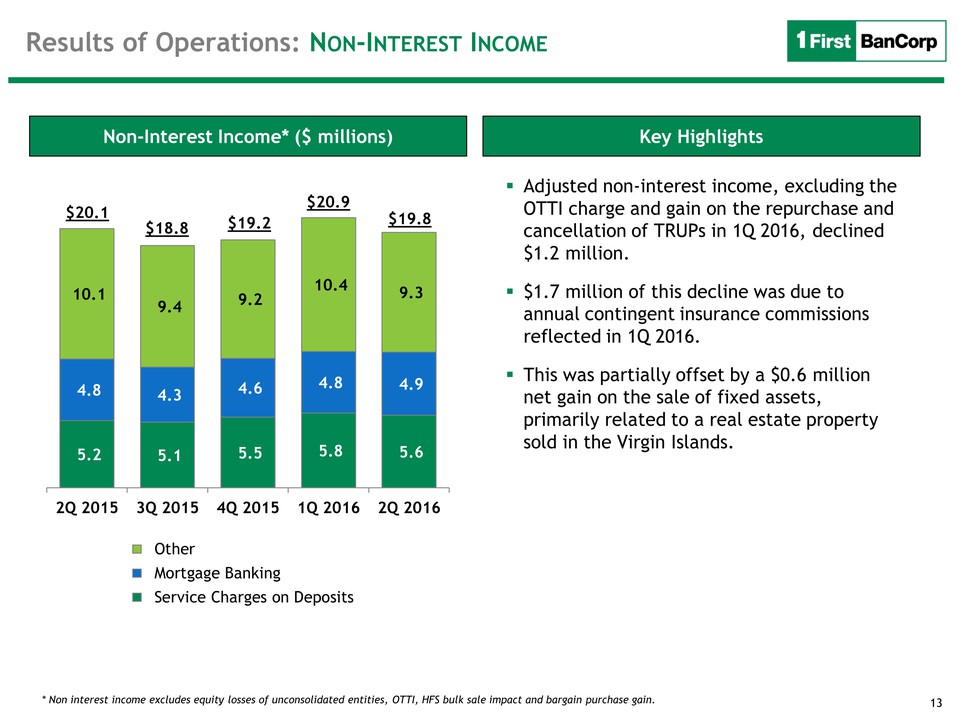
13 Key Highlights Non-Interest Income* ($ millions) * Non interest income excludes equity losses of unconsolidated entities, OTTI, HFS bulk sale impact and bargain purchase gain. Adjusted non-interest income, excluding the OTTI charge and gain on the repurchase and cancellation of TRUPs in 1Q 2016, declined $1.2 million.$1.7 million of this decline was due to annual contingent insurance commissions reflected in 1Q 2016.This was partially offset by a $0.6 million net gain on the sale of fixed assets, primarily related to a real estate property sold in the Virgin Islands. $19.2 Results of Operations: Non-Interest Income $20.1 $18.8 $20.9 $19.8
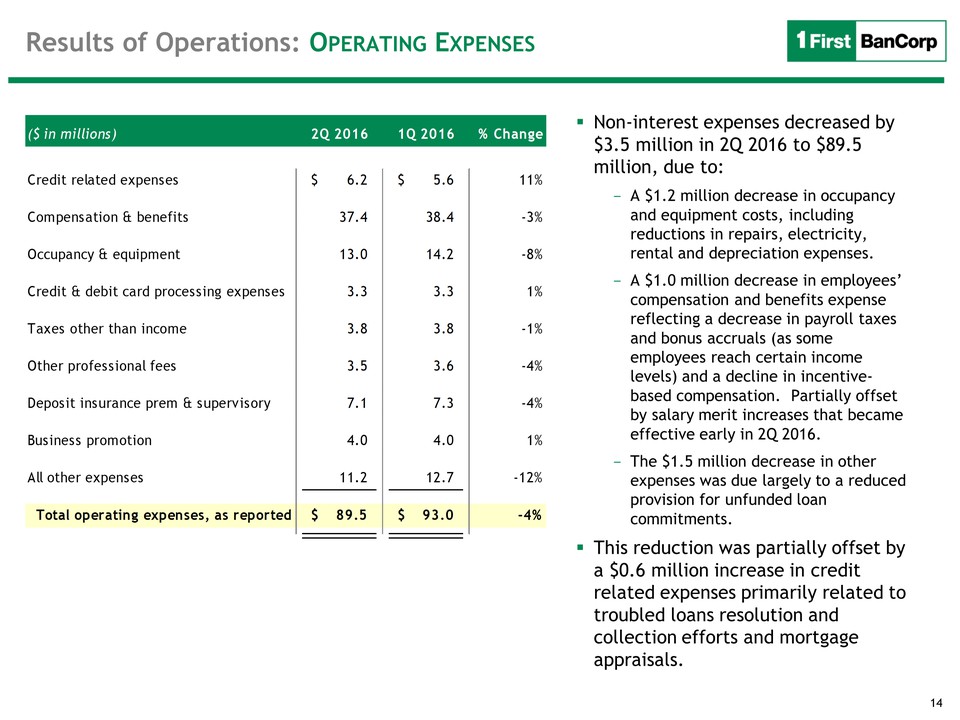
14 Results of Operations: Operating Expenses Non-interest expenses decreased by $3.5 million in 2Q 2016 to $89.5 million, due to:A $1.2 million decrease in occupancy and equipment costs, including reductions in repairs, electricity, rental and depreciation expenses.A $1.0 million decrease in employees’ compensation and benefits expense reflecting a decrease in payroll taxes and bonus accruals (as some employees reach certain income levels) and a decline in incentive-based compensation. Partially offset by salary merit increases that became effective early in 2Q 2016.The $1.5 million decrease in other expenses was due largely to a reduced provision for unfunded loan commitments.This reduction was partially offset by a $0.6 million increase in credit related expenses primarily related to troubled loans resolution and collection efforts and mortgage appraisals.
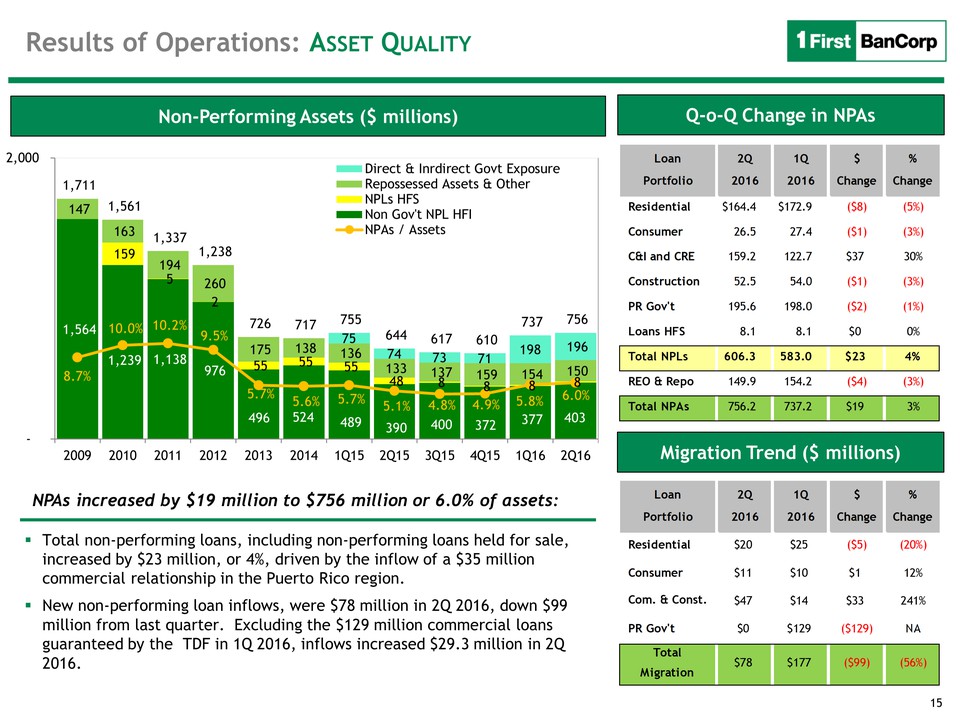
15 Non-Performing Assets ($ millions) Total non-performing loans, including non-performing loans held for sale, increased by $23 million, or 4%, driven by the inflow of a $35 million commercial relationship in the Puerto Rico region.New non-performing loan inflows, were $78 million in 2Q 2016, down $99 million from last quarter. Excluding the $129 million commercial loans guaranteed by the TDF in 1Q 2016, inflows increased $29.3 million in 2Q 2016. NPAs increased by $19 million to $756 million or 6.0% of assets: Results of Operations: Asset Quality Q-o-Q Change in NPAs Migration Trend ($ millions)
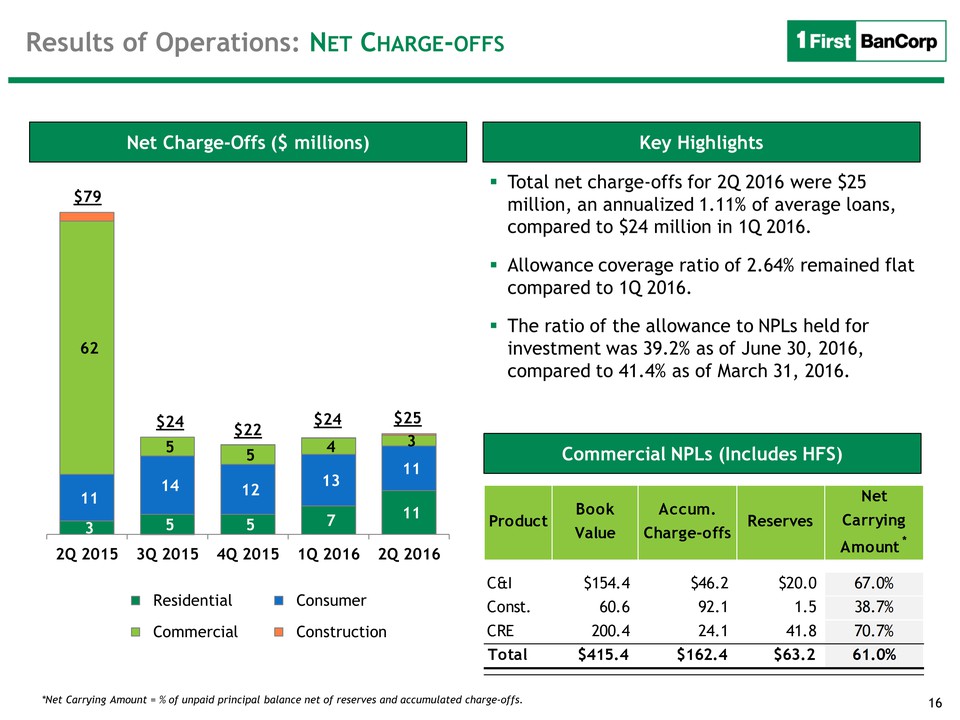
16 Key Highlights Net Charge-Offs ($ millions) Total net charge-offs for 2Q 2016 were $25 million, an annualized 1.11% of average loans, compared to $24 million in 1Q 2016. Allowance coverage ratio of 2.64% remained flat compared to 1Q 2016. The ratio of the allowance to NPLs held for investment was 39.2% as of June 30, 2016, compared to 41.4% as of March 31, 2016. Commercial NPLs (Includes HFS) *Net Carrying Amount = % of unpaid principal balance net of reserves and accumulated charge-offs. Results of Operations: Net Charge-offs $79 $24 $25
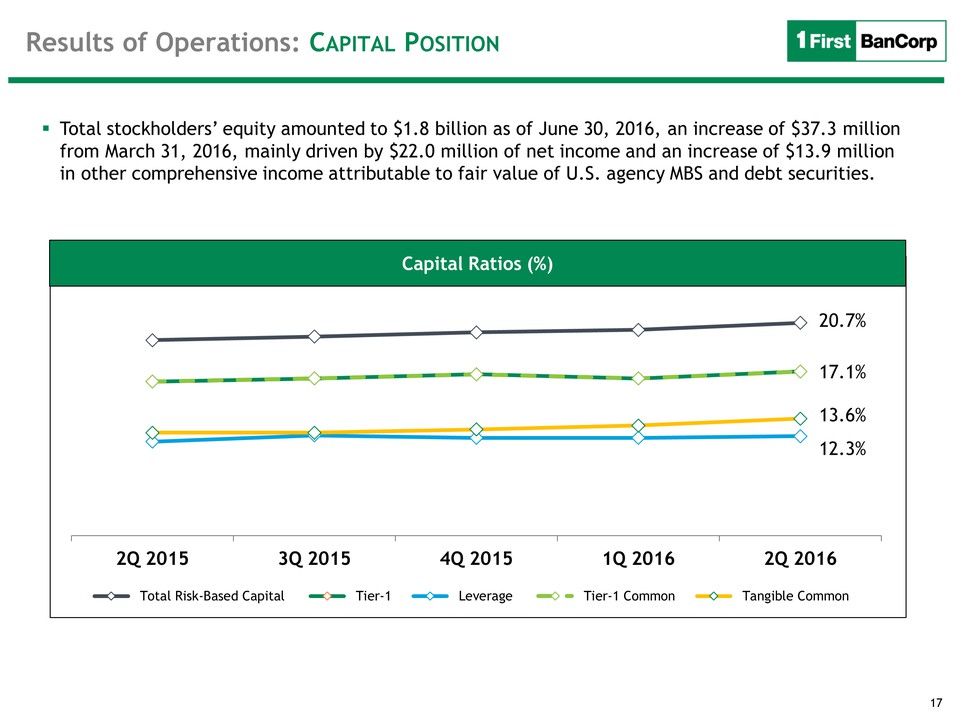
17 Results of Operations: Capital Position Capital Ratios (%) Total stockholders’ equity amounted to $1.8 billion as of June 30, 2016, an increase of $37.3 million from March 31, 2016, mainly driven by $22.0 million of net income and an increase of $13.9 million in other comprehensive income attributable to fair value of U.S. agency MBS and debt securities. Capital Ratios (%)

18 Second Quarter Results Q & A

19 Second Quarter Results Exhibits
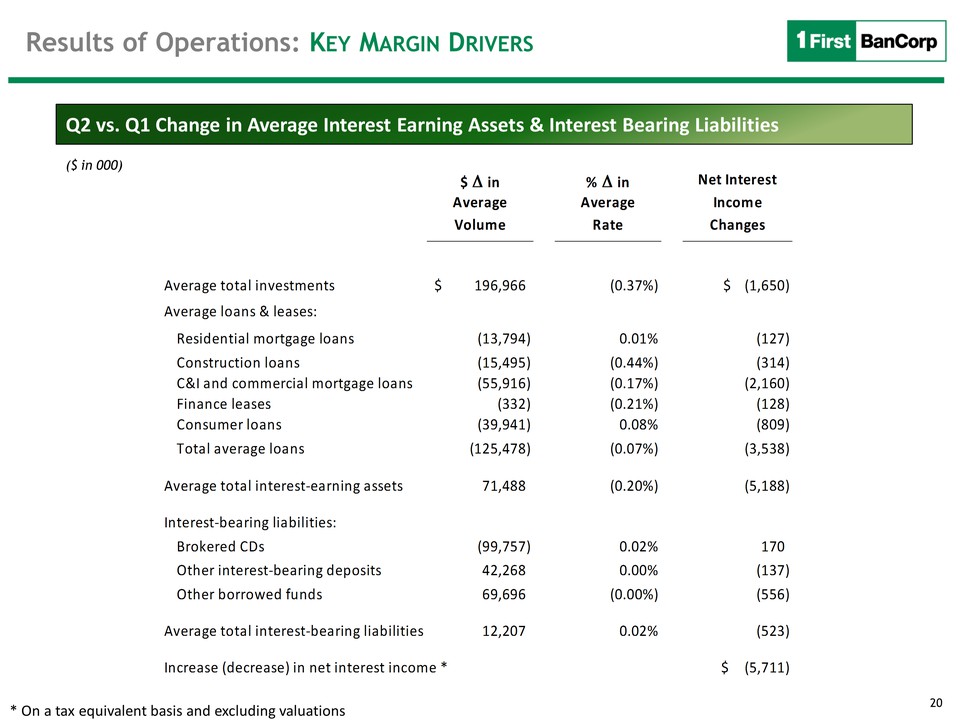
20 Results of Operations: Key Margin Drivers Q2 vs. Q1 Change in Average Interest Earning Assets & Interest Bearing Liabilities * On a tax equivalent basis and excluding valuations ($ in 000)
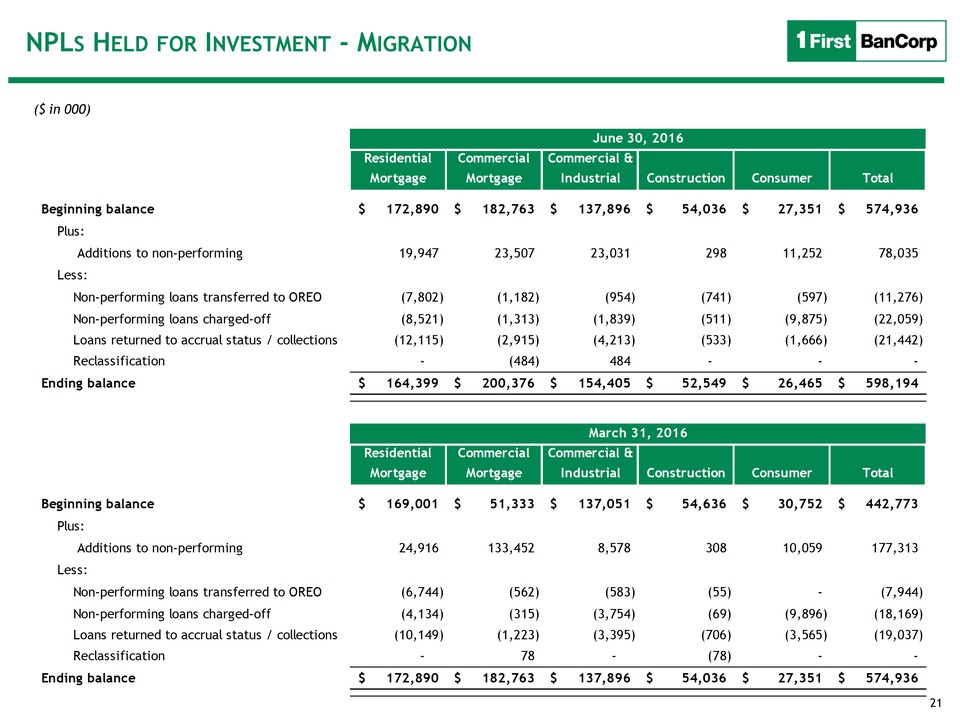
21 NPLs Held for Investment - Migration ($ in 000)
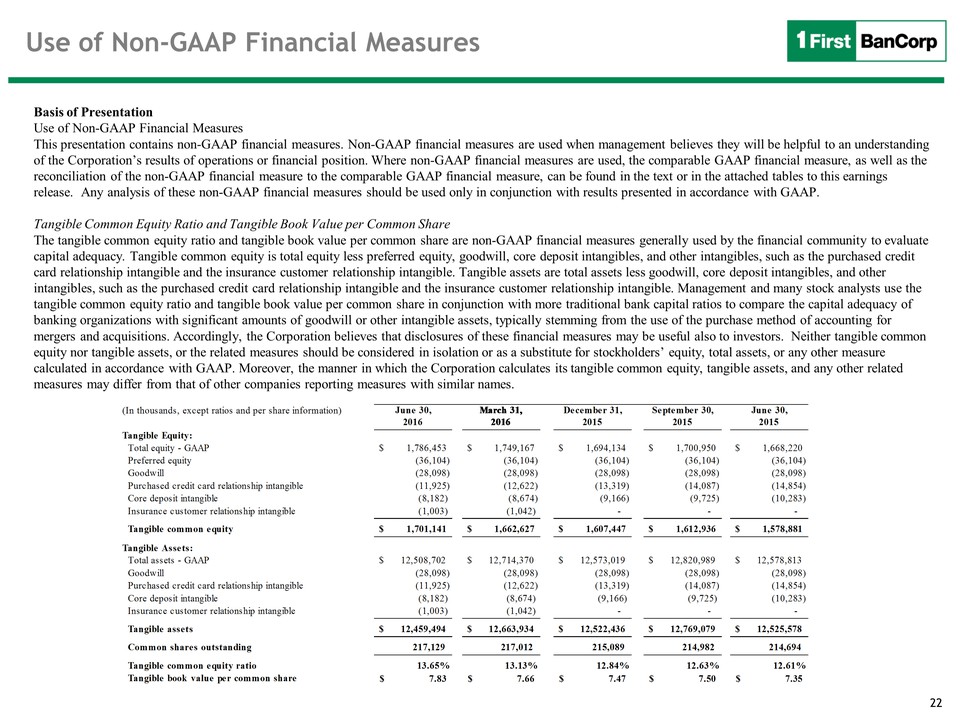
22 Use of Non-GAAP Financial Measures Basis of PresentationUse of Non-GAAP Financial Measures This presentation contains non-GAAP financial measures. Non-GAAP financial measures are used when management believes they will be helpful to an understanding of the Corporation’s results of operations or financial position. Where non-GAAP financial measures are used, the comparable GAAP financial measure, as well as the reconciliation of the non-GAAP financial measure to the comparable GAAP financial measure, can be found in the text or in the attached tables to this earnings release. Any analysis of these non-GAAP financial measures should be used only in conjunction with results presented in accordance with GAAP. Tangible Common Equity Ratio and Tangible Book Value per Common Share The tangible common equity ratio and tangible book value per common share are non-GAAP financial measures generally used by the financial community to evaluate capital adequacy. Tangible common equity is total equity less preferred equity, goodwill, core deposit intangibles, and other intangibles, such as the purchased credit card relationship intangible and the insurance customer relationship intangible. Tangible assets are total assets less goodwill, core deposit intangibles, and other intangibles, such as the purchased credit card relationship intangible and the insurance customer relationship intangible. Management and many stock analysts use the tangible common equity ratio and tangible book value per common share in conjunction with more traditional bank capital ratios to compare the capital adequacy of banking organizations with significant amounts of goodwill or other intangible assets, typically stemming from the use of the purchase method of accounting for mergers and acquisitions. Accordingly, the Corporation believes that disclosures of these financial measures may be useful also to investors. Neither tangible common equity nor tangible assets, or the related measures should be considered in isolation or as a substitute for stockholders’ equity, total assets, or any other measure calculated in accordance with GAAP. Moreover, the manner in which the Corporation calculates its tangible common equity, tangible assets, and any other related measures may differ from that of other companies reporting measures with similar names.
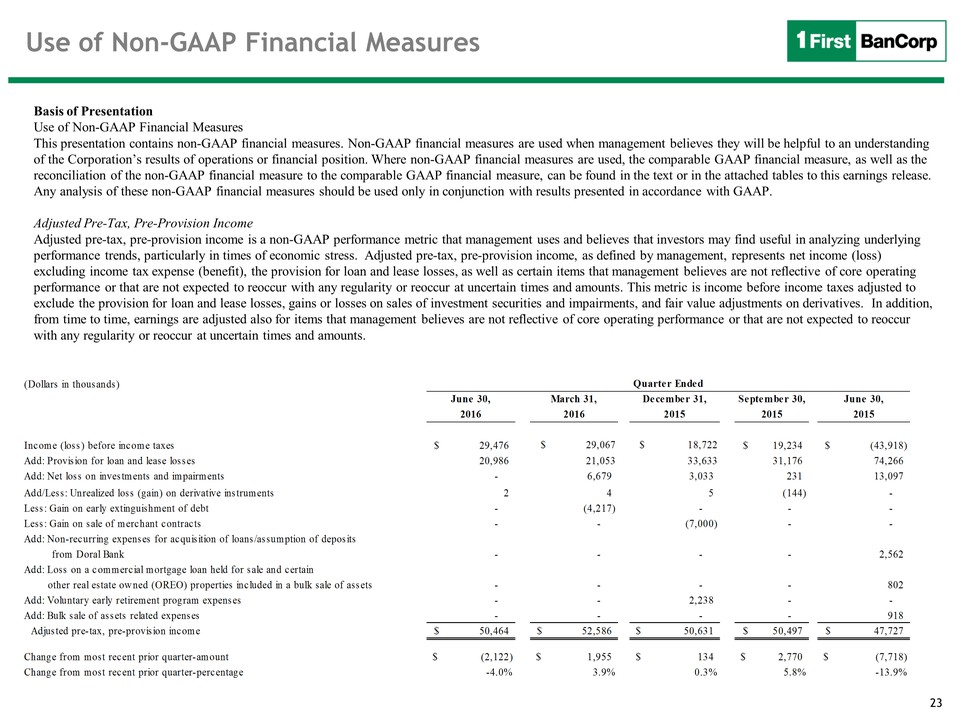
23 Use of Non-GAAP Financial Measures Basis of PresentationUse of Non-GAAP Financial Measures This presentation contains non-GAAP financial measures. Non-GAAP financial measures are used when management believes they will be helpful to an understanding of the Corporation’s results of operations or financial position. Where non-GAAP financial measures are used, the comparable GAAP financial measure, as well as the reconciliation of the non-GAAP financial measure to the comparable GAAP financial measure, can be found in the text or in the attached tables to this earnings release. Any analysis of these non-GAAP financial measures should be used only in conjunction with results presented in accordance with GAAP. Adjusted Pre-Tax, Pre-Provision IncomeAdjusted pre-tax, pre-provision income is a non-GAAP performance metric that management uses and believes that investors may find useful in analyzing underlying performance trends, particularly in times of economic stress. Adjusted pre-tax, pre-provision income, as defined by management, represents net income (loss) excluding income tax expense (benefit), the provision for loan and lease losses, as well as certain items that management believes are not reflective of core operating performance or that are not expected to reoccur with any regularity or reoccur at uncertain times and amounts. This metric is income before income taxes adjusted to exclude the provision for loan and lease losses, gains or losses on sales of investment securities and impairments, and fair value adjustments on derivatives. In addition, from time to time, earnings are adjusted also for items that management believes are not reflective of core operating performance or that are not expected to reoccur with any regularity or reoccur at uncertain times and amounts.