Attached files
| file | filename |
|---|---|
| EX-99.1 - EX-99.1 - People's United Financial, Inc. | d230483dex991.htm |
| 8-K - FORM 8-K - People's United Financial, Inc. | d230483d8k.htm |
Exhibit 99.2

People’s United®
Financial, Inc.
Second Quarter 2016 Results
NASDAQ: PBCT July 21, 2016
Forward-Looking Statement
Certain statements contained in this release are forward-looking in nature. These include all statements about People’s United Financial’s plans,
objectives, expectations and other statements that are not historical facts, and usually use words such as “expect,” “anticipate,” “believe,” “should” and similar expressions. Such statements represent
management’s current beliefs, based upon information available at the time the statements are made, with regard to the matters addressed. All forward-looking statements are subject to risks and uncertainties that could cause People’s
United Financial’s actual results or financial condition to differ materially from those expressed in or implied by such statements. Factors of particular importance to People’s United Financial include, but are not limited to: (1) changes
in general, national or regional economic conditions; (2) changes in interest rates; (3) changes in loan default and charge-off rates; (4) changes in deposit levels; (5) changes in levels of income and expense in non-interest income and expense
related activities; (6) changes in accounting and regulatory guidance applicable to banks; (7) price levels and conditions in the public securities markets generally; (8) competition and its effect on pricing, spending, third-party relationships and
revenues; and (9) changes in regulation resulting from or relating to financial reform legislation. People’s United Financial does not undertake any obligation to update or revise any forward-looking statements, whether as a result of new
information, future events or otherwise.
People’s United®
Financial,
Inc. 1
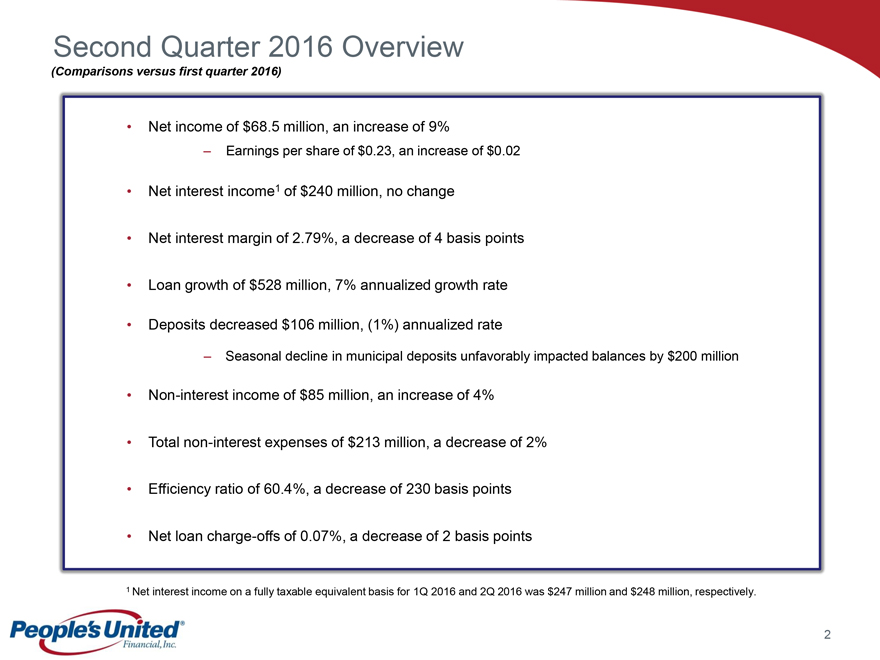
Second Quarter 2016 Overview
(Comparisons versus first quarter 2016)
Net income of $68.5 million, an increase of 9%
- Earnings per share of $0.23, an increase of $0.02
Net interest income1 of
$240 million, no change
Net interest margin of 2.79%, a decrease of 4 basis points
Loan growth of $528 million, 7% annualized growth rate
Deposits decreased $106 million, (1%)
annualized rate
- Seasonal decline in municipal deposits unfavorably impacted balances by $200 million
Non-interest income of $85 million, an increase of 4%
Total non-interest expenses of $213
million, a decrease of 2%
Efficiency ratio of 60.4%, a decrease of 230 basis points
Net loan charge-offs of 0.07%, a decrease of 2 basis points
1 Net interest income on a fully
taxable equivalent basis for 1Q 2016 and 2Q 2016 was $247 million and $248 million, respectively.
People’s United®
Financial, Inc. 2
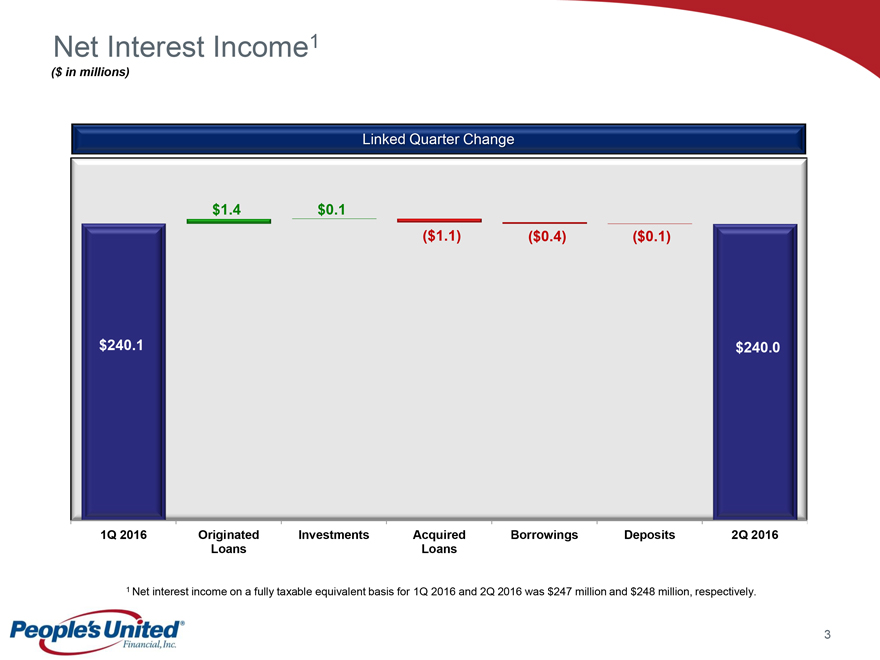
Net Interest Income1
($
in millions)
Linked Quarter Change
$1.4 $0.1
($1.1) ($0.4) ($0.1)
$240.1 $240.0
1Q 2016 Originated Loans Investments Acquired Loans Borrowings Deposits 2Q 2016
1 Net interest
income on a fully taxable equivalent basis for 1Q 2016 and 2Q 2016 was $247 million and $248 million, respectively.
People’s United®
Financial, Inc. 3
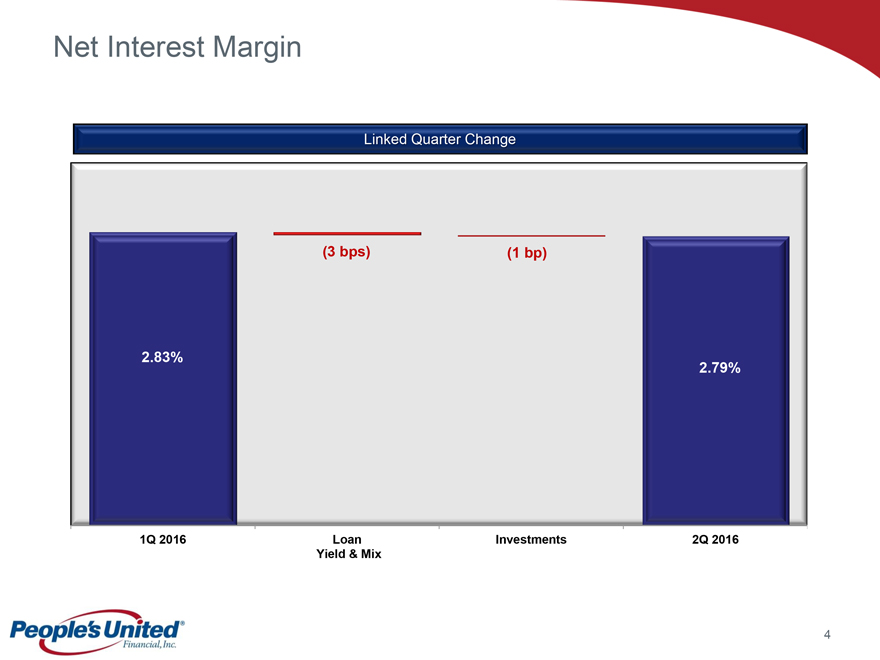
Net Interest Margin
Linked Quarter Change
(3 bps) (1 bp)
2.83%
2.79%
1Q 2016 Loan Yield & Mix Investments 2Q 2016
People’s United®
Financial, Inc. 4
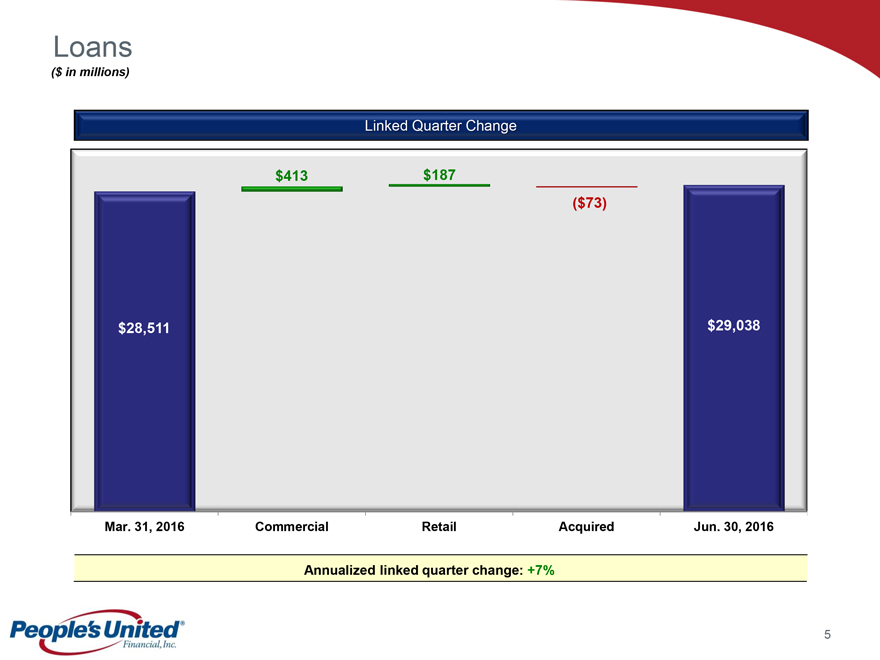
Loans
($ in millions)
Linked Quarter Change
$413 $187
($73)
$28,511 $29,038
Mar. 31, 2016 Commercial Retail Acquired Jun. 30, 2016
Annualized linked quarter change: +7%
People’s United®
Financial, Inc. 5
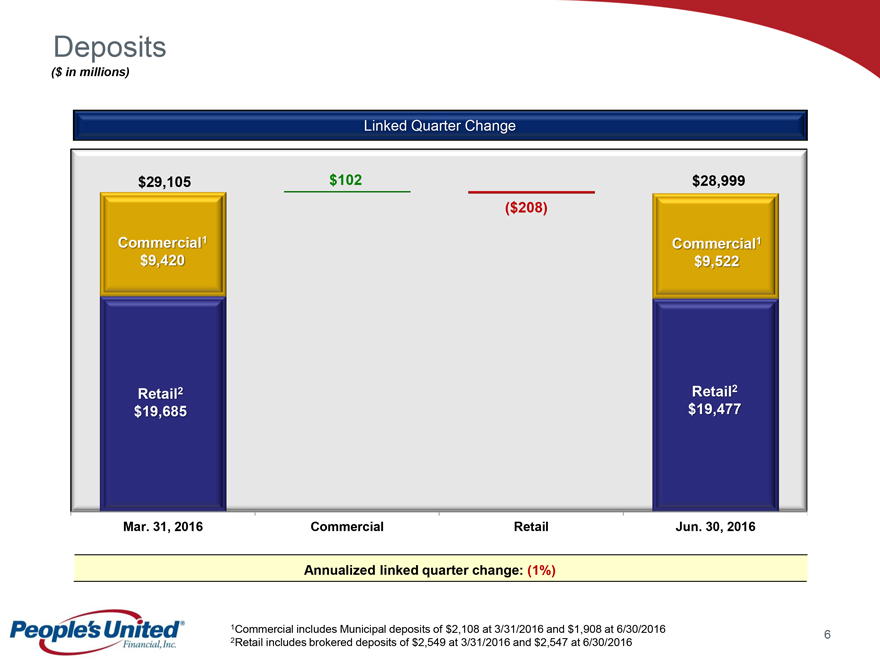
Deposits
($ in millions)
Linked Quarter Change
$29,105 $102 $28,999
($208)
Commercial1 Commercial1
$9,420 $9,522
Retail2 Retail2
$19,685 $19,477
Mar. 31, 2016 Commercial Retail Jun. 30, 2016
Annualized linked quarter change: (1%)
1Commercial includes Municipal deposits of $2,108 at
3/31/2016 and $1,908 at 6/30/2016
People’s United®
Financial, Inc. 6
2Retail includes brokered deposits of $2,549 at 3/31/2016 and $2,547 at 6/30/2016
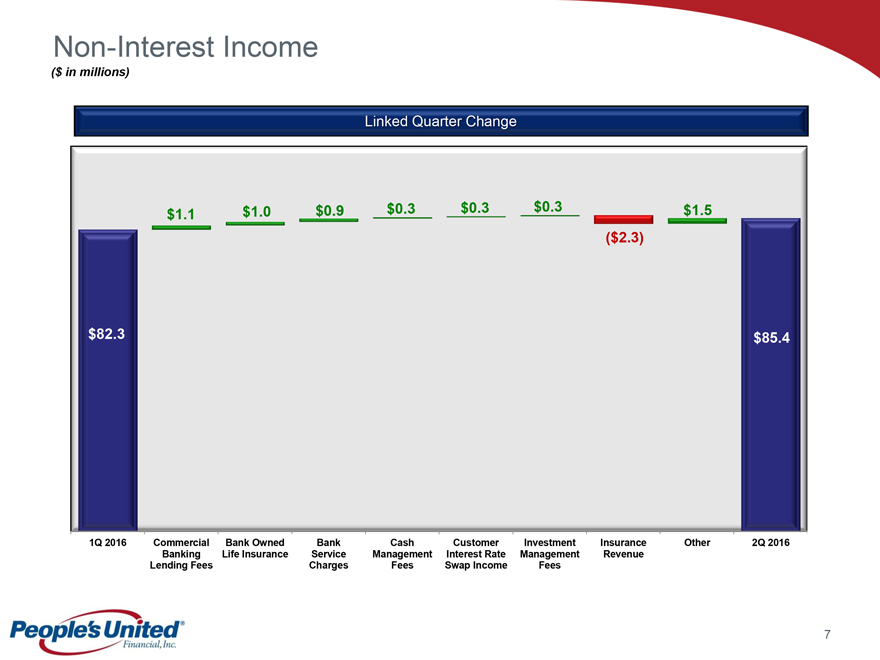
Non-Interest Income
($ in
millions)
Linked Quarter Change
$1.1 $1.0 $0.9 $0.3 $0.3 $0.3 $1.5
($2.3)
$82.3 $85.4
1Q 2016 Commercial Bank Owned Bank Cash Customer Investment Insurance Other 2Q 2016
Banking
Life Insurance Service Management Interest Rate Management Revenue
Lending Fees Charges Fees Swap Income Fees
People’s United®
Financial, Inc. 7
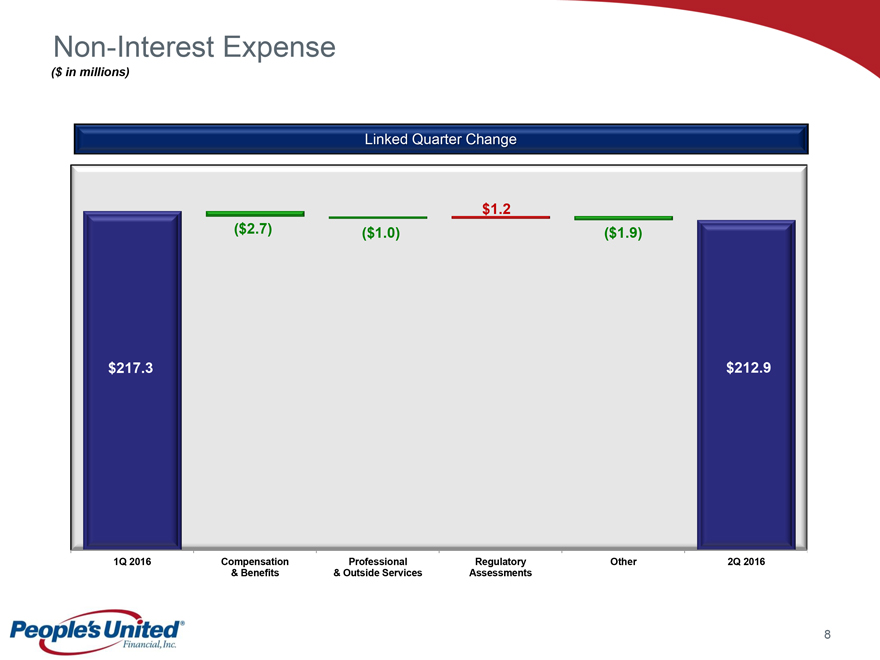
Non-Interest Expense
($
in millions)
Linked Quarter Change
$1.2
($2.7) ($1.0) ($1.9)
$217.3 $212.9
1Q 2016 Compensation Professional Regulatory Other 2Q 2016
& Benefits & Outside
Services Assessments
People’s United®
Financial, Inc. 8
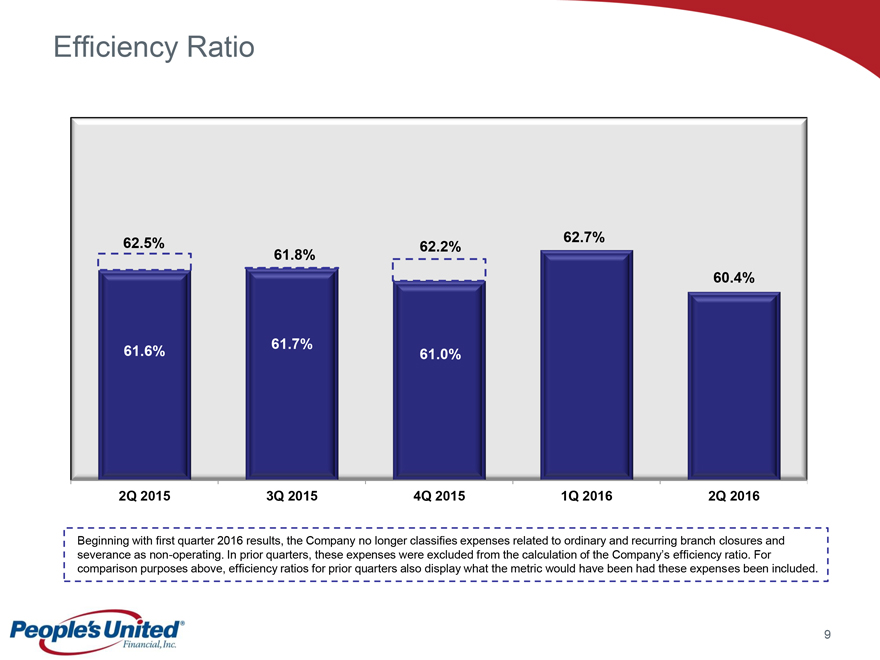
Efficiency Ratio
62.5%
61.8%
62.2%
62.7%
60.4%
61.6%
61.7%
61.0%
2Q 2015
3Q 2015
4Q 2015
1Q 2016
2Q 2016
Beginning with first quarter 2016 results, the Company no longer classifies expenses related to ordinary and recurring branch closures and severance as non-operating. In prior
quarters, these expenses were excluded from the calculation of the Company’s efficiency ratio. For comparison purposes above, efficiency ratios for prior quarters also display what the metric would have been had these expenses been included.
People’s United®
Financial, Inc.
9
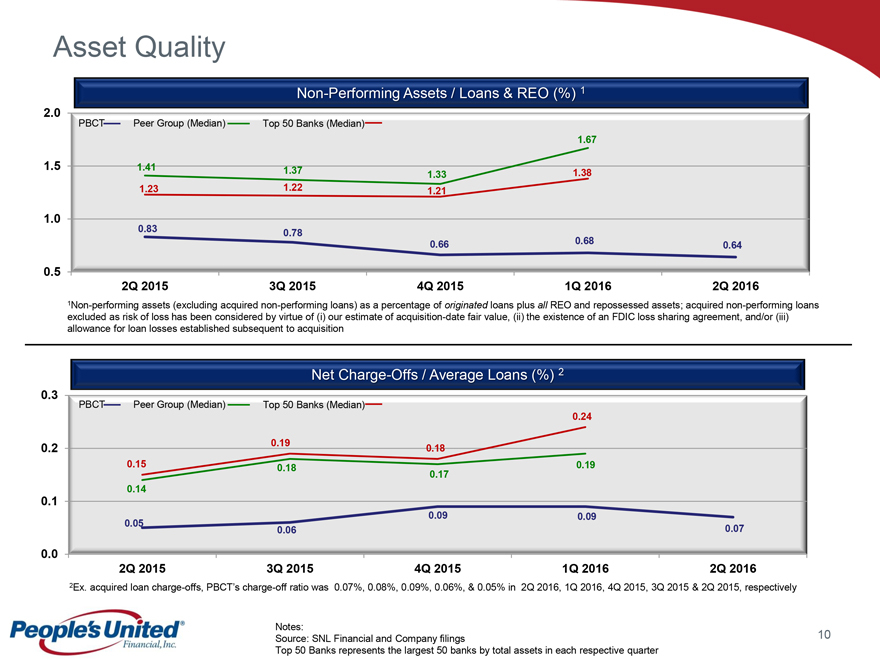
Asset Quality
Non
Performing Assets / Loans & REO (%) 1
2.0
PBCT Peer Group (Median) Top 50
Banks (Median)
1.5 1.41 1.37 1.33 1.67
1.23 1.22 1.21 1.38
1.0 0.83 0.78 0.66 0.68 0.64
0.5
2Q 2015 3Q 2015 4Q 2015 1Q 2016 2Q 2016
1Non-performing assets (excluding acquired
non-performing loans) as a percentage of originated loans plus all REO and repossessed assets; acquired non-performing loans excluded as risk of loss has been considered by virtue of (i) our estimate of acquisition-date fair value, (ii) the
existence of an FDIC loss sharing agreement, and/or (iii) allowance for loan losses established subsequent to acquisition
Net Charge-Offs / Average Loans (%) 2
0.3
PBCT Peer Group (Median) Top 50 Banks (Median)
0.2 0.15 0.19 0.18 0.24
0.14 0.18 0.17 0.19
0.1 0.05 0.06 0.09 0.09 0.07
0.0 2Q 2015
3Q 2015
4Q 2015
1Q 2016
2Q 2016
2Ex. acquired loan charge-offs, PBCT’s charge-off ratio was 0.07%, 0.08%, 0.09%, 0.06%, & 0.05% in 2Q 2016, 1Q 2016, 4Q 2015, 3Q 2015 & 2Q 2015, respectively
Notes:
People’s United®
Financial, Inc.
Source: SNL Financial and Company filings
Top 50 Banks represents the largest 50 banks by total assets in each respective quarter
10
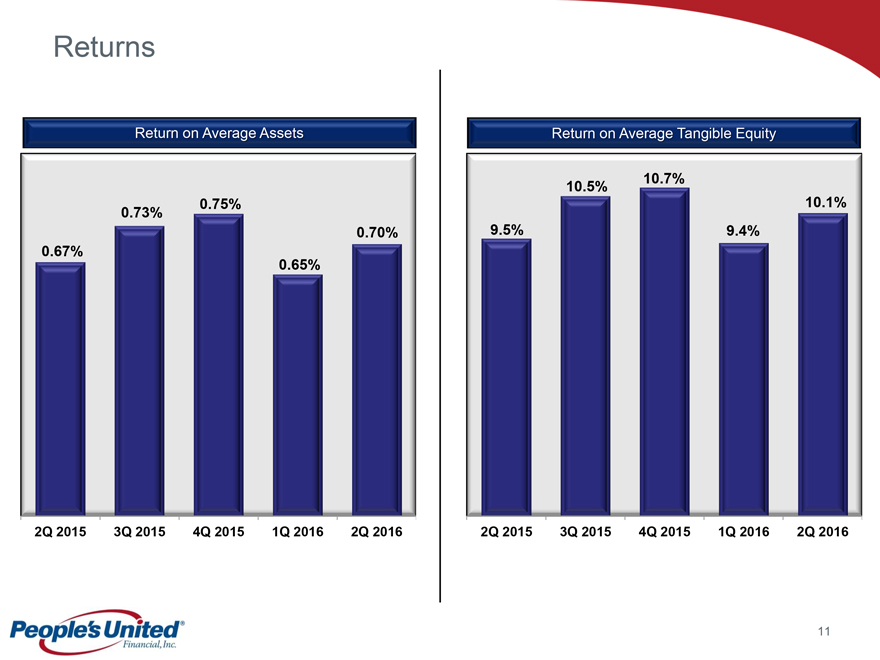
Returns
Return on Average
Assets
0.67%
0.73%
0.75%
0.70%
0.65%
2Q 2015
3Q 2015
4Q 2015
1Q 2016
2Q 2016
Return on Average Tangible Equity
9.5%
10.5%
10.7%
10.1%
9.4%
2Q 2015
3Q 2015
4Q 2015
1Q 2016
2Q 2016
People’s United®
Financial, Inc.
11
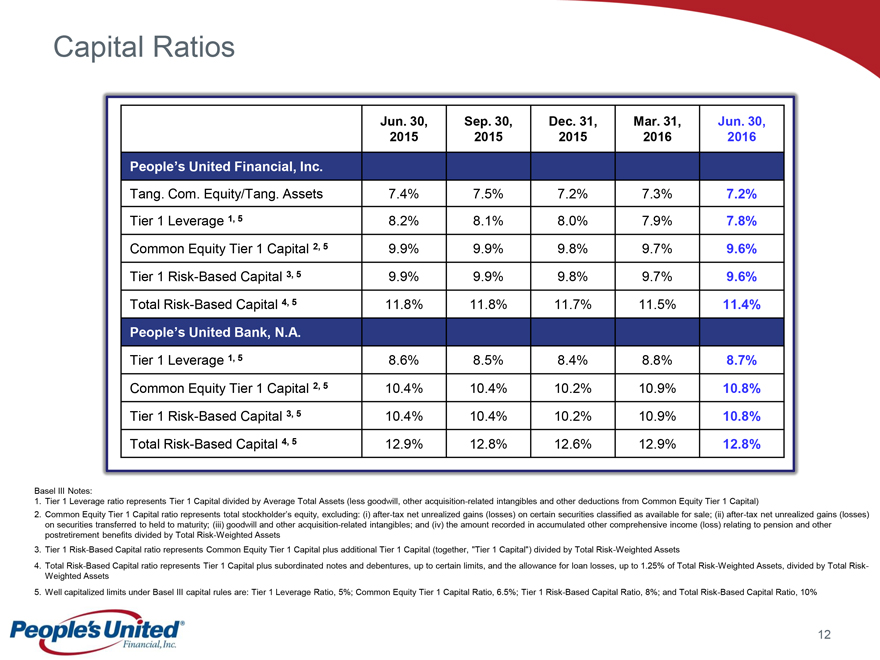
Capital Ratios
Jun. 30,
2015
Sep. 30, 2015
Dec. 31, 2015
Mar. 31, 2016
Jun. 30, 2016
People’s United Financial, Inc.
Tang. Com. Equity/Tang. Assets
7.4% 7.5% 7.2% 7.3% 7.2%
Tier 1 Leverage 1, 5
8.2% 8.1% 8.0% 7.9% 7.8%
Common Equity Tier 1 Capital 2, 5
9.9% 9.9% 9.8% 9.7% 9.6%
Tier 1 Risk-Based Capital 3, 5
9.9% 9.9% 9.8% 9.7% 9.6%
Total Risk-Based Capital 4, 5
11.8% 11.8% 11.7% 11.5% 11.4%
People’s United Bank, N.A.
Tier 1 Leverage 1, 5
8.6% 8.5% 8.4% 8.8% 8.7%
Common Equity Tier 1 Capital 2, 5
10.4% 10.4% 10.2% 10.9% 10.8%
Tier 1 Risk-Based Capital 3, 5
10.4% 10.4% 10.2% 10.9% 10.8%
Total Risk-Based Capital 4, 5
12.9% 12.8% 12.6% 12.9% 12.8%
Basel III Notes:
1. Tier 1 Leverage ratio represents Tier 1 Capital divided by Average Total
Assets (less goodwill, other acquisition-related intangibles and other deductions from Common Equity Tier 1 Capital)
2. Common Equity Tier 1 Capital ratio
represents total stockholder’s equity, excluding: (i) after-tax net unrealized gains (losses) on certain securities classified as available for sale; (ii) after-tax net unrealized gains (losses) on securities transferred to held to maturity;
(iii) goodwill and other acquisition-related intangibles; and (iv) the amount recorded in accumulated other comprehensive income (loss) relating to pension and other postretirement benefits divided by Total Risk-Weighted Assets
3. Tier 1 Risk-Based Capital ratio represents Common Equity Tier 1 Capital plus additional Tier 1 Capital (together, “Tier 1 Capital”) divided by Total Risk-Weighted
Assets
4. Total Risk-Based Capital ratio represents Tier 1 Capital plus subordinated notes and debentures, up to certain limits, and the allowance for loan losses,
up to 1.25% of Total Risk-Weighted Assets, divided by Total Risk-Weighted Assets
5. Well capitalized limits under Basel III capital rules are: Tier 1 Leverage
Ratio, 5%; Common Equity Tier 1 Capital Ratio, 6.5%; Tier 1 Risk-Based Capital Ratio, 8%; and Total Risk-Based Capital Ratio, 10%
People’s United®
Financial, Inc.
12
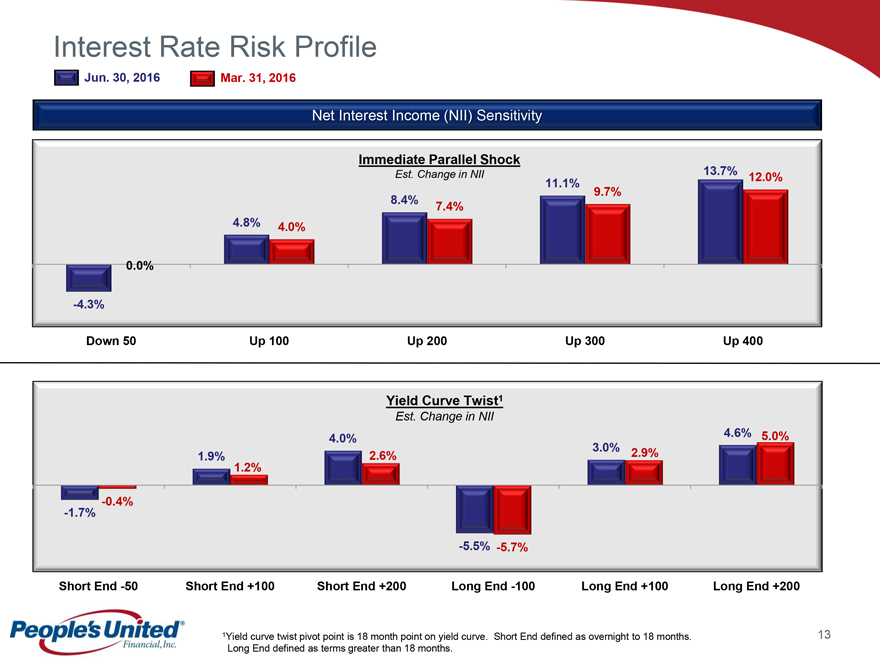
Interest Rate Risk Profile
Jun. 30, 2016 Mar. 31, 2016
Net Interest Income (NII) Sensitivity
Immediate Parallel Shock
Est. Change in NII
4.8%
4.0%
8.4%
7.4%
11.1%
9.7%
13.7%
12.0%
0.0%
-4.3%
Down 50
Up 100
Up 200
Up 300
Up 400
Yield Curve Twist1
Est. Change in NII
1.9% 1.2%
4.0% 2.6%
3.0% 2.9%
4.6% 5.0%
-0.4%
-1.7%
-5.5% -5.7%
Short End -50
Short End +100
Short End +200
Long End -100
Long End +100
Long End +200
People’s United®
Financial, Inc.
1Yield curve twist pivot point is 18 month point on yield curve. Short End defined as overnight to 18 months.
Long End defined as terms greater than 18 months.
13
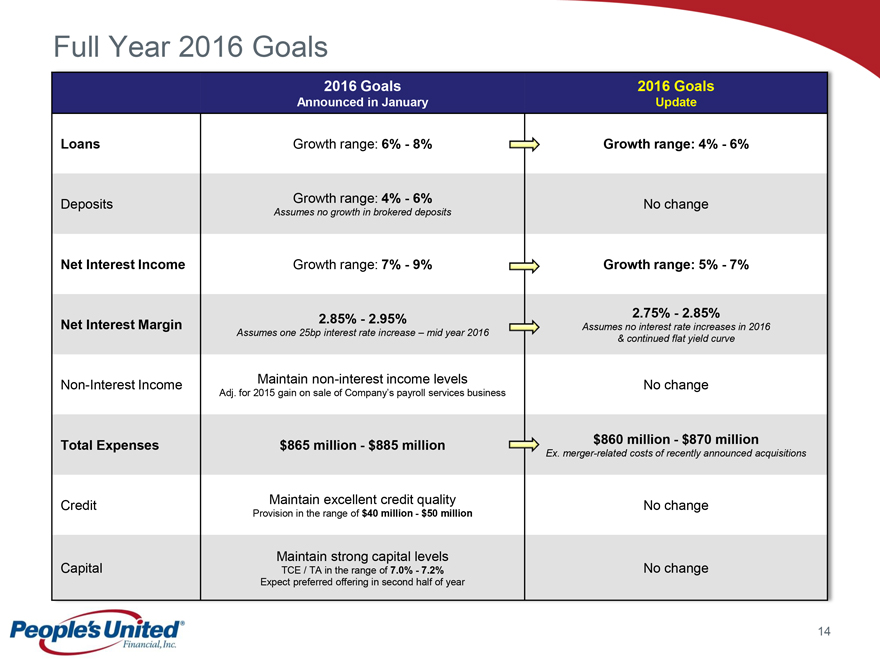
Full Year 2016 Goals
2016
Goals Announced in January
2016 Goals Update
Loans
Growth range: 6% - 8% Growth range: 4% - 6%
Deposits
Growth range: 4% - 6%
Assumes no growth in brokered deposits
No change
Net Interest Income
Growth range: 7% - 9%
Growth range: 5% - 7%
Net Interest Margin
2.85% - 2.95% Assumes one 25bp interest rate increase – mid year 2016
2.75% - 2.85% Assumes no interest rate increases in 2016 & continued flat yield curve
Non-Interest Income
Maintain non-interest income levels Adj. for 2015 gain on sale of
Company’s payroll services business
No change
Total Expenses
$865 million - $885 million
$860 million - $870 million Ex. merger-related costs of recently
announced acquisitions
Credit
Maintain excellent credit quality Provision in
the range of $40 million - $50 million Maintain strong capital levels
No change
Capital
TCE / TA in the range of 7.0% - 7.2% Expect preferred offering in
second half of year
No change
People’s United®
Financial, Inc.
14
Summary
Premium brand
built over 170 years
Deep focus on expense management
Conservative &
well-defined underwriting culture
Breadth of products & services
Commitment to relationship-based banking
...with significant knowledge at the
local level
Operate in large & attractive Northeast markets…
Experienced leadership team
People’s United®
Financial, Inc.
A Uniquely Positioned Franchise
People’s United®
Financial, Inc.
15

Appendix
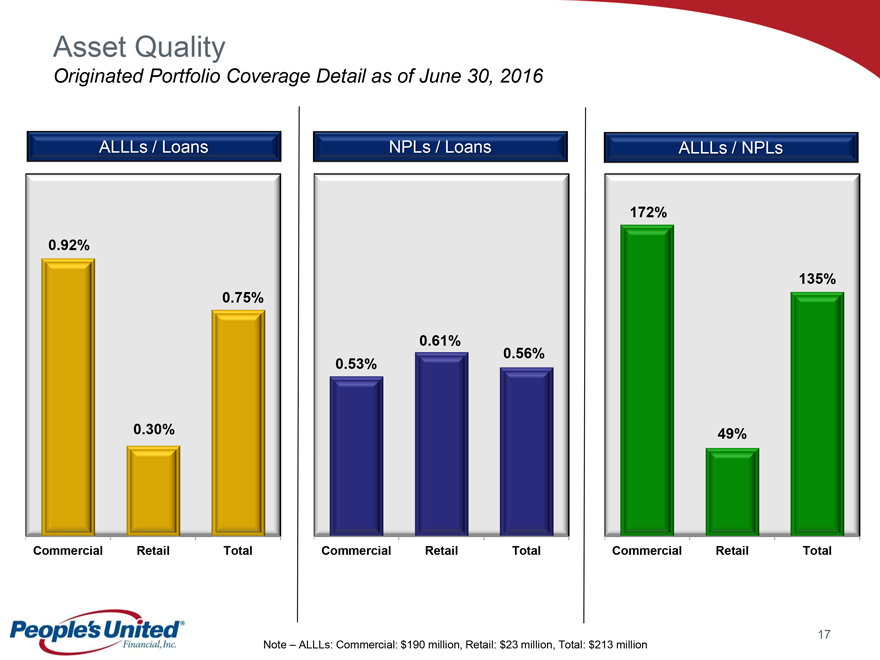
Asset Quality
Originated
Portfolio Coverage Detail as of June 30, 2016
ALLLs / Loans
0.92%
0.30%
0.75%
Commercial Retail Total
NPLs / Loans
0.53%
0.61%
0.56%
Commercial Retail Total
ALLLs / NPLs
172%
49%
135%
Commercial
Retail
Total
People’s United®
Financial, Inc.
Note – ALLLs: Commercial: $190 million, Retail: $23 million, Total: $213
million
17
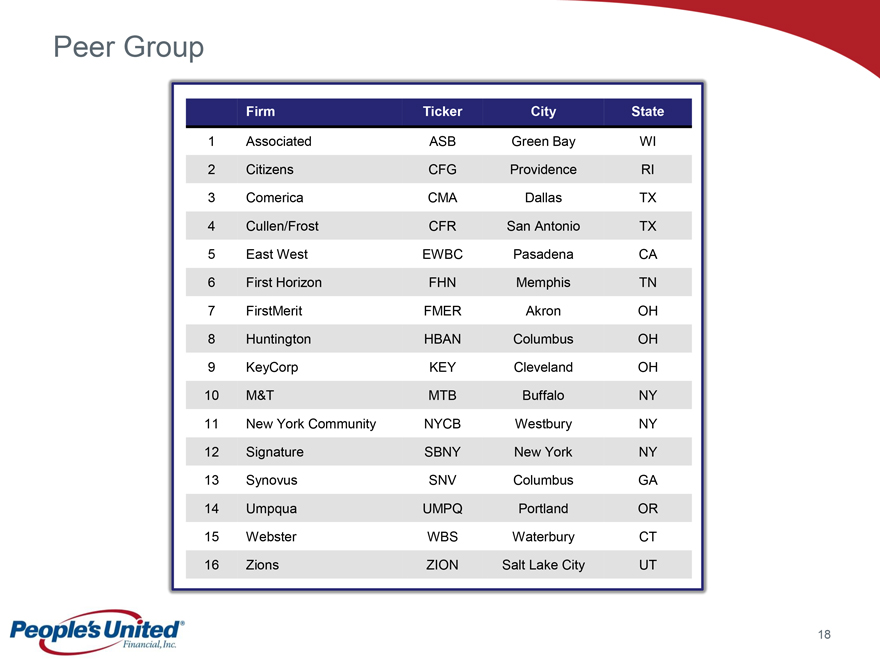
Peer Group
Firm
Ticker
City
State
1 Associated ASB Green Bay WI
2 Citizens CFG Providence RI
3 Comerica CMA Dallas TX
4 Cullen/Frost CFR San Antonio TX
5 East West EWBC Pasadena CA
6 First Horizon FHN Memphis TN
7 FirstMerit FMER Akron OH
8 Huntington HBAN Columbus OH
9 KeyCorp KEY Cleveland OH
10 M&T MTB Buffalo NY
11 New York Community NYCB Westbury NY
12 Signature SBNY New York NY
13 Synovus SNV Columbus GA
14 Umpqua UMPQ Portland OR
15 Webster WBS Waterbury CT
16 Zions ZION Salt Lake City UT
People’s United®
Financial, Inc.
18

People’s United®
Financial, Inc.
For more information, investors may contact:
Andrew S. Hersom
(203) 338-4581
andrew.hersom@ peoples.com
NASDAQ: PBCT