Attached files
| file | filename |
|---|---|
| EX-99.1 - PRESS RELEASE, DATED JULY 21, 2016 - EQUITY BANCSHARES INC | eqbk-ex991_83.htm |
| 8-K - 8-K - EQUITY BANCSHARES INC | eqbk-8k_20160721.htm |
YTD June 30, 2016 Results Presentation July 22, 2016 Exhibit 99.2
Disclaimers FORWARD-LOOKING STATEMENTS The following information contains “forward-looking statements within the meaning of Section 27A of the Securities Act of 1933, as amended, and Section 21E of the Securities Exchange Act of 1934, as amended. These forward-looking statements reflect the current views of Equity’s management with respect to, among other things, future events and Equity’s financial performance. These statements are often, but not always, made through the use of words or phrases such as “may,” “should,” “could,” “predict,” “potential,” “believe,” “will likely result,” “expect,” “continue,” “will,” “anticipate,” “seek,” “estimate,” “intend,” “plan,” “project,” “forecast,” “goal,” “target,” “would” and “outlook,” or the negative variations of those words or other comparable words of a future or forward-looking nature. These forward-looking statements are not historical facts, and are based on current expectations, estimates and projections about Equity’s industry, management’s beliefs and certain assumptions made by management, many of which, by their nature, are inherently uncertain and beyond Equity’s control. Accordingly, Equity cautions you that any such forward-looking statements are not guarantees of future performance and are subject to risks, assumptions and uncertainties that are difficult to predict. Although Equity believes that the expectations reflected in these forward-looking statements are reasonable as of the date made, actual results may prove to be materially different from the results expressed or implied by the forward-looking statements. Factors that could cause actual results to differ materially from Equity’s expectations include competition from other financial institutions and bank holding companies; the effects of and changes in trade, monetary and fiscal policies and laws, including interest rate policies of the Federal Reserve Board; changes in the demand for loans; fluctuations in value of collateral and loan reserves; inflation, interest rate, market and monetary fluctuations; changes in consumer spending, borrowing and savings habits; and acquisitions and integration of acquired businesses, and similar variables. The foregoing list of factors is not exhaustive. For discussion of these and other risks that may cause actual results to differ from expectations, please refer to “Cautionary Note Regarding Forward-Looking Statements” and “Risk Factors” in Equity’s Annual Report on Form 10-K filed with the Securities and Exchange Commission (“SEC”) on March 17, 2016 and any updates to those risk factors set forth in Equity’s subsequent Quarterly Reports on Form 10-Q or Current Reports on Form 8-K. If one or more events related to these or other risks or uncertainties materialize, or if Equity’s underlying assumptions prove to be incorrect, actual results may differ materially from what Equity anticipates. Accordingly, you should not place undue reliance on any such forward-looking statements. Any forward-looking statement speaks only as of the date on which it is made, and Equity does not undertake any obligation to publicly update or review any forward-looking statement, whether as a result of new information, future developments or otherwise. New risks and uncertainties arise from time to time, and it is not possible for us to predict those events or how they may affect us. In addition, Equity cannot assess the impact of each factor on Equity’s business or the extent to which any factor, or combination of factors, may cause actual results to differ materially from those contained in any forward-looking statements. All forward-looking statements, expressed or implied, included herein are expressly qualified in their entirety by this cautionary statement. This cautionary statement should also be considered in connection with any subsequent written or oral forward-looking statements that Equity or persons acting on Equity’s behalf may issue. NON-GAAP FINANCIAL MEASURES This presentation contains certain non-GAAP financial measures intended to supplement, not substitute for, comparable GAAP measures. Reconciliations of non-GAAP financial measures to GAAP financial measures are provided at the end of this presentation. Numbers in the presentation may not sum due to rounding.
Disclaimers IMPORTANT ADDITIONAL INFORMATION This communication does not constitute an offer to sell or the solicitation of an offer to buy any securities. Investors and security holders are urged to carefully review and consider Equity’s public filings with the SEC, including but not limited to its Annual Reports on Form 10-K, its proxy statements, its Current Reports on Form 8-K and its Quarterly Reports on Form 10-Q. The documents filed by Equity with the SEC may be obtained free of charge at Equity’s investor relations website at investor.equitybank.com or at the SEC’s website at www.sec.gov. Alternatively, these documents, when available, can be obtained free of charge from Equity upon written request to Equity Bancshares, Inc., Attn: Investor Relations, 7701 East Kellogg Drive, Suite 200, Wichita, Kansas 67207 or by calling (316) 612-6000. In connection with the proposed transaction between Equity and Community First Bancshares, Inc. (“Community”), Equity intends to file a registration statement on Form S-4 with the SEC which will include a joint proxy statement of Equity and Community and a prospectus of Equity, and will file other documents regarding the proposed transaction with the SEC. BEFORE MAKING ANY VOTING OR INVESTMENT DECISION, INVESTORS AND SECURITY HOLDERS OF COMMUNITY AND EQUITY ARE URGED TO CAREFULLY READ THE ENTIRE REGISTRATION STATEMENT AND JOINT PROXY STATEMENT/PROSPECTUS, WHEN THEY BECOME AVAILABLE, AS WELL AS ANY AMENDMENTS OR SUPPLEMENTS TO THESE DOCUMENTS AND ANY OTHER RELEVANT DOCUMENTS FILED WITH THE SEC, BECAUSE THEY WILL CONTAIN IMPORTANT INFORMATION ABOUT THE PROPOSED TRANSACTION. A definitive joint proxy statement/prospectus will be sent to the stockholders of each institution seeking the required stockholder approvals. Investors and security holders will be able to obtain the registration statement and the joint proxy statement/prospectus free of charge from the SEC’s website or from Equity by writing to the address provided above. Equity and Community and their respective directors and executive officers may be deemed to be participants in the solicitation of proxies from their stockholders in connection with the proposed transaction. Information about Equity’s participants may be found in the definitive proxy statement of Equity relating to its 2016 Annual Meeting of Stockholders filed with the SEC on March 28, 2016. The definitive proxy statement can be obtained free of charge from the sources indicated above. Additional information regarding the interests of such participants will be included in the joint proxy statement and other relevant documents regarding the proposed merger transaction filed with the SEC when they become available, copies of which may also be obtained free of charge from the sources indicated above.
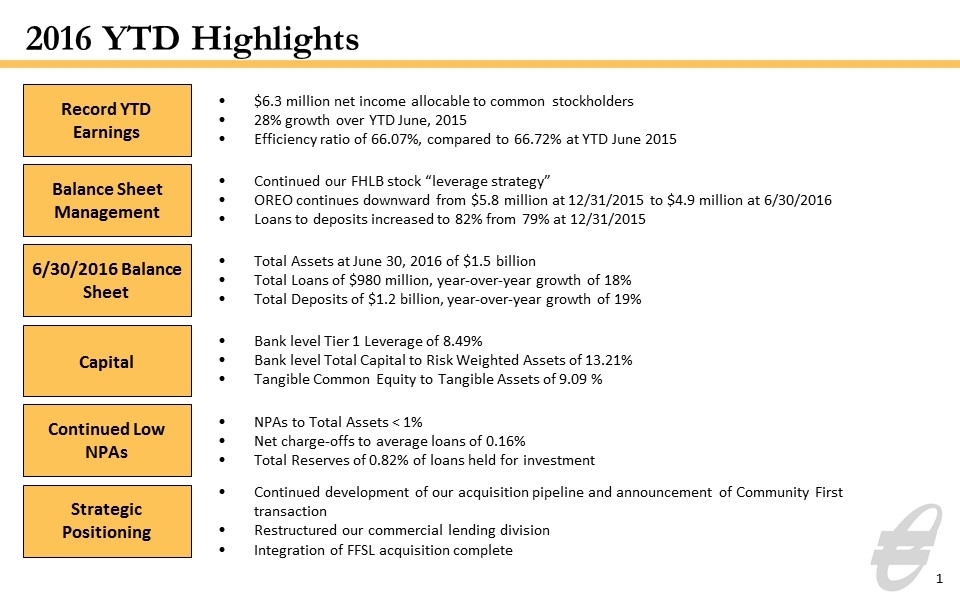
$6.3 million net income allocable to common stockholders 28% growth over YTD June, 2015 Efficiency ratio of 66.07%, compared to 66.72% at YTD June 2015 1 Continued our FHLB stock “leverage strategy” OREO continues downward from $5.8 million at 12/31/2015 to $4.9 million at 6/30/2016 Loans to deposits increased to 82% from 79% at 12/31/2015 Total Assets at June 30, 2016 of $1.5 billion Total Loans of $980 million, year-over-year growth of 18% Total Deposits of $1.2 billion, year-over-year growth of 19% Bank level Tier 1 Leverage of 8.49% Bank level Total Capital to Risk Weighted Assets of 13.21% Tangible Common Equity to Tangible Assets of 9.09 % NPAs to Total Assets < 1% Net charge-offs to average loans of 0.16% Total Reserves of 0.82% of loans held for investment 2016 YTD Highlights Balance Sheet Management Continued development of our acquisition pipeline and announcement of Community First transaction Restructured our commercial lending division Integration of FFSL acquisition complete Record YTD Earnings 6/30/2016 Balance Sheet Capital Continued Low NPAs Strategic Positioning
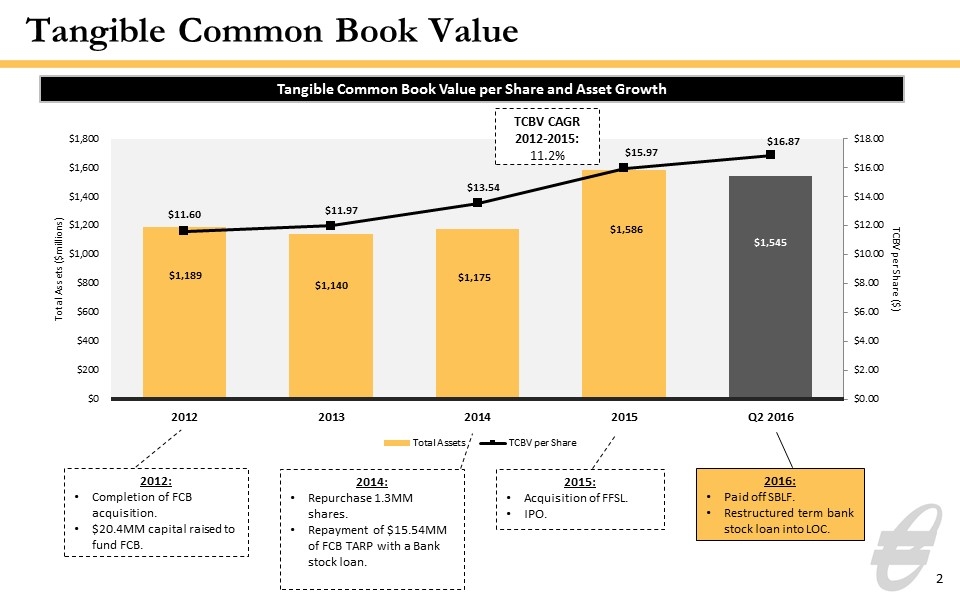
Tangible Common Book Value 2 Tangible Common Book Value per Share and Asset Growth 2012: Completion of FCB acquisition. $20.4MM capital raised to fund FCB. 2014: Repurchase 1.3MM shares. Repayment of $15.54MM of FCB TARP with a Bank stock loan. 2015: Acquisition of FFSL. IPO. TCBV CAGR 2012-2015: 11.2% 2016: Paid off SBLF. Restructured term bank stock loan into LOC.
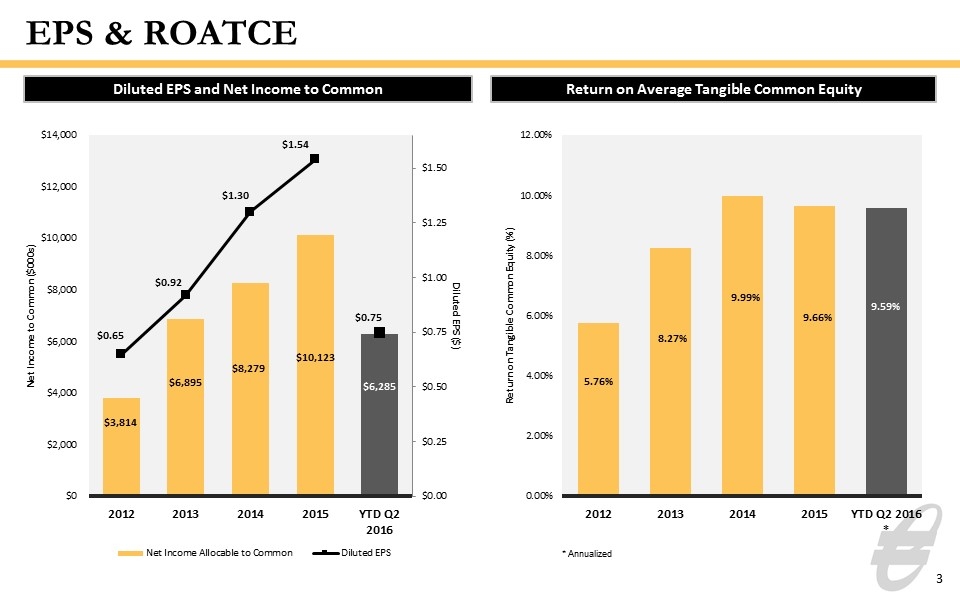
EPS & ROATCE Diluted EPS and Net Income to Common Return on Average Tangible Common Equity 3 * Annualized
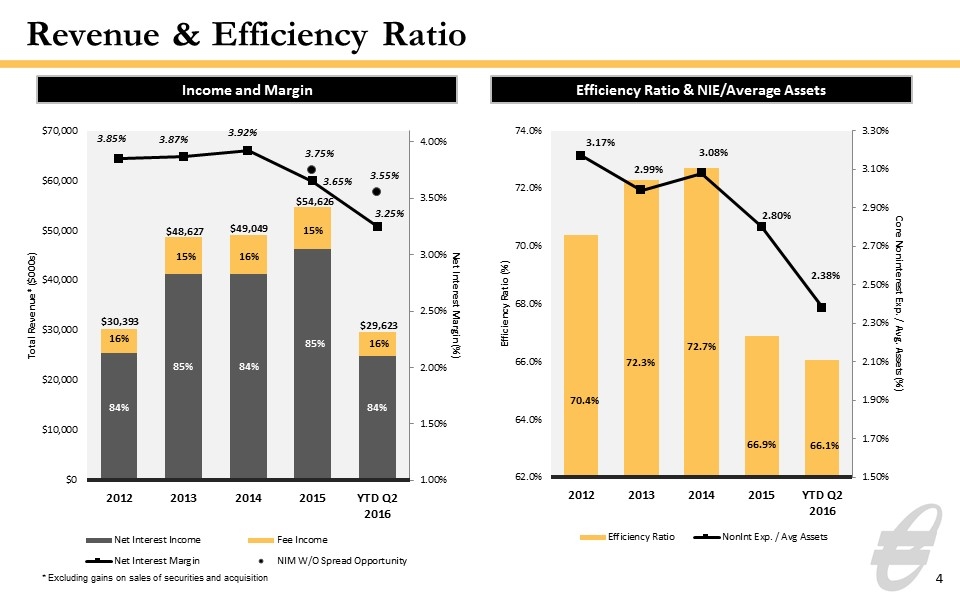
Revenue & Efficiency Ratio Efficiency Ratio & NIE/Average Assets Income and Margin 4 84% 85% 84% 85% 84% 16% 15% 16% 15% 16% $30,393 $48,627 $49,049 $54,626 $29,623 * Excluding gains on sales of securities and acquisition
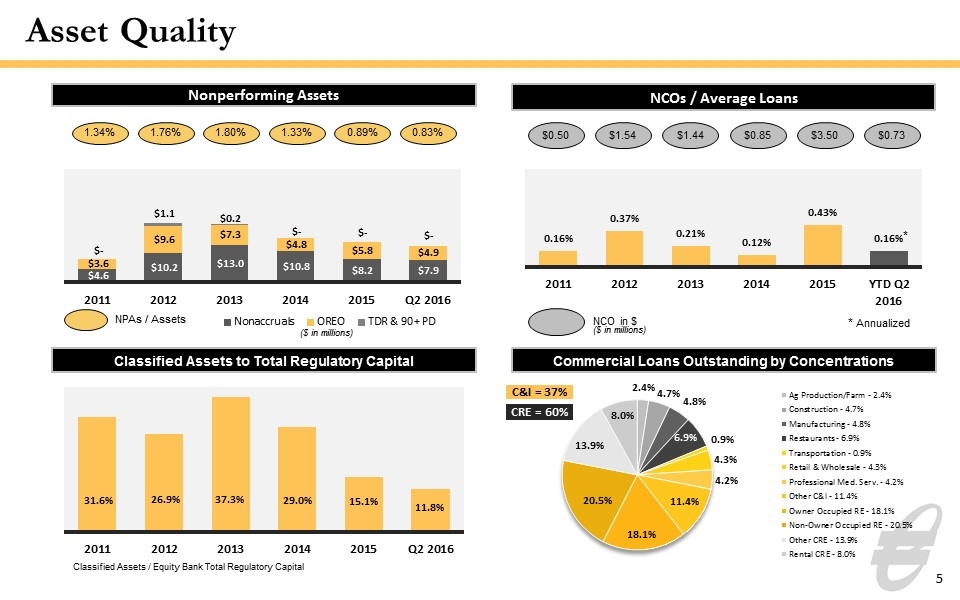
Asset Quality 5 Nonperforming Assets 1.34% 1.76% 1.80% 1.33% NPAs / Assets 0.89% NCOs / Average Loans $0.50 $1.54 $1.44 $0.85 $3.50 NCO in $ ($ in millions) Commercial Loans Outstanding by Concentrations Classified Assets to Total Regulatory Capital CRE = 60% C&I = 37% ($ in millions) Classified Assets / Equity Bank Total Regulatory Capital $0.73 0.83% * * Annualized
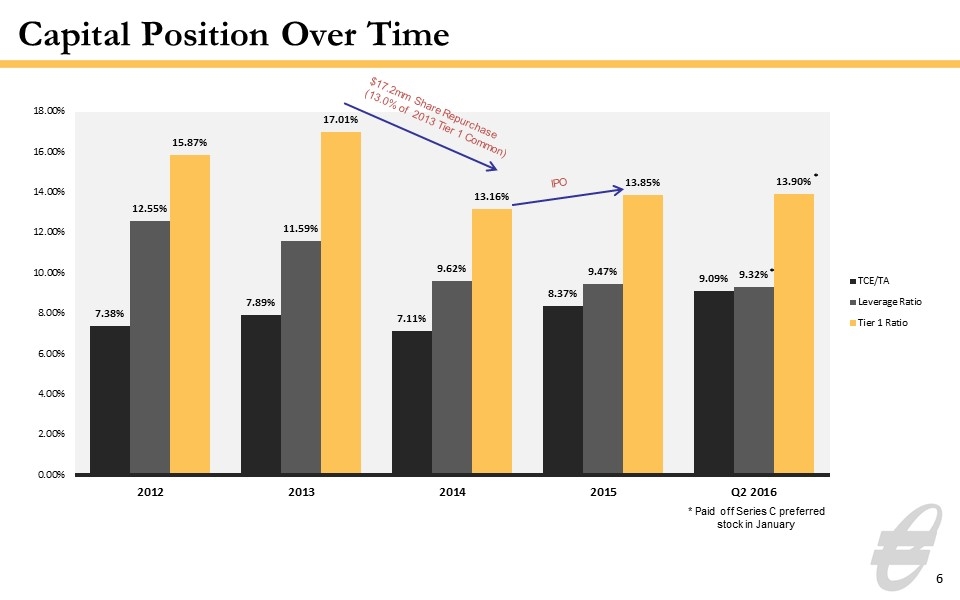
Capital Position Over Time $17.2mm Share Repurchase (13.0% of 2013 Tier 1 Common) 6 IPO * Paid off Series C preferred stock in January
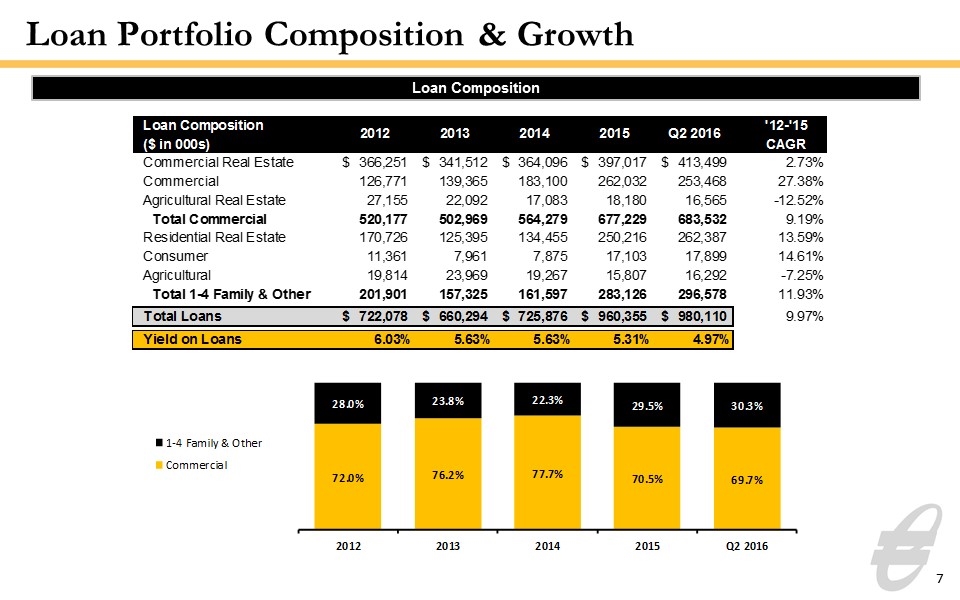
Loan Portfolio Composition & Growth Loan Composition 7 Loan Composition Loan Composition 2012 2013 2014 2015 Q2 2016 '12-'15CAGR ($ in 000s) Commercial Real Estate $,366,251 $,341,512 $,364,096 $,397,017 $,413,499 2.7251446328598883E-2 Commercial ,126,771 ,139,365 ,183,100 ,262,032 ,253,468 0.27382999733306268 Agricultural Real Estate 27,155 22,092 17,083 18,180 16,565 -0.12518808286802907 Total Commercial ,520,177 ,502,969 ,564,279 ,677,229 ,683,532 9.1930005950108029E-2 Residential Real Estate ,170,726 ,125,395 ,134,455 ,250,216 ,262,387 0.13589573957287149 Consumer 11,361 7,961 7,875 17,103 17,899 0.14608961850827096 Agricultural 19,814 23,969 19,267 15,807 16,292 -7.2545886974953344E-2 Total 1-4 Family & Other ,201,901 ,157,325 ,161,597 ,283,126 ,296,578 0.11930152234123081 Total Loans $,722,078 $,660,294 $,725,876 $,960,355 $,980,110 9.9721112781955279E-2 Yield on Loans 6.0299999999999999E-2 5.6300000000000003E-2 5.6300000000000003E-2 5.3100000000000001E-2 4.9700000000000001E-2 Loan Composition 2012 2013 2014 2015 Q2 2016 Commercial 0.72038893305155394 0.76173492413985289 0.77737657671558225 0.70518610305564089 0.69740335268490272 1-4 Family & Other 0.27961106694844601 0.23826507586014714 0.22262342328441773 0.29481389694435911 0.30259664731509728
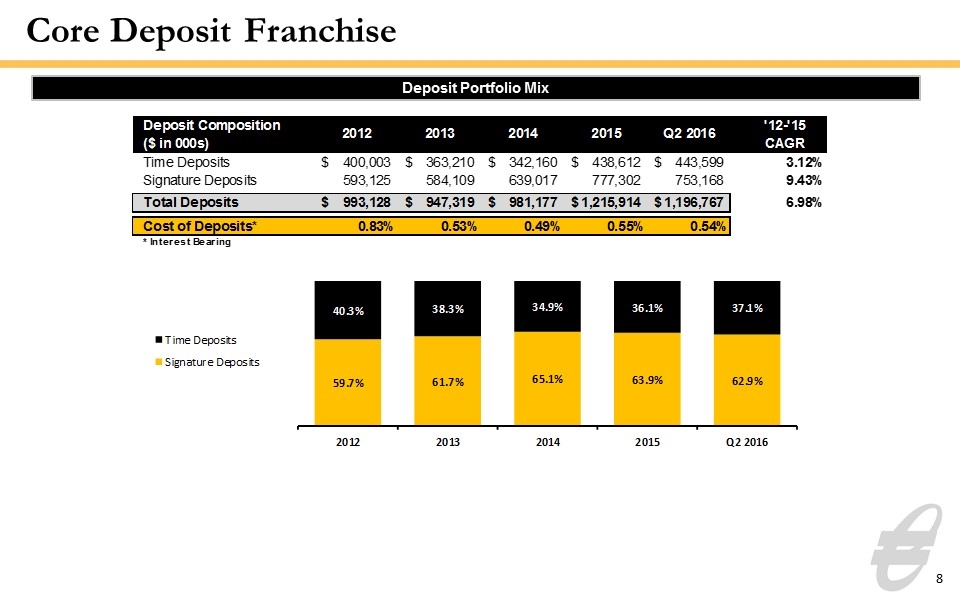
Core Deposit Franchise Deposit Portfolio Mix 8 Deposit Portfolio Mix Deposit Composition 2012 2013 2014 2015 Q2 2016 '12-'15CAGR ($ in 000s) Time Deposits $,400,003 $,363,210 $,342,160 $,438,612 $,443,599 3.1190935923231189E-2 Signature Deposits ,593,125 ,584,109 ,639,017 ,777,302 ,753,168 9.4328857637255847E-2 Total Deposits $,993,128 $,947,319 $,981,177 $1,215,914 $1,196,767 6.9791667339436758E-2 Cost of Deposits* 8.3000000000000001E-3 5.3E-3 4.8999999999999998E-3 5.4999999999999997E-3 5.4000000000000003E-3 * Interest Bearing Deposit Portfolio Mix 2012 2013 2014 2015 Q2 2016 Signature Deposits 0.59722915877913019 0.61659166553188527 0.65127596753694794 0.63927383022154527 0.62933553482006099 Time Deposits 0.40277084122086981 0.38340833446811473 0.348724032463052 0.36072616977845473 0.37066446517993895
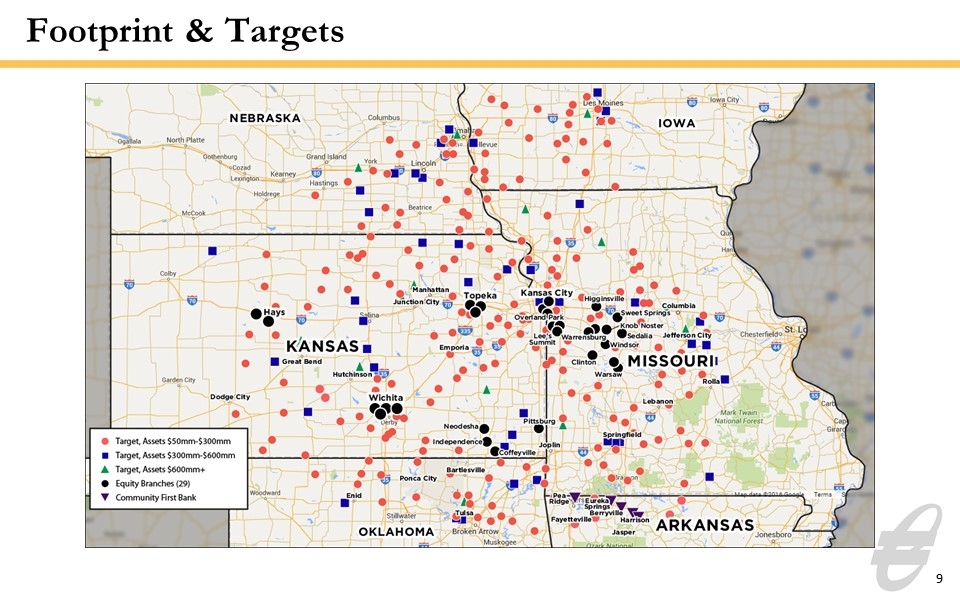
Footprint & Targets 9
Appendix 10
The subsequent tables present non-GAAP reconciliations of the following calculations: Tangible Common Equity (TCE) to Tangible Assets (TA) ratio Tangible Book Value per Common Share Return on average tangible common equity (ROATCE) Efficiency Ratio 11
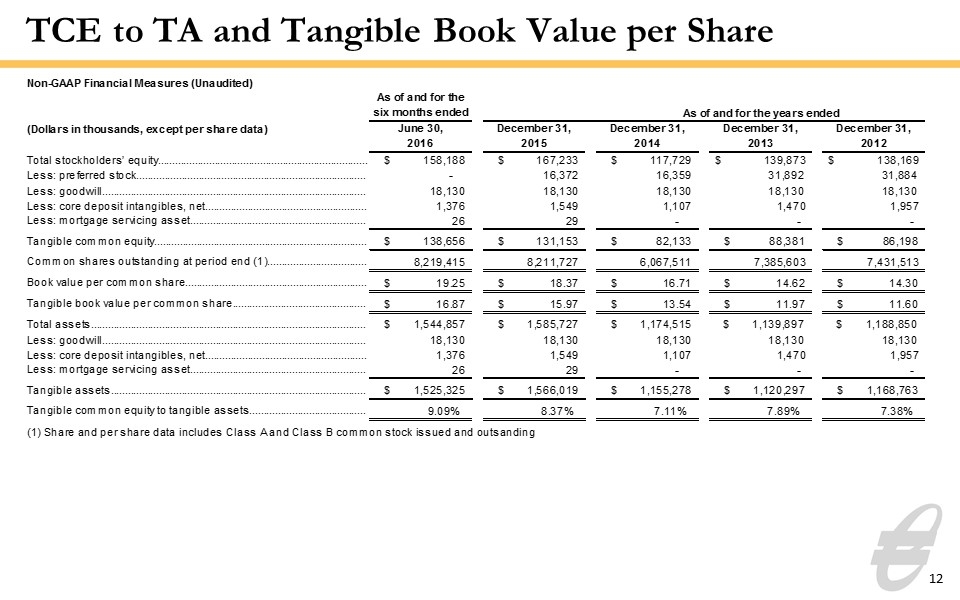
TCE to TA and Tangible Book Value per Share 12 Non-GAAP Financial Measures (Unaudited) As of and for the six months ended As of and for the years ended (Dollars in thousands, except per share data) June 30, 2016 December 31,2015 December 31,2014 December 31,2013 December 31,2012 2011 Total stockholders’ equity $,158,188 $,167,233 $,117,729 $,139,873 $,138,169 $80,816 Less: preferred stock 0 16,372 16,359 31,892 31,884 16,337 Less: goodwill 18,130 18,130 18,130 18,130 18,130 13,147 Less: core deposit intangibles, net 1,376 1,549 1,107 1,470 1,957 773 Less: mortgage servicing asset 26 29 0 0 0 0 Tangible common equity $,138,656 $,131,153 $82,133 $88,381 $86,198 $50,559 Common shares outstanding at period end (1) 8,219,415 8,211,727 6,067,511 7,385,603 7,431,513 4,550,206 Book value per common share $19.24565191075034 $18.371409570727327 $16.707015446696349 $14.620471747533681 $14.301932863469389 $14.170567222670797 Tangible book value per common share $16.869327074980397 $15.971427204046117 $13.536522636712155 $11.966660000544303 $11.598983948490705 $11.111365067867256 Total assets $1,544,857 $1,585,727 $1,174,515 $1,139,897 $1,188,850 $,609,998 Less: goodwill 18,130 18,130 18,130 18,130 18,130 13,147 Less: core deposit intangibles, net 1,376 1,549 1,107 1,470 1,957 773 Less: mortgage servicing asset 26 29 0 0 0 0 Tangible assets $1,525,325 $1,566,019 $1,155,278 $1,120,297 $1,168,763 $,596,078 Tangible common equity to tangible assets 9.0902594529034791E-2 8.3749303169374067E-2 7.1093710777838756E-2 7.8890687023173325E-2 7.3751479127932701E-2 8.481943638248686E-2 (1) Share and per share data includes Class A and Class B common stock issued and outsanding Non-GAAP Financial Measures, continued (Unaudited) As of and for the three months ended As of and for the years ended (Dollars in thousands, except per share data) March 31, 2016 December 31,2015 December 31,2014 December 31,2013 December 31,2012 2011 Total average stockholders' equity $,153,929 $,137,936 $,123,174 $,137,913 $,102,032 $75,253 Less: average intangible assets and preferred stock 20,616 31,294 37,917 50,623 33,653 25,148 Average tangible common equity (1) (3) $,133,313 $,106,642 $85,257 $87,290 $68,379 $50,105 Net income allocable to common stockholders (1) 3,439 10,123 8,279 6,895 3,814 1,371 Amortization of core deposit intangible 87 275 363 487 192 182 Less: tax effect of amortization of core deposit intangible (2) -30 -96 -,127 -,166 -65 -62 Adjusted net income allocable to common stockholders $3,496 $10,302 $8,515 $7,216 $3,941 $1,491 Return on average tangible common equity (ROATCE) 0.10547234826937482 9.6603589580090396E-2 9.98744971087418E-2 8.2666972161759653E-2 5.7634653914213428E-2 2.9757509230615709E-2 Non-interest expense $9,689 $38,575 $35,645 $35,137 $22,900 $15,918 Less: merger expenses 0 1,691 0 0 1,519 0 Less: loss on debt extinguishment 58 316 0 0 0 0 Non-interest expense, excluding merger expenses and loss on debt extinguishment $9,631 $36,568 $35,645 $35,137 $21,381 $15,918 Net interest income $12,758 $46,262 $41,361 $41,235 $25,570 $17,890 Non-interest income $2,697 $9,802 $8,674 $7,892 $4,826 $2,252 Less: net gains on sales and settlement of securities 420 756 986 500 3 425 Less: net gain on acquisition 0 682 0 0 0 0 Non-interest income, excluding net gains on sales and settlement of securities and net gain on acquisition $2,277 $8,364 $7,688 $7,392 $4,823 $1,827 Efficiency ratio 0.64057199866977055 0.6694248160216747 0.72672225733450224 0.72258210459209904 0.70348435495015305 0.8073236293553786 ____________________ (1) Share and per share data includes Class A and Class B common stock issued and outsanding (2) Tax rates used in this calculation were 35% for 2015 and 2014 and 34% for 2013, 2012, and 2011 (3) All periods disclosed were calculated using a simple average of tangible common equity
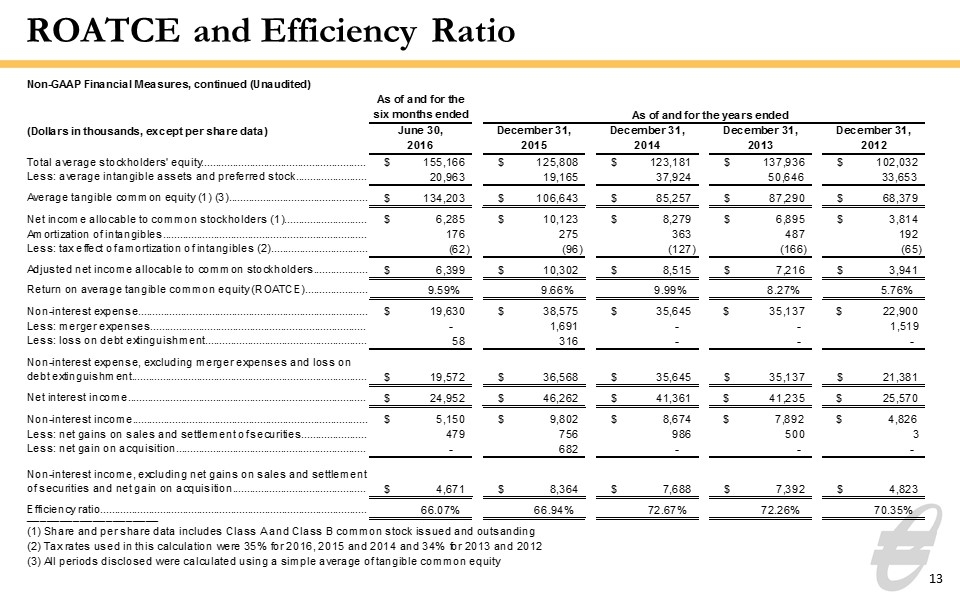
ROATCE and Efficiency Ratio 13 Non-GAAP Financial Measures (Unaudited) Years Ended December 31, (Dollars in thousands, except per share data) 2015 2015 2014 2013 2012 2011 Total stockholders’ equity $,167,232 $,167,232 $,117,729 $,139,873 $,138,169 $80,816 Less: preferred stock 16,372 16,372 16,359 31,892 31,884 16,337 Less: goodwill 18,130 18,130 18,130 18,130 18,130 13,147 Less: core deposit intangibles, net 1,549 1,549 1,107 1,470 1,957 773 Less: mortgage servicing asset 29 29 0 0 0 0 Tangible common equity $,131,152 $,131,152 $82,133 $88,381 $86,198 $50,559 Common shares outstanding at period end (1) 8,211,727 8,211,727 6,067,511 7,385,603 7,431,513 4,550,206 Book value per common share $18.371287793663868 $18.371287793663868 $16.707015446696349 $14.620471747533681 $14.301932863469389 $14.170567222670797 Tangible book value per common share $15.971305426982656 $15.971305426982656 $13.536522636712155 $11.966660000544303 $11.598983948490705 $11.111365067867256 Total assets $1,585,727 $1,585,727 $1,174,515 $1,139,897 $1,188,850 $,609,998 Less: goodwill 18,130 18,130 18,130 18,130 18,130 13,147 Less: core deposit intangibles, net 1,549 1,549 1,107 1,470 1,957 773 Less: mortgage servicing asset 29 29 0 0 0 0 Tangible assets $1,566,019 $1,566,019 $1,155,278 $1,120,297 $1,168,763 $,596,078 Tangible common equity to tangible assets 8.3748664607517537E-2 8.3748664607517537E-2 7.1093710777838756E-2 7.8890687023173325E-2 7.3751479127932701E-2 8.481943638248686E-2 (1) Share and per share data includes Class A and Class B common stock issued and outsanding (2) Tax rates used in this calculation were 35% for 2015 and 2014 and 34% for 2013, 2012, and 2011 (3) All periods disclosed were calculated using a simple average of tangible common equity Non-GAAP Financial Measures, continued (Unaudited) As of and for the six months ended As of and for the years ended (Dollars in thousands, except per share data) June 30, 2016 December 31,2015 December 31,2014 December 31,2013 December 31,2012 2011 Total average stockholders' equity $,155,166 $,125,808 $,123,181 $,137,936 $,102,032 $75,253 Less: average intangible assets and preferred stock 20,963 19,165 37,924 50,646 33,653 25,148 Average tangible common equity (1) (3) $,134,203 $,106,643 $85,257 $87,290 $68,379 $50,105 Net income allocable to common stockholders (1) $6,285 $10,123 $8,279 $6,895 $3,814 1,371 Amortization of intangibles 176 275 363 487 192 182 Less: tax effect of amortization of intangibles (2) -62 -96 -,127 -,166 -65 -62 Adjusted net income allocable to common stockholders $6,399 $10,302 $8,515 $7,216 $3,941 $1,491 Return on average tangible common equity (ROATCE) 9.5886967365250278E-2 9.6602683720450472E-2 9.98744971087418E-2 8.2666972161759653E-2 5.7634653914213428E-2 2.98E-2 Non-interest expense $19,630 $38,575 $35,645 $35,137 $22,900 $15,918 Less: merger expenses 0 1,691 0 0 1,519 - Less: loss on debt extinguishment 58 316 0 0 0 - Non-interest expense, excluding merger expenses and loss on debt extinguishment $19,572 $36,568 $35,645 $35,137 $21,381 $15,918 Net interest income $24,952 $46,262 $41,361 $41,235 $25,570 $17,890 Non-interest income $5,150 $9,802 $8,674 $7,892 $4,826 $2,252 Less: net gains on sales and settlement of securities 479 756 986 500 3 425 Less: net gain on acquisition 0 682 0 0 0 - Non-interest income, excluding net gains on sales and settlement of securities and net gain on acquisition $4,671 $8,364 $7,688 $7,392 $4,823 $1,827 Efficiency ratio 0.66070283225871784 0.6694248160216747 0.72672225733450224 0.72258210459209904 0.70348435495015305 0.80730000000000002 ____________________ (1) Share and per share data includes Class A and Class B common stock issued and outsanding (2) Tax rates used in this calculation were 35% for 2016, 2015 and 2014 and 34% for 2013 and 2012 (3) All periods disclosed were calculated using a simple average of tangible common equity
