Attached files
| file | filename |
|---|---|
| EX-99.3 - EX-99.3 - CITIZENS FINANCIAL GROUP INC/RI | d78245dex993.htm |
| EX-99.1 - EX-99.1 - CITIZENS FINANCIAL GROUP INC/RI | d78245dex991.htm |
| 8-K - 8-K - CITIZENS FINANCIAL GROUP INC/RI | d78245d8k.htm |
  2Q16 Financial Results
July 21, 2016 Exhibit 99.2 |
 Forward-looking statements
2 This document contains forward-looking statements within the Private Securities Litigation Reform Act of 1995. Any statement that does not describe historical or current facts is a forward- looking statement. These statements often include the words “believes,” “expects,” “anticipates,” “estimates,” “intends,” “plans,” “goals,” “targets,” “initiatives,” “potentially,” “probably,” “projects,” “outlook” or similar expressions or future conditional verbs such as “may,” “will,” “should,” “would,” and “could.” Forward-looking statements are based upon the current beliefs and expectations of management, and on information currently available to management. Our statements speak as of the date hereof, and we do not assume any obligation to update these statements or to update the reasons why actual results could differ from those contained in such statements in light of new information or future events. We caution you, therefore, against relying on any of these forward-looking statements. They are neither statements of historical fact nor guarantees or assurances of future performance. While there is no assurance that any list of risks and uncertainties or risk factors is complete, important factors that could cause actual results to differ materially from those in the forward-looking statements include the following, without limitation: negative economic conditions that adversely affect the general economy, housing prices, the job market, consumer confidence and spending habits which may affect, among other things, the level of nonperforming assets, charge-offs and provision expense; the rate of growth in the economy and employment levels, as well as general business and economic conditions; our ability to implement our strategic plan, including the cost savings and efficiency components, and achieve our indicative performance targets; our ability to remedy regulatory deficiencies and meet supervisory requirements and expectations; liabilities and business restrictions resulting from litigation and regulatory investigations; our capital and liquidity requirements (including under regulatory capital standards, such as the Basel III capital standards) and our ability to generate capital internally or raise capital on favorable terms; the effect of the current low interest rate environment or changes in interest rates on our net interest income, net interest margin and our mortgage originations, mortgage servicing rights and mortgages held for sale; changes in interest rates and market liquidity, as well as the magnitude of such changes, which may reduce interest margins, impact funding sources and affect the ability to originate and distribute financial products in the primary and secondary markets; the effect of changes in the level of checking or savings account deposits on our funding costs and net interest margin; financial services reform and other current, pending or future legislation or regulation that could have a negative effect on our revenue and businesses, including the Dodd-Frank Act and other legislation and regulation relating to bank products and services; a failure in or breach of our operational or security systems or infrastructure, or those of our third party vendors or other service providers, including as a result of cyber attacks; and management’s ability to identify and manage these and other risks. In addition to the above factors, we also caution that the amount and timing of any future common stock dividends or share repurchases will depend on our financial condition, earnings, cash needs, regulatory constraints, capital requirements (including requirements of our subsidiaries), and any other factors that our board of directors deems relevant in making such a determination. Therefore, there can be no assurance that we will pay any dividends to holders of our common stock, or as to the amount of any such dividends. More information about factors that could cause actual results to differ materially from those described in the forward-looking statements can be found under “Risk Factors” in Part I, Item 1A in our Annual Report on Form 10-K for the year ended December 31, 2015, filed with the United States Securities and Exchange Commission on February 26, 2016. Note: Percentage changes, per share amounts and ratios presented in this document are calculated using whole dollars. |
 Generated 7% YoY average loan growth, with strength in both commercial and
retail NII up 10% YoY and 2% QoQ
– NIM of 2.84% compared with 2.72% in 2Q15 and 2.86% in 1Q16 – Loan yields improved 2 bps QoQ and deposit costs remained stable Consumer Banking initiatives — Retail checking households up QoQ and YoY; continued strong growth in student loans; Financial Consultants up 10% YoY; Mortgage applications and originations up 27% and 36%, respectively
Commercial Banking initiatives — Strong loan growth, up 10% YoY; Capital Markets fees at new record reflecting continued broadening of our capabilities and rebound in market deal volume
TOP II on track; expense initiatives complete and revenue initiatives well
underway Launched new TOP III efficiency program focused on
expense, revenue and tax initiatives to help deliver future
operating leverage in spite of “lower-for-longer” rate
environment 2Q16 highlights
3 1) Non-GAAP item. Where there is a reference to an “Adjusted” result in a paragraph, all measures which follow that
“Adjusted” result are also “Adjusted” and exclude restructuring charges and special items as applicable. See important information on use and reconciliation of non-GAAP items in the Appendix. There were no net restructuring charges and special items recorded in 2Q16 or 1Q16. 2) Current period regulatory capital ratios are preliminary. Improving profitability and returns Strong capital, liquidity and funding Excellent credit quality and progress on risk management Continued progress on strategic growth, efficiency and balance sheet optimization initiatives Robust capital levels with a common equity tier 1 ratio of 11.5% (2) ; TBV per share up 2% from 1Q16 to $25.72 2016 CCAR plan reflects continued commitment towards prudent return of capital with up to $690 million in share
repurchases over the next four quarters and authorization for a 17% increase
in the quarterly dividend in 2017 2Q16 average deposits increased
$5.4 billion, or 6% vs. 2Q15; average loan-to-deposit ratio of 99.5% Issued $1.0 billion in senior unsecured bank notes Provision relatively stable compared to 1Q16 NPLs decreased $35 million, reflecting improvement in commercial and retail
Allowance coverage of NPLs improved to 119% in 2Q16 from 113% in 1Q16 and 114%
in 2Q15 On
July 19 , closed previously announced TDR sale of $310 million of loans from HFS at a gain of ~$70 million; impact will be reflected in 3Q16 results GAAP diluted EPS of $0.46 up 31% from 2Q15 and up 15% from Adjusted (1) diluted EPS in 2Q15 Revenue up 7% with Adjusted (1) operating leverage of over 3% YoY Adjusted (1) efficiency ratio improved ~2% YoY to 65% ROTCE of 7.3% increased from 5.9% in 2Q15 and 6.6% in 1Q16 th |
 2Q16 change from
$s in millions
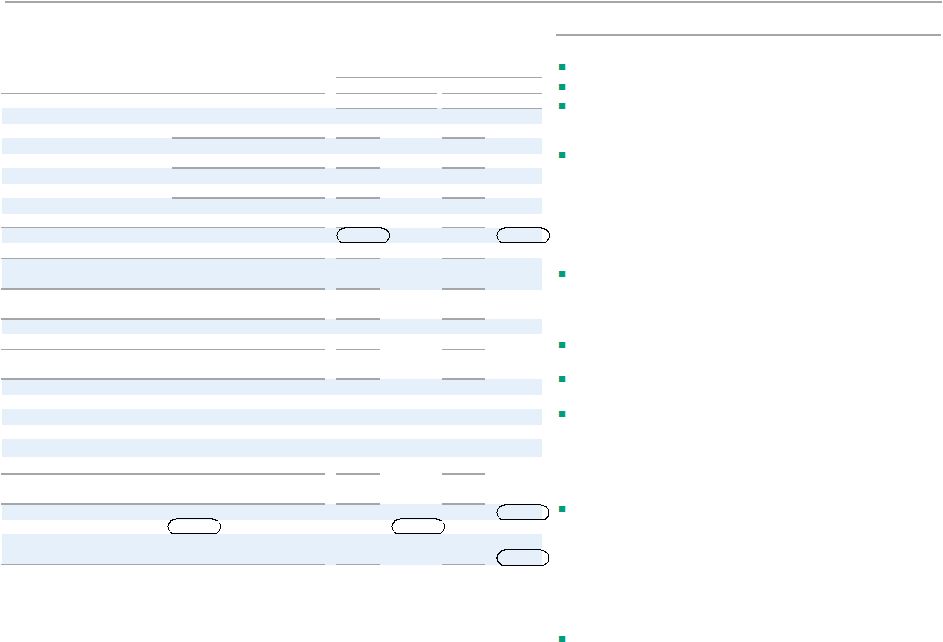
2Q16 1Q16 2Q15 1Q16 2Q15 $ % $ % Net interest income 923 $ 904 $ 840 $ 19 $ 2 % 83 $ 10 % Noninterest income 355 330 360 25 8 (5) (1) Total revenue 1,278 1,234 1,200 44 4 78 7 Noninterest expense 827 811 841 16 2 (14) (2) Pre-provision profit 451 423 359 28 7 92 26 Provision for credit losses 90 91 77 (1) (1) 13 17 Income before income tax expense 361 332 282 29 9 79 28 Income tax expense 118 109 92 9 8 26 28 Net income 243 $ 223 $ 190 $ 20 $ 9 53 $ 28 Preferred dividends — $ 7 $ — $ (7) $ (100) — $ — Net income available to common stockholders 243 $ 216 $ 190 $ 27 $ 13 % 53 $ 28 % $s in billions Average interest-earning assets 129.5 $ 126.2 $ 123.2 $ 3.3 $ 3 % 6.3 $ 5 % Average deposits 104.0 $ 102.0 $ 98.5 $ 2.0 $ 2 % 5.4 $ 6 % Key metrics Net interest margin 2.84 % 2.86 % 2.72 % (2) bps 12 bps Loan-to-deposit ratio (2) 98.3 % 99.2 % 96.6 % (91) bps 161 bps ROTCE (1,3) 7.3 % 6.6 % 5.9 % 69 bps 140 bps ROTA (1,4) 0.7 % 0.7 % 0.6 % 4 bps 13 bps Efficiency ratio (1) 65 % 66 % 70 % (95) bps (531) bps FTEs (5) 17,828 17,902 17,903 (74) — % (75) — % Per common share Diluted earnings 0.46 $ 0.41 $ 0.35 $ 0.05 $ 12 % 0.11 $ 31 % Tangible book value (1) 25.72 $ 25.21 $ 24.03 $ 0.51 $ 2 % 1.69 $ 7 % Average diluted shares outstanding (in millions) 530.4 530.4 539.9 (0.1) — % (9.5) (2) % Financial summary — GAAP 4 1) Non-GAAP item. See important information on use of non-GAAP items in the Appendix.
2) Includes held for sale. Loan-to-deposit ratio is period end. 3) Return on average tangible common equity. 4) Return on average total tangible assets. 5) Full-time equivalent employees. Linked quarter: GAAP net income improved 9% and diluted EPS was up 12% NII up $19 million, reflecting 2% average loan growth Noninterest income increased $25 million, or 8%, largely reflecting strength in capital markets, mortgage banking, and service charges and fees partially offset by a reduction in securities gains Noninterest expense increased 2%, reflecting higher other operating expense as well as higher salaries and employee benefits, partially offset by lower outside services expense – Salaries and employee benefits increase largely driven by a change in timing of merit increases and incentive payments – Higher other operating expense reflects higher regulatory, fraud and insurance costs Provision for credit losses relatively stable as lower net charge-offs were offset by a higher reserve build tied to continued
loan growth Prior-year quarter: GAAP net income increased $53 million, or 28%, reflecting 8% positive operating leverage; diluted EPS up 31% NII up $83 million reflecting 7% average loan growth, and a 12 bp improvement in NIM given higher loan yields and stable deposit costs Noninterest income down $5 million from 2Q15 levels that exclude the negative impact of the reclass of $7 million of card reward costs. Increases in service charges and capital markets fees were more than offset by lower card fees due to the card reward accounting change impact, lower mortgage banking fees and a reduction in securities gains Noninterest expense was down $14 million, driven by a $40 million decrease in restructuring charges and special items. Adjusted (1) results reflect an increase in salaries and employee benefits, largely a
change in the timing of merit increases and incentive payments, and
increased software amortization and depreciation expense. 2Q15
results exclude the positive impact of the reclass of $7 million
of card reward costs
– FTEs down 75 reflecting the benefit of our efficiency initiatives Provision expense increased $13 million, as lower net charge-offs were
more than offset by a reserve build tied to continued loan growth
Highlights |
 2Q16 change from
$s in millions
2Q16 1Q16 2Q15 1Q16 2Q15 $ % $ % Net interest income 923 $ 904 $ 840 $ 19 $ 2 % 83 $ 10 % Noninterest income 355 330 360 25 8 (5) (1) Total revenue 1,278 1,234 1,200 44 4 78 7 Adjusted noninterest expense (1) 827 811 801 16 2 26 3 Adjusted pre-provision profit (1) 451 423 399 28 7 52 13 Provision for credit losses 90 91 77 (1) (1) 13 17 Adjusted pretax income (1) 361 332 322 29 9 39 12 Adjusted income tax expense (1) 118 109 107 9 8 11 10 Adjusted net income (1) 243 $ 223 $ 215 $ 20 $ 9 28 $ 13 Preferred dividends — $ 7 $ — $ (7) $ 100 — $ 100 Adjusted net income available to common stockholders (1) 243 $ 216 $ 215 $ 27 $ 13 % 28 $ 13 % $s in billions Average interest-earning assets 129.5 $ 126.2 $ 123.2 $ 3.3 $ 3 % 6.3 $ 5 % Average deposits 104.0 $ 102.0 $ 98.5 $ 2.0 $ 2 % 5.4 $ 6 % Key metrics Net interest margin 2.84 % 2.86 % 2.72 % (2) bps 12 bps Loan-to-deposit ratio (2) 98.3 % 99.2 % 96.6 % (91) bps 161 bps Adjusted ROTCE (1,3) 7.3 % 6.6 % 6.7 % 69 bps 63 bps Adjusted ROTA (1,4) 0.7 % 0.7 % 0.7 % 4 bps 5 bps Adjusted efficiency ratio (1) 65 % 66 % 67 % (95) bps (199) bps FTEs (5) 17,828 17,902 17,903 (74) — % (75) — % Per common share Adjusted diluted EPS (1) 0.46 $ 0.41 $ 0.40 $ 0.05 $ 12 % 0.06 $ 15 % Tangible book value (1) 25.72 $ 25.21 $ 24.03 $ 0.51 $ 2 % 1.69 $ 7 % Average diluted shares outstanding (in millions) 530.4 530.4 539.9 (0.1) — % (9.5) (2) % Adjusted financial summary — excluding restructuring charges and special items (1) 5 1) Non-GAAP item. Adjusted results exclude the effect of net restructuring charges and special items associated with efficiency
and effectiveness programs and separation from RBS. See important
information on use of non-GAAP items in the Appendix.
2) Includes held for sale. Loan-to-deposit ratio is period-end. 3) Adjusted return on average tangible common equity. 4) Adjusted return on average total tangible assets. 5) Full-time equivalent employees. Highlights Linked quarter: Net income increased $20 million, or 9% – Diluted EPS increased 12% NII increased $19 million driven by 2% average loan growth Noninterest income increased $25 million, or 8%, as strong capital markets fees, mortgage banking fees and service charges and fees were partially offset by a reduction in securities gains Noninterest expense increased 2% reflecting higher other operating expense as well as higher salaries and employee benefits, partially offset
by lower outside services expense
– Salaries and employee benefits increase largely driven by a change in timing of merit increases and incentive payments – Higher other operating expense reflects higher regulatory, fraud and insurance costs Provision for credit losses remained relatively stable as lower net charge-offs were offset by a higher reserve build tied to continued loan
growth Prior-year Adjusted (1) quarter: Net income increased $28 million, or 13%, reflecting over 3% positive operating leverage; Adjusted diluted EPS up 15% NII increased $83 million, reflecting 7% average loan growth and a 12 bp improvement in NIM given higher loan yields and stable deposit costs Noninterest income down $5 million from 2Q15 levels that exclude the negative impact of the reclass of $7 million of card reward costs. Increases in service charges and capital markets fees were more than offset by lower card fees due to the card reward accounting change impact, lower mortgage banking fees and a reduction in securities gains
Noninterest expense was up 3%, driven by higher salary and employee
benefits expense and increased software amortization and
depreciation expense. 2Q15 results exclude the positive impact
of the reclass of $7 million of card reward costs
Salaries and benefits reflect change in timing of merit increases and
incentive payments
– Efficiency ratio improved ~200 bps (1) – FTEs down 75 reflecting the benefit of our efficiency initiatives Provision expense increased $13 million as lower net charge-offs were
more than offset by a higher reserve build tied to continued loan
growth |
 Net
interest income 6
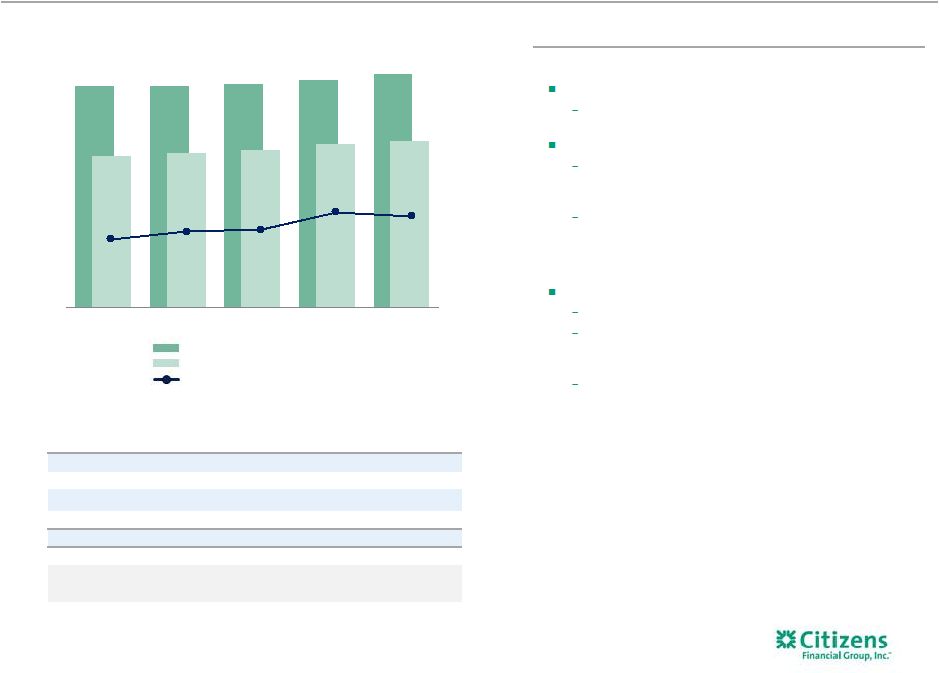
Highlights 1) Includes interest-bearing cash and due from banks and deposits in banks.
Linked quarter:
NII up $19 million, or 2%
Reflects 2% average loan growth driven by commercial and
student loans
NIM of 2.84% remained relatively stable, down 2 bps
Higher loan yields and better mix were more than offset by the
impact of a reduction in long-term rates on the securities
portfolio and higher long-term debt issuance
Deposit costs remained flat reflecting continued pricing
discipline Prior-year quarter: NII up $83 million, or 10%, with NIM up 12 bps 7% average loan growth Growth in NIM reflects improving retail and commercial loan yields and portfolio mix and the impact of higher short-term rates, partially offset by lower long-term rates Deposit costs flat YoY as tactical actions offset the impact of higher short-term rates Net interest income $s in millions, except earning assets Average interest-earning assets Average interest-earning assets Net interest income Net interest margin $s in billions 2Q15 3Q15 4Q15 1Q16 2Q16 Retail loans $50.9 $51.6 $52.4 $53.2 $53.5 Commercial loans 44.7 45.2 45.8 47.0 49.1 Investments and cash (1) 27.1 25.8 25.7 25.5 26.0 Loans held for sale 0.5 0.5 0.3 0.4 0.8 Total interest-earning assets $123.2 $123.0 $124.2 $126.2 $129.5 Loan yields 3.30% 3.32% 3.34% 3.46% 3.48% Total cost of funds 0.40% 0.41% 0.41% 0.40% 0.42% $123B $123B $124B $126B $129B $840 $856 $870 $904 $923 2Q15 3Q15 4Q15 1Q16 2Q16 2.72% 2.76% 2.77% 2.86% 2.84% |
 2.86% 2.84% 0.03% (0.02)% (0.01)% (0.02)% 1Q16 NIM% Loan yields Investment portfolio yield Deposit costs Borrowing costs/other 2Q16 NIM% 2.72% 2.84% 0.14% (0.01)% 0.00% (0.01)% 2Q15 NIM% Loan yields Investment portfolio yield Deposit costs Borrowing costs/other 2Q16 NIM% Net interest margin 7 NIM walk 2Q15 to 2Q16 NIM walk 1Q16 to 2Q16 |
 Linked quarter:
Noninterest income increased $25 million, or 8%, driven by
strength in nearly every category
Service charges and fees increased $6 million driven by higher volumes from seasonally lower 1Q16 levels as well as improved pricing Card fees and trust and investment services fees were up slightly Mortgage banking fees increased $7 million reflecting higher application and origination volumes and improved sale volumes and spreads, as well as an improved mortgage servicing rights (“MSR”) valuation Capital markets fees improved $13 million reflecting continued broadening of our capabilities and cross sell, as well as a strong increase in deal volume from lower 1Q16 levels Securities gains down by $5 million Prior-year quarter: Noninterest income decreased $5 million, or 1%; excluding card reward accounting change growth was 1% Service charges and fees increased $11 million driven by improved pricing and volume Card fees were down $9 million from 2Q15 levels that exclude the negative impact of the reclass of $7 million of card reward costs Trust and investment services fees decreased $3 million given the changing mix of product sales Mortgage banking fees decreased $5 million from 2Q15 levels, largely reflecting the significant 2Q15 MSR valuation gain Capital markets fees increased $5 million, reflecting a record quarter as we broaden our capabilities 2Q16 change from 2Q16 1Q16 2Q15 1Q16 2Q15 $ % $ % Service charges and fees 150 $ 144 $ 139 $ 6 $ 4 % 11 $ 8 % Card fees 51 50 60 1 2 (9) (15) Trust & investment services fees 38 37 41 1 3 (3) (7) Mortgage banking fees 25 18 30 7 39 (5) (17) Capital markets fees 35 22 30 13 59 5 17 FX & LC fees 21 21 22 — — (1) (5) Securities gains, net 4 9 9 (5) (56) (5) (56) Other income (1) 31 29 29 2 7 2 7 Noninterest income
355 $ 330 $ 360 $ 25 $ 8 % (5) $ (1) % $355 $330 $360 2Q16 1Q16 2Q15 Service charges and fees Card fees Trust and inv services FX & LC fees Mortgage banking fees Capital markets fee income Securities gains (losses) Other income Noninterest income 8 Highlights 1) Other income includes bank-owned life insurance and other income. $s in millions (1) |
 2Q16 change from
$s in millions
2Q16 1Q16 2Q15 1Q16 2Q15 $ % $ % Adjusted salaries and benefits (1) 432 $ 425 $ 405 $ 7 $ 2 % 27 $ 7 % Adjusted occupancy (1) 76 76 75 — — 1 1 Equipment expense 64 65 65 (1) (2) (1) (2) Adjusted outside services (1) 86 91 83 (5) (5) 3 4 Amortization of software 41 39 37 2 5 4 11 Adjusted other expense (1) 128 115 136 13 11 (8) (6) Adjusted noninterest expense (1) 827 $ 811 $ 801 $ 16 $ 2 % 26 $ 3 % Restructuring charges and special items — — 40 — — (40) (100) Total noninterest expense 827 $ 811 $ 841 $ 16 $ 2 % (14) $ (2) % $827 $811 $801 65% 66% 67% 2Q16 1Q16 2Q15 Adjusted all other Adjusted occupancy & equip Adjusted salary and benefits Adjusted efficiency ratio Adjusted noninterest expense — excluding restructuring charges and special items (1) Linked quarter: Noninterest expense increased $16 million, or 2% Salaries and employee benefits up $7 million, largely related to a change in timing of merit increases and incentive payments FTEs down 74 linked quarter reflecting the benefit of our efficiency initiatives Outside services down $5 million, reflecting the benefits of procurement initiatives Amortization of software expense up $2 million, reflecting continued investments in applications and infrastructure Other expense increased $13 million, driven primarily by higher regulatory, fraud and insurance costs Prior-year quarter: Noninterest expense increased $26 million, or 3%, from Adjusted 2Q15 levels (1) Salaries and employee benefits up $27 million largely related to the timing of merit increases and incentive payments, which drove higher payroll taxes and retirement plan contributions FTEs down 75 vs prior year reflecting the benefit of
our efficiency initiatives
Outside services increased $3 million, largely reflecting
increased consumer loan volumes and vendor
outsourcing Amortization of software expense increased $4 million, reflecting continued investments in applications and infrastructure Other expense decreased $8 million, reflecting the impact of the card reward accounting change 9 Highlights 1) Non-GAAP item. Adjusted results exclude the effect of net restructuring charges and special items associated with efficiency and effectiveness programs and separation from RBS. See important information on use of non-GAAP items in the Appendix.
. (1) (1) (1) (1) (1) (1) (1) Full-time equivalents (FTEs) 17,828 17,902 17,903 |
 2Q16 change from
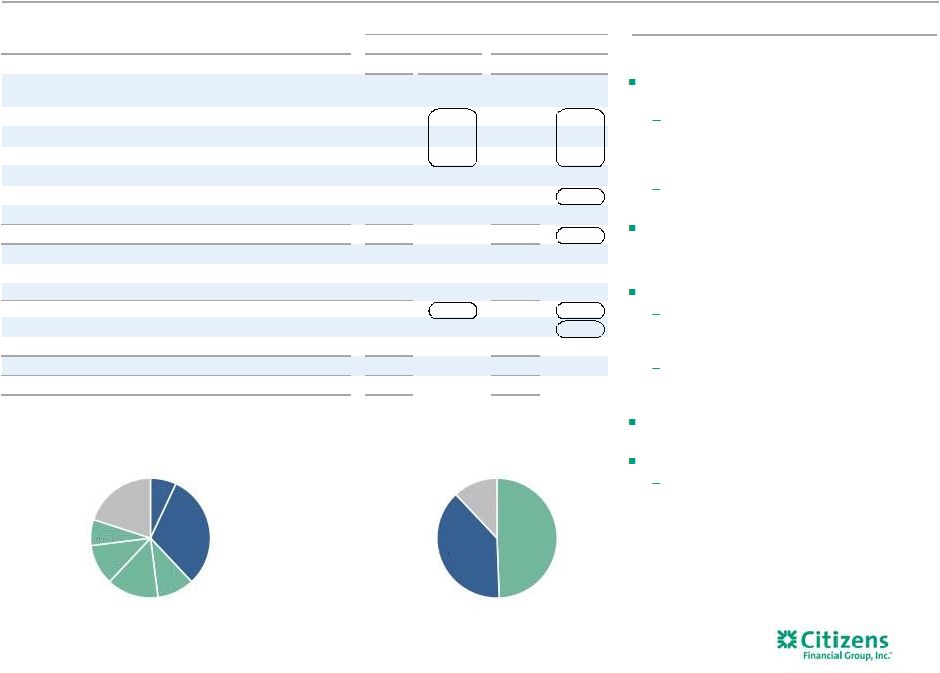
$s in billions 2Q16 1Q16 2Q15 1Q16 2Q15 $ % $ % Investments and interest bearing deposits 26.0 $ 25.5 $ 27.1 $ 0.5 $ 2 % (1.1) $ (4) % Total commercial loans 49.1 47.0 44.7 2.1 4 4.4 10 Total retail loans 53.5 53.2 50.9 0.3 1 2.6 5 Total loans and leases
102.7 100.3 95.6 2.4 2 7.1 7 Loans held for sale
0.8 0.4 0.5 0.5 128 0.4 78 Total interest-earning assets 129.5 126.2 123.2 3.3 3 6.3 5 Total noninterest-earning assets
12.7 12.6 12.3 0.1 1 0.4 3 Total assets 142.2 $ 138.8 $ 135.5 $ 3.4 $ 2 6.7 $ 5 Low-cost core deposits
(1) 55.2 53.6 51.1 1.7 3 4.2 8 Money market deposits
36.2 36.2 34.9 — — 1.3 4 Term deposits
12.6 12.2 12.6 0.4 3 — — Total deposits 104.0 $ 102.0 $ 98.5 $ 2.0 $ 2 5.4 $ 6 Total borrowed funds
15.0 13.9 14.8 1.2 8 0.3 2 Total liabilities
122.2 $ 119.0 $ 115.9 $ 3.2 $ 3 6.3 $ 5 Total stockholders' equity
20.0 19.8 19.6 0.2 1 0.4 2 Total liabilities and equity
142.2 $ 138.8 $ 135.5 $ 3.4 $ 2 % 6.7 $ 5 % Consolidated average balance sheet Linked quarter: Total earning assets up $3.3 billion, or 3%, with loan growth of $2.4 billion, or 2% Commercial loans up $2.1 billion, driven by strong growth in Mid-corporate and Industry Verticals, Commercial Real Estate, Corporate Finance and Franchise Finance Retail loans up $324 million, driven by Education Finance Total deposits increased $2.0 billion on strength in low-cost core deposits Prior-year quarter: Total earning assets up $6.3 billion, or 5% Commercial loans up 10% driven by strength in CRE, Mid-corporate and Industry Verticals, Corporate Finance and Franchise Finance Retail loans up 5%, driven by growth in Education Finance, Home Mortgage and Auto Finance Total deposits up $5.4 billion, or 6%, reflecting strength in low-cost core deposits Borrowed funds increased $266 million Reflects growth in long-term senior debt and long-term FHLB borrowings, which replaced short-term FHLB borrowings and repos, as we continue to align our funding structure with peers 10 Highlights Note: Loan portfolio trends reflect non-core portfolio impact not included in segment results on pages 11 & 12.
1) Low-cost core deposits include demand, checking with interest and regular savings.
$129.5 billion Interest-earning assets $119.0 billion Deposits/borrowed funds Total Retail 42% Total Commercial 38% CRE Other Commercial Residential mortgage Total home equity Automobile Other Retail Investments and interest-bearing deposits Retail / Personal Commercial/ Municipal/ Wholesale Borrowed funds 7% 31% 10% 14% 11% 7% 20% 49% 38% 13% |
 $11.1 $11.6 $12.2 $12.7 $12.9 $18.0 $17.6 $17.2 $17.0 $16.6 $13.5 $13.8 $13.8 $13.8 $14.0 $2.7 $3.2 $3.7 $4.5 $5.1 $3.1 $3.0 $3.0 $3.0 $2.9 $2.3 $2.4 $2.6 $2.5 $2.5 $50.7B $51.6B $52.5B $53.5B $54.0B 2Q15 3Q15 4Q15 1Q16 2Q16 Mortgage Home Equity Auto Student Business Banking Other Consumer Banking average loans and leases 11 1) Other includes Credit Card, RV, Marine, Other. $s in billions Linked quarter: Average loans increased $538 million, or 1%, largely reflecting growth in higher yielding student and mortgage loans partially offset by the impact of the TDR loans transferred to held for sale Consumer loan yields up 4 bps, reflecting the benefit of continued improvement in mix Prior-year quarter: Average loans increased $3.3 billion, or 7%, as growth of $2.4 billion in student, $1.8 billion in mortgages, $490 million in auto and $337 million in other unsecured retail was partially offset by a $1.4 billion decrease in home equity outstandings Consumer loan yields up 20 bps, reflecting initiatives to improve risk-adjusted returns and higher interest rates Highlights Average loans and leases (1) Yields 3.68% 3.69% 3.73% 3.84% 3.88% |
 Yields 2.56% 2.57% 2.57% 2.75% 2.80% $6.4 $6.2 $6.5 $6.4 $6.9 $3.0 $3.0 $3.1 $3.5 $4.1 $3.2 $3.3 $3.5 $3.9 $4.2 $12.2 $12.0 $11.8 $11.9 $11.9 $6.1 $6.1 $6.1 $6.2 $6.1 $7.7 $8.2 $8.5 $8.7 $9.2 $2.7 $3.0 $3.0 $3.2 $3.5 $41.3B $41.8B $42.5B $43.8B $45.9B 2Q15 3Q15 4Q15 1Q16 2Q16 Mid-Corporate Industry Verticals Franchise Finance Middle Market Asset Finance Commercial Real Estate Other Commercial Banking average loans and leases Linked quarter: Average loans up $2.1 billion, or 5%, with strong growth in Mid- corporate and Industry Verticals, Commercial Real Estate, Corporate Finance and Franchise Finance — Results reflect robust loan demand coupled with enhanced client- targeting efforts, along with continued pricing and credit discipline Loan yields increased 5 bps given higher interest rates and improved mix Prior-year quarter: Average loans up $4.6 billion, or 11%, on strength in Mid-corporate
and Industry Verticals, Commercial Real Estate, Franchise Finance
and Corporate Finance
Loan yields increased 24 bps reflecting higher rates and improved
mix
12 1) Other includes Business Capital, Govt, Corporate Finance, Treasury Solutions, Corporate and Commercial Banking Admin.
Highlights $s in billions Average loans and leases (1) |
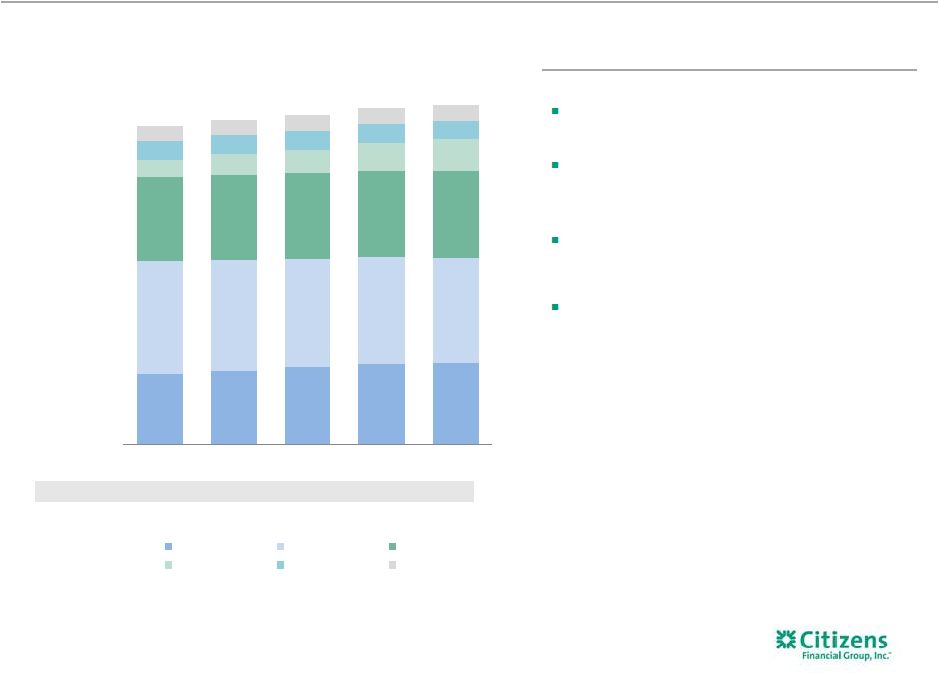
 $43.0 $44.6 $44.6 $44.6 $44.9 $26.4 $26.8 $27.5 $27.2 $27.5 $16.6 $16.9 $17.1 $18.0 $19.0 $12.6 $12.7 $12.2 $12.2 $12.6 $4.4 $2.9 $1.6 $0.9 $1.0 $6.5 $5.1 $5.0 $3.1 $3.7 $3.9 $4.1 $6.0 $9.9 $10.3 $113.3B $113.0B $114.0B $115.9B $119.0B 2Q15 3Q15 4Q15 1Q16 2Q16 Money market & savings DDA Checking with interest Term deposits Total fed funds & repo Short-term borrowed funds Total long-term borrowings Deposit cost of funds 0.24% 0.25% 0.24% 0.24% 0.24% Total cost of funds 0.40% 0.41% 0.41% 0.40% 0.42% Average funding and cost of funds Linked quarter: Total average deposits up $2.0 billion Largely growth in lower-cost checking with interest, demand deposits, term deposits and savings Total deposit costs remained stable, reflecting continued pricing discipline and growth in DDA Continued progress in repositioning liability structure to align better with peers Issued $1 billion in five-year senior bank notes amid strong demand and reflecting broadened market access Prior-year quarter: Total average deposits increased $5.4 billion, or 6%, on strength across most categories Total deposit costs remained stable reflecting continued pricing discipline despite higher interest rates Total borrowed funds cost increase reflects continued shift away from short-term funding 13 Highlights Average interest-bearing liabilities and DDA $s in billions |
 $1,201 $1,201 $1,216 $1,224 $1,246 114% 116% 115% 113% 119% 2Q15 3Q15 4Q15 1Q16 2Q16 Allowance for loan and lease losses NPL coverage ratio $7 $5 ($3) $9 $2 $68 $66 $73 $67 $56 $3 $4 $7 $7 $7 $78 $75 $77 $83 $65 0.33% 0.31% 0.31% 0.33% 0.25% 2Q15 3Q15 4Q15 1Q16 2Q16 Commercial Retail SBO Net c/o ratio $78 $75 $77 $83 $65 $77 $76 $91 $91 $90 $1.1B $1.0B $1.1B $1.1B $1.0B 2Q15 3Q15 4Q15 1Q16 2Q16 Net charge-offs Provision for credit losses 1.24% 1.23% 1.23% 1.21% 1.20% Allowance to loan coverage ratio Overall credit quality improved during the quarter with a decrease in both charge-
offs and NPLs
Net charge-offs of $65 million, or 0.25% of average loans and leases
decreased $18 million from 1Q16;
Retail product net charge-offs of $63 million were $11 million lower than
1Q16 levels
Commercial net charge-offs of $2 million decreased from $9 million in 1Q16
NPLs to total loans and leases improved to 1.01% reflecting
improvement in commercial and retail categories
Provision for credit losses of $90 million stable with 1Q16
Allowance to NPL ratio improved to 119%
Strong credit quality trends continue
14 Highlights 1) Allowance for loan and lease losses to nonperforming loans and leases. $s in millions Net charge-offs (recoveries) NPLs to loans and leases NPLs (1) 1.09% 1.06% 1.07% 1.07% 1.01% Provision for credit losses, charge-offs, NPLs Allowance for loan and lease losses |
 15.3% 15.4% 15.3% 15.1% 14.9% 11.8% 11.8% 11.7% 11.6% 11.5% 2Q15 3Q15 4Q15 1Q16 2Q16 Total capital ratio Common equity tier 1 ratio 97% 96% 97% 99% 98% 2Q15 3Q15 4Q15 1Q16 2Q16 as of $s in billions (period-end) 2Q15 3Q15 4Q15 1Q16 2Q16 Basel III transitional basis (1,2) Common equity tier 1 capital 13.3 $ 13.2 $ 13.4 $ 13.6 $ 13.8 $ Risk-weighted assets 112.1 $ 112.3 $ 114.1 $ 116.6 $ 119.5 $ Common equity tier 1 ratio 11.8 % 11.8 % 11.7 % 11.6 % 11.5 % Total capital ratio 15.3 % 15.4 % 15.3 % 15.1 % 14.9 % Basel III fully phased-in (1,3) Common equity tier 1 ratio 11.8% 11.7% 11.7% 11.6% 11.5% Basel III minimum for CET1 ratio 2015 2016 2017 2018 2019 Basel III minimum plus phased-in capital conservation buffer 4.5 % 5.1 % 5.8 % 6.4 % 7.0 % Capital and liquidity remain strong 15 Highlights 1) Current reporting period regulatory capital ratios are preliminary. 2) Basel III ratios assume that certain definitions impacting qualifying Basel III capital will phase in through 2019. Ratios also reflect
the required U.S. Standardized methodology for calculating RWAs,
effective January 1, 2015.
3) This is a non-GAAP financial measure. See important information on use of non-GAAP items in the Appendix.
4) Based on the September 2014 release of the U.S. version of the Liquidity Coverage Ratio (LCR). Note that as a modified LCR company,
CFG’s minimal LCR requirement of 90% began January 2016.
5) Period end includes held for sale. Capital levels remain above regional peers 2Q16 Basel III common equity tier 1 ratio (transitional basis) down approximately 12 basis points from 1Q16 Net income: ~21 bps increase RWA growth: ~29 bps decrease Dividends & other: ~4 bps decrease LDR of 98% improved from 1Q16 Fully compliant with LCR requirement (4) Issued $1.0 billion in senior unsecured bank notes 2016 CCAR plan reflects continued commitment towards prudent return of capital with $690 million in share repurchases Loan-to-deposit ratio (5) Capital ratio trend (1,2) (1,2) |
 Initiative 2Q16 Status Commentary Reenergize household growth Retail checking HHs up QoQ and YoY with new checking HH first year attrition improvements. Deposits up 3%
and services charges up 5% YoY.
Expand mortgage sales force
Application and origination volumes up 20% and 42% QoQ with improved
throughput as operational issues have been addressed. Achieved
highest pipeline roll rate since TRID / platform implementation. LOs up 16 QoQ to 451. Grow Auto Selectively raising price to moderate origination volumes; organic originations yields up 33 bps YoY.
Grow Student/Installment
Sustained momentum in Student with total loan balances up 91% from 2Q15.
Continued steady growth in iPhone
upgrade program (iUp).
Expand Business Banking
Increasing focus on deposits, cash management, and other fee income streams
driving deposits up 4% and deposit fees up 7% compared to 2Q15.
Expand Wealth sales force
Financial consultants up 10% YoY to 339. Enhancing and expanding product set and transitioning to more balanced fee-based model. Build out Mid-Corp & verticals Loan growth of over 20% YoY; improving capital markets cross sell with particular strength in fixed income. Continue development of Capital and Global Markets activities Fee income up 15% YoY driven by improved deal volume and bond market conditions. Mid-May commencement of broker dealer provided incremental fee opportunities. Enhanced FX and Interest-rate platform.
Build out Treasury Solutions
Fees up 16% vs. 2Q15 led by strength in core cash management services, TOP II pricing initiative, and
commercial card.
Grow Franchise Finance
Strong growth with balances up 19% YoY. Continue expansion in well-established brands of quick service and
fast casual franchises.
Expand Middle Market
Portfolio relatively stable compared to 1Q16. Deposits up ~$750 million, or 12%, and fee income up 16% versus prior year quarter. Grow CRE Continued to deepen client penetration with top developers in core geographies. CRE loans up 6% QoQ and
20% YoY to $9.2 billion,
but moderating growth in a number of select areas such as
multi-family in D.C. metro. Reposition Asset
Finance Driving
increased penetration with Middle Market customer base, helping to offset reductions in RBS referral business. Initiatives targeting transportation, construction, and renewable sectors driving higher margins.
Balance Sheet Optimization
Continued execution of balance sheet strategies including loan pricing and mix. Cost of deposits remained flat from 1Q16 at 24 bps. $310 million TDR transaction executed in July. TOP II TOP II program is well underway and remains on track to deliver $95-$100 million of P&L benefit in 2016.
TOP III TOP III Program has been launched with heavier emphasis on efficiency initiatives. Targeting 2017 run-rate
benefit of $90-$110 million.
Summary of progress on strategic initiatives
16 |
 Citizens operating leverage has been highly
consistent: we’ve delivered positive YoY results in
the past 8 consecutive quarters
Citizens has regularly exceeded average peer
operating leverage
Keys to future revenue growth include
– Use strong capital position to grow loans and add customers – Build up fee businesses to capture franchise potential – Protect NIM through skillful asset and deposit initiatives Expense discipline centers around self-funding of gaps and growth initiatives – Gaps include technology and risk/regulatory catch-up – Growth initiatives include customer-facing colleagues in Commercial, Wealth, Mortgage, data analytics and product/technology builds Citizens continues to deliver positive operating leverage 17 Highlights $s in millions Peer data Source: Bloomberg. 1) Non-GAAP item. See important information on use of non-GAAP items in the Appendix.
2) 1H16 Peer average reflects Bloomberg consensus estimates as of 7/12/16. Peer group includes BBT, CMA, FITB, KEY, MTB, PNC, RF, STI, USB.
MTB excluded from peer average due to recent
acquisition. 1H15
2H15 1H16 Adjusted Revenue (1) 2,383 $ 2,441 $ 2,512 $ Adjusted Expense (1) 1,601 $ 1,608 $ 1,638 $ Adjusted Operating leverage (1) 3.9 % 2.5 % 3.1 % Operating leverage - peer average (2) (2.7) % (1.0) % 0.9 % |
 Citizens’ ROTCE levels primarily reflect sub-par revenue achievement
18
$s in millions
Relatively low-fee revenue capture is being addressed through growth
initiatives Other contributing factors to low ROTCE include excess
capital position and high tax rate, also being addressed
0.13% 0.38% CFG Peer average CFG data as of 2Q16 unless otherwise noted, peer data as of 1Q16 and sourced from SNL Financial and company filings.
1) Peer average includes BBT, CMA, FITB, KEY, PNC, RF, STI and USB. MTB excluded due to recent acquisition.
2) Peer average includes BBT, CMA, FITB, KEY, MTB, PNC, RF, STI and USB. 3) Capital Markets fees defined as trading revenue, investment banking, advisory and underwriting fees. Peers includes BBT, CMA, KEY, MTB,
RF and STI. 4)
Source: Treasury Strategies, Inc. for benchmarks and public filings, estimate
of 2015 market share of ~$40B revenue, NII and fees market based on benchmarks and public filings. TS peers include STI, FITB, PNC and USB. Treasury Solutions revenue includes Treasury Management, Accounts Receivable, Payables,
Procurement and related Risk and Financial Control activities.
2015 estimated growth rates based on fee income only.
5) Non-GAAP item. See important information on use of non-GAAP items in the Appendix.
0.4% 0.5% CFG Peer average Capital Markets revenue potential (FY 2015 Capital Markets fees/ FY 2015 Average Commercial loans) (3) Treasury Solutions revenue potential (FY 2015 NII & Fee income/ $1 billion of commercial loans (4) ) 0.99% 1.22% CFG Peer Average 0.64% 0.76% CFG Peer Average Revenue-capture opportunity (Revenue/Average interest-earning assets (1) ) Expense levels less the issue (Expense/Average interest-earning assets (1) ) $9 $18 CFG TS Peer Average 68.7% 61.9% 64.7% 62.5% CFG Peer Average FY14 2Q16 FY14 1Q16 Improving efficiency ratio (Adjusted Operating expense/Adjusted Revenue (1) ) (5) Wealth opportunity to drive fee income growth (FY 2015 Wealth Fees/FY 2015 Earning Assets (2) ) |
 2016 targeted pre-tax benefit Category Name Description Revenue Expense Progress to date Efficiencies Operations Transformation Refine operating model to simplify organization, reduce costs, improve service levels and enhance controls $25-$30 • Executed operating model changes in 2015. Achieved full run-rate savings in 2Q15. Procurement Achieve cost-reduction opportunities through further vendor-management consolidation and tighter standards $15-$20 • 2016 run-rate savings complete in 2016. Driven by reduction in external resources and tightening of internal travel and office supplies policies. Pricing Commercial Lending/ Treasury Services Improve customer pricing methodology to better align with competitive landscape; utilizing enhanced client segmentation $20-$25 • Commercial pricing initiatives have been fully implemented resulting in average lending pricing up-lift of 10%+. • Treasury Services has re-priced ~12,000 accounts and increases are tracking to expectations. Revenue Consumer distribution channel effectiveness Launch effort to improve branch and contact center sales effectiveness, with the goal of deepening customer relationships $15-$20 • “Citizens Checkup” rolled out to all branches and exceeding expectations on quality of customer engagement and satisfaction. Continuing to drive to business case levels of 1-2 incremental sales per branch per week, though sales skewed towards recurring revenue so taking longer to achieve run rate. Commercial and Consumer Develop improved high-value customer-retention programs and enhanced tools and analytics to improve cross-sell efforts $15-$20 • Commercial: Launched new tools to prioritize opportunities and enhanced sales routine to ensure product partner alignment, resulting in Middle Market pipeline at 2x historical level. • Consumer Retention: Continued progress on improving pricing of deposits. Platinum experience and the Home Equity Retention Unit were launched in June; early results are positive. Total $50-$65 $40-$50 $90-$115 TOP II has delivered well across revenues and expenses 19 Current estimate is to deliver $95-100 million benefit in 2016 |
    end
2017 Name
Description Revenue Expense Consumer Reducing staff in non-revenue areas and driving further efficiencies in the distribution network – $33-35 Commercial Streamlining end-to-end loan process including relationship management coverage models, portfolio management and operations – $8-10 Functions Simplifying and re-engineering process in each of the functional areas (focus on Finance, HR, Risk, Technology) – $10-15 Attrition management Using analytics to predict and reach-out to at-risk commercial
customers $12-15 – Unsecured lending Launching new product using data & analytics capabilities to target customers $10-15 – Total targeted pre-tax impact Executing on several initiatives (R&D, renewable, other tax credits) to align tax rate to peer levels - Expected to result in 2017 tax rate of ~31% After-tax benefit Pre-tax equivalent benefit Total pre-tax equivalent benefit $17-20 Efficiencies Revenue enhancements Targeted annual run-rate benefit Tax efficiencies Tax efficiences Net tax benefit $10-15* $90-110 $73-90 TOP III is taking shape, greater emphasis on expenses 20 $s in millions Program is designed to improve overall efficiency and effectiveness of the organization while providing
the ability to self fund investments that drive future growth
* Noninterest income impact: ($20) to ($25); tax expense benefit of $30 to
$40. |
 Committed to delivering positive operating leverage
21 Forward curve currently projects very low probability of Fed rate increase over 2016/2017; current curve
has flattened, with the long end significantly lower
While this creates some headwind, we have been delivering solid operating
leverage, EPS growth and ROTCE improvement over past two years
with no net rate benefit, as the one move in the Fed Funds rate
has been more than offset by the impact of the flattened yield
curve Key is to continue to execute well against our plan
TOP III benefit positive for 2017 outlook, will be used towards
positive operating leverage objective. Continue to contain
expense growth while self-funding investments to drive fee income capabilities and growth Expect to reinvest roughly 30-40% of the approximately $70 million TDR gain to fund costs associated with
TOP III efficiencies
and continued optimization of the balance sheet
|
  We
achieved a successful CCAR/DFAST outcome 22
Highlights $s in millions Strong capital position permits aggressive loan growth and shareholder return of capital, while maintaining peer-leading CET1 ratio Will continue to be prudent in CCAR process given need for higher earnings and ROTCE improvement Fed CCAR post-stress credit results indicate high quality loan book relative to peers Citizens has made strong progress in improving all qualitative aspects of the framework 2015 CCAR 2015 CCAR 2016 CCAR Authorization 5 Quarters 4-Quarter Pro forma 4 Quarters Dividends 285 $ 228 $ 280 $ Share repurchases 500 400 690 Total common payout
785 $ 628 $ 970 $ 54% greater |
 TDR transaction highlights
23 Highlights TDR transaction detail $s in millions Sold $310 million of TDR assets on July 19 th and recorded a 3Q16 ~$70 million gain on sale through other income – Plan to utilize roughly 30-40% of the TDR Transaction gain to fund costs associated with efficiency initiatives and other balance sheet optimization costs in 3Q16 Transaction improves asset quality and provides ability to further improve risk-adjusted returns as well as reducing CCAR stressed loss levels Held for sale Transfers Paydowns Sold Mortgage Home Equity Total Total Total Total Performing 222 $ 54 276 $ (34) $ (3) $
239 $ Nonperforming 66 $ 31 97 $ (25) $ (1) $
71 $
Total 288 $ 85 $ 373 $ (59) $ (4) $
310 $ |
 3Q16 outlook (1) 24 Net interest income, net interest margin Noninterest expense Credit trends, tax rate ~1.5% Loan growth Slight decline in net interest margin Relatively stable Committed to YoY operating leverage goals Broad credit trends remain favorable Provision expense stable Tax rate of ~32% 3Q16 expectations vs. 2Q16 (1) Capital, liquidity and funding Quarter-end Basel III common equity tier 1 ratio ~11.3% Loan-to-deposit ratio of ~99% Noninterest income Low-single digit growth 1) Does not reflect the benefit of 3Q16 TDR transaction gain of ~$70 million; roughly 30-40% of this gain is expected to be
used to fund costs associated with TOP III initiative as well as
other initiatives to improve balance sheet efficiency and
effectiveness |
 Key messages 25 Citizens once again delivered strong results in 2Q16 – Financial results continue to improve and meet expectations – Delivering against strategic initiatives with strong growth in Capital Markets and improving
results in Mortgage Banking
– Continued execution on balance sheet optimization strategies providing underlying strength and
momentum – NIM performing well in challenging environment, continued prudent loan growth, TDR
sale provides further credit quality and risk-adjusted return benefits
–
Tangible book value
(1) per share continues to grow; $25.72 at quarter end, up 2% from 1Q16 – Continued progress on regulatory and capital framework with another successful CCAR
outcome; continued focus on generating enhanced shareholder returns and
increased capital returns
2H16 will continue to focus on delivering well despite interest-rate
headwinds –
Comprehensive plan to deliver well for all stakeholders
– Key to financial results is to grow the balance sheet smartly with continued focus on building out
fee businesses and delivering positive operating leverage
– Launched TOP III initiatives to help fund future investments and focus on continuous
improvement Capital and credit position remain strong – Peer leading CET1 ratio permits both strong loan growth and returns to shareholders
– Overall credit metrics continue to improve; portfolio performed well relative to peers in CCAR
stress test 1) Non-GAAP item. See important information on use of non-GAAP items in the Appendix. |
 * * * * * * * * * * * Appendix 26 |
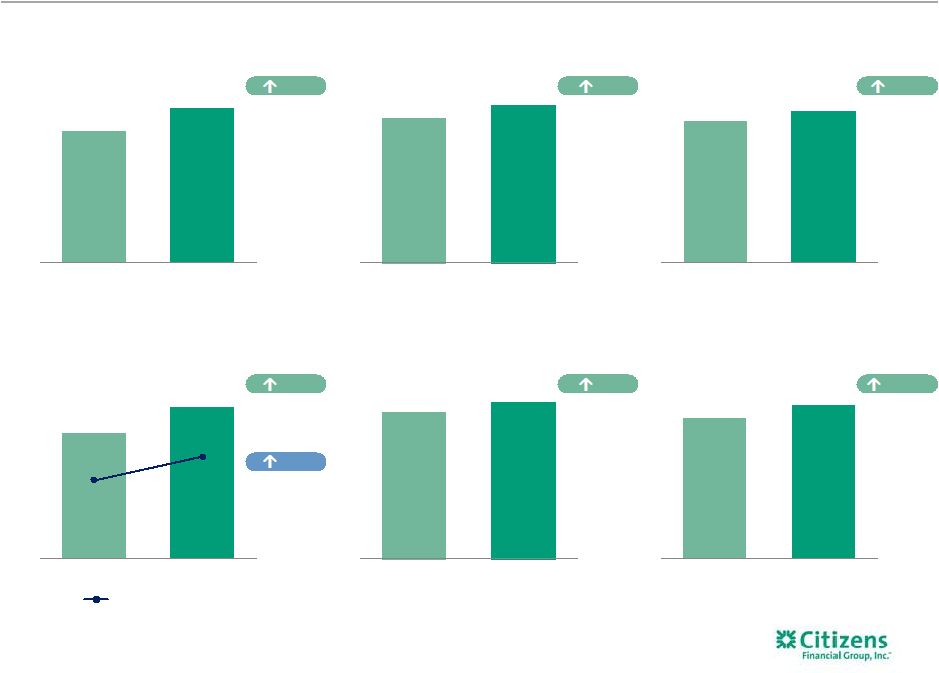 $399 $451 2Q15 2Q16 0.67% 0.72% 2Q15 2Q16 $215 $243 $0.40 $0.46 2Q15 2Q16 6.7% 7.3% 2Q15 2Q16 Quarter-over-quarter results 27 Adjusted pre-provision profit $s in millions Adjusted return on average tangible assets Adjusted net income $s in millions 1) Adjusted results are non-GAAP items and exclude the effect of net restructuring charges and special items associated with efficiency
and effectiveness programs and separation from RBS. See important
information on use of non-GAAP items in the Appendix.
2) Excludes loans held for sale. Adjusted return on average tangible common equity 63 bps 5 bps 13% 13% Period-end loans $s in billions Period-end deposits $s in billions 15% Adjusted Diluted EPS (1) (1) (1) (1) (2) (1) $106.3 7% 6% $100.6 $103.6 $96.5 2Q15 2Q16 2Q15 2Q16 |
 $423 $451 1Q16 2Q16 0.68% 0.72% 1Q16 2Q16 $223 $243 $0.41 $0.46 1Q16 2Q16 6.6% 7.3% 1Q16 2Q16 Linked-quarter results 28 4 bps 69 bps 7% Diluted EPS 12% Pre-provision profit $s in millions Return on average tangible assets Period-end loans $s in billions (1) Net income $s in millions Return on average tangible common equity Period-end deposits $s in billions 3% 1) Excludes loans held for sale. 2) Non-GAAP item. See important information on use of non-GAAP items in the Appendix.
9% $102.6 4% (2) (2) $101.0 $106.3 $103.6 1Q16 2Q16 1Q16 2Q16 |
 Consumer Banking segment
29 1) Non-GAAP item. Adjusted results exclude the effect of net restructuring charges and special items associated with efficiency and
effectiveness programs and separation from RBS. See important
information on use of non-GAAP items in the Appendix.
2) Includes held for sale. 3) Operating segments are allocated capital on a risk-adjusted basis considering economic and regulatory capital requirements. We
approximate that regulatory capital is equivalent to a sustainable
target level for tier 1 common equity and then allocate that approximation to the segments based on economic capital. Highlights Linked quarter: Net income up $19 million, or 27% Net interest income up $21 million, driven by higher loan balances and improved loan and deposit spreads Average loans and deposits up slightly Noninterest income increased $11 million, driven by mortgage banking and service charges and other fees Mortgage banking fees reflect higher application and origination volumes Noninterest expense increased $16 million, reflecting higher salary and benefits expense related to timing of merit increases and incentive payments, higher regulatory, fraud and insurance costs and higher outside services expense Prior-year quarter: Net income up $24 million, or 36% Total revenue up $47 million reflecting strength in net interest income, largely related to the benefit of an increase in average student, mortgage, auto and consumer unsecured loans and improved deposit spreads Average loans up $3.3 billion and average deposits up $1.9 billion Noninterest expense increased $19 million, or 3%, given continued investment in the business to drive further growth 2Q16 change from $s in millions 2Q16 1Q16 2Q15 1Q16 2Q15 $ % $ % Net interest income 602 $ 581 $ 544 $ 21 $ 4 % 58 $ 11 % Noninterest income 219 208 230 11 5 (11) (5) Total revenue 821 789 774 32 4 47 6 Noninterest expense 632 616 613 16 3 19 3 Pre-provision profit 189 173 161 16 9 28 17 Provision for credit losses 49 63 60 (14) (22) (11) (18) Income before income tax expense 140 110 101 30 27 39 39 Income tax expense 50 39 35 11 28 15 43 Net income 90 $ 71 $ 66 $ 19 $ 27 % 24 $ 36 % Average balances $s in billions Total loans and leases (2) 54.4 $ 53.7 $ 51.0 $ 0.6 $ 1 % 3.3 $ 7 % Total deposits 71.9 $ 70.9 $ 70.0 $ 1.0 $ 1 % 1.9 $ 3 % Mortgage Banking metrics Originations 1,964 $ 1,386 $ 1,523 $ 578 $ 42 % 441 $ 29 % Origination Pipeline 2,528 2,126 1,897 402 19 % 631 33 % Gain on sale of secondary originations 2.42% 2.40% 2.18% 2 bps 24 bps Performance metrics ROTCE (1,3) 7.1% 5.6% 5.7% 150 bps 143 bps Efficiency ratio (1) 77% 78% 79% (110) bps (227) bps |
 Commercial Banking segment
30 1) Non-GAAP item. See important information on use of non-GAAP items in the Appendix.
2) Includes held for sale. 3) Operating segments are allocated capital on a risk-adjusted basis considering economic and regulatory capital requirements. We
approximate that regulatory capital is equivalent to a sustainable
target level for tier 1 common equity and then allocate that approximation to the segments based on economic capital. Highlights Linked quarter: Commercial Banking net income increased $31 million, or 23% Total revenue increased $37 million with solid improvement in net interest income largely related to loan growth and higher interest recoveries Average loans up $2.2 billion; deposits up slightly Loan growth driven by strength in Mid-corporate and Industry Verticals, Commercial Real Estate, Corporate Finance and Franchise Finance Noninterest income increased $23 million, driven by strength in capital markets and interest rate products Noninterest expense was flat as higher salaries and employee benefits related to a change in timing of merit and incentive payments and higher insurance costs were offset by lower outside services expense Prior-year quarter: Net income increased $29 million, or 21% Net interest income was up $28 million, reflecting the benefit of a $4.6 billion increase in average loans and leases, improved deposit spreads and a $2.4 billion increase in average deposits Noninterest income increased $14 million, reflecting strength in service charges and fees, including the benefit of Treasury Solutions’ pricing initiatives and interest rate products and capital
markets fees
Noninterest expense increased $5
million as increased salaries
and employee benefits related to the timing of merit increases
and incentive payments and higher insurance costs were partially
offset by lower outside services costs.
2Q16 change from
$s in millions 2Q16 1Q16 2Q15 1Q16 2Q15 $ % $ % Net interest income 314 $ 300 $ 286 $ 14 $ 5 % 28 $ 10 % Noninterest income 122 99 108 23 23 14 13 Total revenue 436 399 394 37 9 42 11 Noninterest expense 186 187 181 (1) (1) 5 3 Pre-provision profit 250 212 213 38 18 37 17 Provision for credit losses (1) 9 7 (10) (111) (8) (114) Income before income tax expense 251 203 206 48 24 45 22 Income tax expense 87 70 71 17 24 16 23 Net income 164 $ 133 $ 135 $ 31 $ 23 % 29 $ 21 % Average balances $s in billions Total loans and leases (2) 46.1 $ 43.9 $ 41.5 $ 2.2 $ 5 % 4.6 $ 11 % Total deposits 25.1 $ 24.8 $ 22.7 $ 0.3 $ 1 % 2.4 $ 11 % Performance metrics ROTCE (1,3) 13.0% 11.2% 11.7% 185 bps 135 bps Efficiency ratio (1) 43% 47% 46% (386) bps (319) bps |
 2Q16 change from
$s in millions 2Q16 1Q16 2Q15 1Q16 2Q15 $ % $ % Net interest income 7 $ 23 $ 10 $ (16) $ (70) % (3) $ (30) % Noninterest income 14 23 22 (9) (39) (8) (36) Total revenue 21 46 32 (25) (54) (11) (34) Noninterest expense 9 8 47 1 13 (38) (81) Pre-provision profit (loss) 12 38 (15) (26) (68) 27 180 Provision for credit losses 42 19 10 23 121 32 NM Income (loss) before income tax expense (benefit) (30) 19 (25) (49) NM (5) (20) Income tax expense (benefit) (19) — (14) (19) NM (5) (36) Net income (loss) (11) $ 19 $ (11) $ (30) $ (158) % — $ — % Average balances $s in billions Total loans and leases 3.1 $ 3.0 $ 3.6 $ 0.1 $ 3 % (0.5) $ (14) % Total deposits 7.0 $ 6.3 $ 5.9 $ 0.7 $ 12 % 1.2 $ 20 % Other 31 Linked quarter: Other recorded a net loss of $11 million versus net income of $19 million. This decrease was largely driven by lower revenue and higher provision for credit losses Net interest income decreased $16 million, largely reflecting higher borrowing costs related to term-debt issuance, lower residual funds-transfer pricing, investment portfolio income and non-core loan interest Noninterest income decreased $9 million, largely reflecting lower securities gains and higher securities impairment charges Noninterest expense remained relatively stable Provision for credit losses of $42 million included a $25 million reserve build compared with $19 million of provision for credit losses, which included an $8 million reserve build Prior-year quarter: Net loss was flat Net interest income decreased $3 million Noninterest income decreased $8 million Noninterest expense down $38 million from 2Q15, which included restructuring charges and special items Provision for credit losses increased $32 million Reflects $25 million reserve build versus a $1 million release in the prior-year quarter Highlights |
 B- and lower 24% 20% 16% 7% 8% 25% 1.8% 98.2% 23% 28% 20% 29% Oil & Gas portfolio overview Well-diversified portfolio with ~100 clients Includes $335 million of corporate aircraft leases arising from Asset Finance Nonperforming loans down $15 million largely due to pay downs on RBL portfolio Existing RBL commitments declined by 17% due to 2Q16 borrowing base redeterminations and restructuring activity; a new credit extension of ~$50 million partially offset these reductions Oil and gas portfolio loan loss reserves of $80 million as of 6/30/16 Reserves to total loans of more price-sensitive portfolios now at 8.5% (3) , up from 6.3% in 1Q16 32 Highlights Total loans outstanding (2) Oil & Gas All other loans 1) Includes Downstream, Integrated, and Midstream sub-categories. 2) Portfolio balances, risk rating and industry sector stratifications as of June 30, 2016.
3) Reserves/(More price-sensitive Oil & Gas portfolio outstandings - leases secured by aircraft ($133 million)). BBB+ to BBB- BB+ to BB- B+ to B 23% investment grade ~$1.1 billion more sensitive to declining oil prices Midstream Integrated Downstream Reserve-based lending (RBL) Upstream, Non-RBL Oil Field Services Oil & Gas portfolio by Sub-sector (2) Oil & Gas portfolio by Investment grade-equivalent risk rating (2) 2Q16 Oil & Gas outstandings $s in millions Total O/S Utilized % Criticized % Nonaccrual status Less price-sensitive total 731 $ 64% 2% 0 $
Upstream 295 66% Oilfield Services 355 73% Reserve-based lending (RBL) 425 65% More price-sensitive total 1,075 68% 57% 195 Total Oil & Gas
1,806 $ 66% 35% 195 $ Total Oil & Gas ex. Aircraft 1,471 $ 62% 43% 195 $ |
 Restructuring charges and special items
33 1) These are non-GAAP financial measures. Please see Non-GAAP Reconciliation Tables in the Appendix for an explanation of our use of
non-GAAP financial measures and their reconciliation to GAAP.
2Q16 1Q16 2Q15 1Q16 2Q15 $ % $ % Pre-tax restructuring charges and special items — $ — $ 40 $ — $ NM % (40) $ NM % After-tax restructuring charges and special items — — 25 — NM (25) NM Diluted EPS impact — $ — $ 0.05 $ — $ NM % (0.05) $ NM % $s in millions, except per share data GAAP results included restructuring charges and special items related to enhancing efficiencies and improving processes across the organization and separation from The Royal Bank of Scotland Group plc (“RBS”). 2Q16 change from Restructuring charges and special items (1) |
 Non-GAAP financial measures
34 This document contains non-GAAP financial measures. The table below presents reconciliations of certain non-GAAP measures. These
reconciliations exclude restructuring charges and/or special
items, which are included, where applicable, in the financial results presented in accordance with GAAP. Restructuring charges and special items include expenses related to our efforts to improve processes and enhance efficiencies, as well as rebranding,
separation from RBS and regulatory expenses.
The non-GAAP measures presented below include
“noninterest income”, “total revenue”, “ noninterest expense”, “pre-provision profit”, “income before income tax expense”, “income tax expense”, “net income”, “net income available to common stockholders”, “salaries and employee benefits”, “outside services”, “occupancy”, “equipment expense”,
“other operating expense”, “net
income per average common share”, “return on average common equity” and “return on average total
assets”
. In addition, we present computations for "tangible book value per common share", “return on average tangible common equity”, “return on average total
tangible assets”, “efficiency ratio”, “pro forma Basel III fully phased-in common equity tier 1 capital”, “operating leverage”, “noninterest income before accounting
change”
and “card fee income before accounting change” as part of our
non-GAAP measures. We believe these non-GAAP measures provide useful information to investors
because these are among the measures used by our management team to evaluate our operating performance and make day-to-day operating decisions. In addition, we believe restructuring charges and special items in
any period do not reflect the operational performance of the
business in that period and, accordingly, it is useful to consider these line items with and without restructuring charges and special items. We believe this presentation also increases comparability of period-to-period results.
We also consider pro forma capital ratios defined by banking regulators but not effective at each period end to be non-GAAP financial
measures. Since analysts and banking regulators may assess our
capital adequacy using these pro forma ratios, we believe they are useful to provide investors the ability to assess our capital adequacy on the same basis. Other companies may use similarly titled non-GAAP financial measures that are calculated differently from the way we calculate such
measures. Accordingly, our non-GAAP financial measures may
not be comparable to similar measures used by other companies. We caution investors not to place undue reliance on such non- GAAP measures, but instead to consider them with the most directly comparable GAAP measure. Non-GAAP financial measures have
limitations as analytical tools and should not be considered in
isolation or as a substitute for our results as reported under GAAP. |
 Non-GAAP financial measures and reconciliations
35 (Excluding restructuring charges and special items) $s in millions, except per share data 2Q16 1Q16 4Q15 3Q15 2Q15 2016 2015 2015 2014 Noninterest income, excluding special items: Noninterest income (GAAP) $355 $330 $362 $353 $360 $685 $707 Less: Special items — — — — — — — Noninterest income, excluding special items (non-GAAP) $355 $330 $362 $353 $360 $685 $707 Total revenue, excluding special items: Total revenue (GAAP) A $1,278 $1,234 $1,232 $1,209 $1,200 $2,512 $2,383 $4,824 $4,979 Less: Special items — — — — — — — — 288 Total revenue, excluding special items (non-GAAP) B $1,278 $1,234 $1,232 $1,209 $1,200 $2,512 $2,383 $4,824 $4,691 Noninterest expense, excluding restructuring charges and special items: Noninterest expense (GAAP) C $827 $811 $810 $798 $841 $1,638 $1,651 $3,259 $3,392 Less: Restructuring charges and special items — — — — 40 — 50 50 169 Noninterest expense, excluding restructuring charges and special items (non-GAAP)
D $827 $811 $810 $798 $801 $1,638 $1,601 $3,209 $3,223 Pre-provision profit, excluding restructuring charges and special items:
Total revenue, excluding restructuring charges and special items
(non-GAAP) $1,278
$1,234 $1,232 $1,209 $1,200 $2,512 $2,383 Less: Noninterest expense, excluding restructuring charges and special items (non-GAAP)
827 811 810 798 801 1,638 1,601 Pre-provision profit, excluding restructuring charges and special items (non-GAAP)
$451 $423 $422 $411 $399 $874 $782 Income before income tax expense, excluding restructuring charges and special items:
Income before income tax expense (GAAP)
$361 $332 $331 $335 $282 $693 $597 Less: Income before income tax expense (benefit) related to restructuring charges and special items (GAAP)
— — — — (40) — (50) Income before income tax expense, excluding restructuring charges and special items (non-GAAP)
$361 $332 $331 $335 $322 $693 $647 Income tax expense, excluding restructuring charges and special items: Income tax expense (GAAP) $118 $109 $110 $115 $92 $227 $198 Less: Income tax (benefit) related to restructuring charges and special items (GAAP)
— — — — (15) — (19) Income tax expense, excluding restructuring charges and special items (non-GAAP)
$118 $109 $110 $115 $107 $227 $217 Net income, excluding restructuring charges and special items: Net income (GAAP) E $243 $223 $221 $220 $190 $466 $399 Add: Restructuring charges and special items, net of income tax expense (benefit)
— — — — 25 — 31 Net income, excluding restructuring charges and special items (non-GAAP)
F $243 $223 $221 $220 $215 $466 $430 Net income available to common stockholders (GAAP), excluding restructuring charges and special items:
Net income available to common stockholders (GAAP)
G $243 $216 $221 $213 $190 $459 $399 Add: Restructuring charges and special items, net of income tax expense (benefit)
— — — — 25 — 31 Net income available to common stockholders, excluding restructuring charges and special items (non-GAAP)
H $243 $216 $221 $213 $215 $459 $430 Return on average common equity, excluding restructuring charges and special items:
Average common equity (GAAP)
I $19,768 $19,567 $19,359 $19,261 $19,391 $19,667 $19,399 Return on average common equity, excluding restructuring charges and special items (non-GAAP)
H/I 4.94 % 4.45 % 4.51 % 4.40 % 4.45 % 4.70 % 4.47 % Return on average tangible common equity and return on average tangible common equity, excluding restructuring
charges and special items:
Average common equity (GAAP)
I $19,768 $19,567 $19,359 $19,261 $19,391 $19,667 $19,399 Less: Average goodwill (GAAP) 6,876 6,876 6,876 6,876 6,876 6,876 6,876 Less: Average other intangibles (GAAP) 2 3 3 4 5 2 5 Add: Average deferred tax liabilities related to goodwill (GAAP) 496 481 468 453 437 488 430 Average tangible common equity (non-GAAP) J $13,386 $13,169 $12,948 $12,834 $12,947 $13,277 $12,948 Return on average tangible common equity (non-GAAP) G/J 7.30 % 6.61 % 6.75 % 6.60 % 5.90 % 6.96 % 6.21 % Return on average tangible common equity, excluding restructuring charges and special items (non-GAAP)
H/J 7.30 % 6.61 % 6.75 % 6.60 % 6.67 % 6.96 % 6.70 % QUARTERLY TRENDS FOR THE YEAR ENDED DECEMBER ENDED JUNE 30, FOR THE SIX MONTHS |
 Non-GAAP financial measures and reconciliations
36 (Excluding restructuring charges and special items) $s in millions, except per share data 2Q16 1Q16 4Q15 3Q15 2Q15 2016 2015 2015 2014 Return on average total assets, excluding restructuring charges and special items:
Average total assets (GAAP)
K $142,179 $138,780 $136,298 $135,103 $135,521 $140,479 $134,429 Return on average total assets, excluding restructuring charges and special items (non-GAAP)
F/K 0.69% 0.65% 0.64% 0.65% 0.64% 0.67% 0.65% Return on average total tangible assets and return on average total tangible assets, excluding restructuring charges
and special items:
Average total assets (GAAP)
K $142,179 $138,780 $136,298 $135,103 $135,521 $140,479 $134,429 Less: Average goodwill (GAAP) 6,876 6,876 6,876 6,876 6,876 6,876 6,876 Less: Average other intangibles (GAAP) 2 3 3 4 5 2 5 Add: Average deferred tax liabilities related to goodwill (GAAP) 496 481 468 453 437 488 430 Average tangible assets (non-GAAP) L $135,797 $132,382 $129,887 $128,676 $129,077 $134,089 $127,978 Return on average total tangible assets (non-GAAP) E/L 0.72% 0.68% 0.67% 0.68% 0.59% 0.70% 0.63% Return on average total tangible assets, excluding restructuring charges and special items (non-GAAP)
F/L 0.72% 0.68% 0.67% 0.68% 0.67% 0.70% 0.68% Efficiency ratio and efficiency ratio, excluding restructuring charges and special items:
Efficiency ratio (non-GAAP)
C/A 64.71% 65.66% 65.76% 66.02% 70.02% 65.18% 69.27% 67.56% 68.12% Efficiency ratio, excluding restructuring charges and special items (non-GAAP)
D/B 64.71% 65.66% 65.76% 66.02% 66.70% 65.18% 67.17% 66.52% 68.70% Tangible book value per common share: Common shares - at end of period (GAAP) M 529,094,976 528,933,727 527,774,428 527,636,510 537,149,717 529,094,976 537,149,717 Common stockholders' equity (GAAP) $19,979 $19,718 $19,399 $19,353 $19,339 $19,979 $19,339 Less: Goodwill (GAAP) 6,876 6,876 6,876 6,876 6,876 6,876 6,876 Less: Other intangible assets (GAAP) 2 3 3 3 4 2 4 Add: Deferred tax liabilities related to goodwill (GAAP) 507 494 480 465 450 507 450 Tangible common equity (non-GAAP) N $13,608 $13,333 $13,000 $12,939 $12,909 $13,608 $12,909 Tangible book value per common share (non-GAAP) N/M $25.72 $25.21 $24.63 $24.52 $24.03 $25.72 $24.03 Net income per average common share - basic and diluted, excluding restructuring charges and special items: Average common shares outstanding - basic (GAAP) O 528,968,330 528,070,648 527,648,630 530,985,255 537,729,248 528,519,489 541,986,653 Average common shares outstanding - diluted (GAAP) P 530,365,203 530,446,188 530,275,673 533,398,158 539,909,366 530,396,871 544,804,268 Net income available to common stockholders (GAAP) G $243 $216 $221 $213 $190 $459 $399 Net income per average common share - basic (GAAP) G/O 0.46 0.41 0.42 0.40 0.35 0.87 0.74 Net income per average common share - diluted (GAAP) G/P 0.46 0.41 0.42 0.40 0.35 0.87 0.73 Net income available to common stockholders, excluding restructuring charges and special items (non-GAAP)
H 243 216 221 213 215 459 430 Net income per average common share - basic, excluding restructuring charges and special items (non-GAAP) H/O 0.46 0.41 0.42 0.40 0.40 0.87 0.79 Net income per average common share - diluted, excluding restructuring charges and special items (non-GAAP) H/P 0.46 0.41 0.42 0.40 0.40 0.87 0.79 QUARTERLY TRENDS FOR THE YEAR ENDED DECEMBER FOR THE SIX MONTHS ENDED JUNE 30, |
 Non-GAAP financial measures and reconciliations
37 (Excluding restructuring charges and special items) $s in millions, except per share data 2Q16 1Q16 4Q15 3Q15 2Q15 2016 2015 Pro forma Basel III fully phased-in common equity tier 1 capital ratio 1 : Common equity tier 1 (regulatory) $13,768 $13,570 $13,389 $13,200 $13,270 Less: Change in DTA and other threshold deductions (GAAP) 1 1 2 2 3 Pro forma Basel III fully phased-in common equity tier 1 (non-GAAP)
Q $13,767 $13,569 $13,387 $13,198 $13,267 Risk-weighted assets (regulatory general risk weight approach) $119,492 $116,591 $114,084 $112,277 $112,131 Add: Net change in credit and other risk-weighted assets (regulatory)
228 232 244 243 247 Basel III standardized approach risk-weighted assets (non-GAAP) R $119,720 $116,823 $114,328 $112,520 $112,378 Pro forma Basel III fully phased-in common equity tier 1 capital ratio (non-GAAP) 1 Q/R 11.5% 11.6% 11.7% 11.7% 11.8% Salaries and employee benefits, excluding restructuring charges and special items:
Salaries and employee benefits (GAAP)
$432 $425 $402 $404 $411 $857 $830 Less: Restructuring charges and special items — — (2) — 6 — 5 Salaries and employee benefits, excluding restructuring charges and special items (non-GAAP)
$432 $425 $404 $404 $405 $857 $825 Outside services, excluding restructuring charges and special items: Outside services (GAAP) $86 $91 $104 $89 $99 $177 $178 Less: Restructuring charges and special items — — 2 — 16 — 24 Outside services, excluding restructuring charges and special items (non-GAAP)
$86 $91 $102 $89 $83 $177 $154 Occupancy, excluding restructuring charges and special items: Occupancy (GAAP) $76 $76 $74 $75 $90 $152 $170 Less: Restructuring charges and special items — — — — 15 — 17 Occupancy, excluding restructuring charges and special items (non-GAAP)
$76 $76 $74 $75 $75 $152 $153 Equipment expense, excluding restructuring charges and special items: Equipment expense (GAAP) $64 $65 $67 $62 $65 $129 $128 Less: Restructuring charges and special items — — — — — — 1 Equipment expense, excluding restructuring charges and special items (non-GAAP)
$64 $65 $67 $62 $65 $129 $127 Other operating expense, excluding restructuring charges and special items:
Other operating expense (GAAP)
$128 $115 $125 $133 $139 $243 $272 Less: Restructuring charges and special items — — — — 3 — 3 Other operating expense, excluding restructuring charges and special items (non-GAAP)
$128 $115 $125 $133 $136 $243 $269 Restructuring charges and special expense items include: Restructuring charges $0 $0 $0 $0 $25 $0 $26 Special items — — — — 15 — 24 Restructuring charges and special expense items before income tax expense $0 $0 $0 $0 $40 $0 $50 2Q16 vs 1Q16 2Q16 vs 2Q15 $ Change $ Change Noninterest income: Noninterest income (GAAP) $355 $360 ($5) (1)% Add: Reward accounting change 10 — 10 NM Noninterest income, before accounting change (non-GAAP) $365 $360 $5 1% 1) Basel III ratios assume certain definitions impacting qualifying Basel III capital, which otherwise will phase in through 2019, are
fully phased-in. Ratios also reflect the required US Standardized methodology for calculating RWAs, effective January 1, 2015. QUARTERLY TRENDS FOR THE SIX MONTHS ENDED JUNE 30, |
 Non-GAAP financial measures and reconciliations
38 (Excluding restructuring charges and special items) $s in millions 2Q16 vs 1Q16 2Q16 vs 2Q15 2Q16 1Q16 4Q15 3Q15 2Q15 2016 2015 % Change % Change Operating leverage: Total revenue (GAAP) A $1,278 $1,234 $1,200 $2,512 $2,383 3.6% 6.5% Noninterest expense (GAAP) C $827 $811 $841 $1,638 $1,651 2.0% (1.7)% Operating leverage (non-GAAP) 1.6% 8.2% Operating leverage, excluding restructuring charges and special items: Total revenue, excluding restructuring charges and special items (non-GAAP)
B $1,278 $1,234 $1,200 $2,512 $2,383 3.6% 6.5% Less: Noninterest expense, excluding restructuring charges and special items (non-GAAP)
D $827 $811 $801 $1,638 $1,601 2.0% 3.2% Operating leverage, excluding restructuring charges and special items: (non-GAAP)
1.6% 3.3% 1H16 vs 1H15 2H15 vs 2H14 1H15 vs 1H14 1H14 2H14 1H15 2H15 1H16 % Change % Change % Change Operating leverage: Total revenue (GAAP) $2,639 $2,340 $2,383 $2,441 $2,512 5.4% 4.3% (9.7)% Noninterest expense (GAAP) $1,758 $1,634 $1,651 $1,608 $1,638 (0.8)% (1.6)% (6.1)% Operating leverage (non-GAAP) 6.2% 5.9% (3.6)% Operating leverage, excluding restructuring charges and special items: Total revenue, excluding restructuring charges and special items (non-GAAP)
$2,351 $2,340 $2,383 $2,441 $2,512 5.4% 4.3% 1.4% Less: Noninterest expense, excluding restructuring charges and special items (non-GAAP)
$1,643 $1,579 $1,601 $1,608 $1,638 2.3% 1.8% (2.6)% Operating leverage, excluding restructuring charges and special items: (non-GAAP)
3.1% 2.5% 3.9% HALF YEAR TRENDS QUARTERLY TRENDS FOR THE SIX MONTHS ENDED JUNE 30, |
 $55,116 $45,304 $31,962 $132,382 $54,065 $43,835 $31,987 $129,887 Return on average total tangible assets (non-GAAP) A/D 0.65% 1.39% NM 0.72% 0.52% 1.18% NM 0.68% 0.49% 1.37% NM 0.67% Efficiency ratio: Noninterest expense (GAAP) E $632 $186 $9 $827 $616 $187 $8 $811 $624 $180 $6 $810 Net interest income (GAAP) 602 314 7 923 581 300 23 904 565 301 4 870 Noninterest income (GAAP) 219 122 14 355 208 99 23 330 226 107 29 362 Total revenue F $821 $436 $21 $1,278 $789 $399 $46 $1,234 $791 $408 $33 $1,232 Efficiency ratio (non-GAAP) E/F 76.98% 42.88% NM 64.71% 78.08% 46.74% NM 65.66% 78.85% 44.02% NM 65.76% Consumer Banking Commercial Banking Other Consolidated Consumer Banking Commercial Banking Other Consolidated Net income available to common stockholders: Net income (loss) (GAAP) A $68 $145 $7 $220 $66 $135 ($11) $190 Less: Preferred stock dividends — — 7 7 — — — — Net income available to common stockholders B $68 $145 $— $213 $66 $135 ($11) $190 Return on average tangible common equity: Average common equity (GAAP) $4,791 $4,722 $9,748 $19,261 $4,681 $4,625 $10,085 $19,391 Less: Average goodwill (GAAP) — — 6,876 6,876 — — 6,876 6,876 Average other intangibles (GAAP) — — 4 4 — — 5 5 Add: Average deferred tax liabilities related to goodwill (GAAP) — — 453 453 — — 437 437 Average tangible common equity (non-GAAP) C $4,791 $4,722 $3,321 $12,834 $4,681 $4,625 $3,641 $12,947 Return on average tangible common equity (non-GAAP): B/C 5.67% 12.24% NM 6.60% 5.66% 11.69% NM 5.90% Return on average total tangible assets: Average total assets (GAAP) $53,206 $43,113 $38,784 $135,103 $52,489 $42,617 $40,415 $135,521 Non-GAAP financial measures and reconciliations – segments 39 $s in millions Consumer Banking Commercial Banking Other Consolidated Consumer Banking Commercial Banking Other Consolidated Consumer Banking Commercial Banking Other Consolidated Net income available to common stockholders: Net income (loss) (GAAP) A $90 $164 ($11) $243 $71 $133 $19 $223 $67 $152 $2 $221 Less: Preferred stock dividends — — — — — — 7 7 — — — — Net income available to common stockholders B $90 $164 ($11) $243 $71 $133 $12 $216 $67 $152 $2 $221 Return on average tangible common equity: Average common equity (GAAP) $5,110 $5,040 $9,618 $19,768 $5,089 $4,790 $9,688 $19,567 $4,831 $4,787 $9,741 $19,359 Less: Average goodwill (GAAP) — — 6,876 6,876 — — 6,876 6,876 — — 6,876 6,876 Average other intangibles (GAAP) — — 2 2 — — 3 3 — — 3 3 Add: Average deferred tax liabilities related to goodwill (GAAP) — — 496 496 — — 481 481 — — 468 468 Average tangible common equity (non-GAAP) C $5,110 $5,040 $3,236 $13,386 $5,089 $4,790 $3,290 $13,169 $4,831 $4,787 $3,330 $12,948 Return on average tangible common equity (non-GAAP): B/C 7.09% 13.04% NM 7.30% 5.59% 11.19% NM 6.61% 5.50% 12.57% NM 6.75% Return on average total tangible assets: Average total assets (GAAP) $55,660 $47,388 $39,131 $142,179 $55,116 $45,304 $38,360 $138,780 $54,065 $43,835 $38,398 $136,298 Less: Average goodwill (GAAP) — — 6,876 6,876 — — 6,876 6,876 — — 6,876 6,876 Average other intangibles (GAAP) — — 2 2 — — 3 3 — — 3 3 Add: Average deferred tax liabilities related to goodwill (GAAP) — — 496 496 — — 481 481 — — 468 468 Average tangible assets (non-GAAP) D $55,660 $47,388 $32,749 $135,797 Less: Average goodwill (GAAP) — — 6,876 6,876 — — 6,876 6,876 Average other intangibles (GAAP) — — 4 4 — — 5 5 Add: Average deferred tax liabilities related to goodwill (GAAP) — — 453 453 — — 437 437 Average tangible assets (non-GAAP) D $53,206 $43,113 $32,357 $128,676 $52,489 $42,617 $33,971 $129,077 Return on average total tangible assets (non-GAAP) A/D 0.51% 1.34% NM 0.68% 0.51% 1.27% NM 0.59% Efficiency ratio: Noninterest expense (GAAP) E $623 $175 $— $798 $613 $181 $47 $841 Net interest income (GAAP) 556 299 1 856 544 286 10 840 Noninterest income (GAAP) 235 100 18 353 230 108 22 360 Total revenue F $791 $399 $19 $1,209 $774 $394 $32 $1,200 Efficiency ratio (non-GAAP) E/F 78.72% 43.75% NM 66.02% 79.25% 46.07% NM 70.02% 2015 2015 THREE MONTHS ENDED JUNE 30, THREE MONTHS ENDED MARCH 31, THREE MONTHS ENDED SEPTEMBER 30, THREE MONTHS ENDED JUNE 30, THREE MONTHS ENDED DECEMBER 31, 2016 2016 2015 |
 Non-GAAP financial measures and reconciliations – segments 40 $s in millions Consumer Banking Commercial Banking Other Consolidated Consumer Banking Commercial Banking Other Consolidated Net income available to common stockholders: Net income (loss) (GAAP) A $161 $297 $8 $466 $127 $282 ($10) $399 Less: Preferred stock dividends — — — — — — — — Net income available to common stockholders B $161 $297 $8 $466 $127 $282 ($10) $399 Return on average tangible common equity: Average common equity (GAAP) $5,099 $4,915 $9,653 $19,667 $4,665 $4,576 $10,158 $19,399 Less: Average goodwill (GAAP) — — 6,876 6,876 — — 6,876 6,876 Average other intangibles (GAAP) — — 2 2 — — 5 5 Add: Average deferred tax liabilities related to goodwill (GAAP) — — 488 488 — — 430 430 Average tangible common equity (non-GAAP) C $5,099 $4,915 $3,263 $13,277 $4,665 $4,576 $3,707 $12,948 Return on average tangible common equity (non-GAAP) B/C 6.34% 12.14% NM 6.96% 5.48% 12.41% NM 6.21% Return on average total tangible assets: Average total assets (GAAP) $55,388 $46,346 $38,745 $140,479 $52,048 $42,114 $40,267 $134,429 Less: Average goodwill (GAAP) — — 6,876 6,876 — — 6,876 6,876 Average other intangibles (GAAP) — — 2 2 — — 5 5 Add: Average deferred tax liabilities related to goodwill (GAAP) — — 488 488 — — 430 430 Average tangible assets (non-GAAP) D $55,388 $46,346 $32,355 $134,089 $52,048 $42,114 $33,816 $127,978 Return on average total tangible assets (non-GAAP) A/D 0.58% 1.29% NM 0.70% 0.49% 1.35% NM 0.63% Efficiency ratio: Noninterest expense (GAAP) E $1,248 $373 $17 $1,638 $1,209 $354 $88 $1,651 Net interest income (GAAP) 1,183 614 30 1,827 1,077 562 37 1,676 Noninterest income (GAAP) 427 221 37 685 449 208 50 707 Total revenue F $1,610 $835 $67 $2,512 $1,526 $770 $87 $2,383 Efficiency ratio (non-GAAP) E/F 77.52% 44.73% NM 65.18% 79.25% 46.04% NM 69.27% FOR SIX MONTHS ENDED JUNE 30, 2016 2015 |
 41 |