Attached files
| file | filename |
|---|---|
| EX-99.1 - EXHIBIT 99.1 - ALLIANCE DATA SYSTEMS CORP | exhibit_99-1.htm |
| 8-K - FORM 8-K - ALLIANCE DATA SYSTEMS CORP | form_8k.htm |
Exhibit 99.2

Alliance Data NYSE: ADS Q2, 2016 ResultsJuly 21, 2016
Agenda Speakers: Ed Heffernan President and CEO Charles Horn EVP and CFO Melisa Miller President of Alliance Data Card Services Second Quarter Consolidated ResultsSegment ResultsSecond Quarter and Full Year Scorecard2016 Guidance 1

Second Quarter 2016 Consolidated Results(MM, except per share) Quarter Ended June 30, 2016 2015 % Change Revenue $ 1,749 $ 1,501 +17% Net income $ 141 $ 130 +8% EPS 1 $ 1.24 $ 2.11 -41% Core EPS $ 3.68 $ 3.32 +11% Adjusted EBITDA $ 472 $ 432 +9% Adjusted EBITDA, net $ 422 $ 393 +7% Diluted shares 59.0 62.3 -5% Double-digit revenue and core EPS growth, both exceeding guidance.Increasing annual guidance for both revenue and core EPS.FX impact abating as drag on second-quarter results was < 1 percent. Approximately 2.6 million shares repurchased year-to-date.Non-controlling interest in BrandLoyalty acquired during quarter. 2 1 After $1.14 in accretion charges related to purchase of remaining ownership in BrandLoyalty.

LoyaltyOne® (MM) AIR MILES® revenue increased 6 percent on a constant currency basis, driven by instant rewards redemptions. BrandLoyalty had a stellar quarter with revenue up 44 percent on a constant currency basis.AIR MILES reward miles issued decreased 3 percent, due to fewer promotions and an one-time conversion in the second quarter of 2015. Quarter Ended June 30, 2016 2015 % Change Revenue $ 352 $ 302 +17% Adjusted EBITDA $ 79 $ 66 +20% Non-controlling interest - -3 Adjusted EBITDA, net $ 79 $ 63 +26% Adjusted EBITDA % 23% 22% +1% Constant Currency Revenue $ 359 $ 302 +19% Adjusted EBITDA $ 82 $ 66 +23% 3 1 As of April 1, 2016, there is no longer a non-controlling interest in BrandLoyalty. 1

Epsilon® (MM) Revenue growth for digital & technology platforms accelerated during the quarter, but agency media & services continues to struggle.Several initiatives were undertaken during quarter to improve future performance.Adjusted EBITDA growth still negative but improving.A combination of accelerating revenue growth and cost controls should drive adjusted EBITDA growth in second-half. Quarter Ended June 30, 2016 2015 % Change Digital & technology platforms $ 387 $ 341 +14% Agency media & services 132 155 -15% Total revenue $ 519 $ 495 +5% Adjusted EBITDA $ 103 $ 113 -9% Adjusted EBITDA % 20% 23% -3% 4 Note: Digital & Technology Platforms includes technology, data, affiliate and CRM offerings. Agency Media & Services includes agency offerings at both Epsilon and Conversant.

Card Services (MM) Quarter Ended June 30, 2016 2015 % Change Revenue $ 886 $ 710 +25% Operating expenses 332 268 +24% Provision for loan losses 228 155 +47% Funding costs 50 36 +39% Adjusted EBITDA, net $ 276 $ 251 +10% Adjusted EBITDA, net % 31% 35% -4% 5 Revenue increased 25 percent to $886 million driven by strong growth in average receivables.Gross yields dropped 80 basis points to 25.4 percent due to mix and program changes.Better than guidance of 24.5 percent.Provision expense increased 47 percent due to receivables growth and seasoning.$56 million build in allowance for loan loss during the quarter raising reserve rate to 5.8 percent. 100 basis points higher than LTM loss rates.

Card Services (MM) Growth of 5 percent in core cardholder spending driven by an 180 basis point tender share gain. Operating expenses improved 40 bps expressed as a percentage of average card receivables.Principal loss rates consistent with our guidance provided in the first quarter. Quarter Ended June 30, Key metrics: 2016 2015 Change Credit sales $ 7,099 $ 6,009 +18% Average card receivables 1 $ 13,505 $ 10,866 +24% Total gross yield 25.4% 26.2% -0.8% Operating expenses as % of average card receivables 9.5% 9.9% -0.4% Principal loss rates 5.1% 4.5% +0.6% Delinquency rate 4.6% 4.1% +0.5% 6 1 Excludes card receivables classified as held for sale.

Consolidated$1.75 billion in revenue, +17 percent; $3.68 core EPS, +11 percentNicely ahead of guidance of 8 percent growth for both revenue and core EPS Raising annual guidanceBuyback: ~$540 million year-to-date (~2.6 million shares) out of $1.0 billon authorizationCard ServicesPortfolio +24 percent1; tender share up 180 basis points (85 percent from mature accounts)Gross yield of 25.4 percent for second quarter vs guidance of 24.5 percentLess compression than anticipated5.0 percent loss rate for full-year 2016 remains on track Q1: 5.2 percent, Q2: 5.1 percentNormal account seasoning$2 billion new vintage signed Boscov’s, Hot Topic, Forever 21, Children’s Place, Bed Bath and Beyond Second Quarter Scorecard 7 1 Excludes card receivables classified as held for sale.

Second Quarter Scorecard (cont.) EpsilonRevenue growth of 5 percent, up from minus 2 percent in the first quarterCost structure still needs some work but getting thereAdjusted EBITDA down 9 percent in the second quarter vs down 22 percent in the first quarterIndia office ramping quickly; need to eliminate duplicative costs in U.S.Conversant hits double-digit revenue growthLoyaltyOne (constant currency)BrandLoyalty revenue up 44 percentBrandLoyalty U.S. pilot successfully completedAIR MILES revenue up 6 percentAIR MILES issuance down 3 percent due to timingOverallReturn to revenue growth across all segmentsThree key “must haves” tracking in line with or better than expectations 8
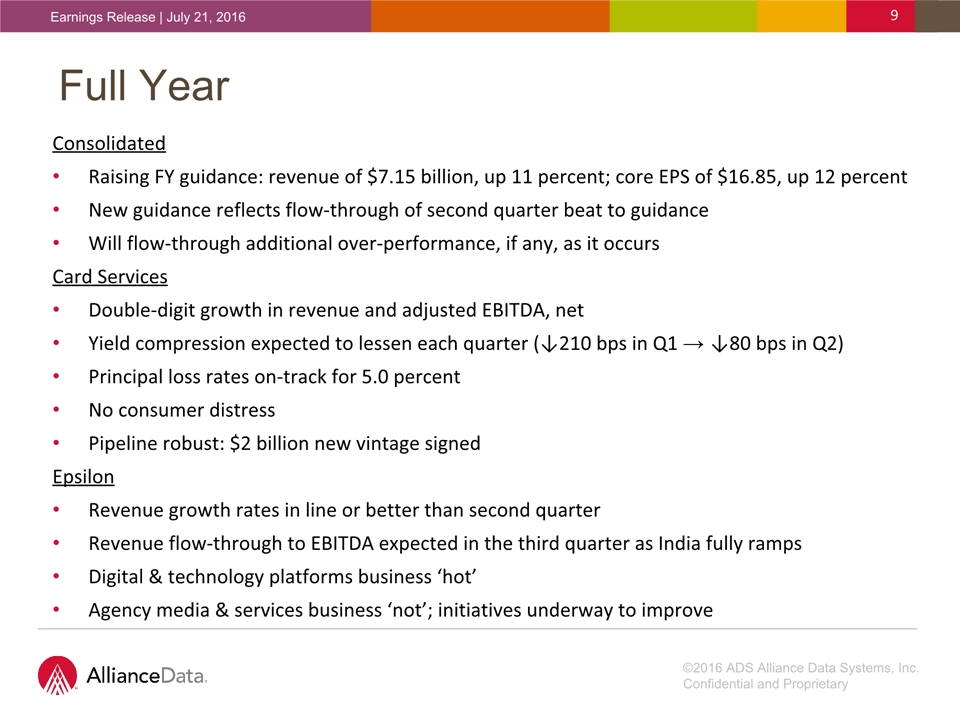
9 ConsolidatedRaising FY guidance: revenue of $7.15 billion, up 11 percent; core EPS of $16.85, up 12 percentNew guidance reflects flow-through of second quarter beat to guidanceWill flow-through additional over-performance, if any, as it occursCard Services Double-digit growth in revenue and adjusted EBITDA, netYield compression expected to lessen each quarter (↓210 bps in Q1 → ↓80 bps in Q2)Principal loss rates on-track for 5.0 percentNo consumer distressPipeline robust: $2 billion new vintage signedEpsilon Revenue growth rates in line or better than second quarterRevenue flow-through to EBITDA expected in the third quarter as India fully rampsDigital & technology platforms business ‘hot’Agency media & services business ‘not’; initiatives underway to improve Full Year

Full Year (cont.) LoyaltyOneMid single-digit growth in revenue for AIR MILES on a constant currency basisAIR MILES issued expected to increase 4 percentStrong double-digit revenue growth for BrandLoyalty on a constant currency basisOverall 2007-2015: CAGR of +15 percent and +18 percent for revenue & core EPS, respectively2016: raising guidance to +11 percent and +12 percent for revenue & core EPS, respectivelyAbility to grow core EPS by double-digits despite 10 point hit to core EPS from reserve build 10

Forward-Looking StatementsThis presentation contains forward-looking statements within the meaning of Section 27A of the Securities Act of 1933 and Section 21E of the Securities Exchange Act of 1934. Forward-looking statements give our expectations or forecasts of future events and can generally be identified by the use of words such as “believe,” “expect,” “anticipate,” “estimate,” “intend,” “project,” “plan,” “likely,” “may,” “should” or other words or phrases of similar import. Similarly, statements that describe our business strategy, outlook, objectives, plans, intentions or goals also are forward-looking statements. Examples of forward-looking statements include, but are not limited to, statements we make regarding our expected operating results, future economic conditions including currency exchange rates, and the guidance we give with respect to our anticipated financial performance. We believe that our expectations are based on reasonable assumptions. Forward-looking statements, however, are subject to a number of risks and uncertainties that could cause actual results to differ materially from the projections, anticipated results or other expectations expressed in this presentation, and no assurances can be given that our expectations will prove to have been correct. These risks and uncertainties include, but are not limited to, factors set forth in the Risk Factors section in our Annual Report on Form 10-K for the most recently ended fiscal year, which may be updated in Item 1A of, or elsewhere in, our Quarterly Reports on Form 10-Q filed for periods subsequent to such Form 10-K. Our forward-looking statements speak only as of the date made, and we undertake no obligation, other than as required by applicable law, to update or revise any forward-looking statements, whether as a result of new information, subsequent events, anticipated or unanticipated circumstances or otherwise. 11
Financial MeasuresIn addition to the results presented in accordance with generally accepted accounting principles, or GAAP, the Company may present financial measures that are non-GAAP measures, such as constant currency financial measures, adjusted EBITDA, adjusted EBITDA margin, adjusted EBITDA, net of funding costs and non-controlling interest, core earnings and core earnings per diluted share (core EPS). The Company calculates constant currency by converting our current period local currency financial results using the prior period exchange rates. The Company believes that these non-GAAP financial measures, viewed in addition to and not in lieu of the Company’s reported GAAP results, provide useful information to investors regarding the Company’s performance and overall results of operations. Constant currency excludes the impact of fluctuations in foreign exchange rates. These metrics are an integral part of the Company’s internal reporting to measure the performance of reportable segments and the overall effectiveness of senior management. Reconciliations to comparable GAAP financial measures are available in the accompanying schedules and on the Company’s website. The financial measures presented are consistent with the Company’s historical financial reporting practices. Core earnings and core earnings per diluted share represent performance measures and are not intended to represent liquidity measures. The non-GAAP financial measures presented herein may not be comparable to similarly titled measures presented by other companies, and are not identical to corresponding measures used in other various agreements or public filings. 12

Q & A