Attached files
| file | filename |
|---|---|
| EX-99.2 - EX-99.2 - INTERNATIONAL BUSINESS MACHINES CORP | a16-14976_1ex99d2.htm |
| EX-99.1 - EX-99.1 - INTERNATIONAL BUSINESS MACHINES CORP | a16-14976_1ex99d1.htm |
| 8-K - 8-K - INTERNATIONAL BUSINESS MACHINES CORP | a16-14976_18k.htm |
Exhibit 99.3
IBM 2Q 2016 Earnings July 18, 2016 ibm.com/investor

2 Certain comments made in this presentation may be characterized as forward looking under the Private Securities Litigation Reform Act of 1995. Forward-looking statements are based on the company’s current assumptions regarding future business and financial performance. Those statements by their nature address matters that are uncertain to different degrees. Those statements involve a number of factors that could cause actual results to differ materially. Additional information concerning these factors is contained in the Company’s filings with the SEC. Copies are available from the SEC, from the IBM web site, or from IBM Investor Relations. Any forward-looking statement made during this presentation speaks only as of the date on which it is made. The company assumes no obligation to update or revise any forward-looking statements. These charts and the associated remarks and comments are integrally related, and are intended to be presented and understood together. In an effort to provide additional and useful information regarding the company’s financial results and other financial information as determined by generally accepted accounting principles (GAAP), the company also discusses, in its earnings press release and earning presentation materials, certain non-GAAP information including “operating earnings” and other “operating” financial measures. The rationale for management’s use of this non-GAAP information is included as Exhibit 99.2 to the company’s Form 8-K submitted to the SEC on July 18, 2016. The reconciliation of non-GAAP information to GAAP is included on the slides entitled “Non-GAAP Supplemental Materials” in this presentation. For other related information please visit the Company’s investor relations web site at: http://www.ibm.com/investor/events/earnings/2q16.html Forward Looking Statements and Non-GAAP Information
3 Overview Strong growth in Strategic Imperatives Strategic Imperatives revenue of $31B over the last 12 months, now represents 38% of the business Growth led by Cloud Continue to shift business and move to new spaces Invest and partner to enhance Cognitive Solutions and Cloud Platform capabilities Overall first half results consistent with expectations Continue to expect at least $13.50 of Operating EPS for the year 2Q16 $20.2B $2.95 $13.1B Revenue Operating EPS Free Cash Flow Last 12 Months
4 Becoming a Cognitive Solutions & Cloud Platform Company Revenue growth rates @CC, $ in billions Overlap in Strategic Imperatives revenue primarily reflects solutions delivered via cloud 2Q16 Progress Broadening the reach of Watson platform, Watson Health, Watson IoT with new solutions and partnerships Announced Watson for Cyber Security Extended cloud innovations available on Bluemix and expanded partnerships to accelerate adoption of enterprise hybrid clouds Recent breakthroughs in cloud-enabled quantum computing and Blockchain solutions Continued to deliver innovation in core business Strategic Imperatives Revenue 2Q16 Yr/Yr Total $8.3 12% Analytics $4.9 4% Cloud $3.4 30% aaS-exit annual run rate $6.7 50% Mobile $1.0 43% Security $0.5 18% Social $0.3 (15%) Last $31B 38% 12 months Strategic Imperatives IBM Revenue Revenue
5 Key Financial Metrics Revenue growth rates @CC, $ in billions except for EPS B/(W) Gross margin reflects higher level of investments and mix within segments Expense dynamics also include yr/yr impact from investments, currency hedges, prior year charges and higher IP Income P&L Highlights 2Q16 Yr/Yr Revenue $20.2 (2.6%) Expense $6.4 (6.6%) PTI - Operating $3.5 (24%) NI - Operating $2.8 (25%) EPS – Operating $2.95 (23%) P&L Ratios (Operating) GP Margin 49.0% (1.9 pts) Expense E/R 31.7% (2.8 pts) PTI Margin 17.3% (4.7 pts) Tax Rate 19.0% (1.8 pts) NI Margin 14.0% (4.2 pts) Last 12 Cash Highlights 2Q16 Months Free Cash Flow (excl. GF Receivables) $2.1 $13.1 Share Repurchase (Gross) $0.8 $4.1 Dividends $1.3 $5.1 Cash Balance @ June 30 $10.6
6 Cognitive Solutions Segment Sequential improvement in both Solutions and Transactions Processing software revenue Solutions software growth continued to be led by analytics and security Continued strong performance in SaaS Broadening the reach of Watson with new services, products and partnerships Highlights Revenue growth rates @CC, $ in billions Segment Results 2Q16 Yr/Yr Revenue (External) $4.7 4% Gross Margin (External) 82.2% (3.6 pts) PTI $1.5 (20%) PTI Margin 27.5% (8.6 pts) Segment Revenue Elements Transaction Processing Software (1%) Yr/Yr Solutions Software 6% Yr/Yr Strategic Imperatives Revenue within Cognitive Solutions 2Q16 Yr/Yr Strategic Imperatives $3.0 9% Cloud $0.5 55% as-a-Service annual run rate $1.5
7 Global Business Services Segment Growth in Strategic Imperatives offset by declines in traditional consulting areas Engineered shift to digital practices with strong growth in cloud, mobility, and security Margin declines reflect investment in digital and productivity during shift Highlights Revenue growth rates @CC, $ in billions Segment Revenue Elements Application Management (1%) Yr/Yr Global Process Services (3%) Yr/Yr Consulting (5%) Yr/Yr Strategic Imperatives Revenue within Global Business Services 2Q16 Yr/Yr Strategic Imperatives $2.3 13% Cloud $0.7 60% as-a-Service annual run rate $0.6 Segment Results 2Q16 Yr/Yr Revenue (External) $4.3 (3%) Gross Margin (External) 26.3% (1.1 pts) PTI $0.5 (26%) PTI Margin 10.9% (3.5 pts)
8 Technology Services and Cloud Platforms Segment Continued growth in Infrastructure Services and hybrid cloud Ramp in as-a-Service, shifting from systems integration to services integration Margins impacted by business mix and investment in cloud platforms Highlights Revenue growth rates @CC, $ in billions Strategic Imperatives Revenue within Technology Svcs & Cloud Platforms 2Q16 Yr/Yr Strategic Imperatives $2.0 35% Cloud $1.4 43% as-a-Service annual run rate $4.7 Segment Results 2Q16 Yr/Yr Revenue (External) $8.9 Flat Gross Margin (External) 41.6% (0.6 pts) PTI $1.3 (10%) PTI Margin 14.2% (1.4 pts) Segment Revenue Elements Integration Software (8%) Yr/Yr Infrastructure Services +2% Yr/Yr Technical Support Services (2%) Yr/Yr
9 Systems Segment zSystems performance continues to reflect product cycle Gross Margin expansion in both zSystems and Power Executing on Linux on Power and OpenPower strategy Storage value continues to shift to software Highlights Revenue growth rates @CC, $ in billions Segment Revenue Elements Systems Hardware (28)% Yr/Yr Operating Systems Software (4%) Yr/Yr Strategic Imperatives Revenue within Systems 2Q16 Yr/Yr Strategic Imperatives $0.9 (14%) Cloud $0.8 (11%) Segment Results 2Q16 Yr/Yr Revenue (External) $2.0 (23%) Gross Margin (External) 56.5% 0.1 pts PTI $0.2 (58%) PTI Margin 10.6% (9.1 pts)
10 Software Revenue Software Revenue Growth Trends Software Revenue Composition Revenue mix represents last 12 months Revenue growth represents 2Q16 Yr/Yr +7% +1% Cognitive Solutions Annuity +9% Yr/Yr Transactional (15%) Yr/Yr% Operating Systems Annuity (4%) Yr/Yr% Integration Software Annuity +2% Yr/Yr% Revenue growth rates @CC (8%) (6%) (4%) (2%) 0% 2% 4% 6% 8% 1Q14 2Q14 3Q14 4Q14 1Q15 2Q15 3Q15 4Q15 1Q16 2Q16 Total Software Annuity
11 Cash Flow and Balance Sheet Highlights Free Cash Flow flat yr/yr for the first half Free Cash Flow realization over 100% on a trailing twelve month basis 11 acquisitions in the first half Positioned to support business over the longer term $ in billions *Excludes Global Financing receivables; **Prior year reclassified for the adoption of the FASB guidance (Debt issuance cost) Balance Sheet Jun 16 Dec 15 **Jun 15 Cash & Marketable Securities $10.6 $8.2 $8.8 Total Debt $44.5 $39.9 $38.6 Global Financing Debt $26.5 $27.2 $26.1 Global Financing Leverage 7.3 7.3 7.0 Non-GF Debt $18.0 $12.7 $12.5 Non-GF Debt/Capital 59% 54% 55% Last 12 Cash Flow 2Q16 Yr/Yr Months Net Cash from Operations* $3.1 ($1.2) $17.0 Free Cash Flow* $2.1 ($1.2) $13.1 Selected Uses of Cash Net Capital Expenditures $1.0 $3.9 Acquisitions $2.8 $8.0 Dividends/Share Repurchase $2.2 $9.2
12 2016 EPS Drivers Improved EPS trajectory in second half Maintain full year 2016 expectations At least $13.50 of Operating EPS Free Cash Flow at high end of range 1H16 2H16 EPS YTY Drivers Results Expectations 1Q Charges and Savings Significant impact Contribution Mainframe compare Mid single digit headwind Nominal impact Cognitive/Cloud Organic Investments Mid single digit headwind Lower impact Acquisitions (closed) Low single digit headwind Lower impact Software Mix/as-a-Service ramp Nominal impact Modest contribution Currency Mid single digit headwind Lower impact Tax Significant discrete benefit Discretes unknown
13 Summary IBM uniquely positioned to deliver value to clients cognitive business hybrid cloud environments strong industry dimension Moving to new spaces and creating new markets Investing to add capabilities and deliver innovation
14 ibm.com/investor
15 Supplemental Materials Currency – Impact on Revenue Growth Geographic Revenue Segment Revenue & Gross Profit Margin Additional Revenue & Backlog Information Expense Summary Global Financing Portfolio Balance Sheet Summary Cash Flow Summary Cash Flow (ASC 230) Non-GAAP Supplemental Materials Some columns and rows in these materials, including the supplemental exhibits, may not add due to rounding
16 Currency – Impact on Revenue Growth Supplemental Materials 7/15/2016 Quarterly Averages per US $ 1Q16 Yr/Yr 2Q16 Yr/Yr Spot 3Q16 4Q16 FY16 Euro 0.91 (2%) 0.89 2% 0.90 0% 1% 0% Pound 0.70 (6%) 0.70 (7%) 0.76 (17%) (15%) (11%) Yen 115 3% 108 11% 106 13% 13% 10% IBM Revenue Impact (2.6 pts) (0.2 pts) 0-1 pts ~1 pts ~0 pts (US$B) Yr/Yr Revenue As Reported $20.2 (3%) Currency Impact ($0.0) -0.2Pts Revenue @ CC (3%) Yr/Yr @ 7/15/16 Spot
17 Geographic Revenue Americas reflects sequential improvement in the US (-2% yr/yr), Canada and LA EMEA weakened, driven by Germany and Switzerland; good growth in Middle East/Africa Asia Pacific performance mixed with Japan flat BRIC countries returned to growth, with sequential improvement in each; total growth markets (-3% yr/yr) Revenue growth rates @CC, $ in billions Supplemental Materials Geography Revenue 2Q16 Yr/Yr Americas $9.5 (2%) Europe/ME/Africa $6.3 (4%) Asia Pacific $4.4 (2%)
18 Segment Revenue & Gross Profit Revenue growth rates @CC, $ in billions Supplemental Materials Segment Revenue & Profit Metrics-2Q16 Revenue Yr/Yr GP% GP Yr/Yr Cognitive Solutions $4.7 4% 82.2% (3.6) pts Global Business Services $4.3 (3%) 26.3% (1.1) pts Cognitive Solutions & Industry Services $8.9 1% 55.5% (1.6) pts Technology Services & Cloud Platforms $8.9 Flat 41.6% (0.6) pts Global Technology Services $7.8 1% 35.4% 0.1 pts Integration Software $1.1 (8%) 85.3% (1.2) pts Systems $2.0 (23%) 56.5% 0.1 pts Systems Hardware $1.5 (28%) 46.1% (2.1) pts Operating Systems Software $0.5 (4%) 90.1% (1.2) pts Global Financing $0.4 (10%) 38.7% (6.0) pts
19 Additional Revenue & Backlog Information Growth rates @CC, $ in billions, Actual backlog calculated using June 30 currency spot rates *Total Software = Cognitive Solutions + Integration Software + Operating Systems Software **Prior year reclassified to reflect current segment structure. Supplemental Materials 2Q16 Yr/Yr Services Revenue Global Technology Services $7.8 1% Infrastructure Services $5.9 2% Technical Support Services $1.8 (2%) Global Business Services $4.3 (3%) Consulting $1.9 (5%) Global Process Services $0.3 (3%) Application Management $2.0 (1%) Signings** $13.1 16% Services Backlog $124 Flat Currency Impact Year to Year ($1) Currency Impact Quarter to Quarter ($0) 2Q16 Yr/Yr Software Revenue* $6.2 1% Cognitive Solutions $4.7 4% Solutions Software $3.2 6% Transaction Processing Software $1.4 (1%) Integration Software $1.1 (8%) Operating Systems Software $0.5 (4%) Hardware Revenue $1.5 (28%) z Systems (40%) Power (24%) Storage (13%)
20 Expense Summary Supplemental Materials $ in billions *includes acquisitions made in the last twelve months, net of non-operating acquisition-related charges B/(W) Expense Metrics 2Q16 Yr/Yr Currency Acq. * Base SG&A – Operating $5.1 (1%) 0 pts (4 pts) 2 pts RD&E – Operating $1.5 (13%) 1 pts (8 pts) (6 pts) IP and Development Income ($0.4) 184% Other (Income)/Expense $0.0 N/M Interest Expense $0.2 (45%) Operating Expense & Other Income $6.4 (7%) (4 pts) (5 pts) 2 pts
21 Global Financing Portfolio 2Q16 – $25.4B Net External Receivables Non-Investment Grade 48% Investment Grade 52% Global Financing Metrics 2Q16 1Q16 2Q15 Identified Loss Rate 2.1% 2.0% 2.1% Anticipated Loss Rate 0.5% 0.6% 0.3% Reserve Coverage 2.6% 2.6% 2.4% Client Days Delinquent Outstanding 3.5 4.2 3.8 Commercial A/R > 30 days $25M $25M $45M Supplemental Materials
22 Balance Sheet Summary * Prior year reclassified for the adoption of the FASB guidance (Debt issuance cost and Deferred Tax classification) **includes eliminations of inter-company activity Supplemental Materials $ in billions Jun 16 Dec 15 Jun 15* Cash & Marketable Securities $10.6 $8.2 $8.8 Non-GF Assets ** $75.3 $67.7 $70.4 Global Financing Assets $32.2 $34.6 $33.3 Total Assets $118.1 $110.5 $112.5 Other Liabilities $57.6 $56.2 $60.0 Non-GF Debt ** $18.0 $12.7 $12.5 Global Financing Debt $26.5 $27.2 $26.1 Total Debt $44.5 $39.9 $38.6 Total Liabilities $102.2 $96.1 $98.6 Equity $15.9 $14.4 $13.8 Non-GF Debt / Capital 59% 54% 55% Global Financing Leverage 7.3 7.3 7.0
23 Cash Flow Summary Supplemental Materials $ in billions B/(W) YTD B/(W) 2Q16 Yr/Yr 2016 Yr/Yr Net Cash from Operations $3.4 ($0.4) $9.1 $1.6 Less: Global Financing Receivables $0.3 $0.7 $2.7 $1.5 Net Cash from Operations (excluding GF Receivables) $3.1 ($1.2) $6.4 $0.1 Net Capital Expenditures ($1.0) ($0.1) ($1.9) ($0.1) Free Cash Flow (excluding GF Receivables) $2.1 ($1.2) $4.4 ($0.0) Acquisitions ($2.8) ($2.3) ($5.4) ($4.7) Divestitures ($0.0) ($0.1) $0.0 ($0.0) Dividends ($1.3) ($0.1) ($2.6) ($0.2) Share Repurchases (Gross) ($0.8) $0.3 ($1.8) $0.5 Non-GF Debt ($0.8) ($0.8) $5.1 $4.7 Other (includes GF A/R & GF Debt) ($0.6) ($0.0) $2.7 $1.9 Change in Cash & Marketable Securities ($4.3) ($4.2) $2.4 $2.1
24 Cash Flow (ASC 230) Supplemental Materials $ in billions QTD QTD YTD YTD 2Q16 2Q15 2016 2015 Net Income from Operations $2.5 $3.4 $4.5 $5.8 Depreciation / Amortization of Intangibles $1.1 $1.0 2.1 1.9 Stock-based Compensation $0.1 $0.1 0.3 0.3 Working Capital / Other ($0.6) ($0.3) (0.5) (1.7) Global Financing A/R $0.3 ($0.4) 2.7 1.2 Net Cash provided by Operating Activities $3.4 $3.9 9.1 7.5 Capital Expenditures, net of payments & proceeds ($1.0) ($0.9) (1.9) (1.8) Divestitures, net of cash transferred ($0.0) $0.1 0.0 0.1 Acquisitions, net of cash acquired ($2.8) ($0.6) (5.4) (0.7) Marketable Securities / Other Investments, net ($0.7) ($0.5) 0.8 1.1 Net Cash used in Investing Activities ($4.5) ($1.9) (6.5) (1.4) Debt, net of payments & proceeds ($1.0) ($0.2) 3.9 (1.5) Dividends ($1.3) ($1.3) (2.6) (2.4) Common Stock Repurchases ($0.8) ($1.1) (1.8) (2.3) Common Stock Transactions - Other $0.1 $0.1 0.1 0.2 Net Cash used in Financing Activities ($3.2) ($2.6) (0.3) (6.0) Effect of Exchange Rate changes on Cash ($0.1) $0.2 0.1 (0.2) Net Change in Cash & Cash Equivalents ($4.3) ($0.4) 2.3 (0.1)
Reconciliation of Operating Earnings Per Share 25 Non-GAAP Supplemental Materials * Includes acquisitions through June 30, 2016 The above reconciles the Non-GAAP financial information contained in the “Overview“ and “2016 EPS Drivers” discussions in the company’s earnings presentation. See Exhibit 99.2 included in the Company’s Form 8-K dated July 18, 2016 for additional information on the use of these Non-GAAP financial measures. Supplemental Materials 2016 EPS Guidance Expectations IBM GAAP EPS at least $12.23 IBM Operating EPS (Non-GAAP) at least $13.50 Adjustments Acquisition Related Charges* $0.84 Non-Operating Retirement-Related Items $0.43
Reconciliation of Revenue Growth-2Q 2016 26 Non-GAAP Supplemental Materials The above reconciles the Non-GAAP financial information contained in the “Geographic Revenue” discussions in the company’s earnings presentation. See Exhibit 99.2 included in the Company’s Form 8-K dated July 18, 2016 for additional information on the use of these Non-GAAP financial measures. Supplemental Materials GAAP @CC Americas (3%) (2%) Europe/ME/Africa (4%) (4%) Asia Pacific 1% (2%) U.S. (2%) (2%) Japan 13% 0% Growth Markets (8%) (3%) 2Q16 Yr/Yr
Reconciliation of Revenue Growth-2Q 2016 27 Non-GAAP Supplemental Materials The above reconciles the Non-GAAP financial information contained in the “Becoming a Cognitive Solutions & Cloud Platform Company” discussions in the company’s earnings presentation. See Exhibit 99.2 included in the Company’s Form 8-K dated July 18, 2016 for additional information on the use of these Non-GAAP financial measures. Supplemental Materials GAAP @CC Strategic Imperatives 12% 12% Analytics 5% 4% Cloud 30% 30% Mobile 43% 43% Security 18% 18% Social (15%) (15%) 2Q16 Yr/Yr
Reconciliation of Revenue Growth-2Q 2016 28 Non-GAAP Supplemental Materials The above reconciles the Non-GAAP financial information contained in the “Segment Revenue & Gross Profit”, “Additional Revenue & Backlog Information”, “Cognitive Solutions Segment”, “Global Business Services Segment”, “Technology Services & Cloud Platforms Segment” ,“Systems Segment” and “Software Revenue” discussions in the company’s earnings presentation. See Exhibit 99.2 included in the Company’s Form 8-K dated July 18, 2016 for additional information on the use of these Non-GAAP financial measures. Supplemental Materials GAAP @CC GAAP @CC Cognitive Solutions 4% 4% Tech Svcs & Cloud Platforms Flat Flat Solutions Software 6% 6% Global Technology Services 1% 1% Transaction Processing Software (1%) (1%) Infrastructure Services 2% 2% Strategic Imperatives 9% 9% Technical Support Services (3%) (2%) Cloud 54% 55% Integration Software (8%) (8%) Global Business Services (2%) (3%) Strategic Imperatives 35% 35% Consulting (4%) (5%) Cloud 43% 43% Global Processing Services (4%) (3%) Systems (23%) (23%) Application Management (0%) (1%) Systems Hardware (28%) (28%) Strategic Imperatives 14% 13% z Systems (40%) (40%) Cloud 63% 60% Power (24%) (24%) Storage (13%) (13%) Cognitive Solutions & Industry Svcs 1% 1% Operating Systems Software (5%) (4%) Strategic Imperatives (14%) (14%) Cloud (11%) (11%) Global Financing (11%) (10%) Total Software 1% 1% 2Q16 Yr/Yr 2Q16 Yr/Yr
Reconciliation of Expense Summary-2Q 2016 29 Non-GAAP Supplemental Materials The above reconciles the Non-GAAP financial information contained in the “Expense Summary” discussions in the company’s earnings presentation. See Exhibit 99.2 included in the Company’s Form 8-K dated July 18, 2016 for additional information on the use of these Non-GAAP financial measures. Supplemental Materials Non-GAAP Operating GAAP Adjustments (Non-GAAP) SG&A Currency 0 pts 0 pts 0 pts Acquisitions (5 pts) 2 pts (4 pts) Base 2 pts 0 pts 2 pts RD&E Currency 1 pts 0 pts 1 pts Acquisitions (8 pts) (0 pts) (8 pts) Base (5 pts) (0 pts) (6 pts) Operating Expense & Other Income Currency (3 pts) (0 pts) (4 pts) Acquisitions (6 pts) 1 pts (5 pts) Base 2 pts 0 pts 2 pts
Reconciliation of Software Revenue Growth – 2Q 2016 30 Non-GAAP Supplemental Materials The above reconciles the Non-GAAP financial information contained in the “Software Revenue” discussions in the company’s earnings presentation. See Exhibit 99.2 included in the Company’s Form 8-K dated July 18, 2016 for additional information on the use of these Non-GAAP financial measures. Supplemental Materials GAAP @CC Transactional (15%) (15%) Annuity (Total Software) 6% 7% Cognitive Solutions Annuity 8% 9% Integration Software Annuity 2% 2% Operating Systems Annuity (5%) (4%) 2Q16 Yr/Yr
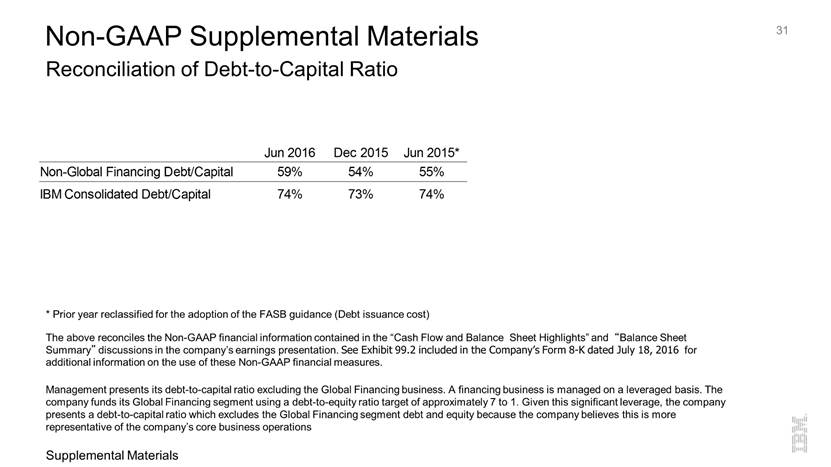
31 Non-GAAP Supplemental Materials Reconciliation of Debt-to-Capital Ratio * Prior year reclassified for the adoption of the FASB guidance (Debt issuance cost) The above reconciles the Non-GAAP financial information contained in the “Cash Flow and Balance Sheet Highlights” and “Balance Sheet Summary” discussions in the company’s earnings presentation. See Exhibit 99.2 included in the Company’s Form 8-K dated July 18, 2016 for additional information on the use of these Non-GAAP financial measures. Management presents its debt-to-capital ratio excluding the Global Financing business. A financing business is managed on a leveraged basis. The company funds its Global Financing segment using a debt-to-equity ratio target of approximately 7 to 1. Given this significant leverage, the company presents a debt-to-capital ratio which excludes the Global Financing segment debt and equity because the company believes this is more representative of the company’s core business operations Supplemental Materials Jun 2016 Dec 2015 Jun 2015* Non-Global Financing Debt/Capital 59% 54% 55% IBM Consolidated Debt/Capital 74% 73% 74%
32 Reconciliation of Free Cash Flow-Last 12 Months Non-GAAP Supplemental Materials The above reconciles the Non-GAAP financial information contained in the “Overview”, “Key Financial Metrics” and “Cash Flow and Balance Sheet Highlights” discussions in the company’s earnings presentation. See Exhibit 99.2 included in the Company’s Form 8-K dated July 18, 2016 for additional information on the use of these Non-GAAP financial measures. Supplemental Materials $ in billions 12 Months Ended Jun 2016 Net Cash from Operating Activities per GAAP: $18.6 Less: the change in Global Financing (GF) Receivables $1.7 Net Cash from Operating Activities (Excluding GF Receivables) $17.0 Capital Expenditures, Net ($3.9) Free Cash Flow (Excluding GF Receivables) $13.1
33 ibm.com/investor