Attached files
| file | filename |
|---|---|
| 8-K - CURRENT REPORT - OMNICOM GROUP INC. | e70483-8k.htm |
| EX-99.1 - EARNINGS RELEASE - OMNICOM GROUP INC. | e70483ex99-1.htm |
Exhibit 99.2

Second Quarter 2016 Results July 14, 2016 Investor Presentation

2016 vs. 2015 P&L Summary Second Quarter 1 (a) Additional information regarding our operating expenses can be found on page 24. (b) EBITA is a non - GAAP financial measure. Please see page 28 for the definition of this measure and page 22 for the reconciliation of non - GAAP financial measures, which reconciles the EBITA figures presented above to net income for the periods presented above . 2016 2015 Revenue 3,884.9$ 3,805.3$ Operating Expenses (a) 3,323.1 3,266.7 Operating Income 561.8 538.6 Margin % 14.5% 14.2% Addback: Amortization of Intangibles 28.5 27.1 EBITA (b) 590.3$ 565.7$ Margin % 15.2% 14.9% Second Quarter July 14, 2016

2016 vs. 2015 P&L Summary (continued) Second Quarter 2 2016 2015 Operating Income 561.8$ 538.6$ Net Interest Expense 44.8 34.6 Income Taxes 167.9 165.3 Tax Rate % 32.5% 32.8% Income from Equity Method Investments 2.8 4.0 Noncontrolling Interests 25.8 28.8 Net Income - Omnicom Group 326.1$ 313.9$ Second Quarter July 14, 2016

2016 vs. 2015 P&L Summary (continued) Second Quarter 3 2016 2015 Net Income - Omnicom Group 326.1$ 313.9$ Net Income allocated to Participating Securities (2.0) (3.9) Net Income available for common shares 324.1$ 310.0$ Diluted Shares (millions) 239.0 245.7 EPS - Diluted 1.36$ 1.26$ Dividend Declared per Share 0.55$ 0.50$ Second Quarter July 14, 2016

2016 vs. 2015 P&L Summary Year to Date 4 2016 2015 Revenue 7,384.0$ 7,274.5$ Operating Expenses (a) 6,430.1 6,358.2 Operating Income 953.9 916.3 Margin % 12.9% 12.6% Addback: Amortization of Intangibles 56.8 54.5 EBITA (b) 1,010.7$ 970.8$ Margin % 13.7% 13.3% Year to Date July 14, 2016 (a) Additional information regarding our operating expenses can be found on page 24. (b) EBITA is a non - GAAP financial measure. Please see page 28 for the definition of this measure and page 22 for the reconciliation of non - GAAP financial measures, which reconciles the EBITA figures presented above to net income for the periods presented above .

2016 vs. 2015 P&L Summary (continued) Year to Date 5 2016 2015 Operating Income 953.9$ 916.3$ Net Interest Expense 84.9 68.8 Income Taxes 283.4 278.0 Tax Rate % 32.6% 32.8% Income from Equity Method Investments 2.6 3.0 Noncontrolling Interests 43.7 49.5 Net Income - Omnicom Group 544.5$ 523.0$ Year to Date July 14, 2016

2016 vs. 2015 P&L Summary (continued) Year to Date 6 2016 2015 Net Income - Omnicom Group 544.5$ 523.0$ Net Income allocated to Participating Securities (3.6) (6.7) Net Income available for common shares 540.9$ 516.3$ Diluted Shares (millions) 240.1 246.6 EPS - Diluted 2.25$ 2.09$ Dividend Declared per Share 1.05$ 1.00$ Year to Date July 14, 2016

2016 Total Revenue Change 7 July 14, 2016 $ % ∆ % ∆ Prior Period Revenue $ 3,805.3 $ 7,274.5 Foreign Exchange (FX) Impact (a) (62.6) -1.6% (159.2) -2.2% Acquisition/Disposition Revenue (b) 13.2 0.3% 9.0 0.1% Organic Revenue (c) 129.0 3.4% 259.7 3.6% Current Period Revenue $ 3,884.9 2.1% $ 7,384.0 1.5% Second Quarter Year to Date $ (a) The FX Impact is calculated by translating the current period’s local currency revenue using the prior period average exchange rates to derive current period constant currency revenue. The FX impact is the difference between the current period revenue in U.S. Dollars and the current period constant currency revenue. (b) Acquisition/Disposition revenue is calculated by aggregating the prior period revenue of the acquired businesses, less the prior period revenue of any business that was disposed of in the current period . (c) Organic revenue is calculated by subtracting both the Acquisition/Disposition revenue and the FX impact from total revenue growth.

2016 Revenue by Region July 14, 2016 8 Second Quarter North America 60.0% UK 9.4% Euro Markets & Other Europe 16.2 % Asia Pacific 10.3% Latin America 2.5% Africa MidEast 1.6% Year to Date North America 60.3% UK 9.5% Euro Markets & Other Europe 16.0 % Asia Pacific 10.2% Latin America 2.4% Africa MidEast 1.6%

2016 Revenue by Region 9 Second Quarter Year to Date July 14, 2016 $ Mix % Growth % Organic Growth (a) North America 2,329.7$ 2.1% 3.2% UK 363.7 -2.2% 3.3% Euro & Other Europe 630.1 3.8% 4.3% Asia Pacific 400.2 1.4% 4.5% Latin America 98.9 19.7% 1.7% Africa Mid East 62.3 -8.3% -1.2% $ Mix % Growth % Organic Growth (a) North America 4,453.0$ 2.4% 3.8% UK 700.7 -2.5% 2.8% Euro & Other Europe 1,182.8 1.8% 3.7% Asia Pacific 754.5 0.4% 4.8% Latin America 174.1 4.6% -3.1% Africa Mid East 118.9 -7.1% 0.2% (a) “Organic Growth” reflects the year - over - year increase or decrease in revenue from the prior period, excluding the FX Impact and Acquisition/Disposition revenue, as defined on page 7.

2016 Revenue by Discipline July 14, 2016 10 Second Quarter Specialty 7.5% PR 9.0% CRM 30.3% Advertising 53.2% Specialty 7.4% PR 9.1% CRM 31.1% Advertising 52.4% $ Mix % Growth % Organic Growth (a) Advertising $ 2,066.0 6.1% 7.7% CRM 1,178.7 -4.3% -2.7% PR 349.6 1.1% 0.1% Specialty 290.6 3.1% 4.4% $ Mix % Growth % Organic Growth (a) Advertising $ 3,869.1 5.1% 7.8% CRM 2,299.1 -3.8% -1.7% PR 668.4 -0.1% -0.4% Specialty 547.4 2.1% 3.3% (a) “Organic Growth” reflects the year - over - year increase or decrease in revenue from the prior period, excluding the FX Impact and Acquisition/Disposition revenue, as defined on page 7. Year to Date

Revenue by Industry July 14, 2016 11 Auto 8% Consumer Products 10% Financial Services 7% Food & Beverage 14% Other 23% Pharma & Health 12% Retail 6% Tech 9% Telcom 4% T&E 7% Auto 8% Consumer Products 9% Financial Services 7% Food & Beverage 13% Other 25% Pharma & Health 11% Retail 7% Tech 9% Telcom 5% T&E 6% Year to Date – 2016 Year to Date – 2015

Cash Flow Performance 12 July 14, 2016 2016 2015 Net Income 588.2$ 572.5$ Depreciation and Amortization Expense 147.2 147.0 Share-Based Compensation Expense 46.3 49.3 Other Non-Cash Items to Reconcile to Net Cash Used in Operating Activities, net (59.7) (12.0) Free Cash Flow (a) 722.0$ 756.8$ Six Months Ended June 30 Additional information regarding our cash flows can be found in our condensed cash flow statement on page 21. (a) The Free Cash Flow amounts presented above are non - GAAP financial measures. See page 28 for the definition of this measure and page 23 for the reconciliation of the non - GAAP financial measures, which reconciles Free Cash Flow to the Net Cash Used in Operating Activities for the periods presented above.

Cash Flow Performance 13 July 14, 2016 2016 2015 Free Cash Flow (a) 722.0$ 756.8$ Primary Uses of Cash: Dividends 242.9 250.5 Dividends paid to Noncontrolling Interest Shareholders 52.0 61.1 Capital Expenditures 77.9 106.7 Acquisition of Businesses and Affiliates, Acquisition of Additional Noncontrolling Interests and Contingent Purchase Price Payments 359.7 64.9 Stock Repurchases, net of Proceeds from Stock Plans and Excess Tax Benefit from Stock Plans 351.7 386.3 Primary Uses of Cash (a) 1,084.2 869.5 Net Free Cash Flow (a) (362.2)$ (112.7)$ Six Months Ended June 30 Additional information regarding our cash flows can be found in our condensed cash flow statement on page 21. (a) The Free Cash Flow, Primary Uses of Cash and Net Free Cash Flow amounts presented above are non - GAAP financial measures. See page 28 for the definition of these measures and page 23 for the reconciliation of non - GAAP financial measures, which reconciles Free Cash Flow to the Net Cash Used in Operating Activities and Net Free Cash Flow to the Net Decrease in Cash and Cash Equivalents for the periods presented above.

Current Credit Picture 14 July 14, 2016 (a) EBITDA is a non - GAAP financial measure. See page 28 for the definition of this measure and page 22 for the reconciliation of no n - GAAP financial measures. (b) Net Debt is a non - GAAP financial measure. See page 28 for the definition of this measure, which is reconciled in the table above . (c) See pages 18 and 19 for additional information on our Senior Notes. 2016 2015 EBITDA (a) $ 2,249.1 $ 2,227.3 Gross Interest Expense 197.4 172.4 EBITDA / Gross Interest Expense 11.4 x 12.9 x Total Debt / EBITDA 2.2 x 2.0 x Net Debt (b) / EBITDA 1.6 x 1.4 x Debt Bank Loans (Due Less Than 1 Year) $ 12 $ 14 CP & Borrowings Issued Under Revolver - - Convertible Notes - - Senior Notes (c) 4,900 4,500 Other Debt 122 34 Total Debt $ 5,034 $ 4,548 Cash and Short Term Investments 1,537 1,362 Net Debt (b) $ 3,497 $ 3,186 Twelve Months Ended June 30

Historical Returns 15 July 14, 2016 Return on Invested Capital (ROIC) (a) : Twelve Months Ended June 30, 2016 18.4% Twelve Months Ended June 30, 2015 17.6% Return on Equity (b) : 15 Twelve Months Ended June 30, 2016 45.3% Twelve Months Ended June 30, 2015 35.9% (a) Return on Invested Capital is After Tax Reported Operating Income (a non - GAAP financial measure – see page 28 for the definition of this measure and page 23 for the reconciliation of non - GAAP financial measures) divided by the average of Invested Capital at the beginning and the end of the period (book value of all long - term liabilities and short - term interest bearing debt plus shareholders’ equity less cash, cash equivalents and short term investments). (b) Return on Equity is Reported Net Income for the given period divided by the average of shareholders’ equity at the beginning and end of the period.

Net Cash Returned to Shareholders through Dividends and Share Repurchases 16 July 14, 2016 0.6 0.7 1.0 1.2 1.6 2.0 2.4 2.9 3.2 2.6 2.6 3.8 4.5 5.4 5.9 7.0 7.7 8.0 $0.9 $1.8 $2.8 $3.6 $4.5 $5.4 $6.4 $7.4 $8.5 $9.6 $10.1 111% 92% 106% 106% 110% 107% 110% 110% 111% $- $2.0 $4.0 $6.0 $8.0 $10.0 $12.0 2006 2007 2008 2009 2010 2011 2012 2013 2014 2015 YTD 2016 Cumulative Cost of Net Shares Repurchased - Payments for repurchases of common stock less proceeds from stock plans. Cumulative Dividends Paid Cumulative Net Income - Omnicom Group Inc. % of Cumulative Net Income Returned to Shareholders - Cumulative Dividends Paid plus Cumulative Cost of Net Shares Repurchased divided by Cumulative Net Income. 120% 142% From 2006 through June 30, 2016, Omnicom distributed over 110% of Net Income to shareholders through Dividends and Share Repurchases . $ In Billions

Supplemental Financial Information July 14, 2016 17

Omnicom Debt Structure Bank Loans $12 2026 Senior Notes $1,400 2024 Senior Notes $ 750 2022 Senior Notes $ 1,250 2020 Senior Notes $1,000 2019 Senior Notes $ 500 18 July 14, 2016 The above chart sets forth Omnicom’s debt outstanding at June 30, 2016. The amounts reflected above for the 2019, 2020, 2022, 2024 and 2026 Senior Notes represent the principal amount of these notes at maturity on July 15, 2019, August 15, 2020, May 1, 2022, November 1, 2024 and April 15, 2026, respectively.

Omnicom Debt Maturity Profile 19 July 14, 2016 Other borrowings at June 30, 2016 include short - term borrowings of $12 million which are due in less than one year. For purposes of this presentation we have included these borrowings as outstandi ng through July 31, 2019, the date of expiration of our five - year credit facility. $0 $200 $400 $600 $800 $1,000 $1,200 $1,400 Other Borrowings 2019 Senior Notes 2020 Senior Notes 2022 Senior Notes 2024 Senior Notes 2026 Senior Notes

2016 Acquisition Related Expenditures 20 July 14, 2016 (a) Includes acquisitions of a majority interest in agencies resulting in their consolidation, including additional interest in e xis ting affiliate agencies resulting in majority ownership. (b) Includes the acquisition of additional equity interests in already consolidated subsidiary agencies which are recorded to Equ ity – Noncontrolling Interest. (c) Includes additional consideration paid for acquisitions completed in prior periods. (d) Total Acquisition Expenditures figure is net of cash acquired. Year to Date Acquisition of Businesses and Affiliates (a) 267.0$ Acquisition of Additional Noncontrolling Interests (b) 44.6 Contingent Purchase Price Payments (c) 48.1 Total Acquisition Expenditures (d) 359.7$
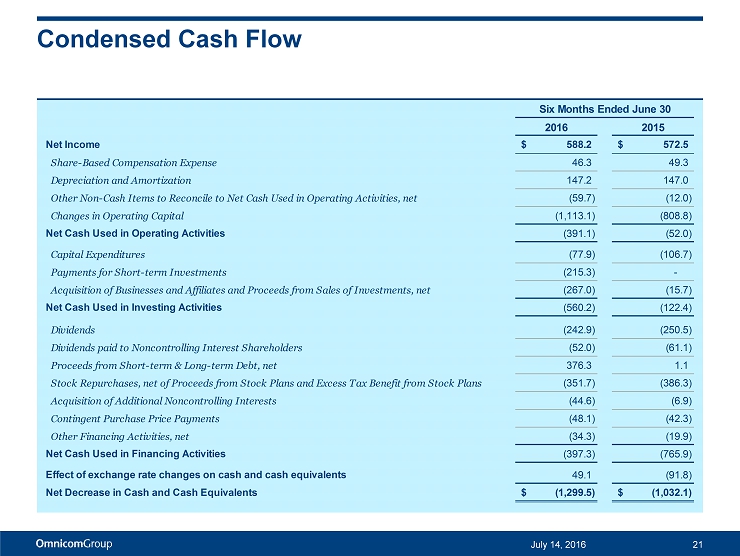
Condensed Cash Flow 21 July 14, 2016 2016 2015 Net Income 588.2$ 572.5$ Share-Based Compensation Expense 46.3 49.3 Depreciation and Amortization 147.2 147.0 Other Non-Cash Items to Reconcile to Net Cash Used in Operating Activities, net (59.7) (12.0) Changes in Operating Capital (1,113.1) (808.8) Net Cash Used in Operating Activities (391.1) (52.0) Capital Expenditures (77.9) (106.7) Payments for Short-term Investments (215.3) - Acquisition of Businesses and Affiliates and Proceeds from Sales of Investments, net (267.0) (15.7) Net Cash Used in Investing Activities (560.2) (122.4) Dividends (242.9) (250.5) Dividends paid to Noncontrolling Interest Shareholders (52.0) (61.1) Proceeds from Short-term & Long-term Debt, net 376.3 1.1 Stock Repurchases, net of Proceeds from Stock Plans and Excess Tax Benefit from Stock Plans (351.7) (386.3) Acquisition of Additional Noncontrolling Interests (44.6) (6.9) Contingent Purchase Price Payments (48.1) (42.3) Other Financing Activities, net (34.3) (19.9) Net Cash Used in Financing Activities (397.3) (765.9) Effect of exchange rate changes on cash and cash equivalents 49.1 (91.8) Net Decrease in Cash and Cash Equivalents (1,299.5)$ (1,032.1)$ Six Months Ended June 30

Reconciliation of Non - GAAP Financial Measures 22 July 14, 2016 The above reconciles EBITDA and EBITA to the GAAP financial measures for the periods presented. EBITDA and EBITA are non - GAAP financial measures within the meaning of applicable Securities and Exchange Commission (“SEC”) rules and regulations. Our credit facility defines EBITDA as earnings before deducting interest expense, income taxes, depreciation and amortization. Our credit facili ty uses EBITDA to measure our compliance with covenants, such as interest coverage and leverage ratios, as presented on page 14 of this presentation. 2016 2015 2016 2015 2016 2015 Revenue $ 3,884.9 $ 3,805.3 $ 7,384.0 $ 7,274.5 $ 15,243.9 $ 15,219.3 Operating Expenses, excluding Depreciation and Amortization 3,250.1 3,194.0 6,282.9 6,211.2 12,994.8 12,992.0 EBITDA 634.8 611.3 1,101.1 1,063.3 2,249.1 2,227.3 Depreciation 44.5 45.6 90.4 92.5 179.9 186.6 EBITA 590.3 565.7 1,010.7 970.8 2,069.2 2,040.7 Amortization of Intangibles 28.5 27.1 56.8 54.5 111.5 111.4 Operating Income 561.8 538.6 953.9 916.3 1,957.7 1,929.3 Net Interest Expense 44.8 34.6 84.9 68.8 157.6 130.2 Income Before Tax 517.0 504.0 869.0 847.5 1,800.1 1,799.1 Taxes 167.9 165.3 283.4 278.0 589.0 594.6 Income from Equity Method Investments 2.8 4.0 2.6 3.0 8.0 14.5 Net Income 351.9 342.7 588.2 572.5 1,219.1 1,219.0 Less: Net Income Attributed to Noncontrolling Interests 25.8 28.8 43.7 49.5 103.7 122.7 Net Income - Omnicom Group $ 326.1 $ 313.9 $ 544.5 $ 523.0 $ 1,115.4 $ 1,096.3 3 Months Ended June 30 12 Months Ended June 306 Months Ended June 30

Reconciliation of Non - GAAP Financial Measures July 14, 2016 23 2016 2015 Free Cash Flow 722.0$ 756.8$ Items excluded from Free Cash Flow: Changes in Operating Capital (1,113.1) (808.8) Net Cash Used in Operating Actvities (391.1)$ (52.0)$ Six Months Ended June 30 2016 2015 Reported Operating Income 1,957.7$ 1,929.3$ Effective Tax Rate for the applicable period 32.7% 33.0% Income Taxes on Reported Operating Income 640.2 636.7 After Tax Reported Operating Income 1,317.5$ 1,292.6$ Twelve Months Ended June 30 2016 2015 Net Free Cash Flow (362.2)$ (112.7)$ Cash Flow items excluded from Net Free Cash Flow: Changes in Operating Capital (1,113.1) (808.8) Proceeds from Short-term & Long-term Debt, net 376.3 1.1 Payments for Short-term investments (215.3) - Other Financing Activities, net (34.3) (19.9) Effect of exchange rate changes on cash and cash equivalents 49.1 (91.8) Net Decrease in Cash and Cash Equivalents (1,299.5)$ (1,032.1)$ Six Months Ended June 30
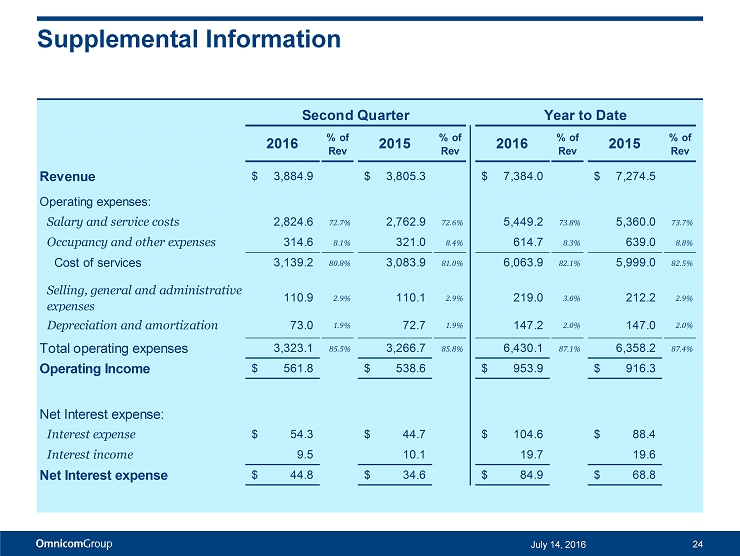
Supplemental Information 24 July 14, 2016 2016 % of Rev 2015 % of Rev 2016 % of Rev 2015 % of Rev Revenue 3,884.9$ 3,805.3$ 7,384.0$ 7,274.5$ Operating expenses: Salary and service costs 2,824.6 72.7% 2,762.9 72.6% 5,449.2 73.8% 5,360.0 73.7% Occupancy and other expenses 314.6 8.1% 321.0 8.4% 614.7 8.3% 639.0 8.8% Cost of services 3,139.2 80.8% 3,083.9 81.0% 6,063.9 82.1% 5,999.0 82.5% Selling, general and administrative expenses 110.9 2.9% 110.1 2.9% 219.0 3.0% 212.2 2.9% Depreciation and amortization 73.0 1.9% 72.7 1.9% 147.2 2.0% 147.0 2.0% Total operating expenses 3,323.1 85.5% 3,266.7 85.8% 6,430.1 87.1% 6,358.2 87.4% Operating Income 561.8$ 538.6$ 953.9$ 916.3$ Net Interest expense: Interest expense 54.3$ 44.7$ 104.6$ 88.4$ Interest income 9.5 10.1 19.7 19.6 Net Interest expense 44.8$ 34.6$ 84.9$ 68.8$ Second Quarter Year to Date

Second Quarter Acquisition July 14, 2016 25 Founded in 2004, Rabin Martin is a strategy consulting firm that assists its clients , especially major healthcare corporations and international NGOs, to become recognized leaders in public health, both for the purpose of cultivating, strengthening and advancing reputation and, in the case of private sector concerns, enabling access to markets. Rabin Martin is known for its work in developing strategic partnerships and best practices in reputation efforts typically focusing on infectious disease, women’s health, neglected diseases, chronic illness & the private sector’s role in global public health. Rabin Martin is headquartered in New York with associates located in Los Angeles, London and Geneva. Rabin Martin will operate as part of the Omnicom Public Relations Group within the DAS Group of Companies.
Second Quarter Acquisition July 14, 2016 26 Established in 2005, BioPharm Communications is a leading communications agency that specializes in proprietary, multichannel marketing programs to physicians and healthcare practitioners for pharmaceutical and biotechnology clients. With advanced analytic capabilities, BioPharm creates customized campaigns that enable healthcare clients to effectively target their desired audiences, and to engage them with impactful content and relevant clinical information. BioPharm is located in New Hope, Pennsylvania and will operate as part of the Omnicom Health Group within the DAS Group of Companies.
Second Quarter Acquisition July 14, 2016 27 Omnicom Media Group has acquired a controlling interest in its affiliate in Switzerland, Omnicom Media Group Schweiz AG . OMG Switzerland is a market - leading full service media agency with approximately 110 employees. OMG Switzerland leverages the strength of the OMG network, offering local and multi - national clients media planning and buying services including data, analytics and marketing science capabilities. OMG Switzerland is based in Zurich, Switzerland .

The preceding materials have been prepared for use in the July 14, 2016 conference call on Omnicom’s results of operations fo r t he period ended June 30, 2016. The call will be archived on the Internet at http://investor.omnicomgroup.com/investor - relations/news - events - and - filings / . Forward - Looking Statements Certain statements in this presentation constitute forward - looking statements, including statements within the meaning of the Pr ivate Securities Litigation Reform Act of 1995. In addition, from time to time, the Company or its representatives have made, or may make, forward - looking statements, orally or in writing. These stateme nts may discuss goals, intentions and expectations as to future plans, trends, events, results of operations or financial condition, or otherwise, based on current beliefs of the Company’s managem ent as well as assumptions made by, and information currently available to, the Company’s management. Forward - looking statements may be accompanied by words such as “aim,” “anticipate,” “believe,” “plan,” “could,” “should,” “would,” “estimate,” “expect,” “forecast,” “future,” “guidance,” “intend,” “may,” “will,” “possible,” “potential,” “predict,” “project” or similar words, phrases or expressions. The se forward - looking statements are subject to various risks and uncertainties, many of which are outside the Company’s control. Therefore, you should not place undue reliance on such statements. Factors that c oul d cause actual results to differ materially from those in the forward - looking statements include: international, national or local economic conditions that could adversely affect the Company or i ts clients; losses on media purchases and production costs incurred on behalf of clients; reductions in client spending, a slowdown in client payments and a deterioration in the credit markets; ability t o a ttract new clients and retain existing clients in the manner anticipated; changes in client advertising, marketing and corporate communications requirements; failure to manage potential conflicts of interest be tween or among clients; unanticipated changes relating to competitive factors in the advertising, marketing and corporate communications industries; ability to hire and retain key personnel; curr enc y exchange rate fluctuations; reliance on information technology systems; changes in legislation or governmental regulations affecting the Company or its clients; risks associated with assumptions th e C ompany makes in connection with its critical accounting estimates and legal proceedings; and the Company’s international operations, which are subject to the risks of currency repatriation restri cti ons, social or political conditions and regulatory environment. The foregoing list of factors is not exhaustive. You should carefully consider the foregoing factors and the other risks and uncertainties tha t may affect the Company’s business, including those described in the “Risk Factors” in Omnicom’s Annual Report on Form 10 - K for the year ended December 31, 2015. Except as required under applicable law, the Company does not assume any obligation to update these forward - looking statements. Non - GAAP Financial Measures We present financial measures determined in accordance with generally accepted accounting principles in the United States (“G AAP ”) and adjustments to the GAAP presentation (“Non - GAAP”), which we believe are meaningful for understanding our performance. Non - GAAP financial measures should not be considered in isolation f rom, or as a substitute for, financial information presented in compliance with GAAP. Non - GAAP financial measures as reported by us may not be comparable to similarly titled amounts reported b y other companies. We provide a reconciliation of non - GAAP measures to the comparable GAAP measures on pages 22 and 23. The Non - GAAP measures used in this presentation include the following: Free Cash Flow, defined as net income plus depreciation, amortization, share based compensation expense plus/(less) other non - cash it ems to reconcile to net cash provided by operating activities. We believe Free Cash Flow is a useful measure to evaluate our ability to generate excess cash from our operations. Primary Uses of Cash, defined as dividends to common shareholders, dividends paid to non - controlling interest shareholders, capital expe nditures, cash paid on acquisitions, payments for additional interest in controlled subsidiaries and stock repurchases, net of the proceeds and excess tax benefit from our stock plans, a nd excludes changes in operating capital and other investing and financing activities, including commercial paper issuances and redemptions used to fund working capital changes . We believe this measure is useful in identifying the significant uses of our cash. Net Free Cash Flow, defined as Free Cash Flow less the Primary Uses of Cash. Net Free Cash Flow is one of the metrics used by us to assess our sources and uses of cash and was derived from our consolidated statements of cash flows. We believe that this presentation is meaningful for understanding our primary sources and primary uses of that cash flow. EBITDA, defined as operating income before interest, taxes, depreciation and amortization. We believe EBITDA is meaningful be cau se the financial covenants in our credit facilities are based on EBITDA. EBITA, defined as operating income before interest, taxes and amortization. We use EBITA as an additional operating performan ce measure, which excludes the non - cash amortization expense of intangible assets ( primarily consisting of amortization arising from acquisitions ), because we believe it is a useful measure for investors to evaluate the performance of our businesses. Net Debt, defined as total debt less cash, cash equivalents and short - term investments. We believe net debt, together with the c omparable GAAP measures, reflects one of the metrics used by us to assess our cash management. After Tax Reported Operating Income, defined as reported operating income less income taxes calculated using the effective ta x r ate for the applicable period. Management uses after tax operating income as a measure of after tax operating performance as it excludes the after tax effects of financing and investing activi tie s on results of operations. Other Information All dollar amounts are in millions except for per share amounts and figures shown on pages 3 and 6 and the net cash returned to shareholders figures on page 16. The information contained in this document has not been audited, although some data has been derived from Omnicom’s historical financial statements, including its audited financial statements. In addition, industry, operational and other non - financial data contained in this document have been derived from sources that we believe to be reliable, but we have n ot independently verified such information, and we do not, nor does any other person, assume responsibility for the accuracy or completeness of that information. Certain amounts in prior periods ha ve been reclassified to conform to our current presentation. The inclusion of information in this presentation does not mean that such information is material or that disclosure of such inf ormation is required. Disclosure July 14, 2016 28