Attached files
| file | filename |
|---|---|
| EX-99.1 - EX-99.1 - DiamondRock Hospitality Co | a16-14918_1ex99d1.htm |
| 8-K - 8-K - DiamondRock Hospitality Co | a16-14918_18k.htm |
Exhibit 99.2
2016 Dispositions Highlights July 2016

Forward Looking Statements Certain statements made during this presentation are forward-looking statements that are subject to risks and uncertainties. Forward-looking statements generally include the words “believe,” “expect,” “anticipate,” “plan,” “estimate,” “project,” “will,” “intend” or other similar expressions. Forward-looking statements include, without limitation, statements regarding, industry outlook, results of operations, cash flows, business strategies, growth and value opportunities, capital and other expenditures, financing plans, expense reduction initiatives and projected dispositions. Factors that could cause actual results to materially differ from those contained in the forward-looking statements include, without limitation, those risks and uncertainties discussed in the Company’s most recent Annual Report on Form 10-K, quarterly report on Form 10-Q and current reports on Form 8-K, which have been filed with the Securities and Exchange Commission, all of which you should carefully review. The forward-looking statements made are based on our beliefs, assumptions and expectations of future performance, taking into account all information currently available to us. Actual results could differ materially from the forward-looking statements made during this presentation. The forward-looking statements made during this presentation are subject to the safe harbor of the Private Securities Litigation Reform Act of 1995. Any forward-looking statement speaks only as of the date on which it is made. Although the Company believes the expectations reflected in such forward-looking statements are based upon reasonable assumptions, it can give no assurance that the expectations will be attained or that any deviation will not be material. All information in this presentation is as of the date of this presentation, and the Company undertakes no obligation to update any forward-looking statement to conform the statement to actual results or changes in the Company's expectations. This presentation contains statistics and other data that has been obtained or compiled from information made available by third-party service providers. 2
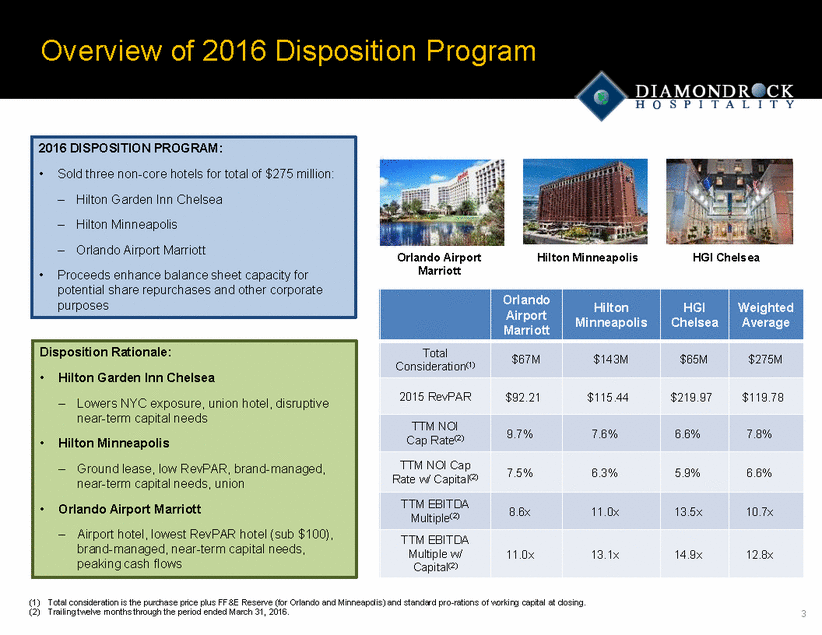
Overview of 2016 Disposition Program Orlando Airport Marriott Hilton Minneapolis HGI Chelsea Average near-term capital needs, union brand-managed, near-term capital needs, (1) Total consideration is the purchase price plus FF&E Reserve (for Orlando and Minneapolis) and standard pro-rations of working capital at closing. (2) Trailing twelve months through the period ended March 31, 2016. 3 Disposition Rationale: •Hilton Garden Inn Chelsea –Lowers NYC exposure, union hotel, disruptive near-term capital needs •Hilton Minneapolis –Ground lease, low RevPAR, brand-managed, •Orlando Airport Marriott –Airport hotel, lowest RevPAR hotel (sub $100), peaking cash flows Orlando Airport Marriott Hilton Minneapolis HGI Chelsea Weighted Total Consideration(1) $67M $143M $65M $275M 2015 RevPAR $92.21 $115.44 $219.97 $119.78 TTM NOI Cap Rate(2) 9.7% 7.6% 6.6% 7.8% TTM NOI Cap Rate w/ Capital(2) 7.5% 6.3% 5.9% 6.6% TTM EBITDA Multiple(2) 8.6x 11.0x 13.5x 10.7x TTM EBITDA Multiple w/ Capital(2) 11.0x 13.1x 14.9x 12.8x 2016 DISPOSITION PROGRAM: •Sold three non-core hotels for total of $275 million: –Hilton Garden Inn Chelsea –Hilton Minneapolis –Orlando Airport Marriott •Proceeds enhance balance sheet capacity for potential share repurchases and other corporate purposes
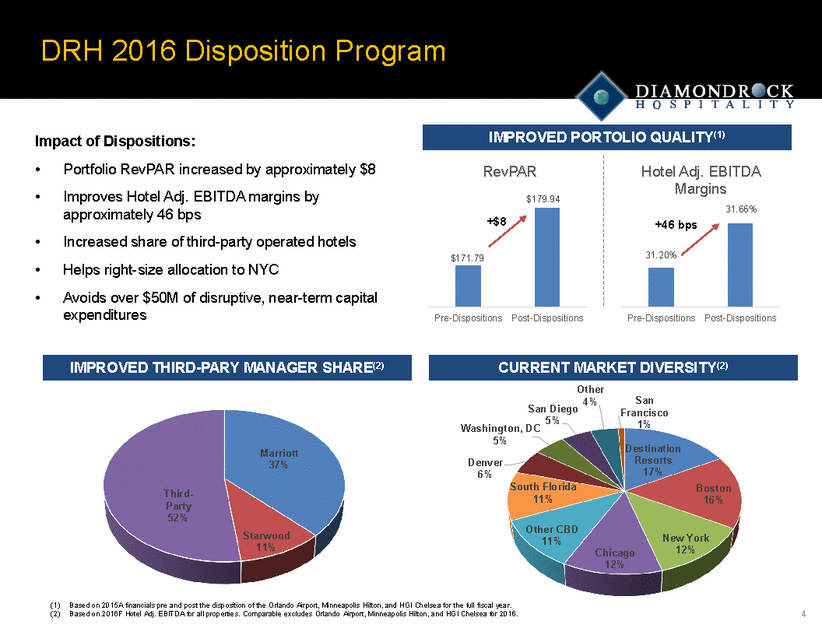
DRH 2016 Disposition Program Impact of Dispositions: • • Portfolio RevPAR increased by approximately $8 Improves Hotel Adj. EBITDA margins by approximately 46 bps Increased share of third-party operated hotels Helps right-size allocation to NYC Avoids over $50M of disruptive, near-term capital expenditures RevPAR $179.94 Hotel Adj. EBITDA Margins 31.66% +46 bps • • • Pre-Dispositions Post-Dispositions Pre-Dispositions Post-Dispositions Other San Francisco 4% San Diego 5% 1% Washington, DC 5% Destination Resorts 17% Marriott 37% Denver 6% South Florida 11% Boston 16% Third-Party 52% Other CBD 11% Starwood 11% New York 12% Chicago 12% (1) Based on 2015A financials pre and post the disposition of the Orlando Airport, Minneapolis Hilton, and HGI Chelsea for the full fiscal year. (2) Based on 2016F Hotel Adj. EBITDA for all properties. Comparable excludes Orlando Airport, Minneapolis Hilton, and HGI Chelsea for 2016. 4 IMPROVED THIRD-PARY MANAGER SHARE(2) CURRENT MARKET DIVERSITY(2) 31.20% +$8 $171.79 IMPROVED PORTOLIO QUALITY(1)
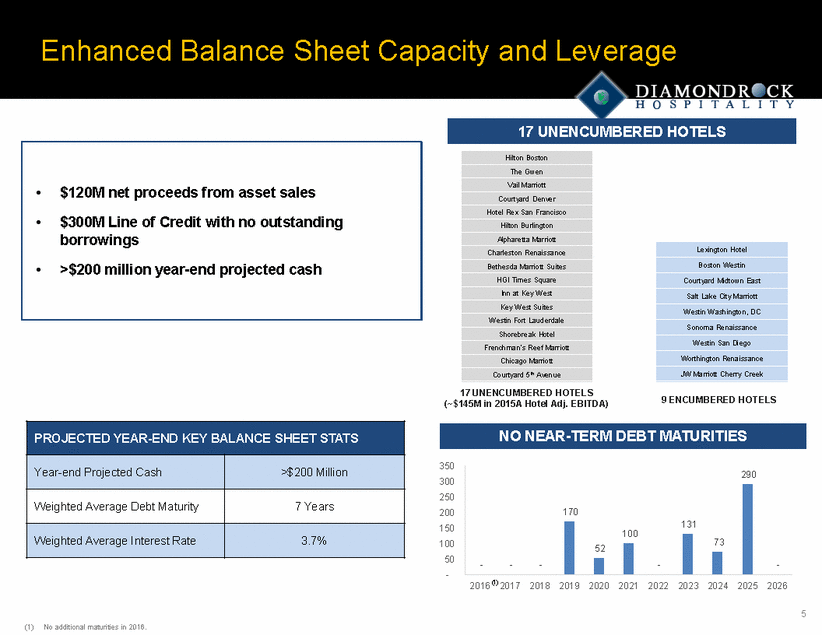
Enhanced Balance Sheet Capacity and Leverage • $120M net proceeds from asset sales • $300M Line of Credit with no outstanding borrowings • >$200 million year-end projected cash 17 UNENCUMBERED HOTELS (~$145M in 2015A Hotel Adj. EBITDA) 9 ENCUMBERED HOTELS 350 300 250 200 150 100 50 - 100 2016(1) 2017 2018 2019 2020 2021 2022 2023 2024 2025 2026 5 (1) No additional maturities in 2016. 290 170 - ---131 73 52 - NO NEAR-TERM DEBT MATURITIES PROJECTED YEAR-END KEY BALANCE SHEET STATS Year-end Projected Cash >$200 Million Weighted Average Debt Maturity 7 Years Weighted Average Interest Rate 3.7% Lexington Hotel Boston Westin Courtyard Midtown East Salt Lake City Marriott Westin Washington, DC Sonoma Renaissance Westin San Diego Worthington Renaissance JW Marriott Cherry Creek Hilton Boston The Gwen Vail Marriott Courtyard Denver Hotel Rex San Francisco Hilton Burlington Alpharetta Marriott Charleston Renaissance Bethesda Marriott Suites HGI Times Square Inn at Key West Key West Suites Westin Fort Lauderdale Shorebreak Hotel Frenchman’s Reef Marriott Chicago Marriott Courtyard 5th Avenue 17 UNENCUMBERED HOTELS
6 6 APPENDIX
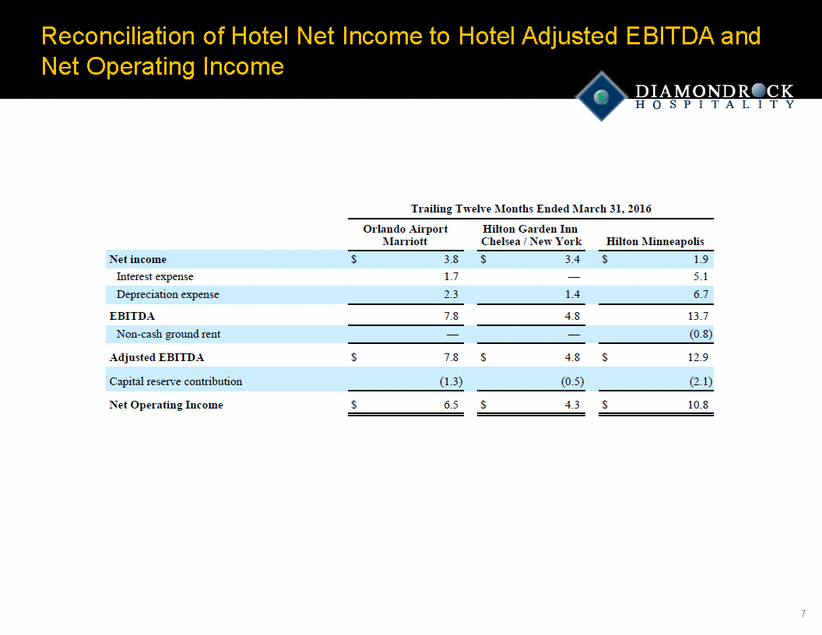
Trailing Tweln :\Ionths Ended :\Ia.-cb 31.2016 Hilton Garden Inn Chelsea I New York Orlando Airport Maniott Hilton :\ Iinntapolis s s 1.9 5.1 6.7 Net inrome Interest expense Depreciation expe11se EBITDA Non-cash ground retll Ad justed EBITDA 3.8 1.7 2.3 $ 3.4 1.4 4.8 13.7 (0.8) 7.8 s s $ 7.8 4.8 12.9 (1.3) (0.5) (2.1) Capital reserve contribution Net Operating Income s s 4.3 10.8 $ 6.5 7
