Attached files
| file | filename |
|---|---|
| 8-K - WEC ENERGY GROUP FORM 8-K - WEC ENERGY GROUP, INC. | wecenergygroupform8-k07122.htm |
July 2016
1
Cautionary Statement Regarding
Forward-Looking Information
Much of the information contained in this presentation is forward-looking information based upon management’s
current expectations and projections that involve risks and uncertainties. Forward-looking information includes, among
other things, information concerning earnings per share, rate case activity, earnings per share growth, cash flow,
dividend growth and dividend payout ratios, construction costs and capital expenditures, investment opportunities,
corporate initiatives, and rate base. Readers are cautioned not to place undue reliance on this forward-looking
information. Forward-looking information is not a guarantee of future performance and actual results may differ
materially from those set forth in the forward-looking information.
In addition to the assumptions and other factors referred to in connection with the forward-looking information, factors
that could cause WEC Energy Group’s actual results to differ materially from those contemplated in any forward-
looking information or otherwise affect our future results of operations and financial condition include, among others,
the following: general economic conditions, including business and competitive conditions in the company’s service
territories; timing, resolution and impact of future rate cases and other regulatory decisions; the company’s ability to
successfully integrate the operations of the Integrys companies with its own operations; availability of the company’s
generating facilities and/or distribution systems; unanticipated changes in fuel and purchased power costs; key
personnel changes; varying weather conditions; continued industry consolidation; cyber-security threats; the value of
goodwill and its possible impairment; construction risks; equity and bond market fluctuations; the impact of any
legislative and regulatory changes; current and future litigation and regulatory investigations; changes in accounting
standards; and other factors described under the heading “Factors Affecting Results, Liquidity, and Capital Resources”
in Management’s Discussion and Analysis of Financial Condition and Results of Operations and under the headings
“Cautionary Statement Regarding Forward-Looking Information” and “Risk Factors” contained in WEC Energy Group’s
Form 10-K for the year ended December 31, 2015 and in subsequent reports filed with the Securities and Exchange
Commission. WEC Energy Group expressly disclaims any obligation to publicly update or revise any forward-looking
information.
2
Well Positioned for the Future
WEC Energy Group
Focused on the fundamentals:
World-class reliability
Operating efficiency
Financial discipline
Exceptional customer care
3
Well Positioned for the Future
A Compelling Value Proposition
For 2016, targeting earnings per share growth of 6-8 percent
Beyond 2016, earnings per share expected to grow at
5-7 percent annually
More than 99 percent of earnings from regulated operations
Projecting dividend growth in line with earnings growth
4
Well Positioned for the Future
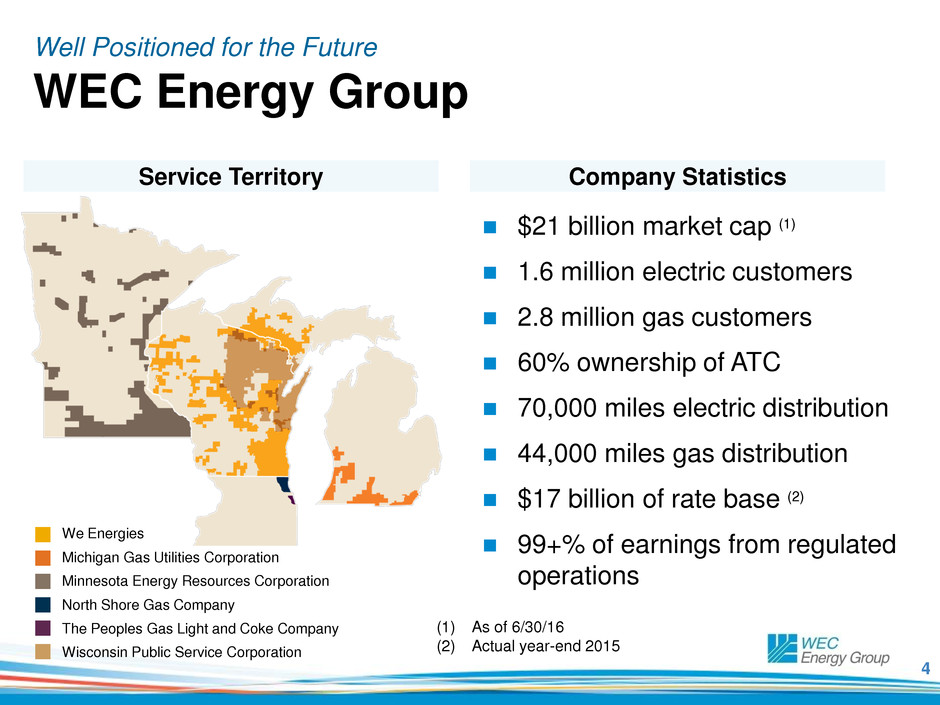
WEC Energy Group
$21 billion market cap (1)
1.6 million electric customers
2.8 million gas customers
60% ownership of ATC
70,000 miles electric distribution
44,000 miles gas distribution
$17 billion of rate base (2)
99+% of earnings from regulated
operations
We Energies
Michigan Gas Utilities Corporation
Minnesota Energy Resources Corporation
North Shore Gas Company
The Peoples Gas Light and Coke Company
Wisconsin Public Service Corporation
Company Statistics Service Territory
(1) As of 6/30/16
(2) Actual year-end 2015
5
Well Positioned for the Future
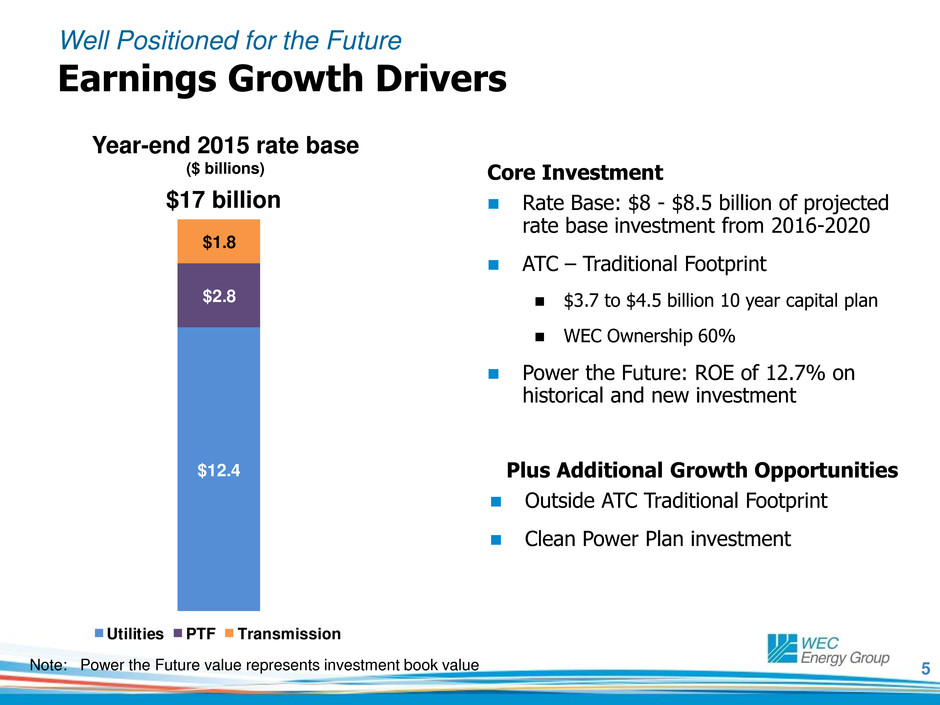
Earnings Growth Drivers
Plus Additional Growth Opportunities
Outside ATC Traditional Footprint
Clean Power Plan investment
$2.7
$5.7
Year-end 2015 rate base
($ billions)
$12.4
$2.8
$1.8
Utilities PTF Transmission
Note: Power the Future value represents investment book value
Core Investment
Rate Base: $8 - $8.5 billion of projected
rate base investment from 2016-2020
ATC – Traditional Footprint
$3.7 to $4.5 billion 10 year capital plan
WEC Ownership 60%
Power the Future: ROE of 12.7% on
historical and new investment
$17 billion
6
Well Positioned for the Future
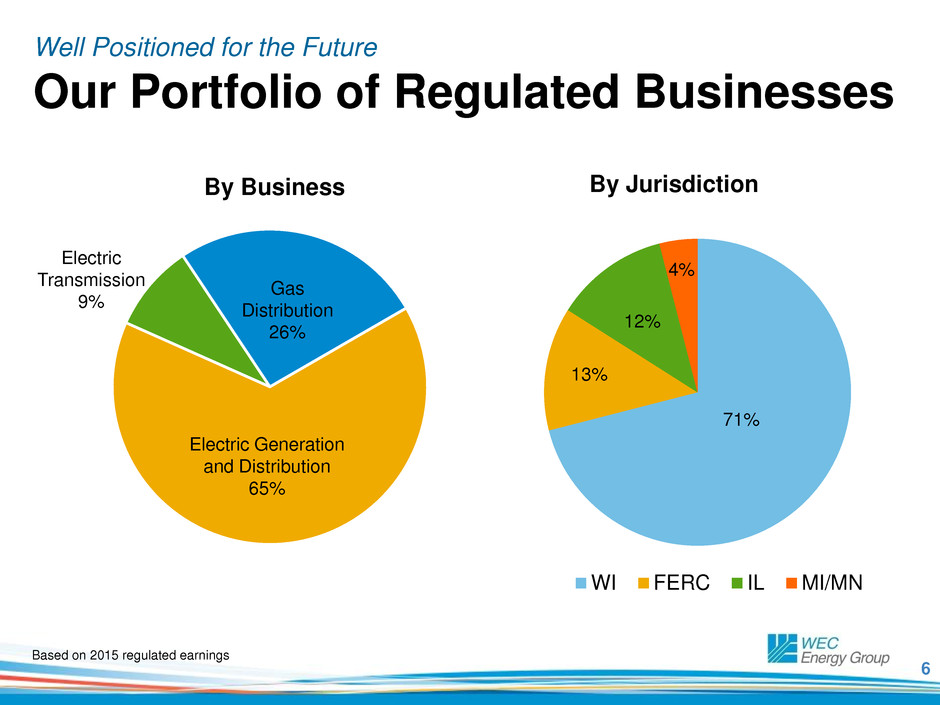
Our Portfolio of Regulated Businesses
Electric Generation
and Distribution
65%
Gas
Distribution
26%
Electric
Transmission
9%
Based on 2015 regulated earnings
71%
13%
12%
4%
WI FERC IL MI/MN
By Jurisdiction By Business
7
Balanced Regulatory Environment
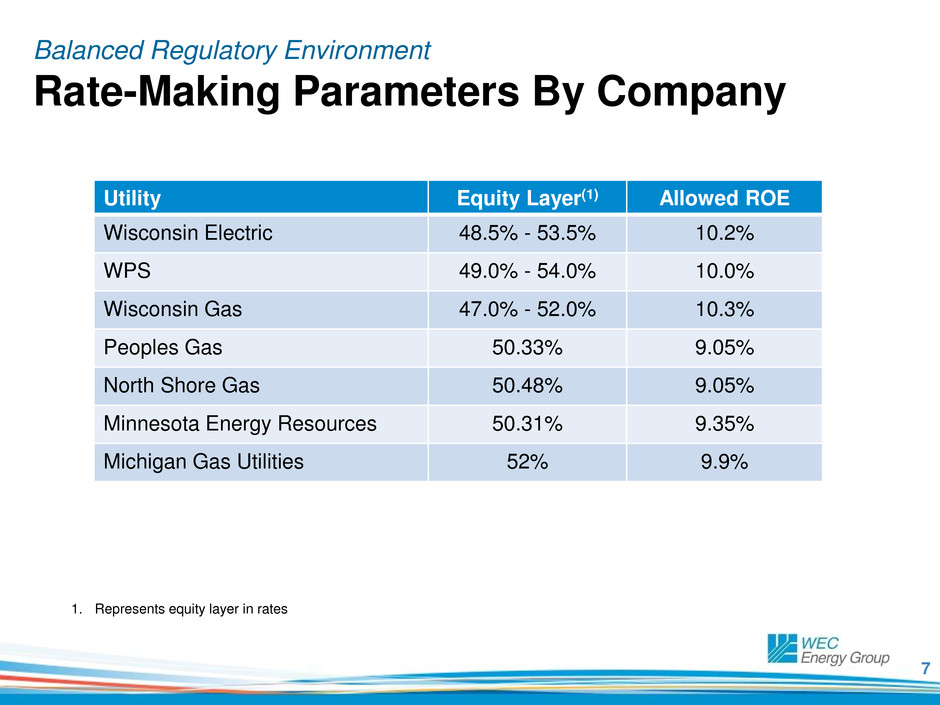
Rate-Making Parameters By Company
Utility Equity Layer(1) Allowed ROE
Wisconsin Electric 48.5% - 53.5% 10.2%
WPS 49.0% - 54.0% 10.0%
Wisconsin Gas 47.0% - 52.0% 10.3%
Peoples Gas 50.33% 9.05%
North Shore Gas 50.48% 9.05%
Minnesota Energy Resources 50.31% 9.35%
Michigan Gas Utilities 52% 9.9%
1. Represents equity layer in rates
8
Balanced Regulatory Environment
Rate Case Update
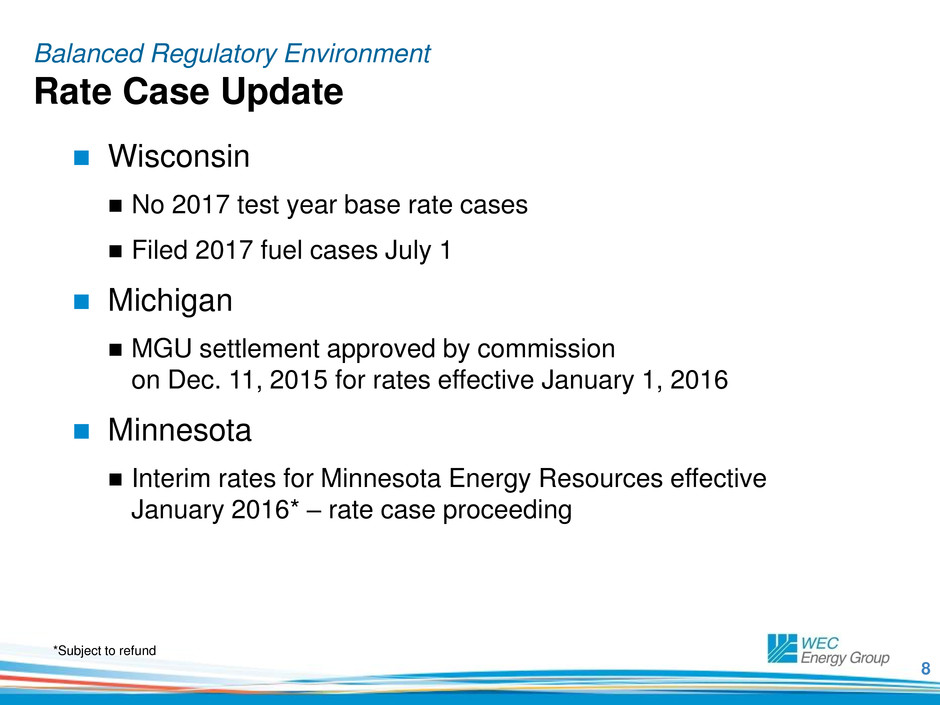
Wisconsin
No 2017 test year base rate cases
Filed 2017 fuel cases July 1
Michigan
MGU settlement approved by commission
on Dec. 11, 2015 for rates effective January 1, 2016
Minnesota
Interim rates for Minnesota Energy Resources effective
January 2016* – rate case proceeding
*Subject to refund
9
Line of Business View
Five Year Capital Projection 2016-2020
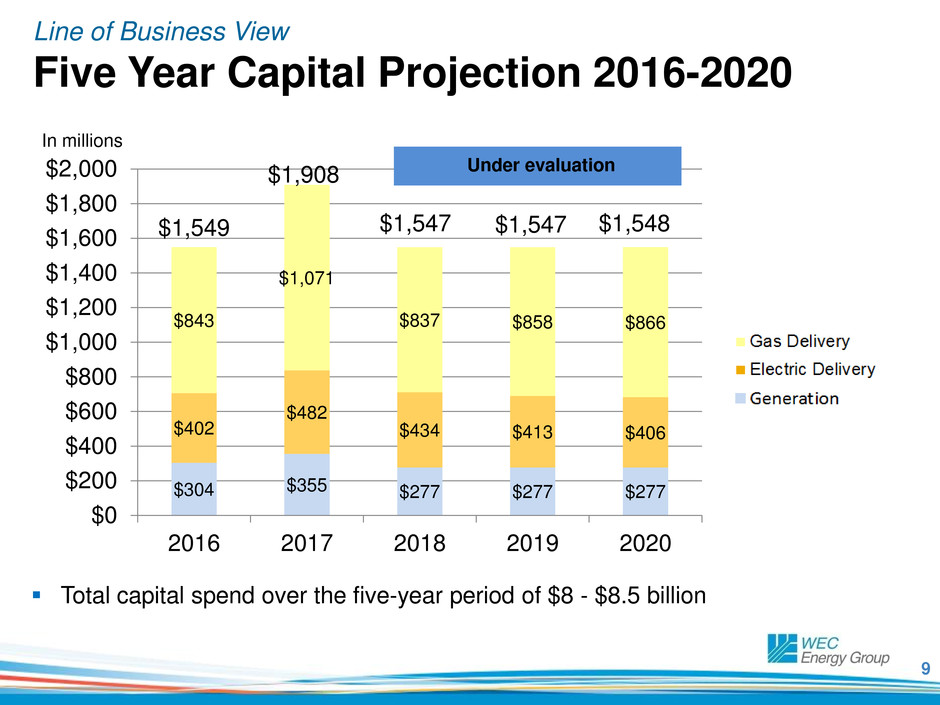
$304 $355 $277 $277 $277
$402
$482
$434 $413 $406
$843
$1,071
$837 $858 $866
$0
$200
$400
$600
$800
$1,000
$1,200
$1,400
$1,600
$1,800
$2,000
2016 2017 2018 2019 2020
In millions
Total capital spend over the five-year period of $8 - $8.5 billion
$1,549
$1,908
$1,547 $1,547 $1,548
Under evaluation
10
State View
Five Year Capital Projection 2016-2020
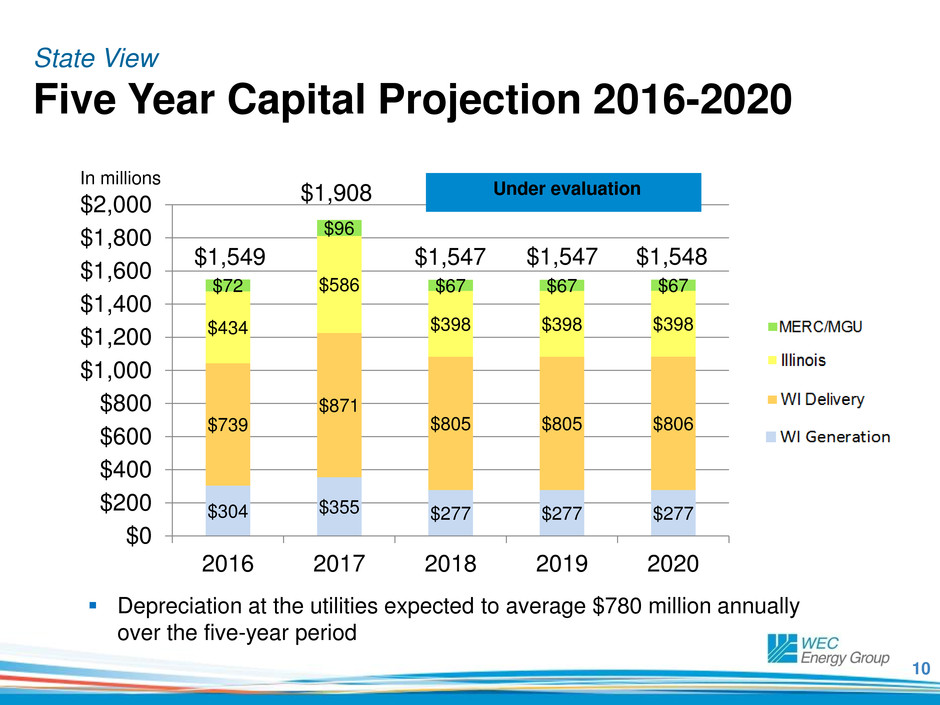
$304 $355 $277 $277 $277
$739
$871
$805 $805 $806
$434
$586
$398 $398 $398
$72
$96
$67 $67 $67
$0
$200
$400
$600
$800
$1,000
$1,200
$1,400
$1,600
$1,800
$2,000
2016 2017 2018 2019 2020
In millions
Depreciation at the utilities expected to average $780 million annually
over the five-year period
$1,547 $1,549
$1,908
$1,547 $1,548
Under evaluation
11
Well Positioned for the Future
Sample Merger Driven Initiatives
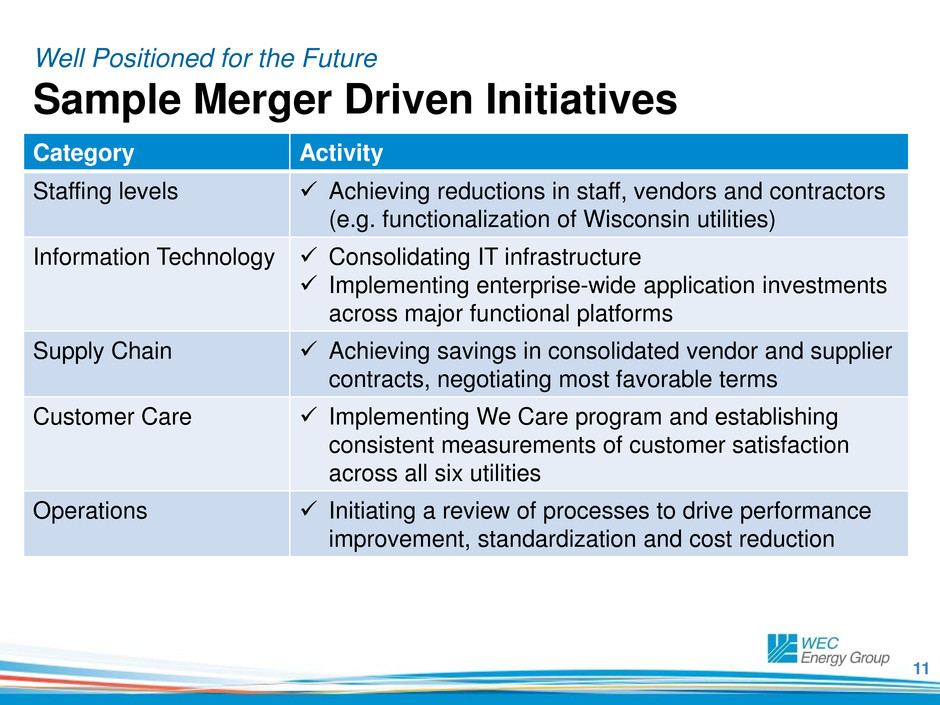
Category Activity
Staffing levels Achieving reductions in staff, vendors and contractors
(e.g. functionalization of Wisconsin utilities)
Information Technology Consolidating IT infrastructure
Implementing enterprise-wide application investments
across major functional platforms
Supply Chain Achieving savings in consolidated vendor and supplier
contracts, negotiating most favorable terms
Customer Care Implementing We Care program and establishing
consistent measurements of customer satisfaction
across all six utilities
Operations Initiating a review of processes to drive performance
improvement, standardization and cost reduction
12
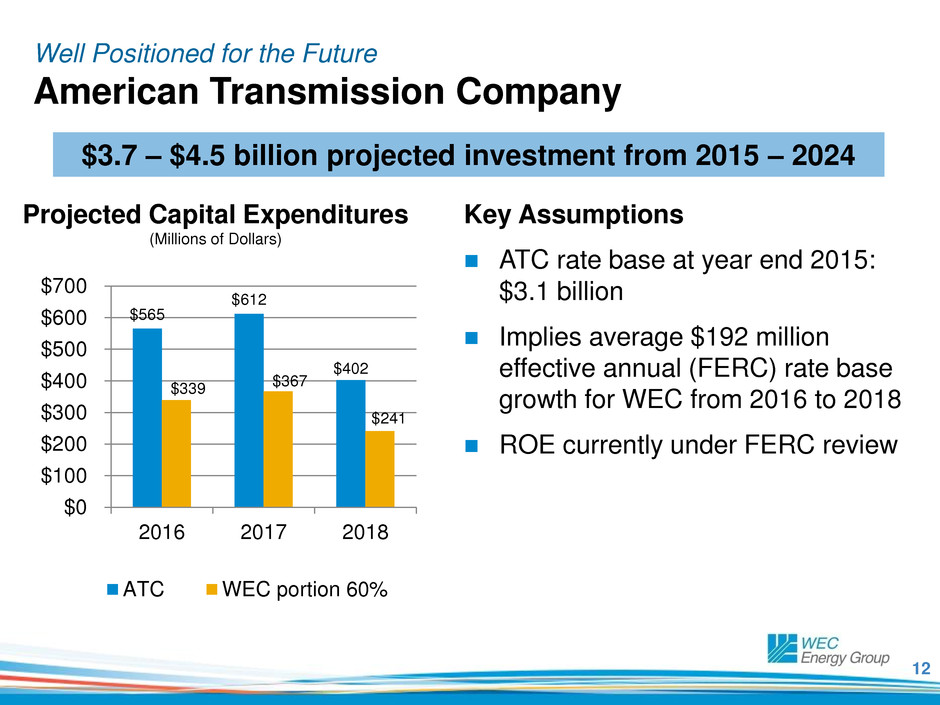
$565
$612
$402
$339 $367
$241
$0
$100
$200
$300
$400
$500
$600
$700
2016 2017 2018
ATC WEC portion 60%
Well Positioned for the Future
American Transmission Company
Key Assumptions
ATC rate base at year end 2015:
$3.1 billion
Implies average $192 million
effective annual (FERC) rate base
growth for WEC from 2016 to 2018
ROE currently under FERC review
Projected Capital Expenditures
(Millions of Dollars)
$3.7 – $4.5 billion projected investment from 2015 – 2024
13
Well Positioned for the Future
American Transmission Company –
Outside the Traditional Footprint
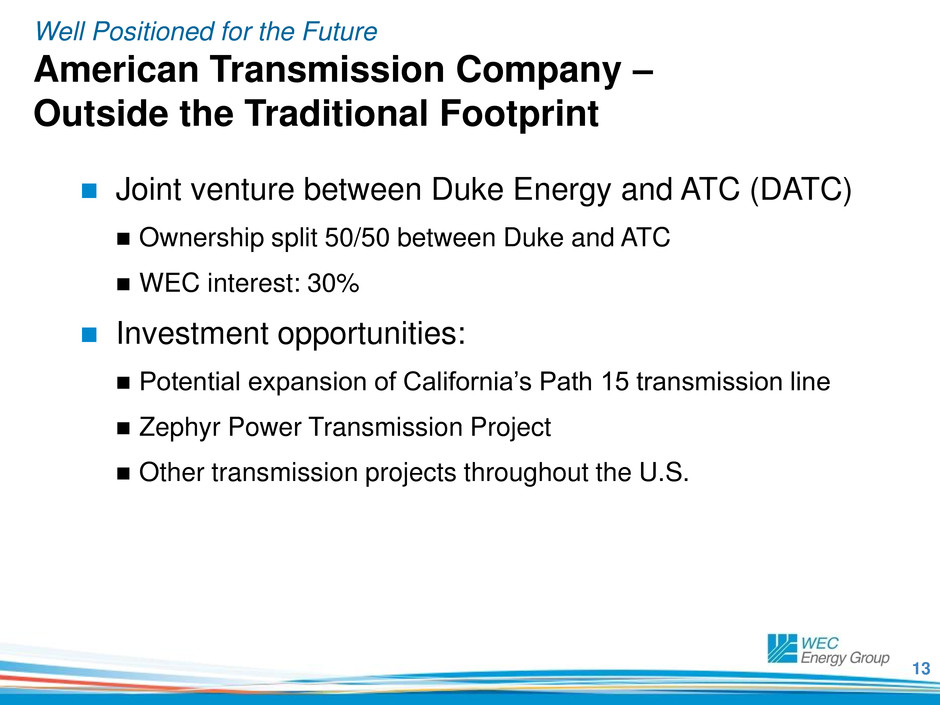
Joint venture between Duke Energy and ATC (DATC)
Ownership split 50/50 between Duke and ATC
WEC interest: 30%
Investment opportunities:
Potential expansion of California’s Path 15 transmission line
Zephyr Power Transmission Project
Other transmission projects throughout the U.S.
14
Well Positioned for the Future
PTF Investments
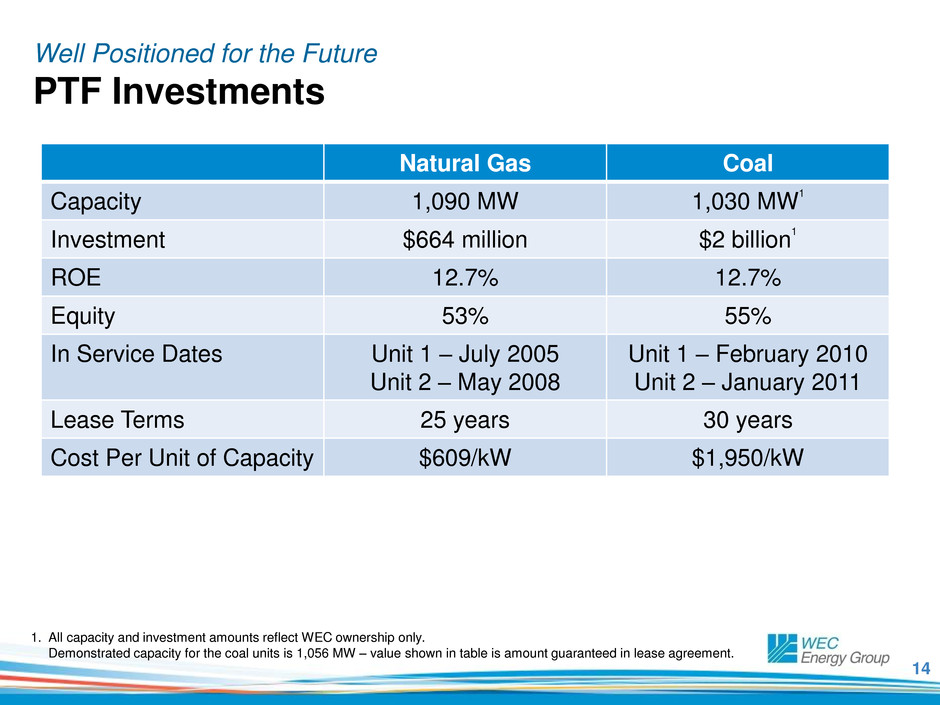
Natural Gas Coal
Capacity 1,090 MW 1,030 MW
1
Investment $664 million $2 billion
1
ROE 12.7% 12.7%
Equity 53% 55%
In Service Dates Unit 1 – July 2005
Unit 2 – May 2008
Unit 1 – February 2010
Unit 2 – January 2011
Lease Terms 25 years 30 years
Cost Per Unit of Capacity $609/kW $1,950/kW
1. All capacity and investment amounts reflect WEC ownership only.
Demonstrated capacity for the coal units is 1,056 MW – value shown in table is amount guaranteed in lease agreement.
15
A Track Record of Performance
Industry Leading Dividend Growth
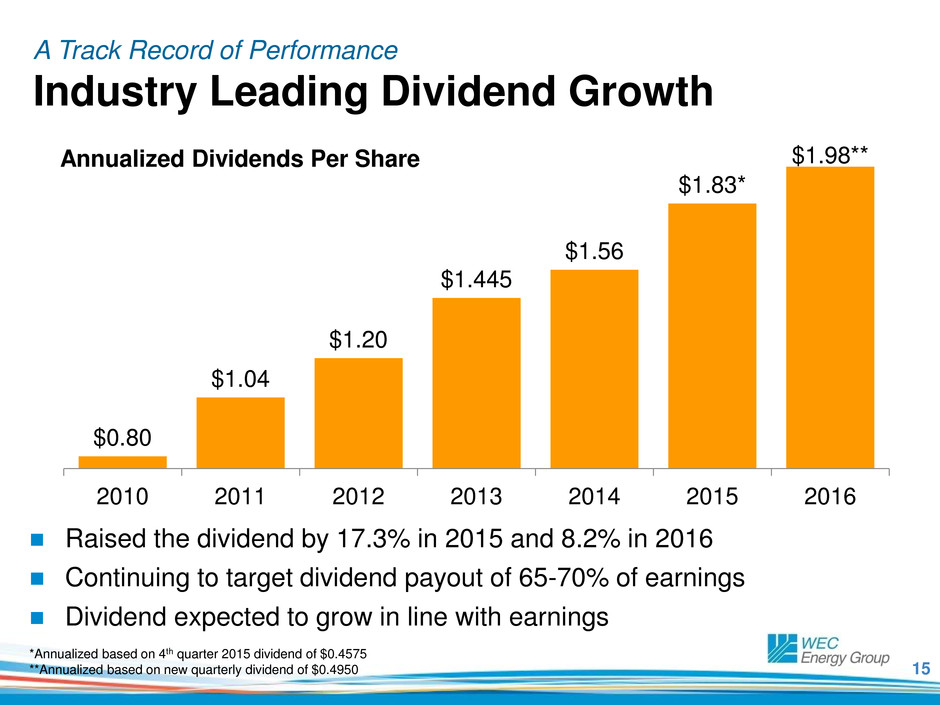
Raised the dividend by 17.3% in 2015 and 8.2% in 2016
Continuing to target dividend payout of 65-70% of earnings
Dividend expected to grow in line with earnings
*Annualized based on 4th quarter 2015 dividend of $0.4575
**Annualized based on new quarterly dividend of $0.4950
Annualized Dividends Per Share
$0.80
$1.04
$1.20
$1.445
$1.56
$1.83*
$1.98**
2010 2011 2012 2013 2014 2015 2016
16
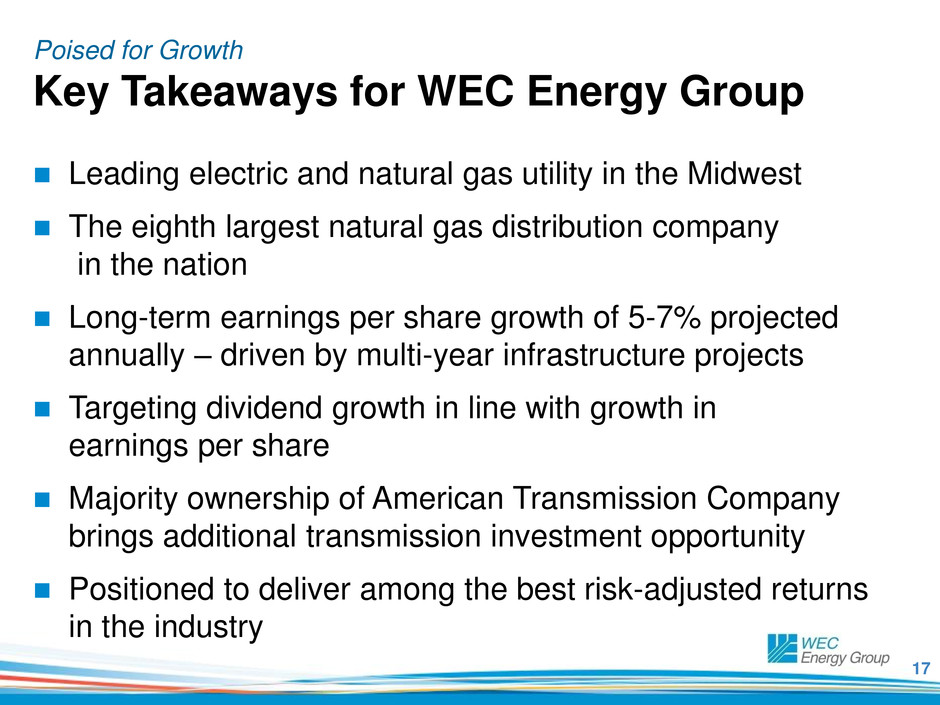
A Track Record of Performance
Industry Leading Total Shareholder Returns
-50%
0%
50%
100%
150%
200%
250%
300%
One Year Three Year Five Year Ten Year
WEC
S&P Utilities Index
S&P Electric Index
Philadelphia Utility Index
Dow Jones Utilities Average
Annualized returns for periods ending 12/31/15
Source: Bloomberg data assumes all dividends were reinvested and returns were compounded daily
254.8%
17
Poised for Growth
Key Takeaways for WEC Energy Group
Leading electric and natural gas utility in the Midwest
The eighth largest natural gas distribution company
in the nation
Long-term earnings per share growth of 5-7% projected
annually – driven by multi-year infrastructure projects
Targeting dividend growth in line with growth in
earnings per share
Majority ownership of American Transmission Company
brings additional transmission investment opportunity
Positioned to deliver among the best risk-adjusted returns
in the industry
Appendix
19
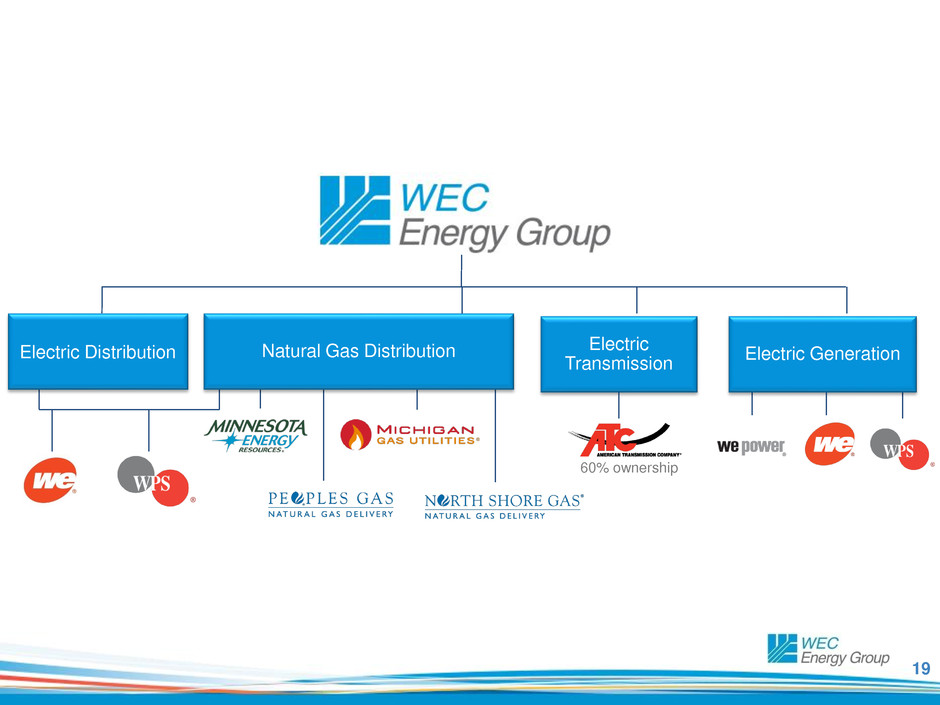
Electric Distribution Electric
Transmission
60% ownership
Natural Gas Distribution Electric Generation
20
Strategic Rationale
Transaction Overview
WEC Energy group formed in 2015 when Wisconsin Energy
acquired Integrys in a transaction valued at $9 billion
Acquisition created the leading electric and natural gas
utility in the Midwest
Meets or exceeds WEC’s acquisition criteria
Accretive to earnings per share starting in first full calendar year of
combined operations
Largely credit neutral
Long-term growth prospects of combined entity equal to or greater than
stand-alone company
21
An “Earn and Return” Company with a Low Risk Profile
Well Positioned for the Future
Diversified across four state jurisdictions
and FERC
Strong financial condition
Top-tier record of producing shareholder
value
Strong, experienced management
Larger transmission
and gas business
No required equity
issuances
Attractive EPS
growth potential
Continued strong
dividend growth
potential
22
Major Construction Projects
Delivering the Future
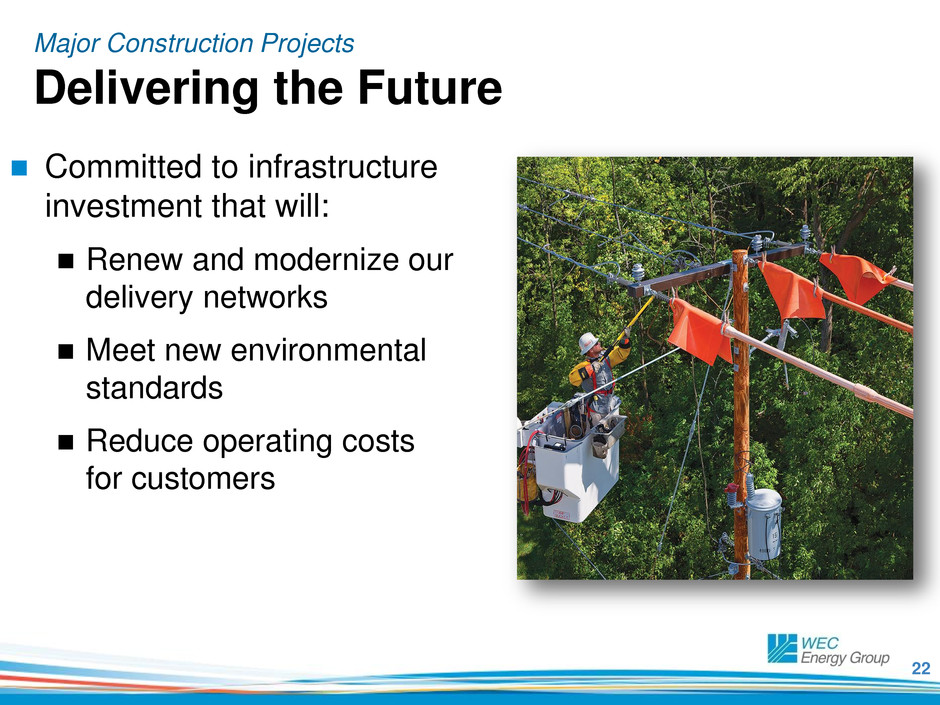
Committed to infrastructure
investment that will:
Renew and modernize our
delivery networks
Meet new environmental
standards
Reduce operating costs
for customers
23
Major Construction Projects - Wisconsin Public Service
System Modernization and Reliability Project
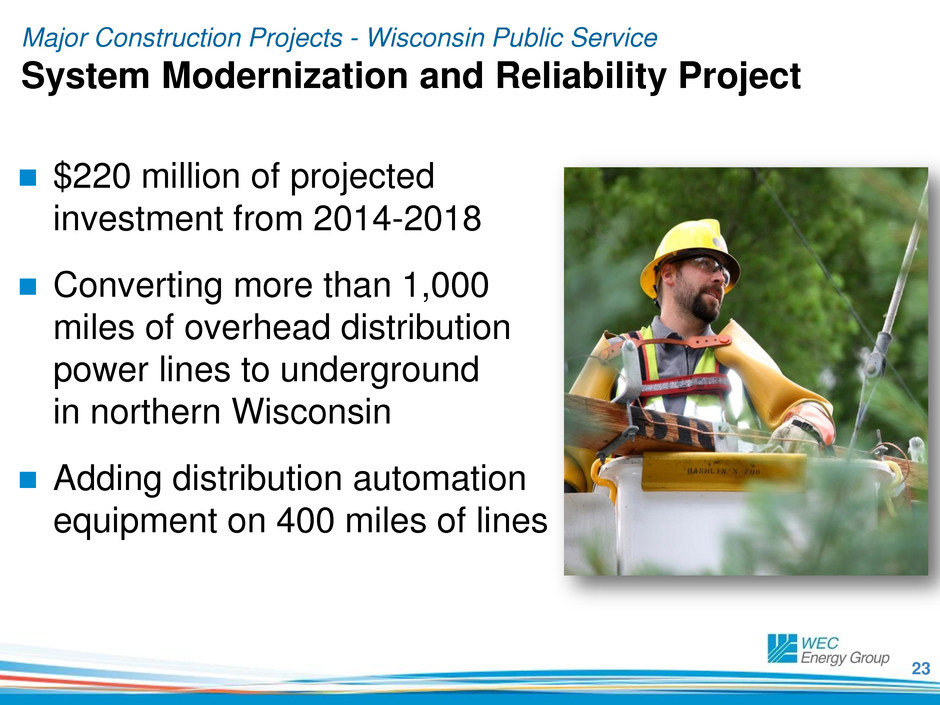
$220 million of projected
investment from 2014-2018
Converting more than 1,000
miles of overhead distribution
power lines to underground
in northern Wisconsin
Adding distribution automation
equipment on 400 miles of lines
24
Major Construction Projects – Peoples Gas
Advanced Main Replacement Project
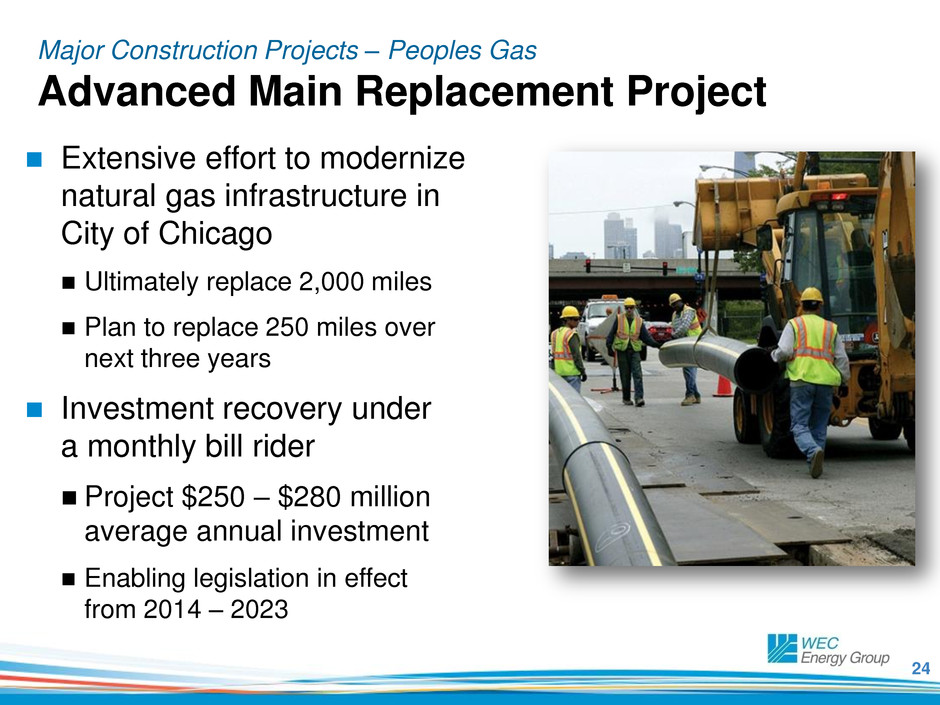
Extensive effort to modernize
natural gas infrastructure in
City of Chicago
Ultimately replace 2,000 miles
Plan to replace 250 miles over
next three years
Investment recovery under
a monthly bill rider
Project $250 – $280 million
average annual investment
Enabling legislation in effect
from 2014 – 2023
25
Major Construction Projects – We Energies
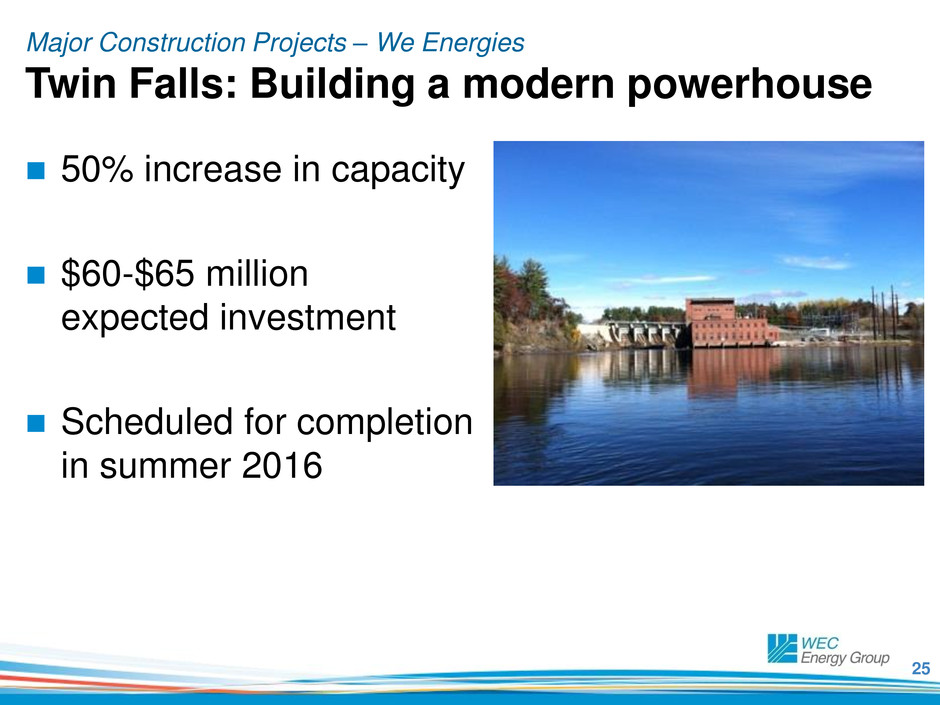
Twin Falls: Building a modern powerhouse
50% increase in capacity
$60-$65 million
expected investment
Scheduled for completion
in summer 2016
26
Major Construction Projects – We Power
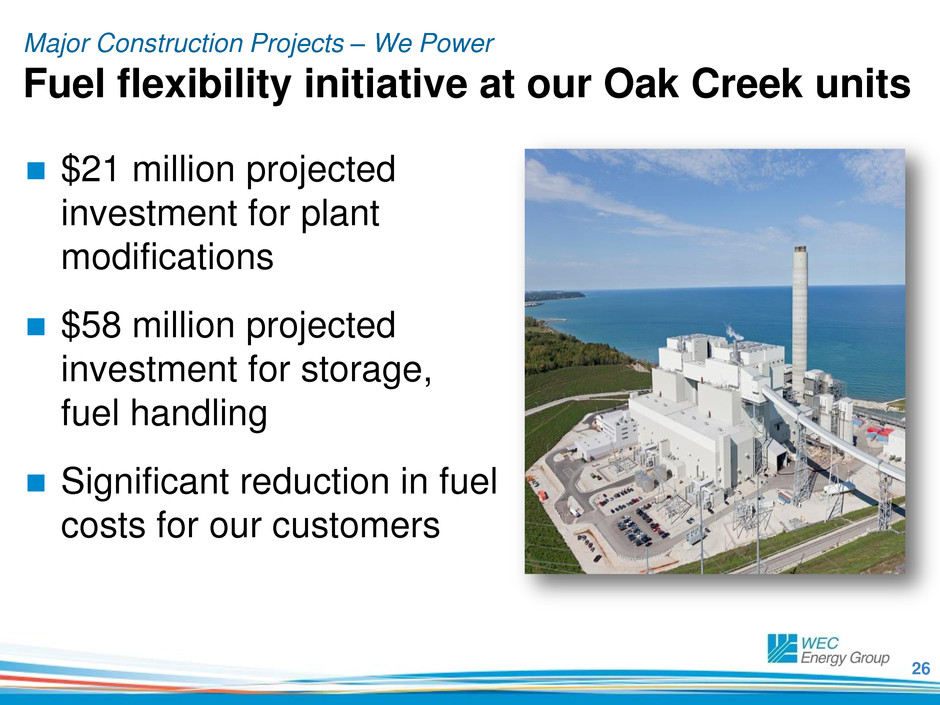
Fuel flexibility initiative at our Oak Creek units
$21 million projected
investment for plant
modifications
$58 million projected
investment for storage,
fuel handling
Significant reduction in fuel
costs for our customers
27
Well Positioned for the Future
State-of-the-Art Generation Fleet
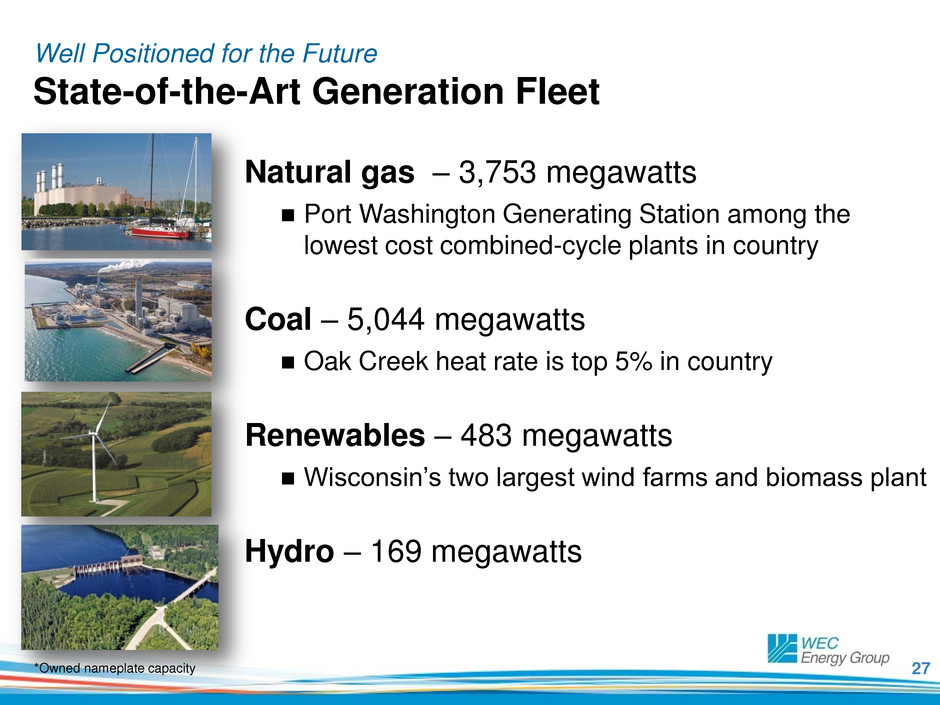
Natural gas – 3,753 megawatts
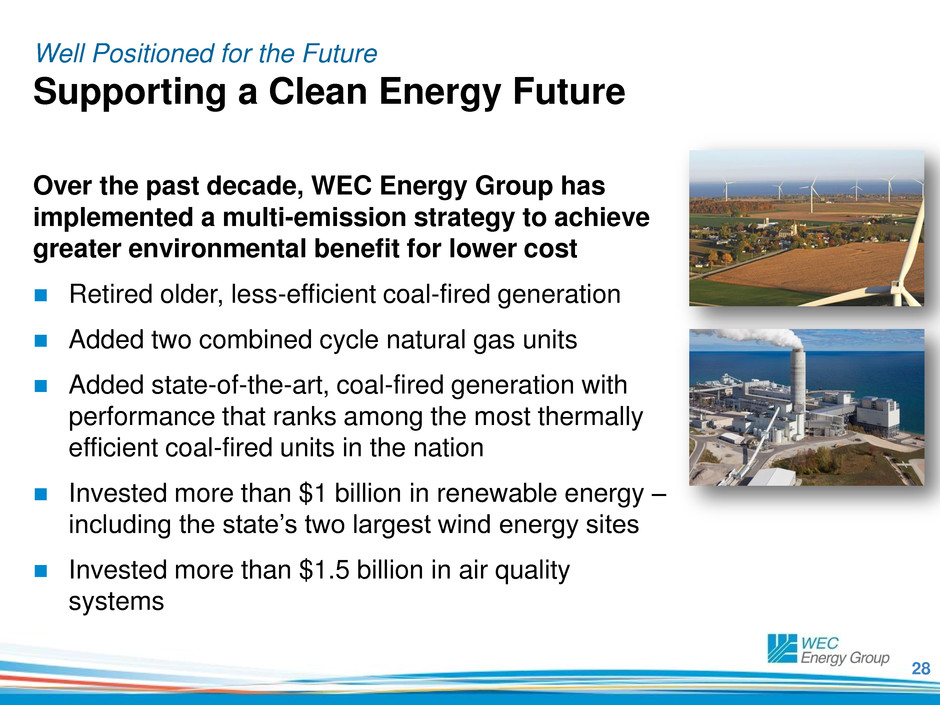
Port Washington Generating Station among the
lowest cost combined-cycle plants in country
Coal – 5,044 megawatts
Oak Creek heat rate is top 5% in country
Renewables – 483 megawatts
Wisconsin’s two largest wind farms and biomass plant
Hydro – 169 megawatts
*Owned nameplate capacity
28
Well Positioned for the Future
Supporting a Clean Energy Future
Over the past decade, WEC Energy Group has
implemented a multi-emission strategy to achieve
greater environmental benefit for lower cost
Retired older, less-efficient coal-fired generation
Added two combined cycle natural gas units
Added state-of-the-art, coal-fired generation with
performance that ranks among the most thermally
efficient coal-fired units in the nation
Invested more than $1 billion in renewable energy –
including the state’s two largest wind energy sites
Invested more than $1.5 billion in air quality
systems
29
Reducing Emissions
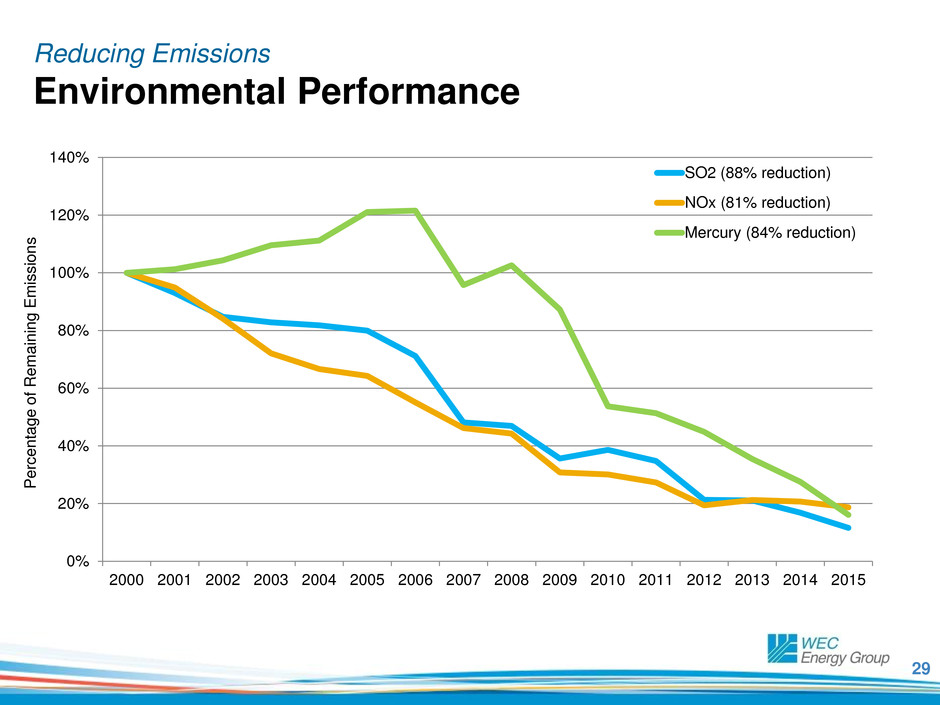
Environmental Performance
0%
20%
40%
60%
80%
100%
120%
140%
2000 2001 2002 2003 2004 2005 2006 2007 2008 2009 2010 2011 2012 2013 2014 2015
SO2 (88% reduction)
NOx (81% reduction)
Mercury (84% reduction)
P
e
rce
n
ta
g
e
o
f
Re
m
a
ini
n
g
E
m
iss
io
n
s
P
e
rce
n
ta
g
e
o
f
Re
m
a
ini
n
g
E
m
iss
io
n
s
30
Planning for Carbon Regulations
0%
20%
40%
60%
80%
100%
120%
2
0
0
0
2
0
0
1
2
0
0
2
2
0
0
3
2
0
0
4
2
0
0
5
2
0
0
6
2
0
0
7
2
0
0
8
2
0
0
9
2
0
1
0
2
0
1
1
2
0
1
2
2
0
1
3
2
0
1
4
2
0
1
5
P
erce
n
ta
g
e
C
omp
a
red
t
o
2
0
0
0
L
e
v
el
s
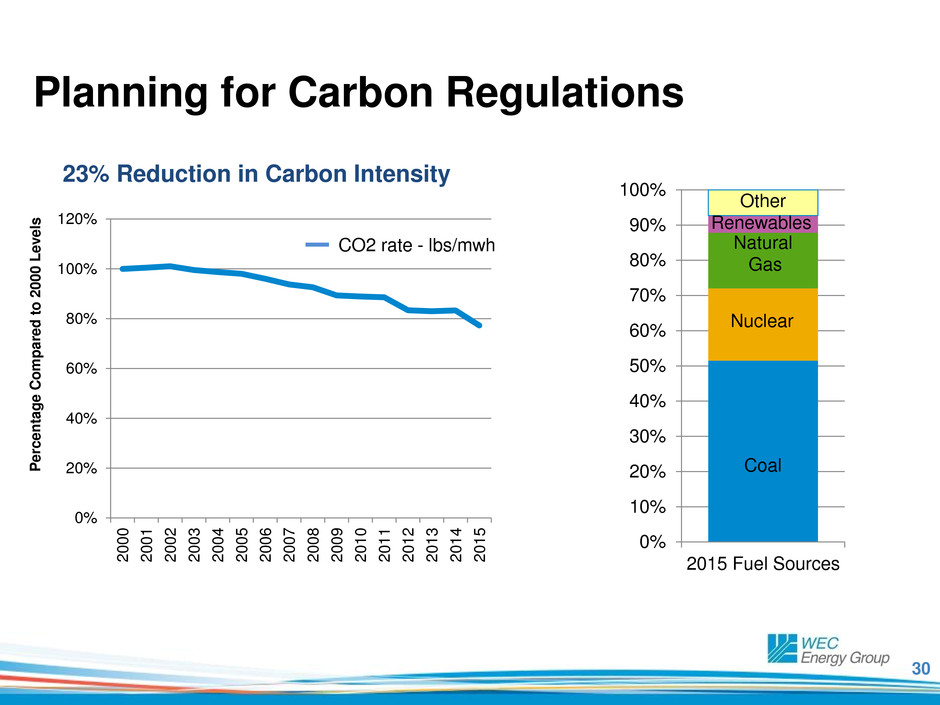
CO2 rate - lbs/mwh
23% Reduction in Carbon Intensity
0%
10%
20%
30%
40%
50%
60%
70%
80%
90%
100%
2015 Fuel Sources
Coal
Nuclear
Natural
Gas
Renewables
Other
31
EPA’s Clean Power Plan
Plan calls for Wisconsin to reduce CO2 emissions by 41%
Approximately two-thirds of the reductions must be
achieved by 2022
Stay by U.S. Supreme Court introduces delay and
additional uncertainty
32
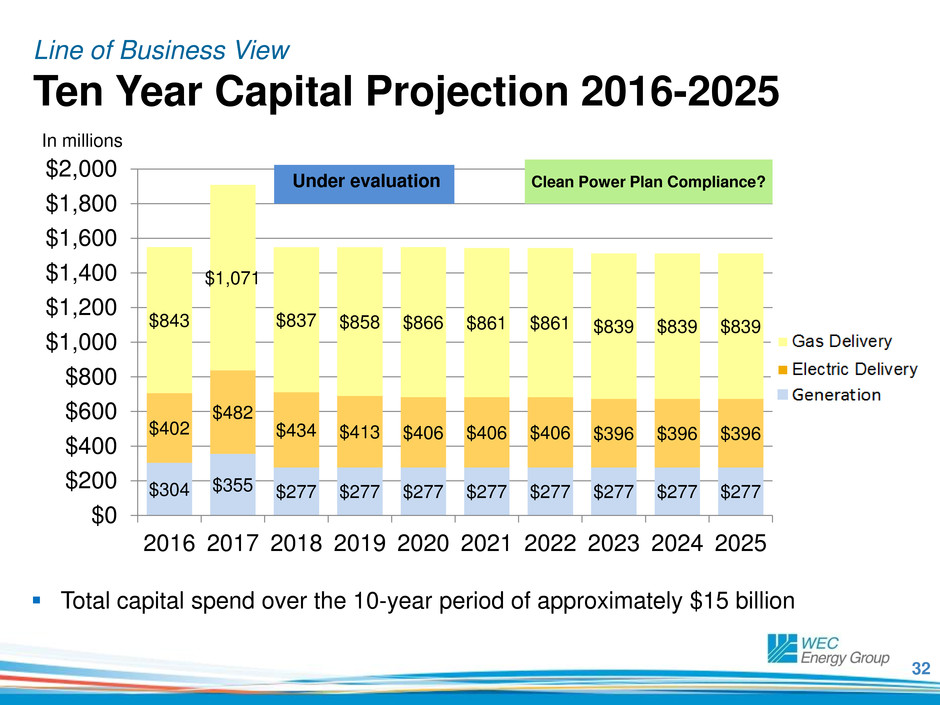
Line of Business View
Ten Year Capital Projection 2016-2025
$304 $355 $277 $277 $277 $277 $277 $277 $277 $277
$402
$482
$434 $413 $406 $406 $406 $396 $396 $396
$843
$1,071
$837 $858 $866 $861 $861 $839 $839 $839
$0
$200
$400
$600
$800
$1,000
$1,200
$1,400
$1,600
$1,800
$2,000
2016 2017 2018 2019 2020 2021 2022 2023 2024 2025
In millions
Total capital spend over the 10-year period of approximately $15 billion
Clean Power Plan Compliance? Under evaluation
33
0
20
40
60
80
100
120
AA - A A- BBB+ BBB BBB- Below
Investment
Grade
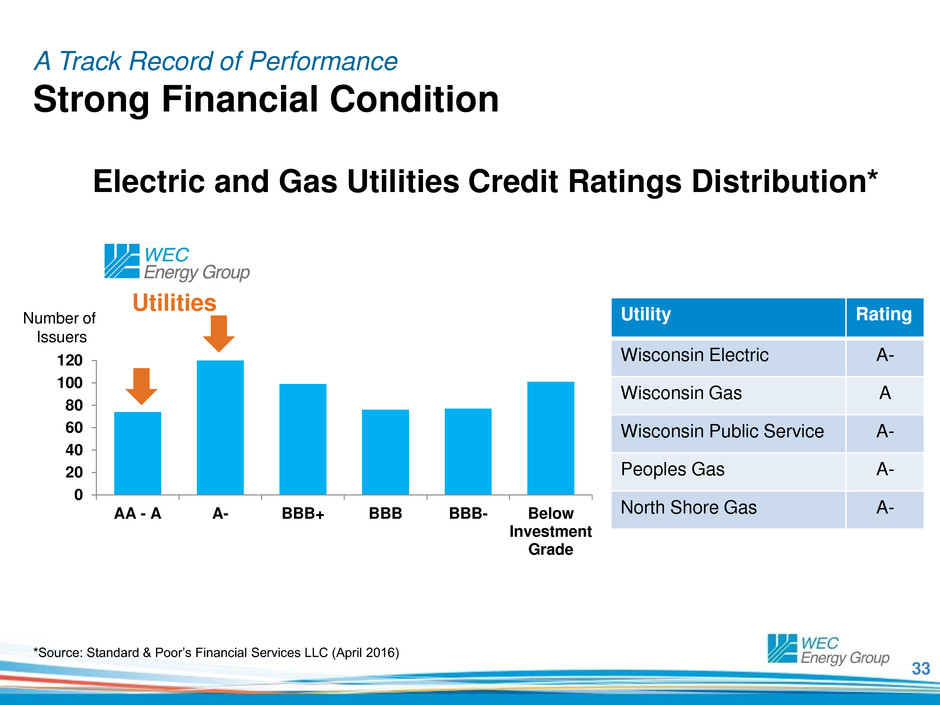
A Track Record of Performance
Strong Financial Condition
Number of
Issuers
*Source: Standard & Poor’s Financial Services LLC (April 2016)
Utilities
Electric and Gas Utilities Credit Ratings Distribution*
Utility Rating
Wisconsin Electric A-
Wisconsin Gas A
Wisconsin Public Service A-
Peoples Gas A-
North Shore Gas A-
34
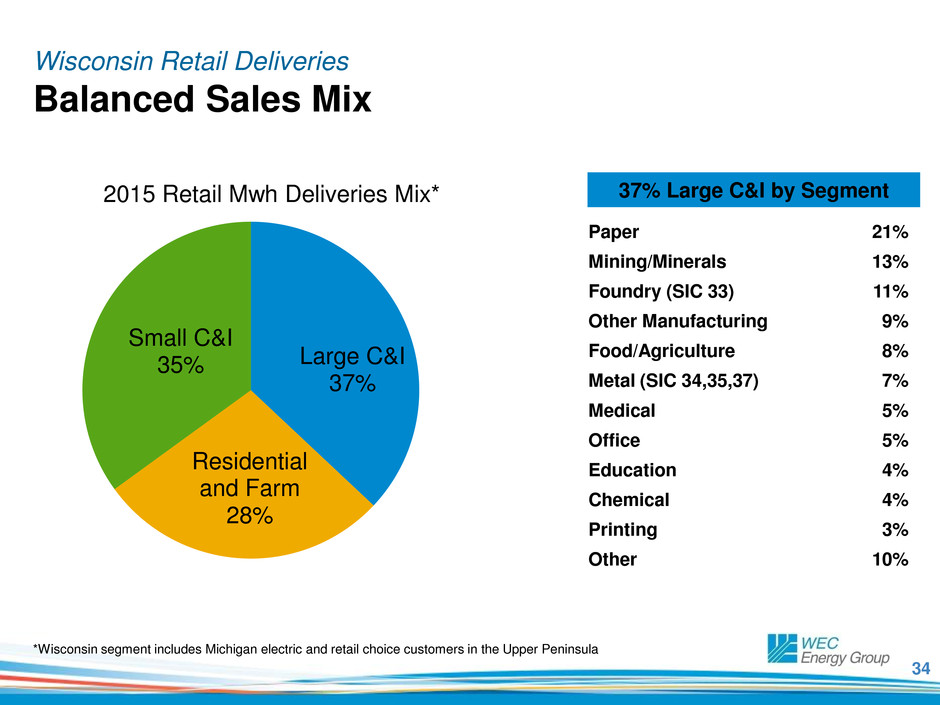
Paper 21%
Mining/Minerals 13%
Foundry (SIC 33) 11%
Other Manufacturing 9%
Food/Agriculture 8%
Metal (SIC 34,35,37) 7%
Medical 5%
Office 5%
Education 4%
Chemical 4%
Printing 3%
Other 10%
37% Large C&I by Segment
Wisconsin Retail Deliveries
Balanced Sales Mix
Large C&I
37%
Residential
and Farm
28%
Small C&I
35%
2015 Retail Mwh Deliveries Mix*
*Wisconsin segment includes Michigan electric and retail choice customers in the Upper Peninsula
35
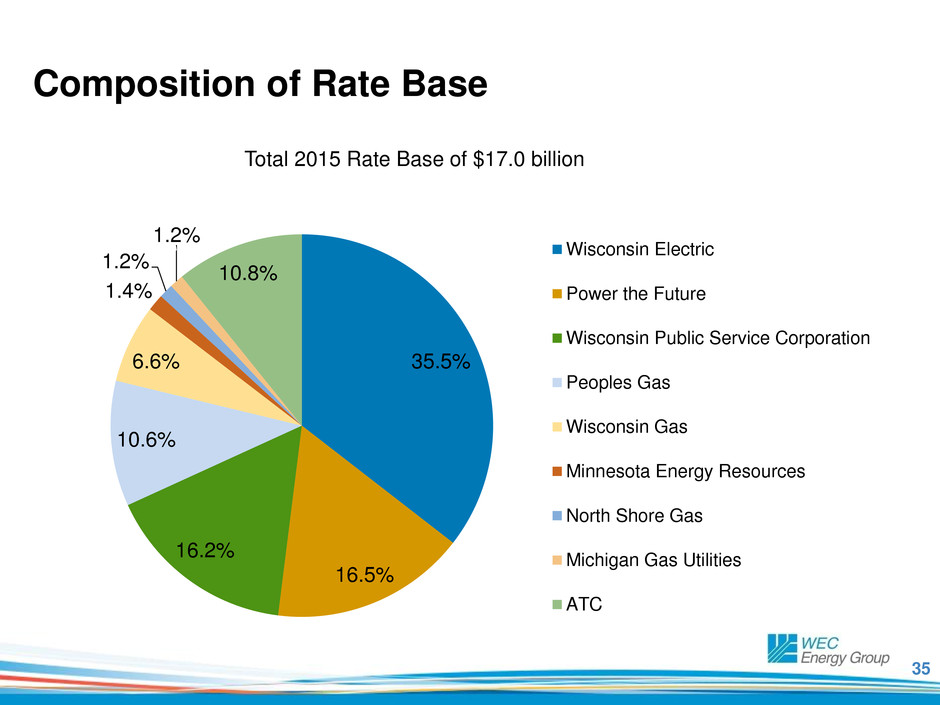
35.5%
16.5%
16.2%
10.6%
6.6%
1.4%
1.2%
1.2%
10.8%
Wisconsin Electric
Power the Future
Wisconsin Public Service Corporation
Peoples Gas
Wisconsin Gas
Minnesota Energy Resources
North Shore Gas
Michigan Gas Utilities
ATC
Composition of Rate Base
Total 2015 Rate Base of $17.0 billion
36
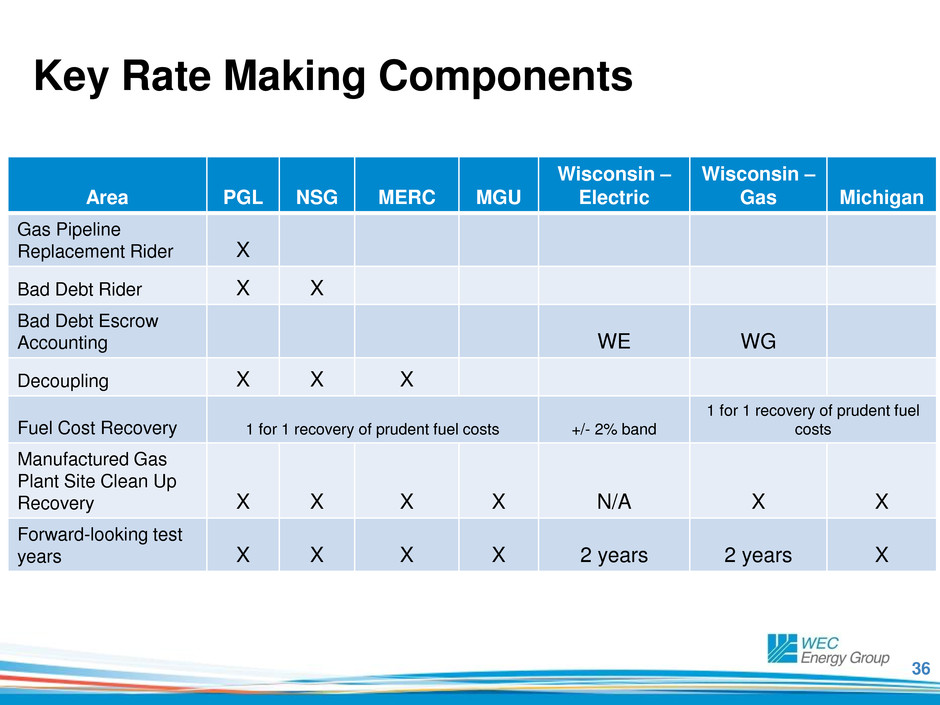
Key Rate Making Components
Area PGL NSG MERC MGU
Wisconsin –
Electric
Wisconsin –
Gas Michigan
Gas Pipeline
Replacement Rider X
Bad Debt Rider X X
Bad Debt Escrow
Accounting WE WG
Decoupling X X X
Fuel Cost Recovery 1 for 1 recovery of prudent fuel costs +/- 2% band
1 for 1 recovery of prudent fuel
costs
Manufactured Gas
Plant Site Clean Up
Recovery X X X X N/A X X
Forward-looking test
years X X X X 2 years 2 years X
37
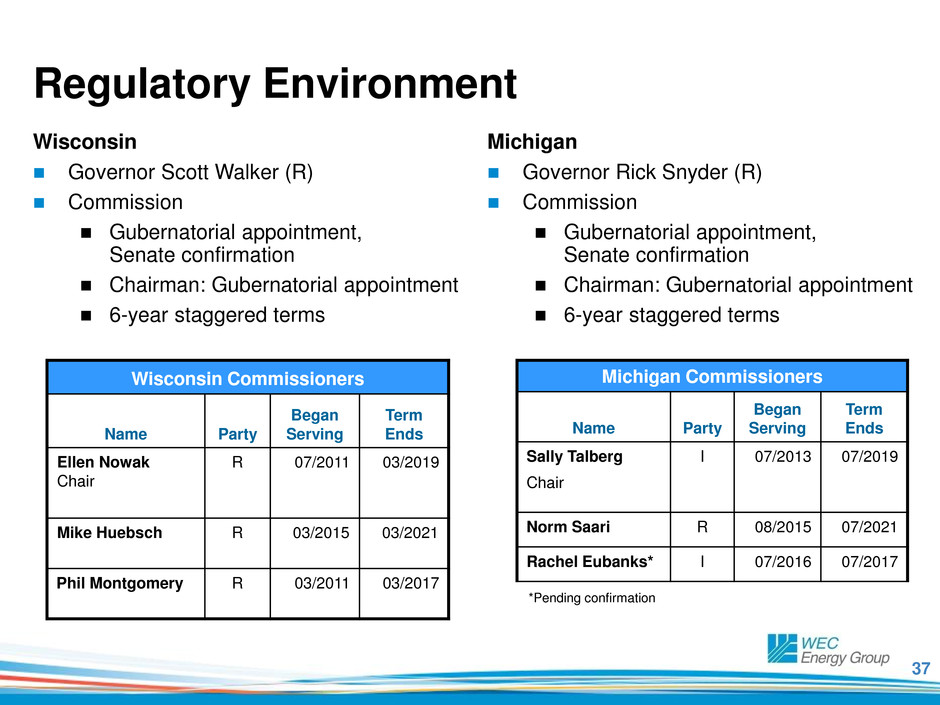
Regulatory Environment
Wisconsin
Governor Scott Walker (R)
Commission
Gubernatorial appointment,
Senate confirmation
Chairman: Gubernatorial appointment
6-year staggered terms
Michigan
Governor Rick Snyder (R)
Commission
Gubernatorial appointment,
Senate confirmation
Chairman: Gubernatorial appointment
6-year staggered terms
Wisconsin Commissioners
Name Party
Began
Serving
Term
Ends
Ellen Nowak
Chair
R 07/2011 03/2019
Mike Huebsch
R 03/2015 03/2021
Phil Montgomery
R 03/2011 03/2017
Michigan Commissioners
Name Party
Began
Serving
Term
Ends
Sally Talberg
Chair
I 07/2013 07/2019
Norm Saari R 08/2015 07/2021
Rachel Eubanks* I 07/2016 07/2017
*Pending confirmation
38
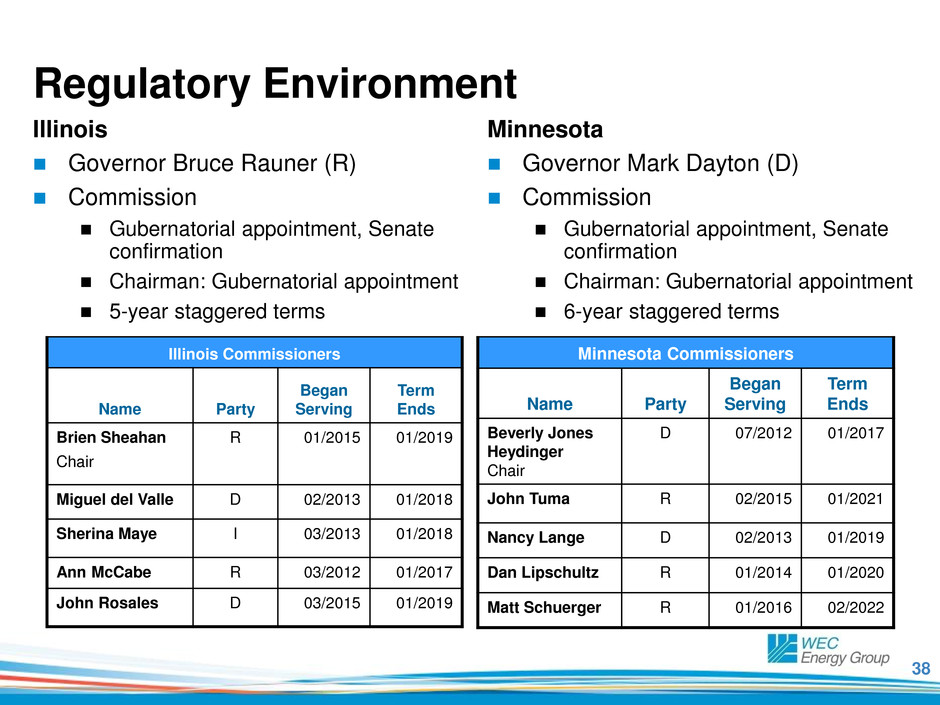
Regulatory Environment
Illinois
Governor Bruce Rauner (R)
Commission
Gubernatorial appointment, Senate
confirmation
Chairman: Gubernatorial appointment
5-year staggered terms
Minnesota
Governor Mark Dayton (D)
Commission
Gubernatorial appointment, Senate
confirmation
Chairman: Gubernatorial appointment
6-year staggered terms
Illinois Commissioners
Name Party
Began
Serving
Term
Ends
Brien Sheahan
Chair
R 01/2015 01/2019
Miguel del Valle D 02/2013 01/2018
Sherina Maye I 03/2013 01/2018
Ann McCabe R 03/2012 01/2017
John Rosales D 03/2015 01/2019
Minnesota Commissioners
Name Party
Began
Serving
Term
Ends
Beverly Jones
Heydinger
Chair
D 07/2012 01/2017
John Tuma R 02/2015 01/2021
Nancy Lange D 02/2013 01/2019
Dan Lipschultz R 01/2014 01/2020
Matt Schuerger R 01/2016 02/2022
39
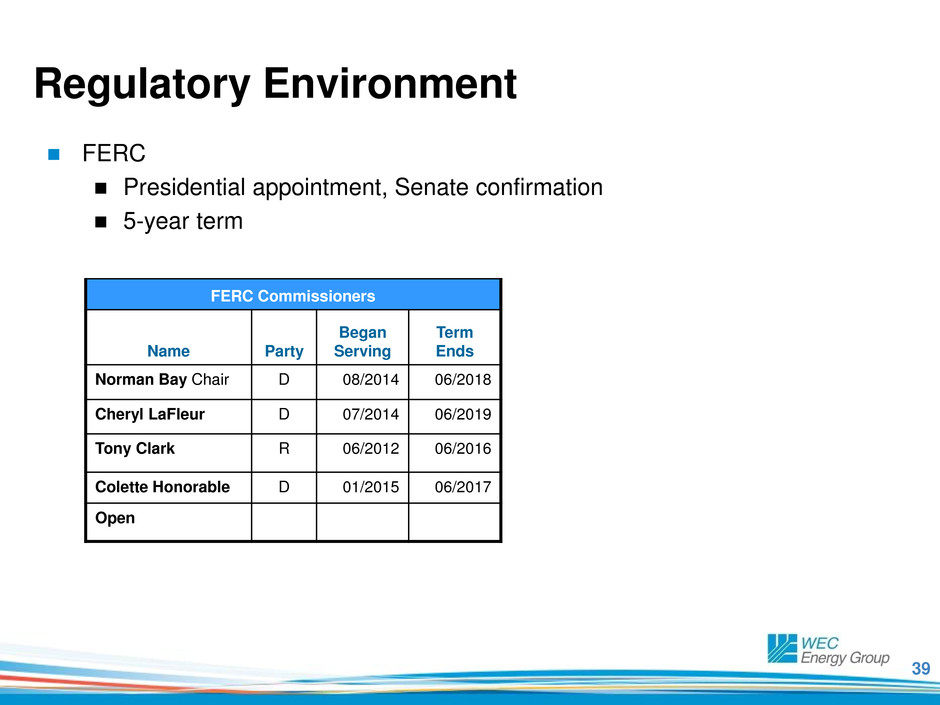
Regulatory Environment
FERC
Presidential appointment, Senate confirmation
5-year term
FERC Commissioners
Name Party
Began
Serving
Term
Ends
Norman Bay Chair D 08/2014 06/2018
Cheryl LaFleur D 07/2014 06/2019
Tony Clark R 06/2012 06/2016
Colette Honorable D 01/2015 06/2017
Open
40
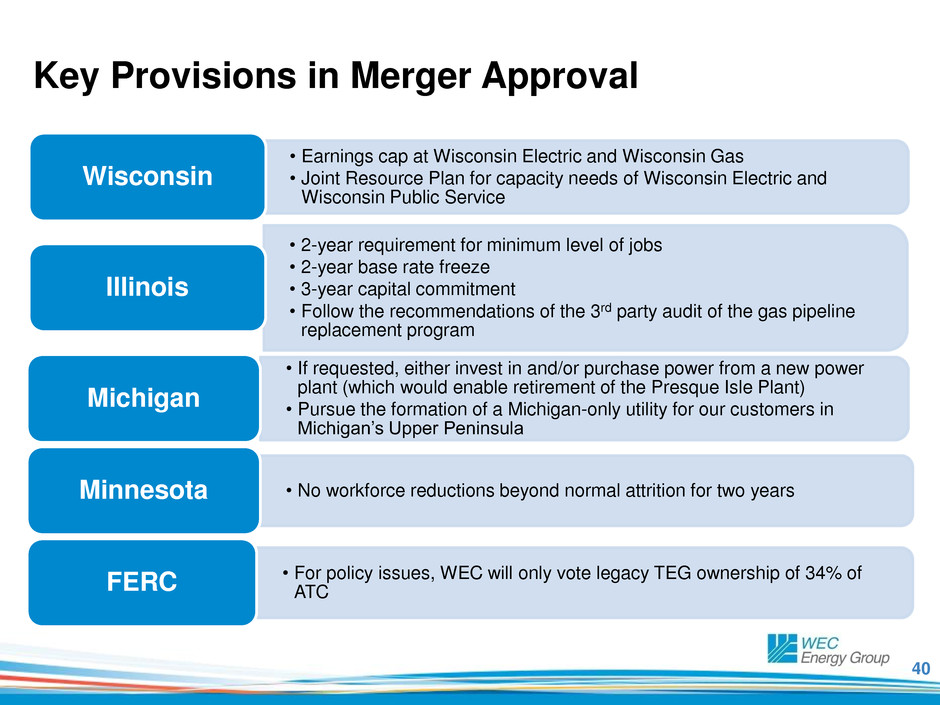
Key Provisions in Merger Approval
• Earnings cap at Wisconsin Electric and Wisconsin Gas
• Joint Resource Plan for capacity needs of Wisconsin Electric and
Wisconsin Public Service
Wisconsin
• 2-year requirement for minimum level of jobs
• 2-year base rate freeze
• 3-year capital commitment
• Follow the recommendations of the 3rd party audit of the gas pipeline
replacement program
Illinois
• If requested, either invest in and/or purchase power from a new power
plant (which would enable retirement of the Presque Isle Plant)
• Pursue the formation of a Michigan-only utility for our customers in
Michigan’s Upper Peninsula
Michigan
• No workforce reductions beyond normal attrition for two years Minnesota
• For policy issues, WEC will only vote legacy TEG ownership of 34% of
ATC FERC
41
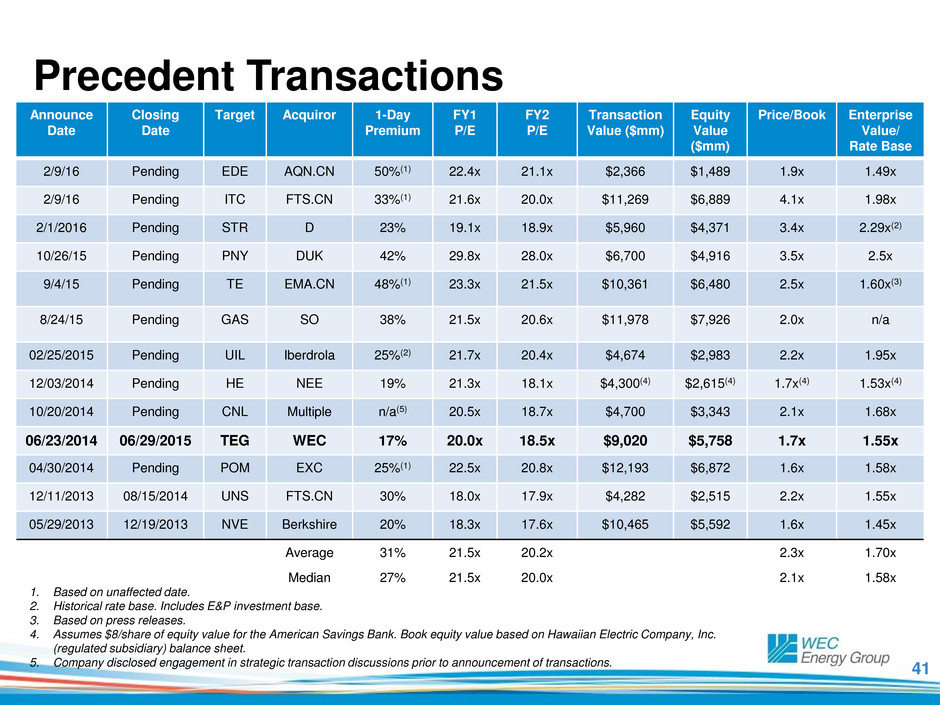
Precedent Transactions
Announce
Date
Closing
Date
Target Acquiror 1-Day
Premium
FY1
P/E
FY2
P/E
Transaction
Value ($mm)
Equity
Value
($mm)
Price/Book Enterprise
Value/
Rate Base
2/9/16 Pending EDE AQN.CN 50%(1) 22.4x 21.1x $2,366 $1,489 1.9x 1.49x
2/9/16 Pending ITC FTS.CN 33%(1) 21.6x 20.0x $11,269 $6,889 4.1x 1.98x
2/1/2016 Pending STR D 23% 19.1x 18.9x $5,960 $4,371 3.4x 2.29x(2)
10/26/15 Pending PNY DUK 42% 29.8x 28.0x $6,700 $4,916 3.5x 2.5x
9/4/15 Pending TE EMA.CN 48%(1)
23.3x 21.5x $10,361 $6,480 2.5x 1.60x(3)
8/24/15 Pending GAS SO 38%
21.5x 20.6x $11,978 $7,926 2.0x n/a
02/25/2015 Pending UIL Iberdrola 25%(2) 21.7x 20.4x $4,674 $2,983 2.2x 1.95x
12/03/2014 Pending HE NEE 19% 21.3x 18.1x $4,300(4) $2,615(4) 1.7x(4) 1.53x(4)
10/20/2014 Pending CNL Multiple n/a(5) 20.5x 18.7x $4,700 $3,343 2.1x 1.68x
06/23/2014 06/29/2015 TEG WEC 17% 20.0x 18.5x $9,020 $5,758 1.7x 1.55x
04/30/2014 Pending POM EXC 25%(1) 22.5x 20.8x $12,193 $6,872 1.6x 1.58x
12/11/2013 08/15/2014 UNS FTS.CN 30% 18.0x 17.9x $4,282 $2,515 2.2x 1.55x
05/29/2013 12/19/2013 NVE Berkshire 20% 18.3x 17.6x $10,465 $5,592 1.6x 1.45x
Average 31% 21.5x 20.2x 2.3x 1.70x
Median 27% 21.5x 20.0x 2.1x 1.58x
1. Based on unaffected date.
2. Historical rate base. Includes E&P investment base.
3. Based on press releases.
4. Assumes $8/share of equity value for the American Savings Bank. Book equity value based on Hawaiian Electric Company, Inc.
(regulated subsidiary) balance sheet.
5. Company disclosed engagement in strategic transaction discussions prior to announcement of transactions.
42
Contact Information
M. Beth Straka
Senior Vice President – Investor Relations and Corporate Communications
Beth.Straka@wecenergygroup.com
414-221-4639
Colleen Henderson
Manager – Investor Relations
Colleen.Henderson@wecenergygroup.com
414-221-2592
