Attached files
| file | filename |
|---|---|
| 8-K - 8-K - HEALTHCARE TRUST OF AMERICA, INC. | a201607078-k.htm |

ANNUAL MEETING OF SHAREHOLDERS
July 7, 2016
www.htareit.com
NYSE: HTA
Exhibit 99.1

FORWARD LOOKING STATEMENTS
This document contains both historical and forward-looking statements. Forward-looking statements are based on current expectations, plans, estimates,
assumptions and beliefs, including expectations, plans, estimates, assumptions and beliefs about our company, the real estate industry and the debt and equity
capital markets. All statements other than statements of historical fact are, or may be deemed to be, forward-looking statements within the meaning of Section
27A of the Securities Act of 1933, as amended, and Section 21E of the Securities Exchange Act of 1934, as amended.
Forward-looking statements include information concerning possible or assumed future results of operations of our company. The forward-looking statements
included in this document are subject to numerous risks and uncertainties that could cause actual results to differ materially from those expressed or implied in
the forward-looking statements. Assumptions relating to the foregoing involve judgments with respect to, among other things, future economic, competitive and
market conditions and future business decisions, all of which are difficult or impossible to predict accurately and many of which are beyond our control. Although
we believe that the expectations reflected in such forward-looking statements are based on reasonable assumptions, our actual results and performance could
differ materially from those set forth in the forward-looking statements. Factors which could have a material adverse effect on our operations and future prospects
include, but are not limited to: changes in economic conditions affecting the healthcare property sector, the commercial real estate market and the credit market;
competition for acquisition of medical office buildings and other facilities that serve the healthcare industry; economic fluctuations in certain states in which our
property investments are geographically concentrated; retention of our senior management team; financial stability and solvency of our tenants; supply and
demand for operating properties in the market areas in which we operate; our ability to acquire properties, and to successfully operate those properties once
acquired; changes in property taxes; legislative and regulatory changes, including changes to laws governing the taxation of REITs and changes to laws governing
the healthcare industry; fluctuations in reimbursements from third party payors such as Medicare and Medicaid; changes in interest rates; the availability of capital
and financing; restrictive covenants in our credit facilities; changes in our credit ratings; our ability to remain qualified as a REIT; and the risk factors set forth in our
2015 Annual Report on Form 10-K filed on February 22, 2016.
Forward-looking statements speak only as of the date made. Except as otherwise required by the federal securities laws, we undertake no obligation to update any
forward-looking statements to reflect the events or circumstances arising after the date as of which they are made. As a result of these risks and uncertainties,
readers are cautioned not to place undue reliance on the forward looking statements included in this document or that may be made elsewhere from time to time
by, or on behalf of, us.
For definitions of terms and reconciliations for certain financial measures disclosed herein, including, but not limited to, funds from operations (FFO), normalized
funds from operations (normalized FFO), funds available for distribution (FAD), normalized funds available for distribution (normalized FAD), annualized base rents,
net operating income (NOI), cash net operating income (cash NOI), same-property cash NOI, adjusted earnings before interest, taxes, depreciation and
amortization (adjusted EBITDA), on-campus/aligned, and tenant retention, please see our company’s earnings press release issued on April 25, 2016 and our
company’s Supplemental Financial Package for the quarter ended March 31, 2016, each of which is available in the investor relations section of our company’s
website located at www.htareit.com.
1 www.htareit.com Annual Meeting of Stockholders | July 7, 2016

HEALTHCARE TRUST OF AMERICA (NYSE: HTA)
Largest Dedicated Owner of Medical Office For The Future of Healthcare
2 www.htareit.com Annual Meeting of Stockholders | July 7, 2016
1 Through April 2016
3 Shareholder returns from January 1, 2007 through May 31, 2016
All data as of March 31, 2016 unless otherwise stated
67%
Outpatient Real Estate Portfolio
(% of GLA)
Key Market Focus – Top 10
(% of Invested $)
Hospital
Campus
4.0%
4.0%
4.4%
4.5%
4.5%
4.8%
5.4%
5.7%
6.4%
9.8%
Atlanta, GA
Indianapolis, IN
Miami, FL
Albany, NY
Greenville, SC
Phoenix, AZ
Houston, TX
Dallas, TX
Hartford/New Haven, CT
Boston, MA
On-Campus/ Adjacent
33%
Core Community
Outpatient Academic
Med Center
61%
6%
33%
FOUNDED IN 2006 – EXPERIENCED MANANGEMENT
AND BOD DRIVING 10 YEARS OF VALUE CREATION
MOBs: CORE-CRITICAL REAL ESTATE WITH
HEALTHCARE TAILWINDS
PORTFOLIO SERVING THE FUTURE OF HEALTHCARE;
KEY MARKET CONCENTRATIONS
DEDICATED OPERATING PLATFORM DRIVES
CONSISTENT PERFORMANCE
PRUDENT GROWTH:
SCALABLE BUSINESS IN FRAGMENTED SECTOR
INVESTMENT GRADE COMPANY: CONSERVATIVE &
POSITIONED FOR GROWTH
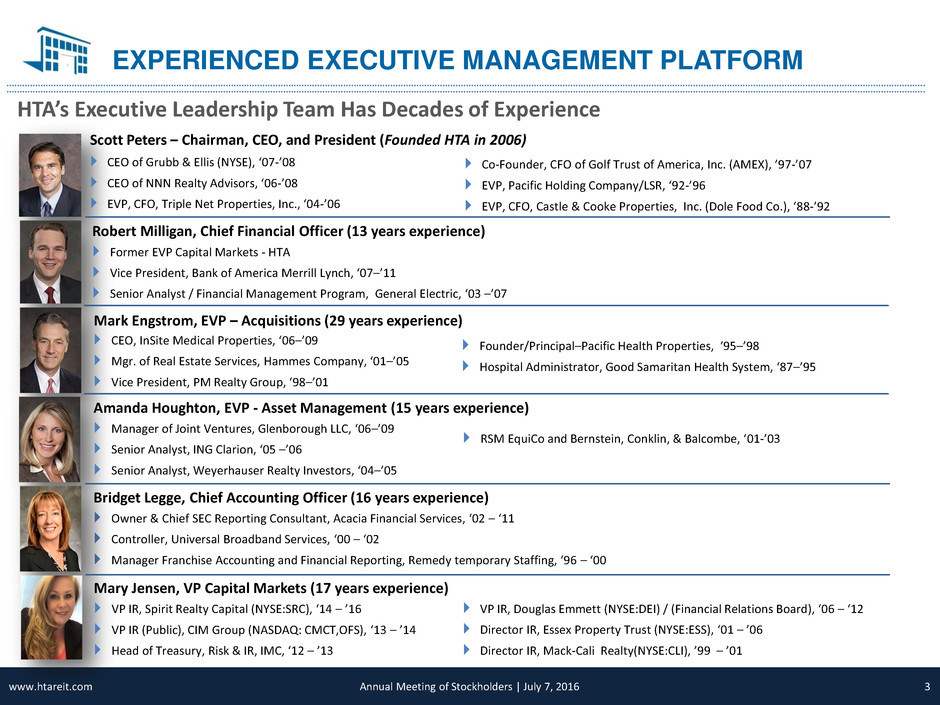
EXPERIENCED EXECUTIVE MANAGEMENT PLATFORM
Scott Peters – Chairman, CEO, and President (Founded HTA in 2006)
CEO of Grubb & Ellis (NYSE), ‘07-’08
CEO of NNN Realty Advisors, ‘06-’08
EVP, CFO, Triple Net Properties, Inc., ‘04-’06
Mark Engstrom, EVP – Acquisitions (29 years experience)
CEO, InSite Medical Properties, ‘06–’09
Mgr. of Real Estate Services, Hammes Company, ‘01–’05
Vice President, PM Realty Group, ‘98–’01
Amanda Houghton, EVP - Asset Management (15 years experience)
Manager of Joint Ventures, Glenborough LLC, ‘06–’09
Senior Analyst, ING Clarion, ‘05 –’06
Senior Analyst, Weyerhauser Realty Investors, ‘04–’05
Robert Milligan, Chief Financial Officer (13 years experience)
Former EVP Capital Markets - HTA
Vice President, Bank of America Merrill Lynch, ‘07–’11
Senior Analyst / Financial Management Program, General Electric, ‘03 –’07
Co-Founder, CFO of Golf Trust of America, Inc. (AMEX), ’97-’07
EVP, Pacific Holding Company/LSR, ‘92-’96
EVP, CFO, Castle & Cooke Properties, Inc. (Dole Food Co.), ‘88-’92
Founder/Principal–Pacific Health Properties, ‘95–’98
Hospital Administrator, Good Samaritan Health System, ‘87–’95
RSM EquiCo and Bernstein, Conklin, & Balcombe, ‘01-’03
HTA’s Executive Leadership Team Has Decades of Experience
3 www.htareit.com Annual Meeting of Stockholders | July 7, 2016
Bridget Legge, Chief Accounting Officer (16 years experience)
Owner & Chief SEC Reporting Consultant, Acacia Financial Services, ‘02 – ‘11
Controller, Universal Broadband Services, ‘00 – ‘02
Manager Franchise Accounting and Financial Reporting, Remedy temporary Staffing, ‘96 – ‘00
Mary Jensen, VP Capital Markets (17 years experience)
VP IR, Spirit Realty Capital (NYSE:SRC), ‘14 – ’16
VP IR (Public), CIM Group (NASDAQ: CMCT,OFS), ‘13 – ’14
Head of Treasury, Risk & IR, IMC, ‘12 – ’13
VP IR, Douglas Emmett (NYSE:DEI) / (Financial Relations Board), ‘06 – ‘12
Director IR, Essex Property Trust (NYSE:ESS), ‘01 – ’06
Director IR, Mack-Cali Realty(NYSE:CLI), ’99 – ’01
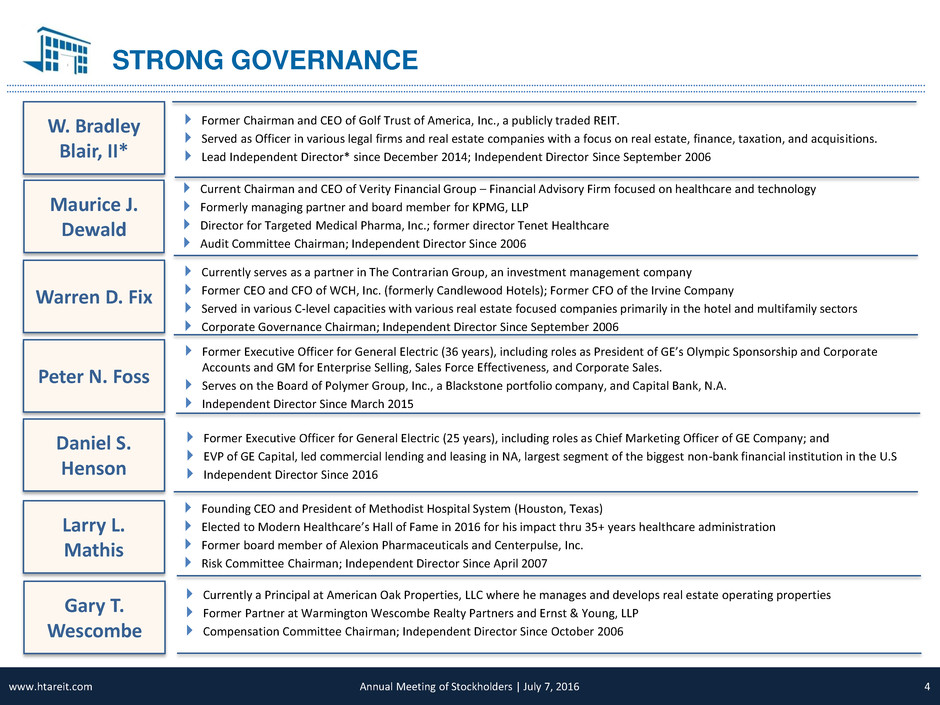
STRONG GOVERNANCE
Former Chairman and CEO of Golf Trust of America, Inc., a publicly traded REIT.
Served as Officer in various legal firms and real estate companies with a focus on real estate, finance, taxation, and acquisitions.
Lead Independent Director* since December 2014; Independent Director Since September 2006
W. Bradley
Blair, II*
Current Chairman and CEO of Verity Financial Group – Financial Advisory Firm focused on healthcare and technology
Formerly managing partner and board member for KPMG, LLP
Director for Targeted Medical Pharma, Inc.; former director Tenet Healthcare
Audit Committee Chairman; Independent Director Since 2006
Maurice J.
Dewald
Former Executive Officer for General Electric (25 years), including roles as Chief Marketing Officer of GE Company; and
EVP of GE Capital, led commercial lending and leasing in NA, largest segment of the biggest non-bank financial institution in the U.S
Independent Director Since 2016
Daniel S.
Henson
Currently serves as a partner in The Contrarian Group, an investment management company
Former CEO and CFO of WCH, Inc. (formerly Candlewood Hotels); Former CFO of the Irvine Company
Served in various C-level capacities with various real estate focused companies primarily in the hotel and multifamily sectors
Corporate Governance Chairman; Independent Director Since September 2006
Warren D. Fix
Founding CEO and President of Methodist Hospital System (Houston, Texas)
Elected to Modern Healthcare’s Hall of Fame in 2016 for his impact thru 35+ years healthcare administration
Former board member of Alexion Pharmaceuticals and Centerpulse, Inc.
Risk Committee Chairman; Independent Director Since April 2007
Larry L.
Mathis
Currently a Principal at American Oak Properties, LLC where he manages and develops real estate operating properties
Former Partner at Warmington Wescombe Realty Partners and Ernst & Young, LLP
Compensation Committee Chairman; Independent Director Since October 2006
Gary T.
Wescombe
Former Executive Officer for General Electric (36 years), including roles as President of GE’s Olympic Sponsorship and Corporate
Accounts and GM for Enterprise Selling, Sales Force Effectiveness, and Corporate Sales.
Serves on the Board of Polymer Group, Inc., a Blackstone portfolio company, and Capital Bank, N.A.
Independent Director Since March 2015
Peter N. Foss
4 www.htareit.com Annual Meeting of Stockholders | July 7, 2016

A DECADE OF SHAREHOLDER VALUE CREATION
195% relative total Shareholder
return (1/1/07—6/30/16)
11.5% Average Total Returns Since
First Distribution
Individuals who invested $1,000
with HTA in 2006 have an
investment worth over $2,950 with
reinvested dividends at 6/30/16
Significantly outperformed the RMS
and the S&P 500
Outperformed US HC REIT Index
and Direct Peers
INDUSTRY-LEADING PERFORMANCE – POSITIONED FOR THE NEXT 10 YEARS
5 www.htareit.com Annual Meeting of Stockholders | July 7, 2016
-75%
-25%
25%
75%
125%
175%
2007 2008 2009 2010 2011 2012 2013 2014 2015 2016
HTA Total Returns Compared to Peers
(Since Inception)
HTA SNL HC REIT HR The Big 3: HCP, VTR, HCN
Big 3: 158%
HC REIT: 155%
HR: 74%
HTA: 195%
-75%
-25%
25%
75%
125%
175%
2007 2008 2009 2010 2011 2012 2013 2014 2015 2016
HTA Total Returns Compared to Market
(Since Inception)
HTA US REIT Index (RMS) S&P 500
HTA: 195%
S&P: 79%
RMS: 56%

CORE CRITCAL REAL ESTATE WITH HEALTHCARE TAILWINDS
Healthcare is Fastest Growing Sector of U.S.
Economy
Healthcare employment is growing 2x faster than
any other sector
10,000 people turning 65 every day (4x as many
physician visits as younger population)
The Affordable Care Act will add 25 to 35 million
newly insured individuals
Healthcare Expenditures Increasing to 20% of U.S.
GDP
Healthcare Moving to Cost-effective Outpatient
Locations
Focus on cost-effective care – private insurers &
government payors
Outpatient is the economically efficient location
Health systems & providers focused on
convenience – Serving patients where they are
Mt. Sinai: “If our Beds Are Full, We have Failed”
6 www.htareit.com
Hospitals have been facing limitations on expansion and as a result, more procedures are being performed in outpatient facilities
Insurance companies and government healthcare programs have been directing patients to less-costly outpatient care
0
Source: American Hospital Association
0
500
1,000
1,500
2,000
2,500
100
105
110
115
120
125
130
19
89
19
90
19
91
19
92
19
93
19
94
19
95
19
96
19
97
19
98
19
99
20
00
20
01
20
02
20
03
20
04
20
05
20
06
20
07
20
08
20
09
20
10
20
11
20
12
OUTPATIENT VISITS ARE INCREASING OVER TIME
Inpatient Admissions/1000 Persons Outpatient Visits/1000 Persons
INPATIENT OUTPATIENT
OUTPATIENT TRENDS INCREASING
Annual Meeting of Stockholders | July 7, 2016
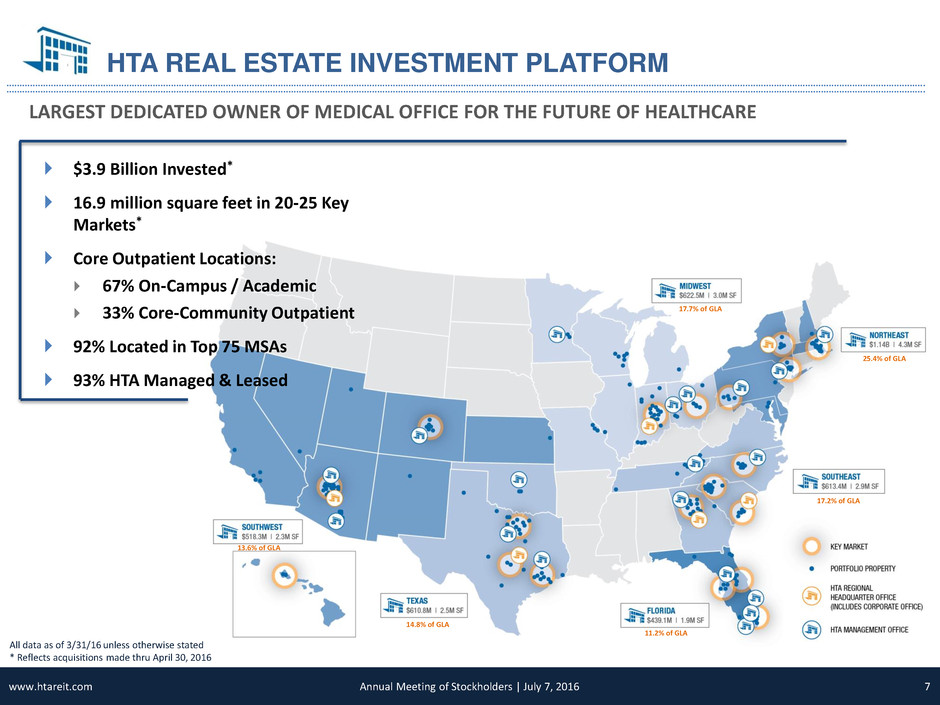
25.4% of GLA
17.7% of GLA
17.2% of GLA
11.2% of GLA
14.8% of GLA
13.6% of GLA
$3.9 Billion Invested*
16.9 million square feet in 20-25 Key
Markets*
Core Outpatient Locations:
67% On-Campus / Academic
33% Core-Community Outpatient
92% Located in Top 75 MSAs
93% HTA Managed & Leased
HTA REAL ESTATE INVESTMENT PLATFORM
LARGEST DEDICATED OWNER OF MEDICAL OFFICE FOR THE FUTURE OF HEALTHCARE
7 www.htareit.com
All data as of 3/31/16 unless otherwise stated
* Reflects acquisitions made thru April 30, 2016
Annual Meeting of Stockholders | July 7, 2016

STRATEGIC INVESTMENTS IN CORE-CRITICAL LOCATIONS
Hospital Campuses (61%) / Academic Medical Centers (6%)
Core Community Outpatient
Long-term steady demand supported by hospital infrastructure and
ancillary services
Limited developable land around hospital campuses
Designated healthcare cluster drives referral patterns
Hospital / University name recognition and reputation
Clinical, lab, research, and academic space shapes future delivery of
healthcare
Considerations: Health system can restrict tenants in on-campus
MOB’s; hospital campuses not always convenient for patients
Strategically located within the community and other healthcare
buildings
More than 2/3 of all physicians practice “off-campus” (source: Revista)
Favored location for independent multi-specialty physician group –
fastest growing segment of physicians (i.e., Westmed, ProHealth)
No restrictions – multiple providers and health system networks
compete for space
8 www.htareit.com Investor Presentation | April 2016
GREENVILLE, SC,
$179M, ACQUIRED 2009
Tufts & Boston University,
BOSTON, MA,
$250M, ACQUIRED 2014-2015
WHITE PLAINS, NY
$93M, ACQUIRED 2014
O
n
-Campus
-
6
7
%
3
3
%
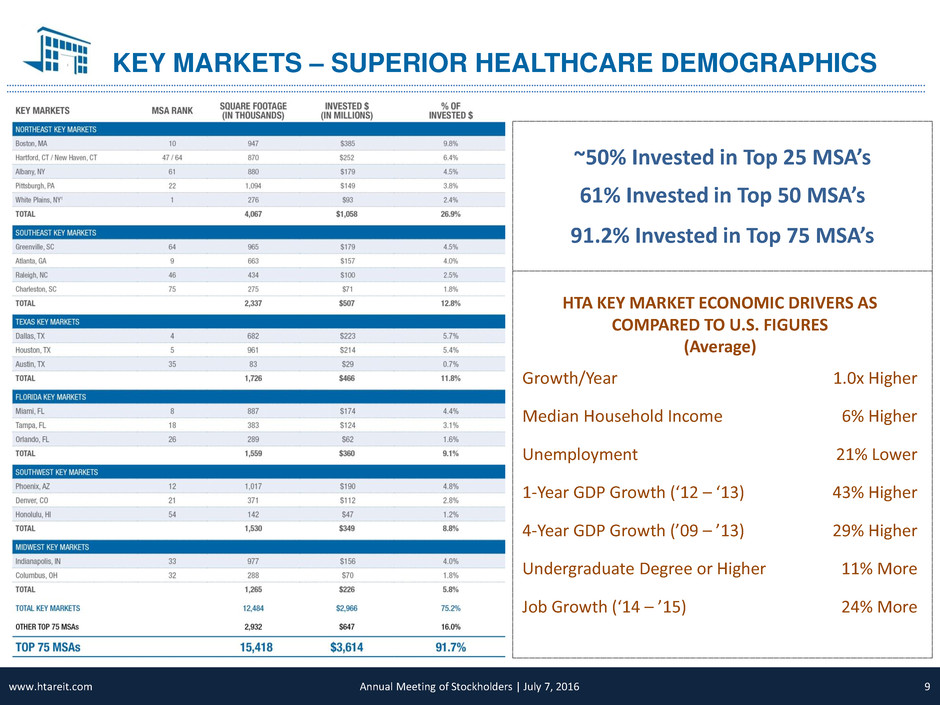
HTA KEY MARKET ECONOMIC DRIVERS AS
COMPARED TO U.S. FIGURES
(Average)
Growth/Year 1.0x Higher
Median Household Income 6% Higher
Unemployment 21% Lower
1-Year GDP Growth (‘12 – ‘13) 43% Higher
4-Year GDP Growth (’09 – ’13) 29% Higher
Undergraduate Degree or Higher 11% More
Job Growth (‘14 – ’15) 24% More
KEY MARKETS – SUPERIOR HEALTHCARE DEMOGRAPHICS
9
~50% Invested in Top 25 MSA’s
91.2% Invested in Top 75 MSA’s
61% Invested in Top 50 MSA’s
9 www.htareit.com Annual Meeting of Stockholders | July 7, 2016

SCALABLE BUSINESS IN A FRAGMENTED SPACE
10 www.htareit.com
$3.9 Billion Invested
* Acquisitions through April 30, 2016
$ millions
9%
46%
33%
5%
8%
REITs
Hospitals / Healthcare Systems
Providers / Private Owners
Private Equity / Developers
Government / Other
Large, Fragmented Industry with Ample
Investment Opportunities
Leading Investor of Medical Office Buildings
Target key markets with dynamic and growing
economies and health systems
Focus on critical locations primarily located directly on-
campus or in core-community outpatient locations
Underwrite well-occupied MOB assets with strong
same-store growth potential on HTA’s platform
Accretive to HTA’s cost of capital and commitment to a
low leveraged balance sheet
Capital Recycling
Since 2014, HTA has recycled $146M of assets
Recycling non-core assets: (i) outside of key markets, (ii)
single-tenanted in nature, or (iii) non-MOB’s
Generated gains of $32M ; Low teen levered IRR’s on
investments
Annual Meeting of Stockholders | July 7, 2016
$83 $36 $27
$413
$558
$456
$802
$68
$295
$398
$440
$272
$435
$0
$100
$200
$300
$400
$500
$600
$700
$800
$900
2007 2008 2009 2010 2011 2012 2013 2014 2015 2016*
Acquisitions Dispositions

INVESTMENT GRADE COMPANY
$562.3 million total liquidity from undrawn revolver and unrestricted cash as of 03/31/2016
Weighted average borrowing cost of 3.3%
Weighted average debt maturity of 4.8 years
Investment Grade Credit Ratings from Moody’s and Standard & Poor’s of Baa2 / BBB
Capital Structure 1
1 Based on total capitalization as of 03/31/2016
Balance Sheet Capacity
Debt Maturities ($mm)
$0
$100,000
$200,000
$300,000
$400,000
$500,000
2016 2017 2018 2019 2020 2021 2022 2023
Unsecured Secured
30%
Debt
24%
Unsecured
6%
Secured
70%
Equity
11 www.htareit.com Annual Meeting of Stockholders | July 7, 2016
2015 / 2016 HIGHLIGHTS
12 www.htareit.com Annual Meeting of Stockholders | July 7, 2016
2015 Accomplishments
Predictable internal performance – 3% quarterly Same Property NOI growth
Prudent external growth
– Invested $271.5 million in 11 high quality MOB’s or 770,000 square feet
– Recycled $35.7 million of non-core assets and recycled into stronger performing assets
Issued $44 million of equity to fund acquisitions
Grew Normalized FFO per share by 5% and increased our quarterly dividend by 1.7% to an
annualized rate of $1.18 per common share
2016 Quick Takes
Strong cost of capital resulting in accretive acquisitions where we continue to build out Key
Market concentration creating geographic synergies
– Invested $435 million, or 1.7 million square feet
– Recycle $26.5 million non-core assets and reinvested into better performing MOB assets
Raised over $336 million of equity, including $70 million through an OP Unit transaction
Grew Normalized FFO per share by 8% in Q1-2016.
Strong balance sheet with less than 30% debt and a well-protected dividend

Leading owner of Medical Office Buildings
Healthcare Trust of America, Inc.
Thank You For Your Continued Support
