Attached files
| file | filename |
|---|---|
| EX-10.1 - EX-10.1 - Hostess Brands, Inc. | d191744dex101.htm |
| 8-K - FORM 8-K - Hostess Brands, Inc. | d191744d8k.htm |
| EX-99.1 - EX-99.1 - Hostess Brands, Inc. | d191744dex991.htm |
| EX-10.4 - EX-10.4 - Hostess Brands, Inc. | d191744dex104.htm |
| EX-10.3 - EX-10.3 - Hostess Brands, Inc. | d191744dex103.htm |
| EX-10.2 - EX-10.2 - Hostess Brands, Inc. | d191744dex102.htm |
| EX-2.1 - EX-2.1 - Hostess Brands, Inc. | d191744dex21.htm |
Exhibit 99.2
THE ORIGINAL GORES HOLDINGS—HOSTESS TRANSACTION ANNOUNCEMENT July 2016 GORES HOLDINGS
PAGE 1 ® DISCLAIMER This investor presentation (“Investor Presentation”) is for informational purposes only and does not constitute an offer to sell, a solicitation of an offer to buy, or a recommendation to purchase any equity, debt or other financial instruments of Hostess Holdings, L.P. (“Hostess”) or Gores Holdings, Inc. (“Gores”) or any of Hostess’ or Gores’ affiliates’ securities (as such term is defined under the U.S. Federal Securities Law). This Investor Presentation has been prepared to assist interested parties in making their own evaluation with respect to the proposed business combination, as contemplated in the Master Transaction Agreement (collectively, the “Business Combination”), of Hostess and Gores and for no other purpose. The information contained herein does not purport to be all-inclusive. The data contained herein is derived from various internal and external sources. No representation is made as to the reasonableness of the assumptions made within or the accuracy or completeness of any projections, modeling or back-testing or any other information contained herein. All levels, prices and spreads are historical and do not represent current market levels, prices or spreads, some or all of which may have been changed since the issuance of this document. Any data on past performance, modeling or back-testing contained herein is not an indication as to future performance. Hostess and Gores assume no obligation to update the information in this Investor Presentation. Use of Projections This Investor Presentation contains financial forecasts with respect to Hostess’ estimated net revenues, gross profit, Adjusted EBITDA and Adjusted EBITDA Margin for Hostess’ fiscal years 2016 and 2017. Neither Gores’ independent auditors, nor the independent registered public accounting firm of Hostess, audited, reviewed, compiled, or performed any procedures with respect to the projections for the purpose of their inclusion in this Investor Presentation, and accordingly, neither of them expressed an opinion or provided any other form of assurance with respect thereto for the purpose of this Investor Presentation. These projections should not be relied upon as being necessarily indicative of future results. In this Investor Presentation, certain of the above-mentioned estimated information has been repeated (in each case, with an indication that the information is an estimate and is subject to the qualifications presented herein), for purposes of providing comparisons with historical data. The assumptions and estimates underlying the prospective financial information are inherently uncertain and are subject to a wide variety of significant business, economic and competitive risks and uncertainties that could cause actual results to differ materially from those contained in the prospective financial information. Accordingly, there can be no assurance that the prospective results are indicative of the future performance of Gores or Hostess or that actual results will not differ materially from those presented in the prospective financial information. Inclusion of the
prospective financial information in this Investor Presentation should not be regarded as a representation by any person that the results contained in the prospective financial information will be achieved.
Forward Looking Statements
This Investor Presentation includes “forward looking statements” within the meaning of the “safe harbor” provisions of the United States Private Securities Litigation Reform Act of 1995. Forward-looking statements may be identified by the use of words such as “forecast,” “intend,” “seek,”
“target,” “anticipate,” “believe,” “expect,” “estimate,” “plan,” “outlook,” and “project” and other similar expressions that predict or indicate future events or trends or that are not statements of historical matters. Such forward looking statements include estimated financial information.
Such forward looking statements with respect to revenues, earnings, performance, strategies, prospects and other aspects of the businesses of Gores, Hostess or the combined company after completion of the Business Combination are based on current expectations that are subject to risks
and uncertainties. A number of factors could cause actual results or outcomes to differ materially from those indicated by such forward looking statements. These factors include, but are not limited to: (1) the occurrence of any event, change or other circumstances that could give rise to the
termination of the Master Transaction Agreement and the proposed business combination contemplated thereby; (2) the inability to complete the transactions contemplated by the Master Transaction Agreement due to the failure to obtain approval of the stockholders of Gores or other
conditions to closing in the Master Transaction Agreement; (3) the ability to meet NASDAQ’s listing standards following the consummation of the transactions contemplated by the Master Transaction Agreement; (4) the risk that the proposed transaction disrupts current plans and
operations of Hostess as a result of the announcement and consummation of the transactions described herein; (5) the ability to recognize the anticipated benefits of the proposed Business Combination, which may be affected by, among other things, competition, the ability of the
combined company to grow and manage growth profitably, maintain relationships with customers and suppliers and retain its management and key employees; (6) costs related to the proposed Business Combination; (7) changes in applicable laws or regulations; (8) the possibility that
Hostess may be adversely affected by other economic, business, and/or competitive factors; and (9) other risks and uncertainties indicated from time to time in the final prospectus of Gores, including those under “Risk Factors” therein, and other documents filed or to be filed with the
Securities and Exchange Commission (“SEC”) by Gores. You are cautioned not to place undue reliance upon any forward-looking statements, which speak only as of the date made. Gores and Hostess undertake no commitment to update or revise the forward-looking statements, whether as
a result of new information, future events or otherwise.
Industry and Market Data
In this Investor Presentation, Hostess relies on and refers to information and statistics regarding market shares in the sectors in which it competes and other industry data. Hostess obtained this information and statistics from third-party sources, including reports by market research firms,
such as Nielsen. Hostess has supplemented this information where necessary with information from discussions with Hostess customers and its own internal estimates, taking into account publicly available information about other industry participants and Hostess’ management’s best view
as to information that is not publicly available.
Use of Non-GAAP Financial Measures
This Investor Presentation includes non-GAAP financial measures, including earnings before interest, taxes, depreciation and amortization (“Adjusted EBITDA”), Adjusted EBITDA Margin and Free Cash Flow. In this Investor Presentation, Adjusted EBITDA and Adjusted EBITDA Margin exclude
certain add-backs. Adjusted EBITDA Margin represents Adjusted EBITDA divided by total revenues. Free Cash Flow conversion is defined as Adjusted EBITDA minus capital expenditures divided by Adjusted EBITDA. You can find the reconciliation of these measures to the nearest comparable
GAAP measures elsewhere in this Investor Presentation. Except as otherwise noted, all references herein to full-year periods refer to Hostess’ fiscal year, which ends on December 31.
Hostess believes that these non-GAAP measures of financial results provide useful information to management and investors regarding certain financial and business trends relating to Hostess’ financial condition and results of operations. Hostess’ management uses these non-GAAP
measures to compare Hostess’ performance to that of prior periods for trend analyses, for purposes of determining management incentive compensation, and for budgeting and planning purposes. These measures are used in monthly financial reports prepared for management and Hostess’
board of directors.
Hostess believes that the use of these non-GAAP financial measures provides an additional tool for investors to use in evaluating ongoing operating results and trends. Management of Hostess does not consider these non-GAAP measures in isolation or as an alternative to financial measures
determined in accordance with GAAP.
Other companies may calculate Adjusted EBITDA, Adjusted EBITDA Margin, Free Cash Flow and other non-GAAP measures differently, and therefore Hostess’ Adjusted EBITDA, Adjusted EBITDA Margin, Free Cash Flow and other non-GAAP measures may not be directly comparable to
similarly titled measures of other companies.
Additional Information
In connection with the proposed Business Combination between Hostess and Gores, Gores intends to file with the SEC a preliminary proxy statement and will mail a definitive proxy statement and other relevant documentation to Gores stockholders. This Investor Presentation does not
contain all the information that should be considered concerning the proposed Business Combination. It is not intended to form the basis of any investment decision or any other decision in respect to the proposed Business Combination. Gores stockholders and other interested persons are
advised to read, when available, the preliminary proxy statement and any amendments thereto, and the definitive proxy statement in connection with Gores’ solicitation of proxies for the special meeting to be held to approve the transactions contemplated by the proposed Business
Combination because these materials will contain important information about Hostess, Gores and the proposed transactions. The definitive proxy statement will be mailed to Gores stockholders as of a record date to be established for voting on the proposed Business Combination when it
becomes available. Stockholders will also be able to obtain a copy of the preliminary proxy statement and definitive proxy statement once they are available, without charge, at the SEC’s website at http://sec.gov or by directing a request to: Gores Holdings, Inc., c/o The Gores Group LLC,
9800 Wilshire Boulevard, Beverly Hills, CA 90212, attention: Jennifer Kwon Chou (jchou@gores.com).
This Investor Presentation shall not constitute a solicitation of a proxy, consent or authorization with respect to any securities or in respect of the proposed Business Combination.
Participants in the Solicitation
Gores and its directors and officers may be deemed participants in the solicitation of proxies of Gores stockholders in connection with the proposed business combination. Gores stockholders and other interested persons may obtain, without charge, more detailed information regarding the
directors and officers of Gores in Gores’ Annual Report on Form 10-K for the fiscal year ended December 31, 2015, which was filed with the SEC on March 16, 2016. Information regarding the persons who may, under SEC rules, be deemed participants in the solicitation of proxies to Gores
stockholders in connection with the proposed transaction will be set forth in the proxy statement for the transaction when available. Additional information regarding the interests of participants in the solicitation of proxies in connection with the proposed transaction will be included in the
proxy statement that Gores intends to file with the SEC.
PAGE
| 2 |
|
®
Hostess Gores Holdings
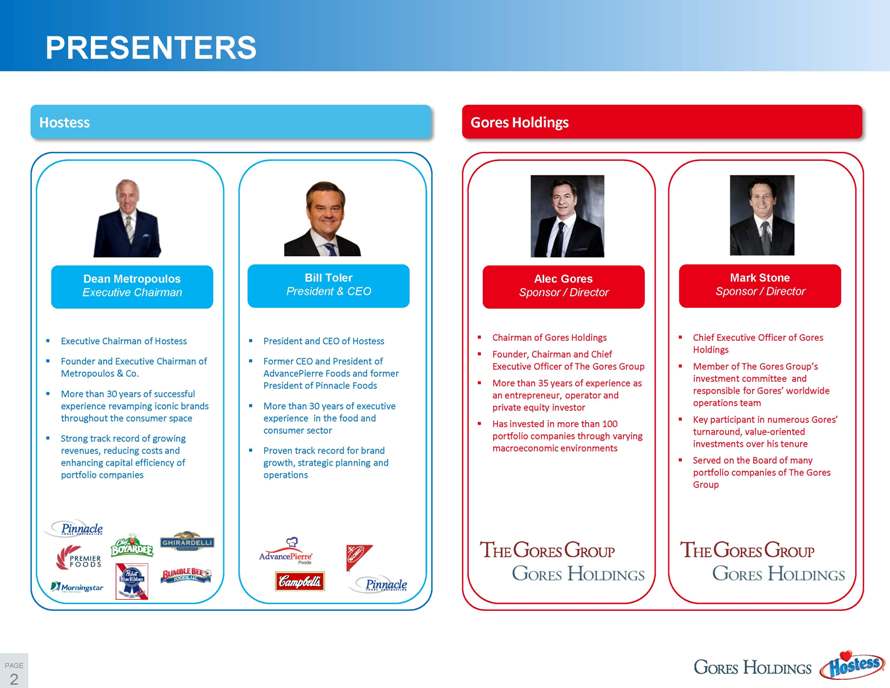
“ Executive Chairman of Hostess
“ Founder and Executive Chairman of
Metropoulos & Co.
“ More than 30 years of successful
experience revamping iconic brands
throughout the consumer space
“ Strong track record of growing
revenues, reducing costs and
enhancing capital efficiency of
portfolio companies
“ President and CEO of Hostess
“ Former CEO and President of
AdvancePierre Foods and former
President of Pinnacle Foods
“ More than 30 years of executive
experience in the food and
consumer sector
“ Proven track record for brand
growth, strategic planning and
operations
PRESENTERS
Dean Metropoulos
Executive Chairman
Bill Toler
President & CEO
“ Chairman of Gores Holdings
“ Founder, Chairman and Chief
Executive Officer of The Gores Group
“ More than 35 years of experience as
an entrepreneur, operator and
private equity investor
“ Has invested in more than 100
portfolio companies through varying
macroeconomic environments
“ Chief Executive Officer of Gores
Holdings
“ Member of The Gores Group’s
investment committee and
responsible for Gores’ worldwide
operations team
“ Key participant in numerous Gores’
turnaround, value-oriented
investments over his tenure
“ Served on the Board of many
portfolio companies of The Gores
Group
Alec Gores
Sponsor / Director
Mark Stone
Sponsor / Director
PAGE
| 3 |
|
®
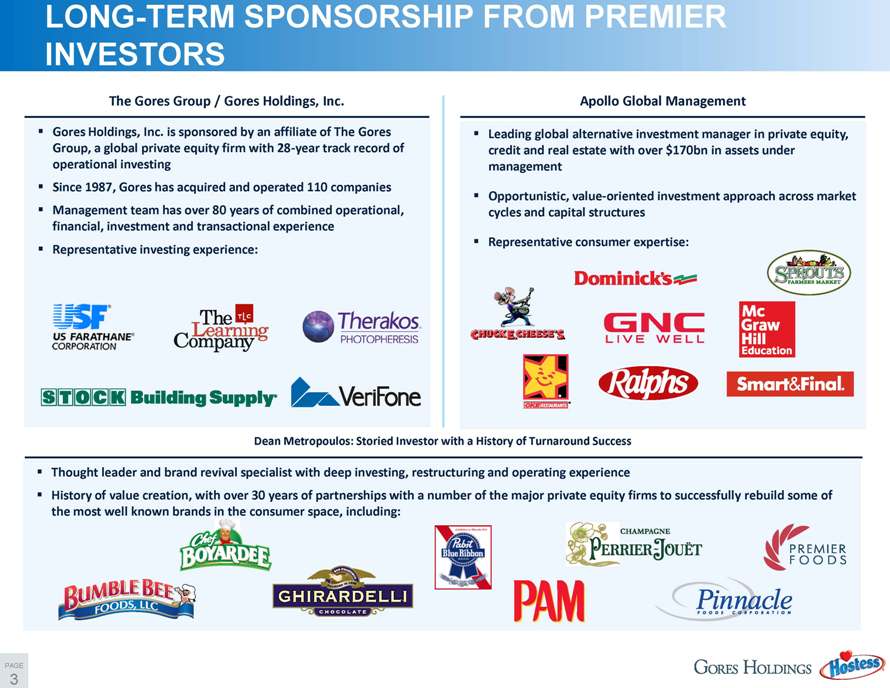
“ Gores Holdings, Inc. is sponsored by an affiliate of The Gores
Group, a global private equity firm with 28-year track record of
operational investing
“ Since 1987, Gores has acquired and operated 110 companies
“ Management team has over 80 years of combined operational,
financial, investment and transactional experience
“ Representative investing experience:
“ Leading global alternative investment manager in private equity,
credit and real estate with over $170bn in assets under
management
“ Opportunistic, value-oriented investment approach across market
cycles and capital structures
“ Representative consumer expertise:
The Gores Group / Gores Holdings, Inc. Apollo Global Management
Dean Metropoulos: Storied Investor with a History of Turnaround Success
“ Thought leader and brand revival specialist with deep investing, restructuring and operating experience
“ History of value creation, with over 30 years of partnerships with a number of the major private equity firms to successfully rebuild some of
the most well known brands in the consumer space, including:
LONG-TERM SPONSORSHIP FROM PREMIER
INVESTORS
PAGE
| 4 |
|
®
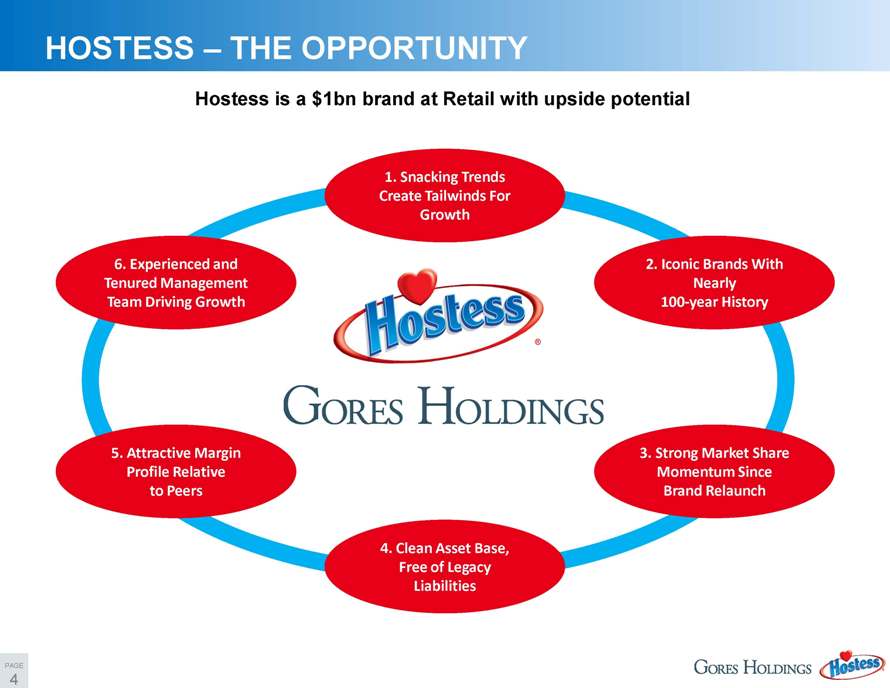
HOSTESS—THE OPPORTUNITY
1. Snacking Trends
Create Tailwinds For
Growth
2. Iconic Brands With
Nearly
100-year History
3. Strong Market Share
Momentum Since
Brand Relaunch
4. Clean Asset Base,
Free of Legacy
Liabilities
5. Attractive Margin
Profile Relative
to Peers
6. Experienced and
Tenured Management
Team Driving Growth
®
Hostess is a $1bn brand at Retail with upside potential
PAGE
| 5 |
|
®
® I. BUSINESS OVERVIEW
PAGE
| 6 |
|
®
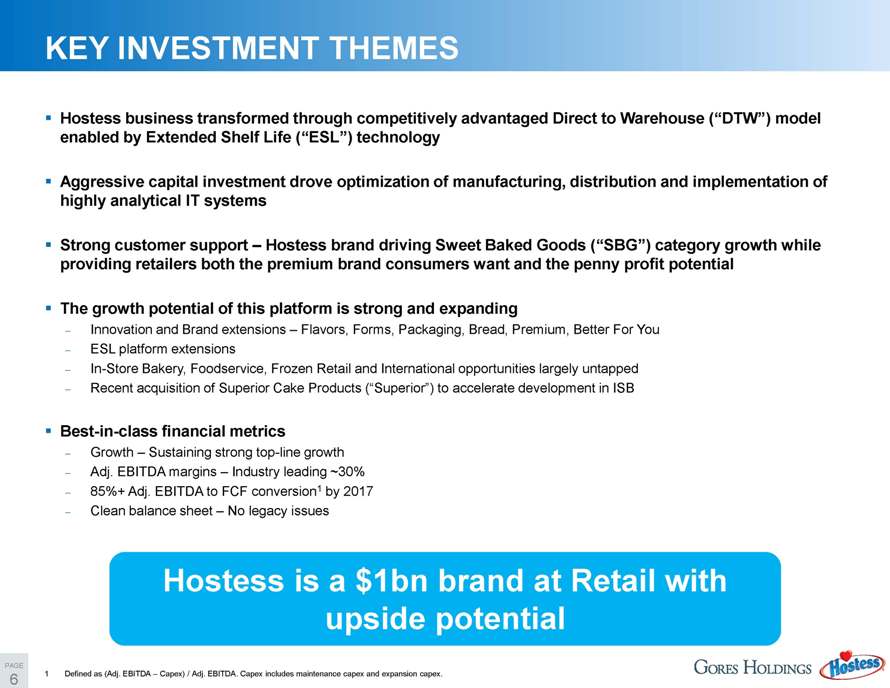
KEY INVESTMENT THEMES
“ Hostess business transformed through competitively advantaged Direct to Warehouse (“DTW”) model
enabled by Extended Shelf Life (“ESL”) technology
“ Aggressive capital investment drove optimization of manufacturing, distribution and implementation of
highly analytical IT systems
“ Strong customer support—Hostess brand driving Sweet Baked Goods (“SBG”) category growth while
providing retailers both the premium brand consumers want and the penny profit potential
“ The growth potential of this platform is strong and expanding
Innovation and Brand extensions—Flavors, Forms, Packaging, Bread, Premium, Better For You
ESL platform extensions
In-Store Bakery, Foodservice, Frozen Retail and International opportunities largely untapped
Recent acquisition of Superior Cake Products (“Superior”) to accelerate development in ISB
“ Best-in-class financial metrics
Growth—Sustaining strong top-line growth
Adj. EBITDA margins—Industry leading ~30%
85%+ Adj. EBITDA to FCF conversion1 by 2017
Clean balance sheet—No legacy issues
Hostess is a $1bn brand at Retail with
upside potential
| 1 |
|
Defined as (Adj. EBITDA—Capex) / Adj. EBITDA. Capex includes maintenance capex and expansion capex. |
PAGE
| 7 |
|
®
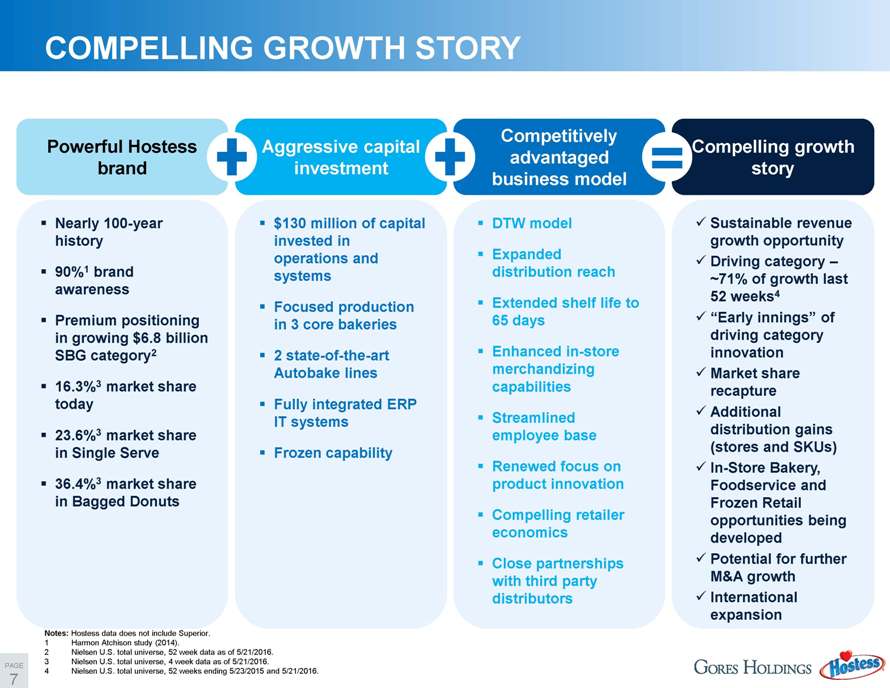
“ Sustainable revenue
growth opportunity
“ Driving category -
~71% of growth last
52 weeks4
“ “Early innings” of
driving category
innovation
“ Market share
recapture
“ Additional
distribution gains
(stores and SKUs)
“ In-Store Bakery,
Foodservice and
Frozen Retail
opportunities being
developed
“ Potential for further
M&A growth
“ International
expansion
Compelling growth
story
COMPELLING GROWTH STORY
“ Nearly 100-year
history
“ 90%1 brand
awareness
“ Premium positioning
in growing $6.8 billion
SBG category2
“ 16.3%3 market share
today
“ 23.6%3 market share
in Single Serve
“ 36.4%3 market share
in Bagged Donuts
“ $130 million of capital
invested in
operations and
systems
“ Focused production
in 3 core bakeries
“ 2 state-of-the-art
Autobake lines
“ Fully integrated ERP
IT systems
“ Frozen capability
“ DTW model
“ Expanded
distribution reach
“ Extended shelf life to
65 days
“ Enhanced in-store
merchandizing
capabilities
“ Streamlined
employee base
“ Renewed focus on
product innovation
“ Compelling retailer
economics
“ Close partnerships
with third party
distributors
Powerful Hostess
brand
Aggressive capital
investment
Competitively
advantaged
business model =
Notes: Hostess data does not include Superior.
| 1 |
|
Harmon Atchison study (2014). |
| 2 |
|
Nielsen U.S. total universe, 52 week data as of 5/21/2016. |
| 3 |
|
Nielsen U.S. total universe, 4 week data as of 5/21/2016. |
| 4 |
|
Nielsen U.S. total universe, 52 weeks ending 5/23/2015 and 5/21/2016. |
PAGE
| 8 |
|
®
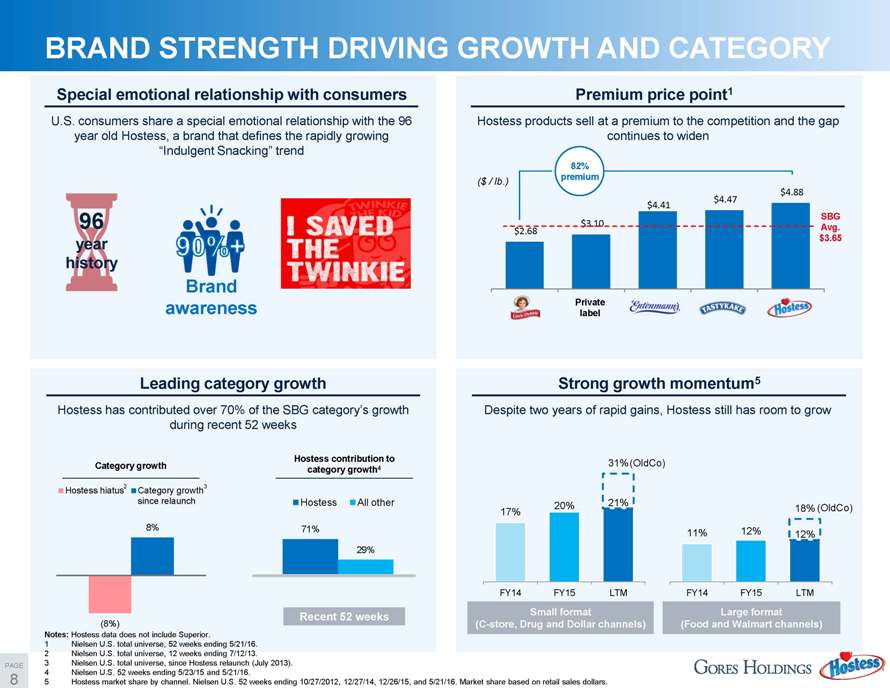
$2.68
$3.10
$4.41
$4.47
$4.88
(8%)
8%
Hostess hiatus Category growth
since relaunch
11% 12% 12%
18%
FY14 FY15 LTM
20% 21%
17%
31%
FY14 FY15 LTM
BRAND STRENGTH DRIVING GROWTH AND CATEGORY
Special emotional relationship with consumers
U.S. consumers share a special emotional relationship with the 96
year old Hostess, a brand that defines the rapidly growing
“Indulgent Snacking” trend
96
year
history
Brand
awareness
Strong growth momentum5
Despite two years of rapid gains, Hostess still has room to grow
Leading category growth
Hostess has contributed over 70% of the SBG category’s growth
during recent 52 weeks
Recent 52 weeks
Premium price point1
Hostess products sell at a premium to the competition and the gap
continues to widen
Private
label
SBG
Avg.
$3.65
82%
premium ($ / lb.)
| 2 |
|
3 |
Category growth
Hostess contribution to
category growth4
71%
29%
Hostess All other
Large format
(Food and Walmart channels)
Small format
(C-store, Drug and Dollar channels)
Notes: Hostess data does not include Superior.
| 1 |
|
Nielsen U.S. total universe, 52 weeks ending 5/21/16. |
| 2 |
|
Nielsen U.S. total universe, 12 weeks ending 7/12/13. |
| 3 |
|
Nielsen U.S. total universe, since Hostess relaunch (July 2013). |
| 4 |
|
Nielsen U.S. 52 weeks ending 5/23/15 and 5/21/16. |
5 Hostess market share by channel. Nielsen U.S. 52 weeks ending 10/27/2012, 12/27/14, 12/26/15, and 5/21/16. Market share based on retail sales dollars.
(OldCo)
(OldCo)
PAGE
9
®
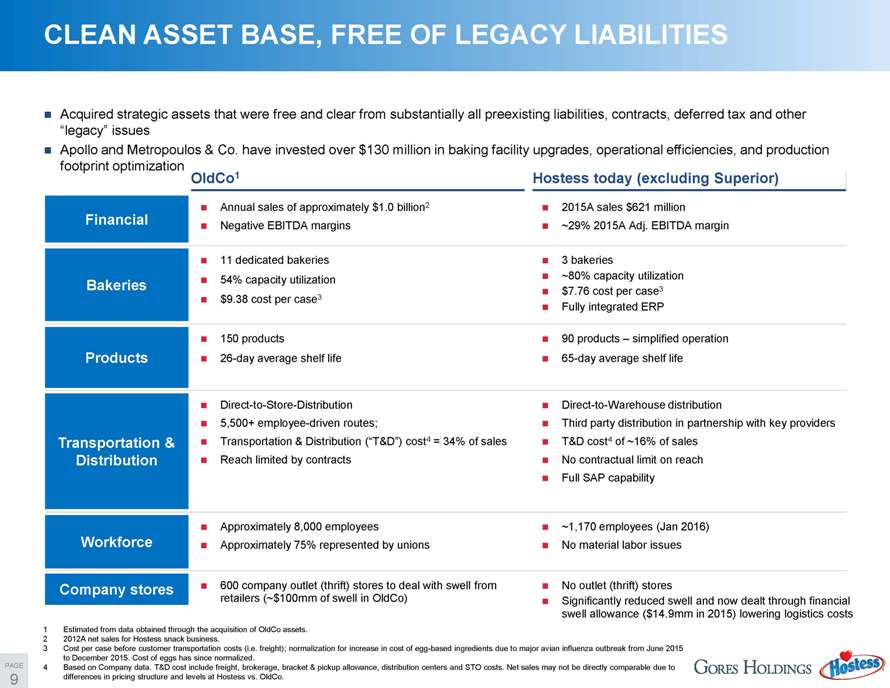
CLEAN ASSET BASE, FREE OF LEGACY LIABILITIES
Products
Bakeries
Financial
OldCo1 Hostess today (excluding Superior)
? Annual sales of approximately $1.0 billion2
? Negative EBITDA margins
? Acquired strategic assets that were free and clear from substantially all preexisting liabilities, contracts, deferred tax and other
“legacy” issues
? Apollo and Metropoulos & Co. have invested over $130 million in baking facility upgrades, operational efficiencies, and production
footprint optimization
Transportation &
Distribution
Workforce
Company stores
? Direct-to-Store-Distribution
? 5,500+ employee-driven routes;
? Transportation & Distribution (“T&D”) cost4 = 34% of sales
? Reach limited by contracts
? 11 dedicated bakeries
? 54% capacity utilization
? $9.38 cost per case3
? 150 products
? 26-day average shelf life
? Approximately 8,000 employees
? Approximately 75% represented by unions
? 600 company outlet (thrift) stores to deal with swell from
retailers (~$100mm of swell in OldCo)
? 2015A sales $621 million
? ~29% 2015A Adj. EBITDA margin
? Direct-to-Warehouse distribution
? Third party distribution in partnership with key providers
? T&D cost4 of ~16% of sales
? No contractual limit on reach
? Full SAP capability
? 3 bakeries
? ~80% capacity utilization
? $7.76 cost per case3
? Fully integrated ERP
? 90 products—simplified operation
? 65-day average shelf life
? ~1,170 employees (Jan 2016)
? No material labor issues
? No outlet (thrift) stores
? Significantly reduced swell and now dealt through financial
swell allowance ($14.9mm in 2015) lowering logistics costs
| 1 |
|
Estimated from data obtained through the acquisition of OldCo assets. |
| 2 |
|
2012A net sales for Hostess snack business. |
3 Cost per case before customer transportation costs (i.e. freight); normalization for increase in cost of egg-based ingredients due to major avian influenza outbreak from June 2015
to December 2015. Cost of eggs has since normalized.
4 Based on Company data. T&D cost include freight, brokerage, bracket & pickup allowance, distribution centers and STO costs. Net sales may not be directly comparable due to
differences in pricing structure and levels at Hostess vs. OldCo.
PAGE
10
®
ASSET-LIGHT LOGISTICS APPROACH
Transportation:
o 100% of all transportation occurs with common carriers and/or brokers. Hostess does not utilize any
“owned” transportation assets.
o Hostess partners with LeanLogistics (3rd Party). Services provided to Hostess:
o Completion of RFP’s (Request for Proposals) and other bids at request of Hostess.
o Training for carriers
o Reporting-both quality and financial metrics
o Route scheduling and optimization via Lean TMS (Transportation Management System)
o Freight bill auditing
o Supply chain modeling exercises as needed/requested
o Hostess owns relationship with carrier as well as financial payment for services provided. Hostess approves
all rates with all carriers.
Warehousing:
o Our two distribution centers (Shorewood, IL-Fresh, and Carthage, MO-Frozen) are operated by 3rd party
partners.
o Shorewood:
o XPO Logistics employees perform warehousing and kitting services.
o Hostess Brands controls the lease of the facility.
o Carthage:
o Americold employees perform the warehousing services.
o Americold owns the facility.
Shorewood warehouse is leased by Hostess but operated by 3PL; all other distribution assets are fully 3rd party
PAGE
11
®
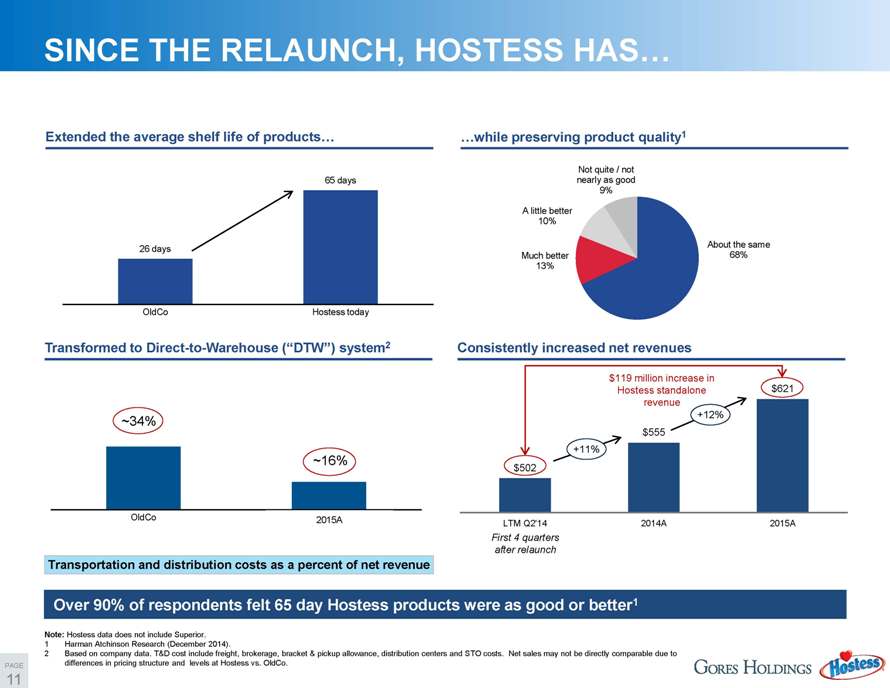
$502
$555
$621
LTM Q2’14 2014A 2015A
OldCo Hostess today
~34%
~16%
SINCE THE RELAUNCH, HOSTESS HAS…
Extended the average shelf life of products…
26 days
65 days
OldCo Hostess today
…while preserving product quality1
About the same
Much better 68%
13%
A little better
10%
Not quite / not
nearly as good
9%
Over 90% of respondents felt 65 day Hostess products were as good or better1
Transformed to Direct-to-Warehouse (“DTW”) system2
Transportation and distribution costs as a percent of net revenue
Consistently increased net revenues
$119 million increase in
Hostess standalone
revenue
First 4 quarters
after relaunch
Note: Hostess data does not include Superior.
| 1 |
|
Harman Atchinson Research (December 2014). |
2 Based on company data. T&D cost include freight, brokerage, bracket & pickup allowance, distribution centers and STO costs. Net sales may not be directly comparable due to
differences in pricing structure and levels at Hostess vs. OldCo.
+11%
+12%
2015A
PAGE
12
®
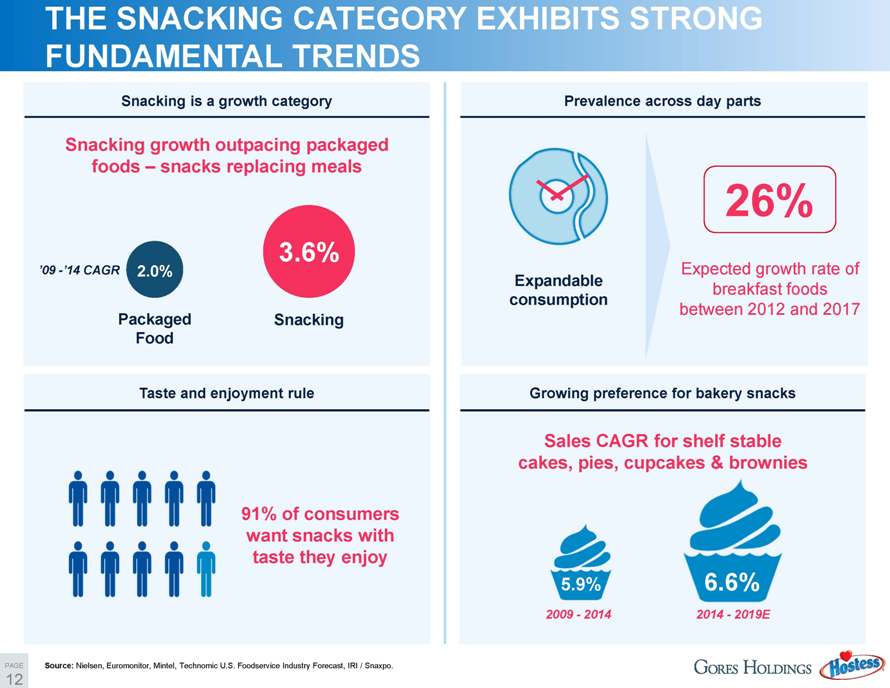
THE SNACKING CATEGORY EXHIBITS STRONG
FUNDAMENTAL TRENDS
Source: Nielsen, Euromonitor, Mintel, Technomic U.S. Foodservice Industry Forecast, IRI / Snaxpo.
Snacking is a growth category Prevalence across day parts
Taste and enjoyment rule Growing preference for bakery snacks
26%
Expected growth rate of
breakfast foods
between 2012 and 2017
Expandable
consumption
91% of consumers
want snacks with
taste they enjoy
2009—2014
5.9%
2014—2019E
6.6%
Sales CAGR for shelf stable
cakes, pies, cupcakes & brownies
Snacking growth outpacing packaged
foods—snacks replacing meals
‘09 -‘14 CAGR
Packaged Snacking
Food
3.6%
2.0%
PAGE
13
®
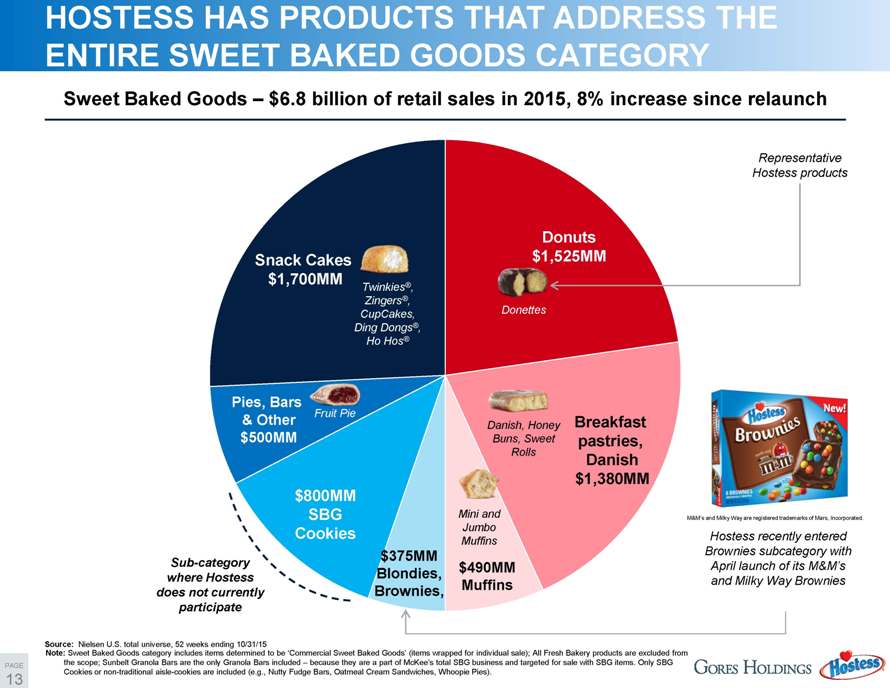
Note: Sweet Baked Goods category includes items determined to be ‘Commercial Sweet Baked Goods’ (items wrapped for individual sale); All Fresh Bakery products are excluded from
the scope; Sunbelt Granola Bars are the only Granola Bars included—because they are a part of McKee’s total SBG business and targeted for sale with SBG items. Only SBG
Cookies or non-traditional aisle-cookies are included (e.g., Nutty Fudge Bars, Oatmeal Cream Sandwiches, Whoopie Pies).
Source: Nielsen U.S. total universe, 52 weeks ending 10/31/15
HOSTESS HAS PRODUCTS THAT ADDRESS THE
ENTIRE SWEET BAKED GOODS CATEGORY
Sweet Baked Goods—$6.8 billion of retail sales in 2015, 8% increase since relaunch
Donuts
$1,525MM
Snack Cakes
$1,700MM
Pies, Bars
& Other
$500MM
$375MM
Blondies,
Brownies,
Breakfast
pastries,
Danish
$1,380MM
$490MM
Muffins
$800MM
SBG
Cookies
Danish, Honey
Buns, Sweet
Rolls
Mini and
Jumbo
Muffins
Donettes
Twinkies®,
Zingers®,
CupCakes,
Ding Dongs®,
Ho Hos®
Fruit Pie
Representative
Hostess products
Sub-category
where Hostess
does not currently
participate
Hostess recently entered
Brownies subcategory with
April launch of its M&M’s
and Milky Way Brownies
M&M’s and Milky Way are registered trademarks of Mars, Incorporated.
PAGE
14
®
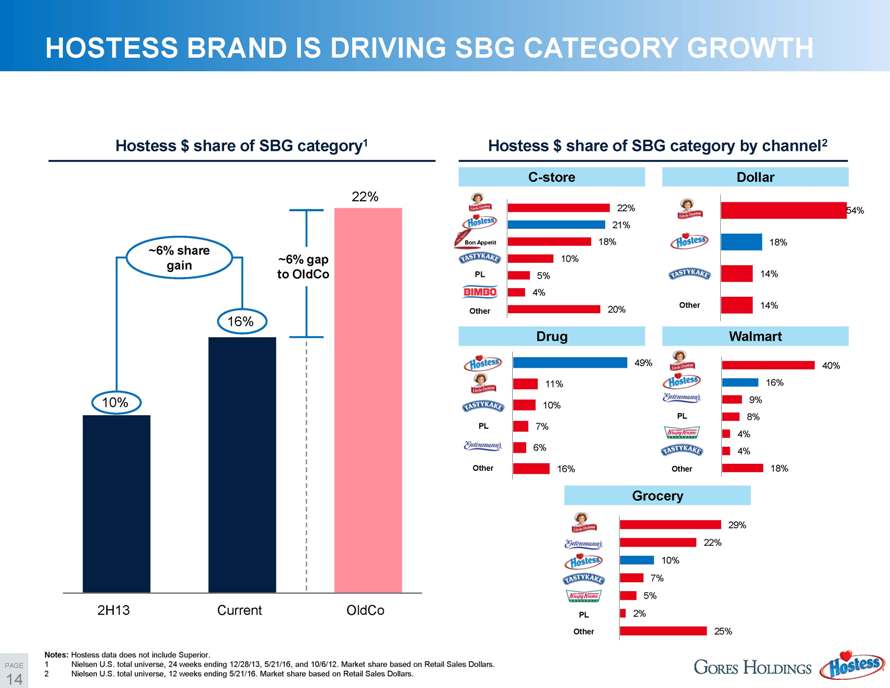
HOSTESS BRAND IS DRIVING SBG CATEGORY GROWTH
Hostess $ share of SBG category1 Hostess $ share of SBG category by channel2
C-store
~6% share
gain
~6% gap
to OldCo
10%
16%
22%
2H13 Current OldCo
Dollar
Drug Walmart
Grocery
Bon Appetit
PL
Other
Other
PL
Other
PL
Other
Other
PL
22%
21%
18%
10%
5%
4%
20%
54%
18%
14%
14%
40%
16%
9%
8%
4%
4%
18%
49%
11%
10%
7%
6%
16%
29%
22%
10%
7%
5%
2%
25%
Notes: Hostess data does not include Superior.
1 Nielsen U.S. total universe, 24 weeks ending 12/28/13, 5/21/16, and 10/6/12. Market share based on Retail Sales Dollars.
| 2 |
|
Nielsen U.S. total universe, 12 weeks ending 5/21/16. Market share based on Retail Sales Dollars. |
PAGE
15
®
® II. PROJECTIONS AND GROWTH OVERVIEW
PAGE
16
®
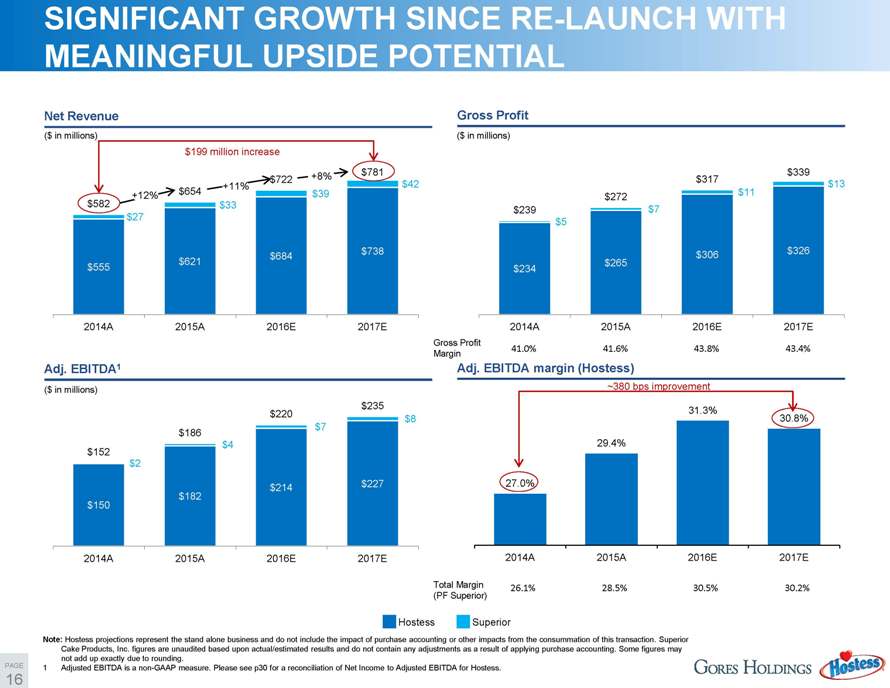
27.0%
29.4%
31.3%
30.8%
2014A 2015A 2016E 2017E
$555
$621
$684
$738
$27
$33
$39
$42
$582
$654
$722
$781
2014A 2015A 2016E 2017E
SIGNIFICANT GROWTH SINCE RE-LAUNCH WITH
MEANINGFUL UPSIDE POTENTIAL
Adj. EBITDA1 Adj. EBITDA margin (Hostess)
Net Revenue Gross Profit
($ in millions) ($ in millions)
($ in millions) ~380 bps improvement
Total Margin
(PF Superior)
$199 million increase
26.1% 28.5% 30.5% 30.2%
Note: Hostess projections represent the stand alone business and do not include the impact of purchase accounting or other impacts from the consummation of this transaction. Superior
Cake Products, Inc. figures are unaudited based upon actual/estimated results and do not contain any adjustments as a result of applying purchase accounting. Some figures may
not add up exactly due to rounding.
1 Adjusted EBITDA is a non-GAAP measure. Please see p30 for a reconciliation of Net Income to Adjusted EBITDA for Hostess.
+12%
+11%
+8%
Hostess Superior
Gross Profit
Margin 41.0% 41.6% 43.8% 43.4%
$234
$265
$306 $326
$5
$7
$11
$13
$239
$272
$317
$339
2014A 2015A 2016E 2017E
$150
$182
$214 $227
$2
$4
$7
$8
$152
$186
$220
$235
2014A 2015A 2016E 2017E
PAGE
17
®
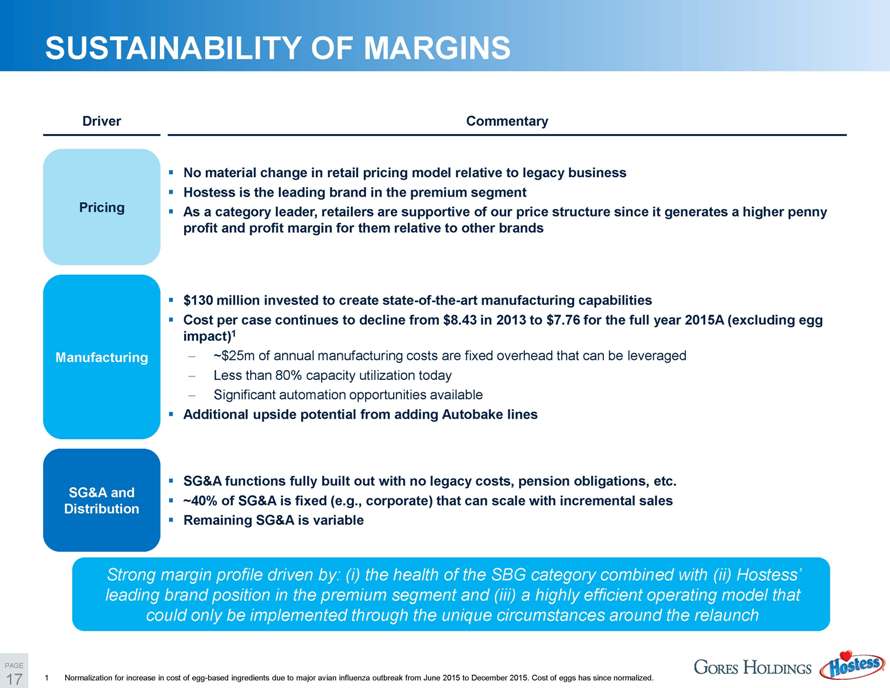
SUSTAINABILITY OF MARGINS
Strong margin profile driven by: (i) the health of the SBG category combined with (ii) Hostess’
leading brand position in the premium segment and (iii) a highly efficient operating model that
could only be implemented through the unique circumstances around the relaunch
“ No material change in retail pricing model relative to legacy business
“ Hostess is the leading brand in the premium segment
“ As a category leader, retailers are supportive of our price structure since it generates a higher penny
profit and profit margin for them relative to other brands
Pricing
“ $130 million invested to create state-of-the-art manufacturing capabilities
“ Cost per case continues to decline from $8.43 in 2013 to $7.76 for the full year 2015A (excluding egg
impact)1
~$25m of annual manufacturing costs are fixed overhead that can be leveraged
Less than 80% capacity utilization today
Significant automation opportunities available
“ Additional upside potential from adding Autobake lines
Manufacturing
“ SG&A functions fully built out with no legacy costs, pension obligations, etc.
“ ~40% of SG&A is fixed (e.g., corporate) that can scale with incremental sales
“ Remaining SG&A is variable
SG&A and
Distribution
Driver Commentary
1 Normalization for increase in cost of egg-based ingredients due to major avian influenza outbreak from June 2015 to December 2015. Cost of eggs has since normalized.
PAGE
18
®
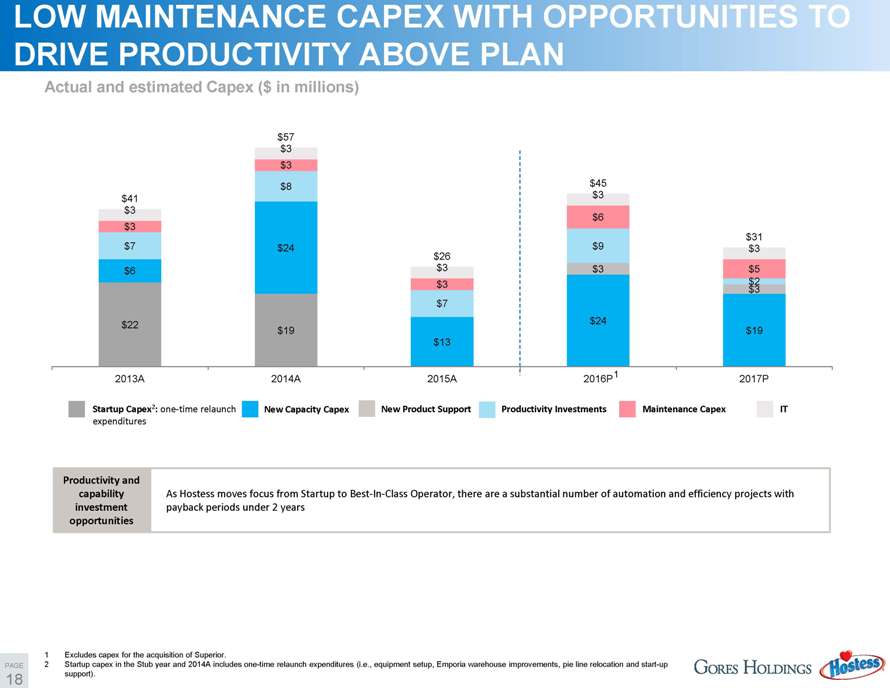
LOW MAINTENANCE CAPEX WITH OPPORTUNITIES TO
DRIVE PRODUCTIVITY ABOVE PLAN
Actual and estimated Capex ($ in millions)
Startup Capex2: one-time relaunch New Capacity Capex New Product Support
expenditures
| 1 |
|
Excludes capex for the acquisition of Superior. |
2 Startup capex in the Stub year and 2014A includes one-time relaunch expenditures (i.e., equipment setup, Emporia warehouse improvements, pie line relocation and start-up
support).
Productivity and
capability
investment
opportunities
As Hostess moves focus from Startup to Best-In-Class Operator, there are a substantial number of automation and efficiency projects with
payback periods under 2 years
Productivity Investments IT
$22
$19
$6
$24
$13
$24
$19
$3
$3
$7
$8
$7
$9
$2
$3
$3
$3
$6
$5
$3
$3
$3
$3
$3
$41
$57
$26
$45
$31
2013A 2014A 2015A 2016P 2017P
Maintenance Capex
| 1 |
|
PAGE
19
®
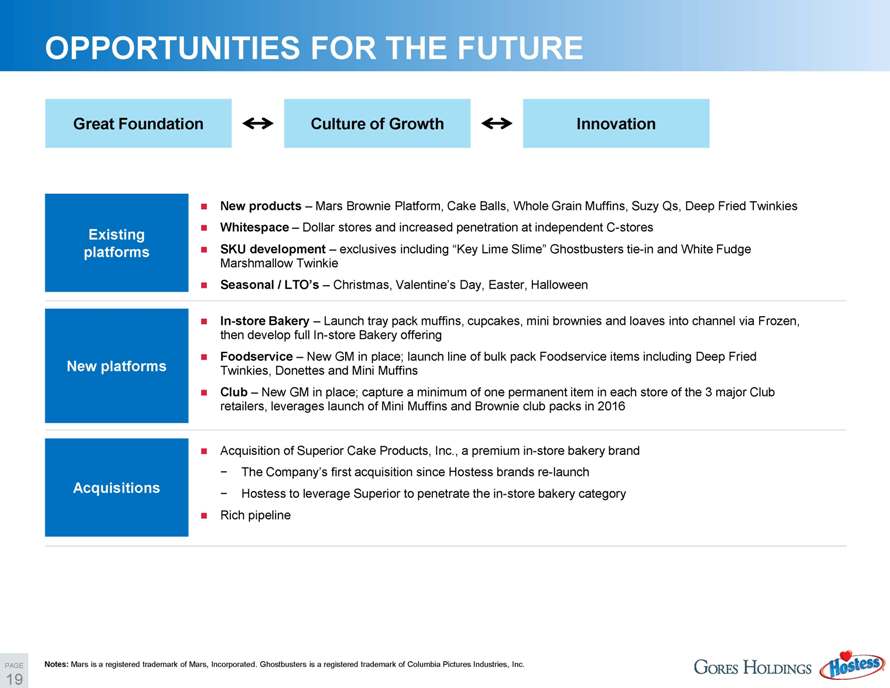
OPPORTUNITIES FOR THE FUTURE
Existing
platforms
New products—Mars Brownie Platform, Cake Balls, Whole Grain Muffins, Suzy Qs, Deep Fried Twinkies
Whitespace—Dollar stores and increased penetration at independent C-stores
SKU development—exclusives including “Key Lime Slime” Ghostbusters tie-in and White Fudge
Marshmallow Twinkie
Seasonal / LTO’s—Christmas, Valentine’s Day, Easter, Halloween
New platforms
In-store Bakery—Launch tray pack muffins, cupcakes, mini brownies and loaves into channel via Frozen,
then develop full In-store Bakery offering
Foodservice—New GM in place; launch line of bulk pack Foodservice items including Deep Fried
Twinkies, Donettes and Mini Muffins
Club—New GM in place; capture a minimum of one permanent item in each store of the 3 major Club
retailers, leverages launch of Mini Muffins and Brownie club packs in 2016
Acquisitions
Acquisition of Superior Cake Products, Inc., a premium in-store bakery brand
? The Company’s first acquisition since Hostess brands re-launch
? Hostess to leverage Superior to penetrate the in-store bakery category
Rich pipeline
Great Foundation Culture of Growth Innovation
Notes: Mars is a registered trademark of Mars, Incorporated. Ghostbusters is a registered trademark of Columbia Pictures Industries, Inc.
PAGE
20
®
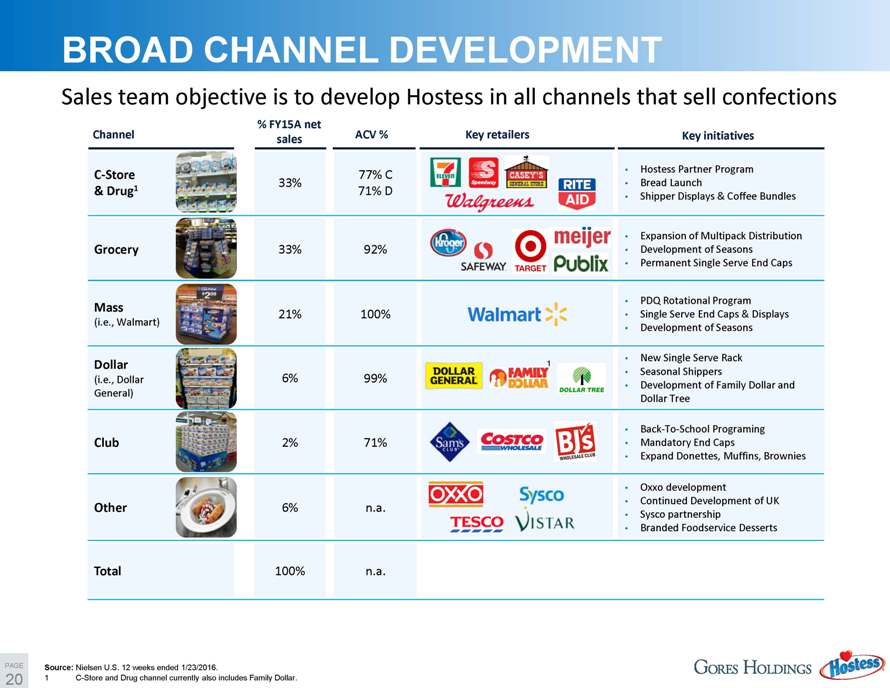
Sales team objective is to develop Hostess in all channels that sell confections
Channel ACV %
92%
100%
99%
71%
Grocery
Mass
(i.e., Walmart)
% FY15A net
sales
33%
21%
6%
2%
Dollar
(i.e., Dollar
General)
Club
Key retailers Key initiatives
o Expansion of Multipack Distribution
o Development of Seasons
o Permanent Single Serve End Caps
o PDQ Rotational Program
o Single Serve End Caps & Displays
o Development of Seasons
o New Single Serve Rack
o Seasonal Shippers
o Development of Family Dollar and
Dollar Tree
o Back-To-School Programing
o Mandatory End Caps
o Expand Donettes, Muffins, Brownies
BROAD CHANNEL DEVELOPMENT
Other 6% n.a.
o Oxxo development
o Continued Development of UK
o Sysco partnership
o Branded Foodservice Desserts
Total 100% n.a.
77% C
71% D
C-Store
& Drug1
o Hostess Partner Program
o Bread Launch
o Shipper Displays & Coffee Bundles
33%
Source: Nielsen U.S. 12 weeks ended 1/23/2016.
| 1 |
|
C-Store and Drug channel currently also includes Family Dollar. |
| 1 |
|
PAGE
21
®
® III. PRODUCT PIPELINE OVERVIEW
PAGE
22
®
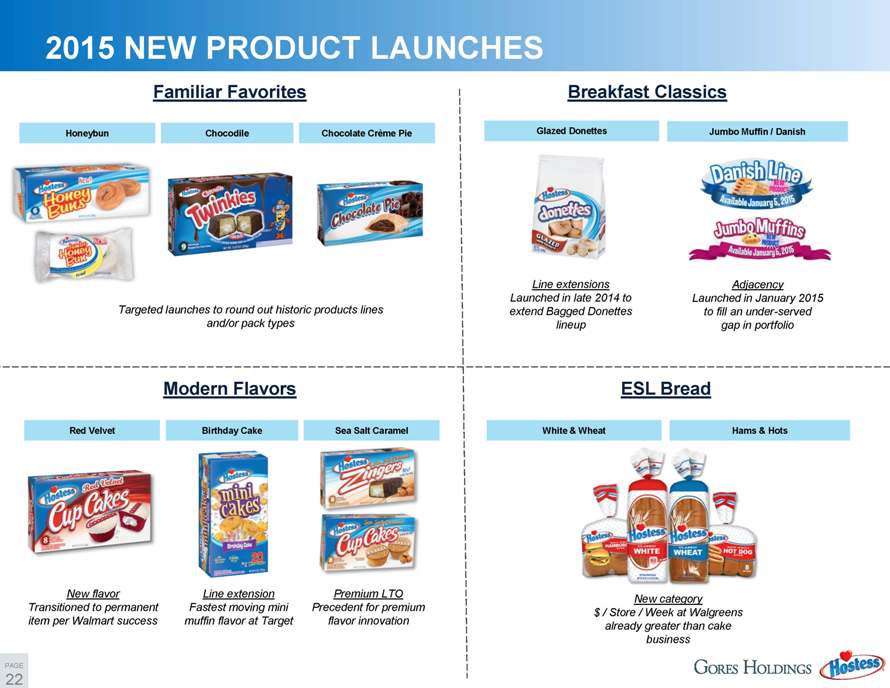
2015 NEW PRODUCT LAUNCHES
Familiar Favorites Breakfast Classics
Modern Flavors ESL Bread
New category
$ / Store / Week at Walgreens
already greater than cake
business
Jumbo Muffin / Danish
Adjacency
Launched in January 2015
to fill an under-served
gap in portfolio
Glazed Donettes
Line extensions
Launched in late 2014 to
extend Bagged Donettes
lineup
Red Velvet
New flavor
Transitioned to permanent
item per Walmart success
Birthday Cake Sea Salt Caramel
Premium LTO
Precedent for premium
flavor innovation
Line extension
Fastest moving mini
muffin flavor at Target
White & Wheat Hams & Hots
Honeybun Chocodile Chocolate Crème Pie
Targeted launches to round out historic products lines
and/or pack types
PAGE
23
®
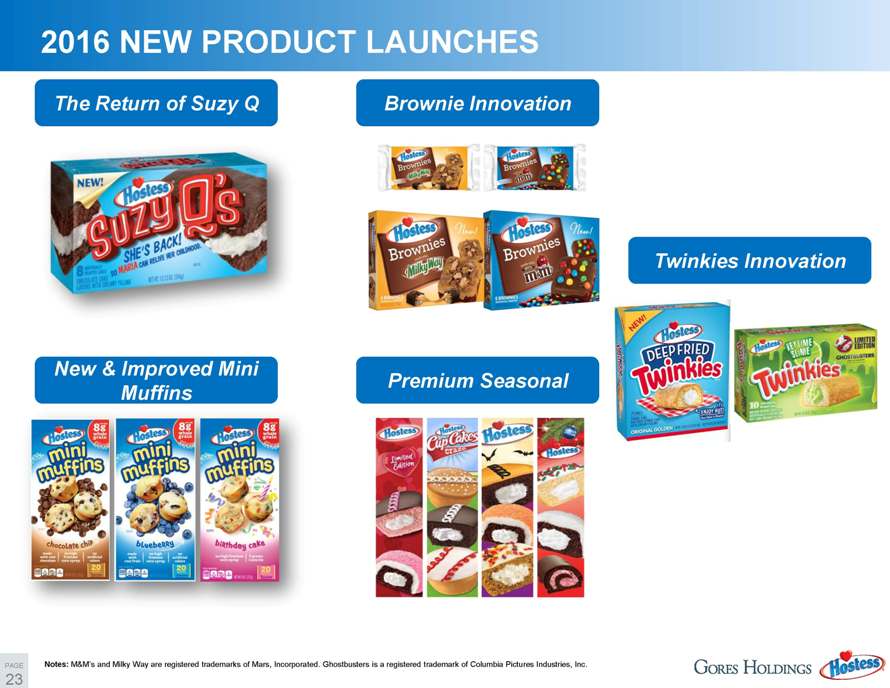
2016 NEW PRODUCT LAUNCHES
The Return of Suzy Q Brownie Innovation
Premium Seasonal
New & Improved Mini
Muffins
Twinkies Innovation
Notes: M&M’s and Milky Way are registered trademarks of Mars, Incorporated. Ghostbusters is a registered trademark of Columbia Pictures Industries, Inc.
PAGE
24
®
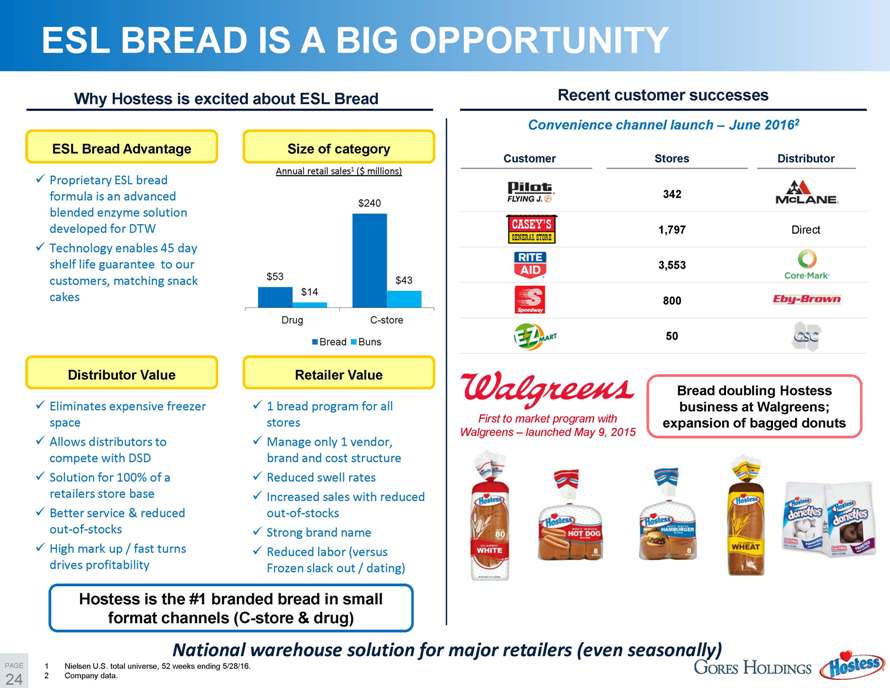
ESL BREAD IS A BIG OPPORTUNITY
Why Hostess is excited about ESL Bread Recent customer successes
Distributor Value Retailer Value
“ Eliminates expensive freezer
space
“ Allows distributors to
compete with DSD
“ Solution for 100% of a
retailers store base
“ Better service & reduced
out-of-stocks
“ High mark up / fast turns
drives profitability
“ 1 bread program for all
stores
“ Manage only 1 vendor,
brand and cost structure
“ Reduced swell rates
“ Increased sales with reduced
out-of-stocks
“ Strong brand name
“ Reduced labor (versus
Frozen slack out / dating)
ESL Bread Advantage
“ Proprietary ESL bread
formula is an advanced
blended enzyme solution
developed for DTW
“ Technology enables 45 day
shelf life guarantee to our
customers, matching snack
cakes
Size of category
National warehouse solution for major retailers (even seasonally)
Bread doubling Hostess
business at Walgreens;
expansion of bagged donuts
Customer Stores Distributor
342
1,797 Direct
3,553
800
50
Convenience channel launch—June 20162
First to market program with
Walgreens—launched May 9, 2015
Annual retail sales1 ($ millions)
Hostess is the #1 branded bread in small
format channels (C-store & drug)
$53
$240
$14
$43
Drug C-store
Bread Buns
| 1 |
|
Nielsen U.S. total universe, 52 weeks ending 5/28/16. |
| 2 |
|
Company data. |

PAGE
25
®
® IV. TRANSACTION SUMMARY AND TIMELINE
PAGE
26
®
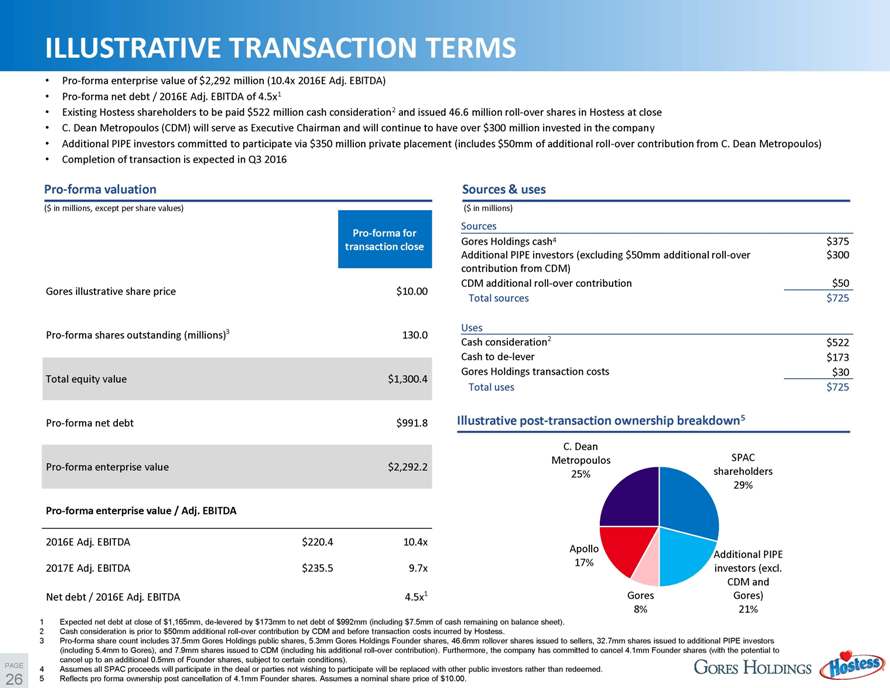
Pro-forma for
transaction close
Gores illustrative share price $10.00
Pro-forma shares outstanding (millions)3 130.0
Total equity value $1,300.4
Pro-forma net debt $991.8
Pro-forma enterprise value $2,292.2
Pro-forma enterprise value / Adj. EBITDA
2016E Adj. EBITDA $220.4 10.4x
2017E Adj. EBITDA $235.5 9.7x
Net debt / 2016E Adj. EBITDA 4.5x1
ILLUSTRATIVE TRANSACTION TERMS
Pro-forma valuation
Illustrative post-transaction ownership breakdown5
o Pro-forma enterprise value of $2,292 million (10.4x 2016E Adj. EBITDA)
o Pro-forma net debt / 2016E Adj. EBITDA of 4.5x1
o Existing Hostess shareholders to be paid $522 million cash consideration2 and issued 46.6 million roll-over shares in Hostess at close
o C. Dean Metropoulos (CDM) will serve as Executive Chairman and will continue to have over $300 million invested in the company
o Additional PIPE investors committed to participate via $350 million private placement (includes $50mm of additional roll-over contribution from C. Dean Metropoulos)
o Completion of transaction is expected in Q3 2016
($ in millions, except per share values)
Sources & uses
($ in millions)
1 Expected net debt at close of $1,165mm, de-levered by $173mm to net debt of $992mm (including $7.5mm of cash remaining on balance sheet).
2 Cash consideration is prior to $50mm additional roll-over contribution by CDM and before transaction costs incurred by Hostess.
3 Pro-forma share count includes 37.5mm Gores Holdings public shares, 5.3mm Gores Holdings Founder shares, 46.6mm rollover shares issued to sellers, 32.7mm shares issued to additional PIPE investors
(including 5.4mm to Gores), and 7.9mm shares issued to CDM (including his additional roll-over contribution). Furthermore, the company has committed to cancel 4.1mm Founder shares (with the potential to
cancel up to an additional 0.5mm of Founder shares, subject to certain conditions).
4 Assumes all SPAC proceeds will participate in the deal or parties not wishing to participate will be replaced with other public investors rather than redeemed.
| 5 |
|
Reflects pro forma ownership post cancellation of 4.1mm Founder shares. Assumes a nominal share price of $10.00. |
Sources
Gores Holdings cash4 $375
Additional PIPE investors (excluding $50mm additional roll-over
contribution from CDM)
$300
CDM additional roll-over contribution $50
Total sources $725
Uses
Cash consideration2 $522
Cash to de-lever $173
Gores Holdings transaction costs $30
Total uses $725
SPAC
shareholders
29%
Additional PIPE
investors (excl.
CDM and
Gores)
21%
Gores
8%
Apollo
17%
C. Dean
Metropoulos
25%
PAGE
27
®
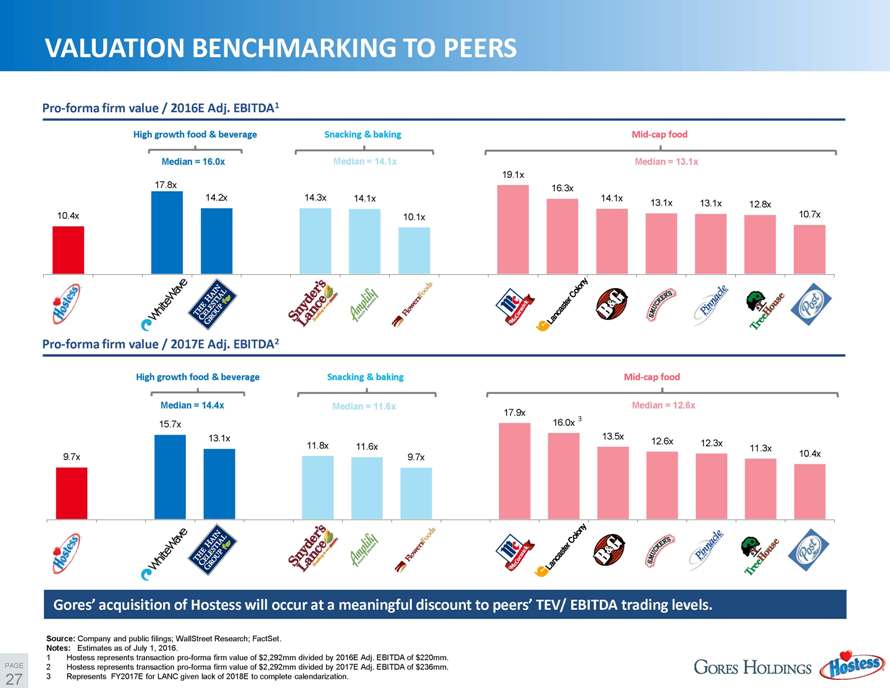
9.7x
15.7x
13.1x
11.8x 11.6x
9.7x
17.9x
16.0x
13.5x
12.6x 12.3x
11.3x
10.4x
Median = 14.4x Median = 11.6x Med ian = 12.6x
VALUATION BENCHMARKING TO PEERS
High growth food & beverage Snacking & baking Mid-cap food
Pro-forma firm value / 2016E Adj. EBITDA1
Pro-forma firm value / 2017E Adj. EBITDA2
Gores’ acquisition of Hostess will occur at a meaningful discount to peers’ TEV/ EBITDA trading levels.
High growth food & beverage Snacking & baking Mid-cap food
| 3 |
|
Source: Company and public filings; WallStreet Research; FactSet.
Notes: Estimates as of July 1, 2016.
| 1 |
|
Hostess represents transaction pro-forma firm value of $2,292mm divided by 2016E Adj. EBITDA of $220mm. |
| 2 |
|
Hostess represents transaction pro-forma firm value of $2,292mm divided by 2017E Adj. EBITDA of $236mm. |
| 3 |
|
Represents FY2017E for LANC given lack of 2018E to complete calendarization. |
10.4x
17.8x
14.2x 14.3x 14.1x
10.1x
19.1x
16.3x
14.1x
13.1x 13.1x 12.8x
10.7x
Median = 16.0x Median = 14.1x M e d ian = 13.1x
PAGE
28
®
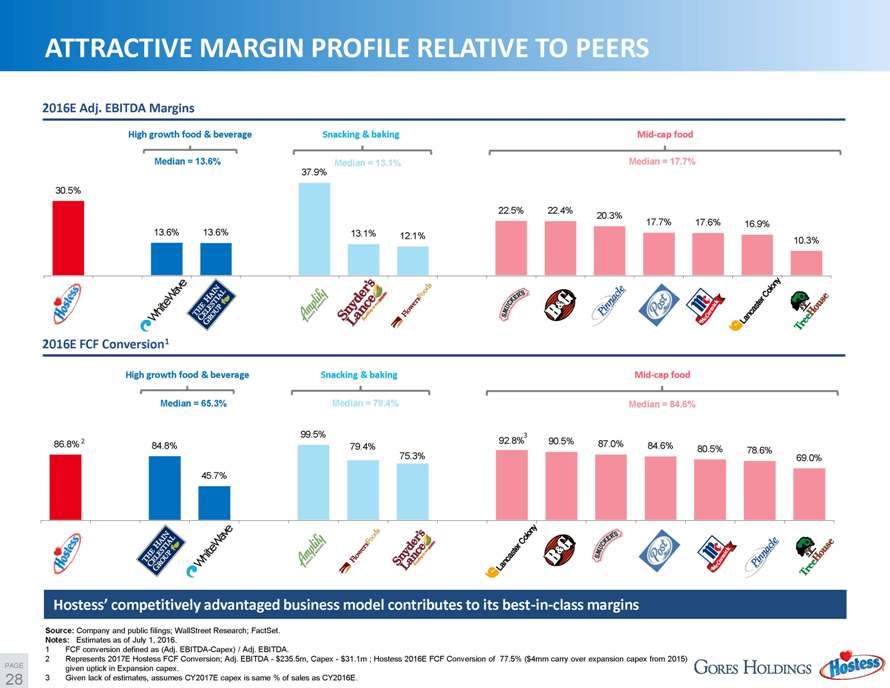
ATTRACTIVE MARGIN PROFILE RELATIVE TO PEERS
2016E Adj. EBITDA Margins
2016E FCF Conversion1
Hostess’ competitively advantaged business model contributes to its best-in-class margins
High growth food & beverage Snacking & baking Mid-cap food
High growth food & beverage Snacking & baking Mid-cap food
| 3 |
|
2 |
Source: Company and public filings; WallStreet Research; FactSet.
Notes: Estimates as of July 1, 2016.
| 1 |
|
FCF conversion defined as (Adj. EBITDA-Capex) / Adj. EBITDA. |
2 Represents 2017E Hostess FCF Conversion; Adj. EBITDA—$235.5m, Capex—$31.1m ; Hostess 2016E FCF Conversion of 77.5% ($4mm carry over expansion capex from 2015)
given uptick in Expansion capex.
| 3 |
|
Given lack of estimates, assumes CY2017E capex is same % of sales as CY2016E. |
30.5%
13.6% 13.6%
37.9%
13.1% 12.1%
22.5% 22.4%
20.3%
17.7% 17.6% 16.9%
10.3%
Median = 13.6% Median = 13.1% Med ian = 17.7%
86.8% 84.8%
45.7%
99.5%
79.4%
75.3%
92.8% 90.5% 87.0% 84.6% 80.5% 78.6%
69.0%
Median = 65.3 % Median = 79.4% Me d ian = 84.6%
PAGE
29
®
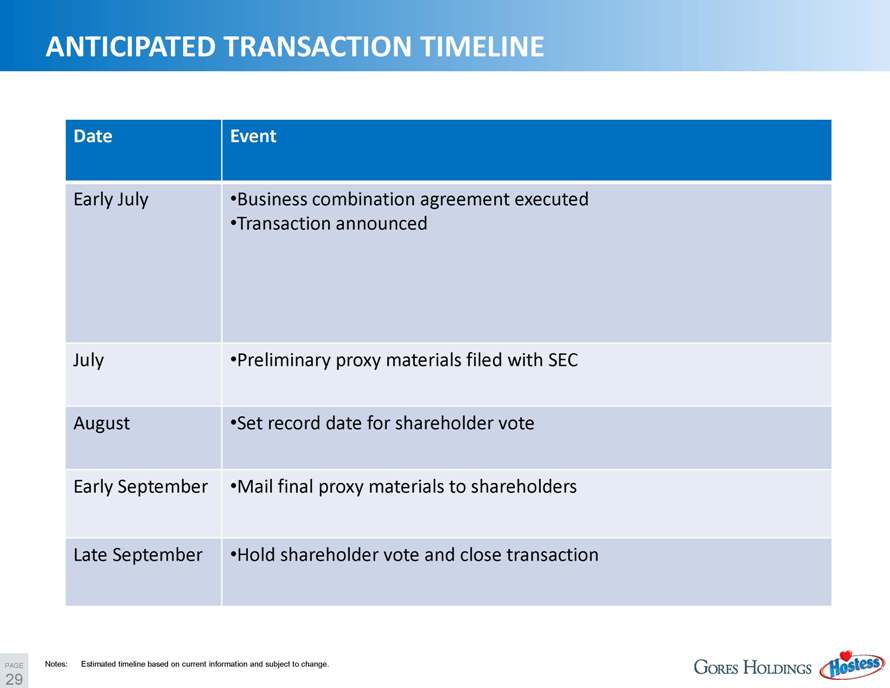
ANTICIPATED TRANSACTION TIMELINE
29
Date Event
Early July oBusiness combination agreement executed
oTransaction announced
July oPreliminary proxy materials filed with SEC
August oSet record date for shareholder vote
Early September oMail final proxy materials to shareholders
Late September oHold shareholder vote and close transaction
Notes: Estimated timeline based on current information and subject to change.
PAGE
30
®
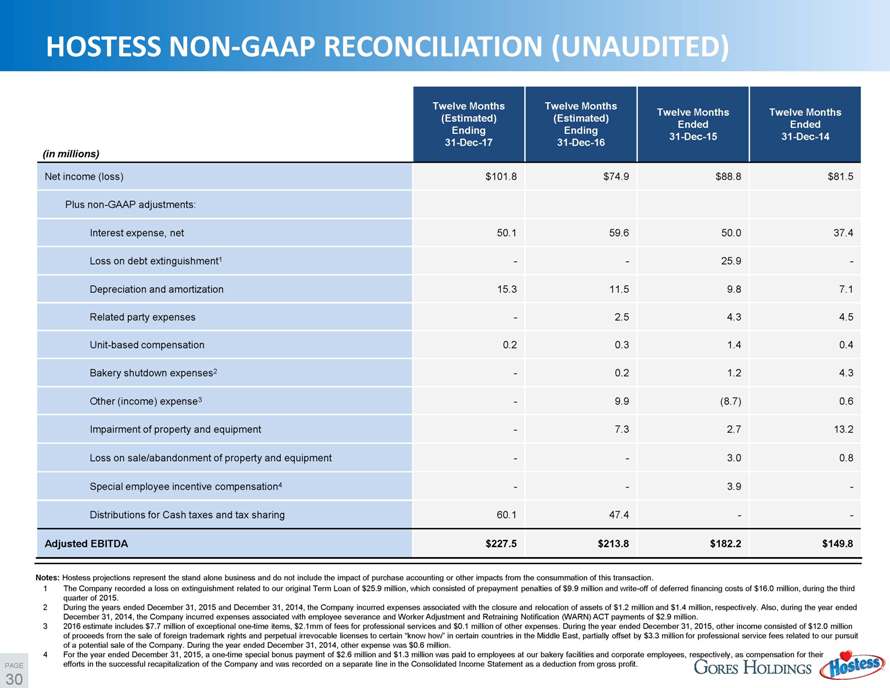
HOSTESS NON-GAAP RECONCILIATION (UNAUDITED)
30
Twelve Months
(Estimated)
Ending
31-Dec-17
Twelve Months
(Estimated)
Ending
31-Dec-16
Twelve Months
Ended
31-Dec-15
Twelve Months
Ended
31-Dec-14
Net income (loss) $101.8 $74.9 $88.8 $81.5
Plus non-GAAP adjustments:
Interest expense, net 50.1 59.6 50.0 37.4
Loss on debt extinguishment1 — 25.9 -
Depreciation and amortization 15.3 11.5 9.8 7.1
Related party expenses—2.5 4.3 4.5
Unit-based compensation 0.2 0.3 1.4 0.4
Bakery shutdown expenses2—0.2 1.2 4.3
Other (income) expense3—9.9 (8.7) 0.6
Impairment of property and equipment—7.3 2.7 13.2
Loss on sale/abandonment of property and equipment — 3.0 0.8
Special employee incentive compensation4 — 3.9 -
Distributions for Cash taxes and tax sharing 60.1 47.4 —
Adjusted EBITDA $227.5 $213.8 $182.2 $149.8
1 The Company recorded a loss on extinguishment related to our original Term Loan of $25.9 million, which consisted of prepayment penalties of $9.9 million and write-off of deferred financing costs of $16.0 million, during the third
quarter of 2015.
2 During the years ended December 31, 2015 and December 31, 2014, the Company incurred expenses associated with the closure and relocation of assets of $1.2 million and $1.4 million, respectively. Also, during the year ended
December 31, 2014, the Company incurred expenses associated with employee severance and Worker Adjustment and Retraining Notification (WARN) ACT payments of $2.9 million.
3 2016 estimate includes $7.7 million of exceptional one-time items, $2.1mm of fees for professional services and $0.1 million of other expenses. During the year ended December 31, 2015, other income consisted of $12.0 million
of proceeds from the sale of foreign trademark rights and perpetual irrevocable licenses to certain “know how” in certain countries in the Middle East, partially offset by $3.3 million for professional service fees related to our pursuit
of a potential sale of the Company. During the year ended December 31, 2014, other expense was $0.6 million.
4 For the year ended December 31, 2015, a one-time special bonus payment of $2.6 million and $1.3 million was paid to employees at our bakery facilities and corporate employees, respectively, as compensation for their
efforts in the successful recapitalization of the Company and was recorded on a separate line in the Consolidated Income Statement as a deduction from gross profit.
Notes: Hostess projections represent the stand alone business and do not include the impact of purchase accounting or other impacts from the consummation of this transaction.
(in millions)
PAGE
31
®
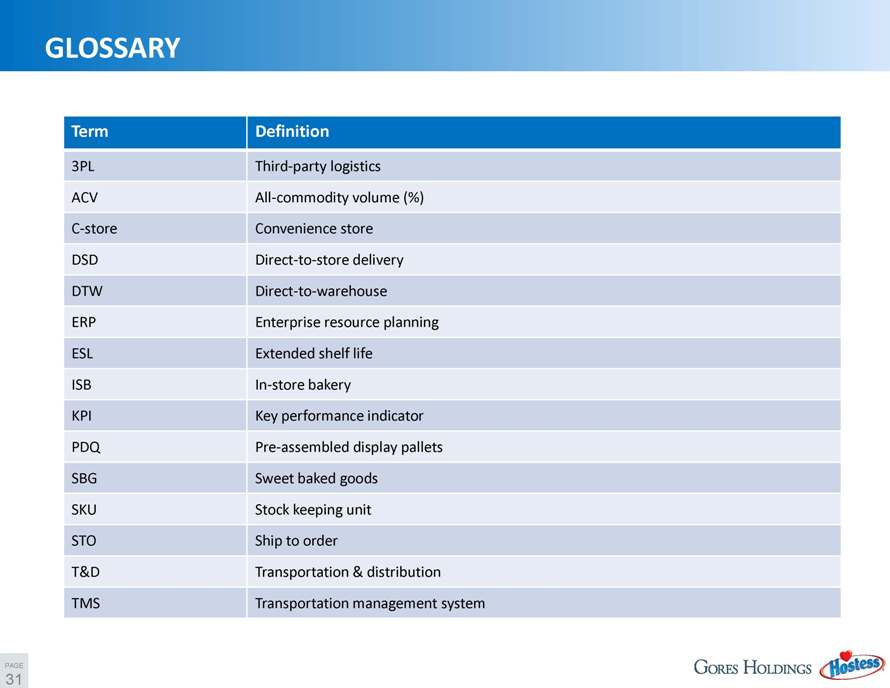
GLOSSARY
Term Definition
3PL Third-party logistics
ACV All-commodity volume (%)
C-store Convenience store
DSD Direct-to-store delivery
DTW Direct-to-warehouse
ERP Enterprise resource planning
ESL Extended shelf life
ISB In-store bakery
KPI Key performance indicator
PDQ Pre-assembled display pallets
SBG Sweet baked goods
SKU Stock keeping unit
STO Ship to order
T&D Transportation & distribution
TMS Transportation management system