Attached files
| file | filename |
|---|---|
| EX-99.3 - EX-99.3 - Triangle Petroleum Corp | tplm-20160624ex9939758cb.htm |
| EX-99.2 - EX-99.2 - Triangle Petroleum Corp | tplm-20160624ex9927594c6.htm |
| EX-10.1 - EX-10.1 - Triangle Petroleum Corp | tplm-20160624ex1013654dc.htm |
| EX-4.1 - EX-4.1 - Triangle Petroleum Corp | tplm-20160624ex41c4e76bd.htm |
| EX-3.1 - EX-3.1 - Triangle Petroleum Corp | tplm-20160624ex31ea62f77.htm |
| 8-K - 8-K - Triangle Petroleum Corp | tplm-20160624x8k.htm |
|
|
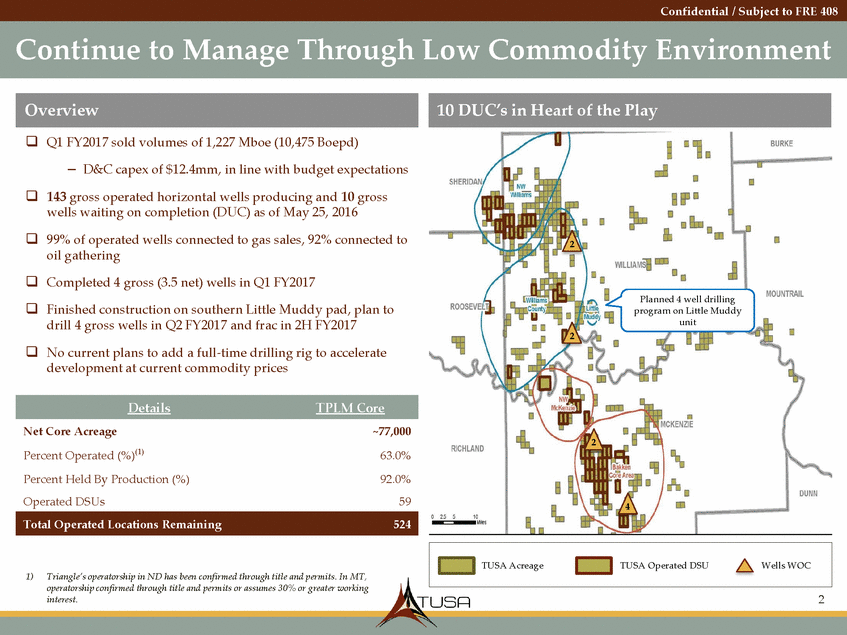
Confidential / Subject to FRE 408 Continue to Manage Through Low Commodity Environment Q1 FY2017 sold volumes of 1,227 Mboe (10,475 Boepd) – D&C capex of $12.4mm, in line with budget expectations 143 gross operated horizontal wells producing and 10 gross wells waiting on completion (DUC) as of May 25, 2016 99% of operated wells connected to gas sales, 92% connected to oil gathering 2 Completed 4 gross (3.5 net) wells in Q1 FY2017 Planned 4 well drilling program on Little Muddy unit Finished construction on southern Little Muddy pad, plan to drill 4 gross wells in Q2 FY2017 and frac in 2H FY2017 2 No current plans to add a full-time drilling rig to accelerate development at current commodity prices Net Core Acreage Percent Operated (%)(1) Percent Held By Production (%) Operated DSUs ~77,000 63.0% 92.0% 59 2 4 1)Triangle’s operatorship in ND has been confirmed through title and permits. In MT, operatorship confirmed through title and permits or assumes 30% or greater working interest. 2 TUSA AcreageTUSA Operated DSUWells WOC Total Operated Locations Remaining524 DetailsTPLM Core 10 DUC’s in Heart of the Play Overview |
|
|
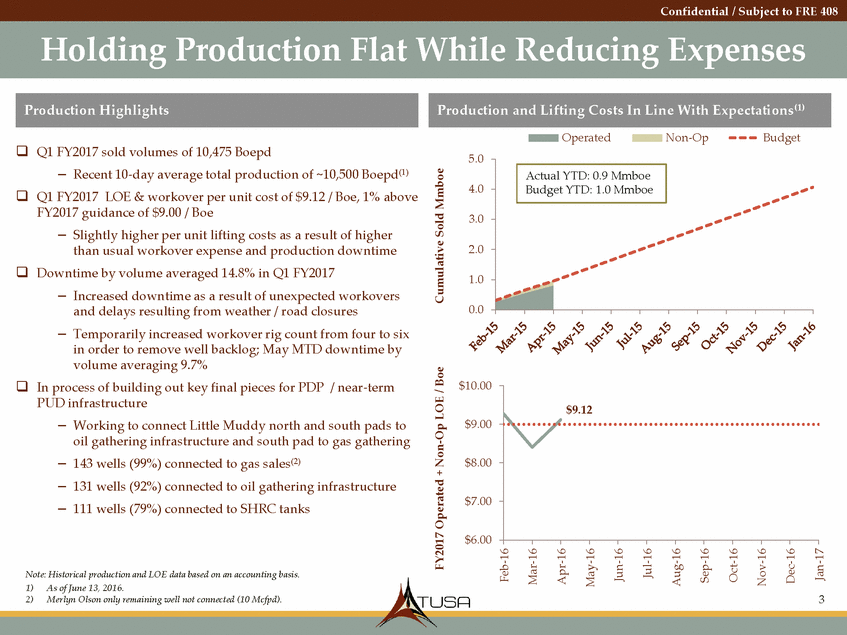
Confidential / Subject to FRE 408 Holding Production Flat While Reducing Expenses Operated Non-Op Budget Q1 FY2017 sold volumes of 10,475 Boepd – Recent 10-day average total production of ~10,500 Boepd(1) Q1 FY2017 LOE & workover per unit cost of $9.12 / Boe, 1% above FY2017 guidance of $9.00 / Boe – Slightly higher per unit lifting costs as a result of higher than usual workover expense and production downtime Downtime by volume averaged 14.8% in Q1 FY2017 5.0 4.0 3.0 2.0 1.0 – Increased downtime as a result of unexpected workovers and delays resulting from weather / road closures Temporarily increased workover rig count from four to six in order to remove well backlog; May MTD downtime by volume averaging 9.7% 0.0 – $10.00 In process of building out key final pieces for PDP PUD infrastructure / near-term – $9.00 Working to connect Little Muddy north and south pads to oil gathering infrastructure and south pad to gas gathering 143 wells (99%) connected to gas sales(2) 131 wells (92%) connected to oil gathering infrastructure 111 wells (79%) connected to SHRC tanks – – – $8.00 $7.00 $6.00 Note: Historical production and LOE data based on an accounting basis. 1)As of June 13, 2016. 2)Merlyn Olson only remaining well not connected (10 Mcfpd). 3 FY2017 Operated + Non-Op LOE / Boe Cumulative Sold Mmboe Feb-16 Mar-16 Apr-16 May-16 Jun-16 Jul-16 Aug-16 Sep-16 Oct-16 Nov-16 Dec-16 Jan-17 $9.12 Actual YTD: 0.9 Mmboe Budget YTD: 1.0 Mmboe Production and Lifting Costs In Line With Expectations(1) Production Highlights |
|
|
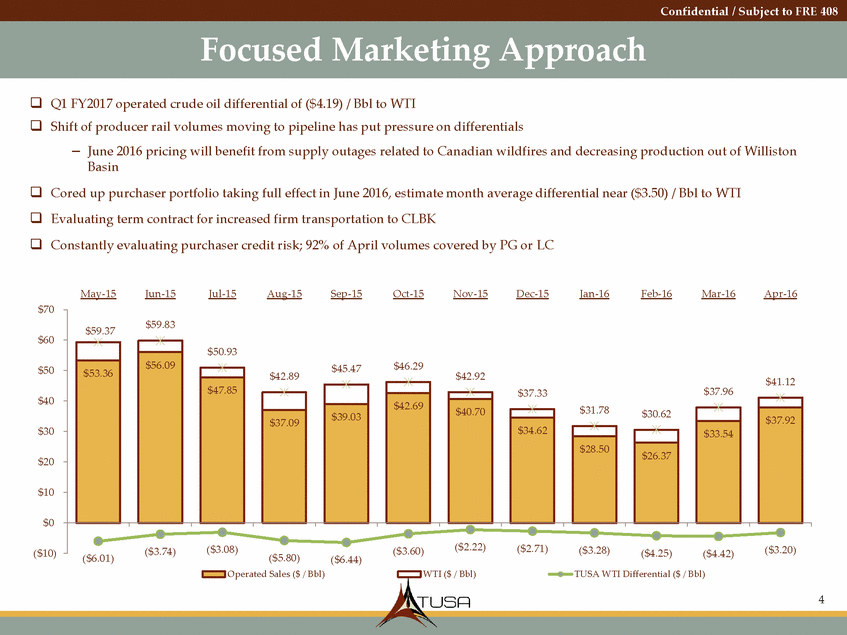
Confidential / Subject to FRE 408 Focused Marketing Approach Q1 FY2017 operated crude oil differential of ($4.19) / Bbl to WTI Shift of producer rail volumes moving to pipeline has put pressure on differentials – June 2016 pricing will benefit from supply outages related to Canadian wildfires and decreasing production out of Williston Basin Cored up purchaser portfolio taking full effect in June 2016, estimate month average differential near ($3.50) / Bbl to WTI Evaluating term contract for increased firm transportation to CLBK Constantly evaluating purchaser credit risk; 92% of April volumes covered by PG or LC May-15 Jun-15 Jul-15 Aug-15 Sep-15 Oct-15 Nov-15 Dec-15 Jan-16 Feb-16 Mar-16 Apr-16 $70 $60 $46.29 $50 $41.12 $37.96 $37.33 $40 $30 $20 $10 $0 ($2.22) ($2.71) ($3.08) ($3.28) ($3.20) ($3.74) ($3.60) ($10) ($4.25) ($4.42) ($6.01) ($5.80) ($6.44) Operated Sales ($ / Bbl) WTI ($ / Bbl) TUSA WTI Differential ($ / Bbl) 4 $59.37$59.83 $50.93 $56.09 $53.36 $42.89$45.47$42.92 $47.85 $42.69 $40.70 $39.03 $37.09 $31.78$30.62 $37.92 $34.62 $33.54 $28.50 $26.37 |
|
|
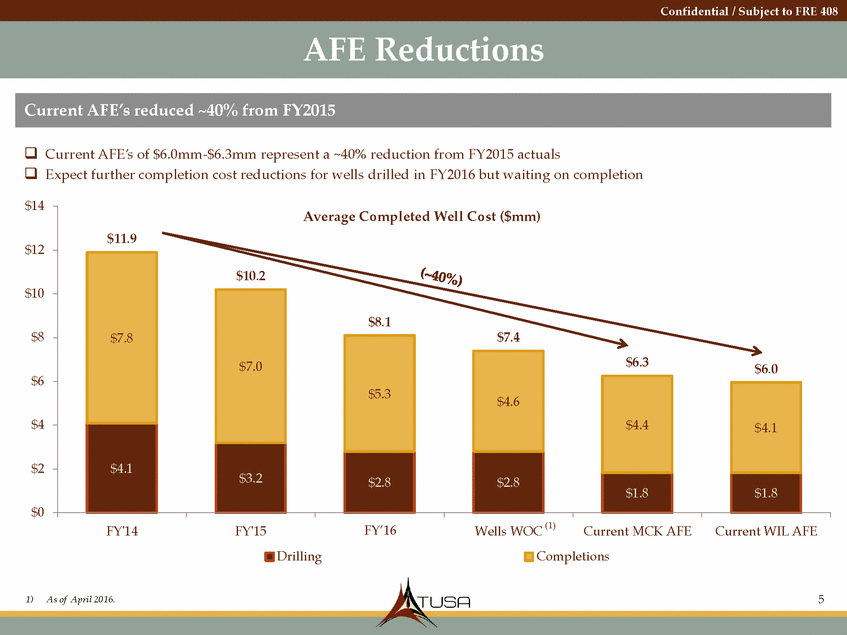
Confidential / Subject to FRE 408 AFE Reductions Current AFE’s of $6.0mm-$6.3mm represent a ~40% reduction from FY2015 actuals Expect further completion cost reductions for wells drilled in FY2016 but waiting on completion $14 $12 $10 $8 $6 $4 $2 $0 Wells WOC (1) FY'14 FY'15 FYF'1Y6’1Y6TD Current MCK AFE Current WIL AFE Drilling Completions 1)As of April 2016. 5 Average Completed Well Cost ($mm) $11.9 $7.8 $10.2 $7.0 $8.1 $5.3 $7.4 $4.6 $6.3$6.0 $4.4 $4.1 $4.1 $3.2 $2.8 $2.8 $1.8 $1.8 Current AFE’s reduced ~40% from FY2015 |
|
|
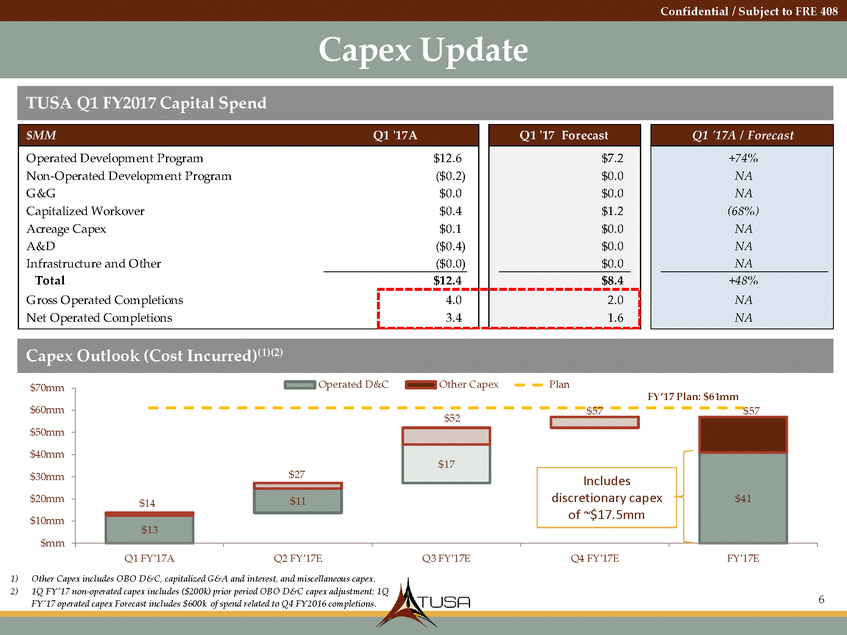
Confidential / Subject to FRE 408 Capex Update Operated D&C Other Capex Plan $70mm $60mm $50mm $40mm $30mm $20mm $10mm $mm Q1 FY'17A Q2 FY'17E Q3 FY'17E Q4 FY'17E FY'17E 1)Other Capex includes OBO D&C, capitalized G&A and interest, and miscellaneous capex. 2)1Q FY’17 non-operated capex includes ($200k) prior period OBO D&C capex adjustment; 1Q FY’17 operated capex Forecast includes $600k of spend related to Q4 FY2016 completions. 6 FY’17 Plan: $61mm $57$57 $52 $27 $14 $41 $13 $11 Includes discretionary capex of ~$17.5mm $17 Capex Outlook (Cost Incurred)(1)(2) Q1 '17A / Forecast +74% NA NA (68%) NA NA NA +48% NA NA $MMQ1 '17A Q1 '17 Forecast Operated Development Program$12.6 Non-Operated Development Program($0.2) G &G $0.0 Capitalized Workover$0.4 Acreage Capex$0.1 A&D($0.4) Infrastructure and Other($0.0) Total$12.4 $7.2 $0.0 $0.0 $1.2 $0.0 $0.0 $0.0 $8.4 G ross Operated Completions Net Operated Completions 4.0 3.4 2.0 1.6 TUSA Q1 FY2017 Capital Spend |
|
|
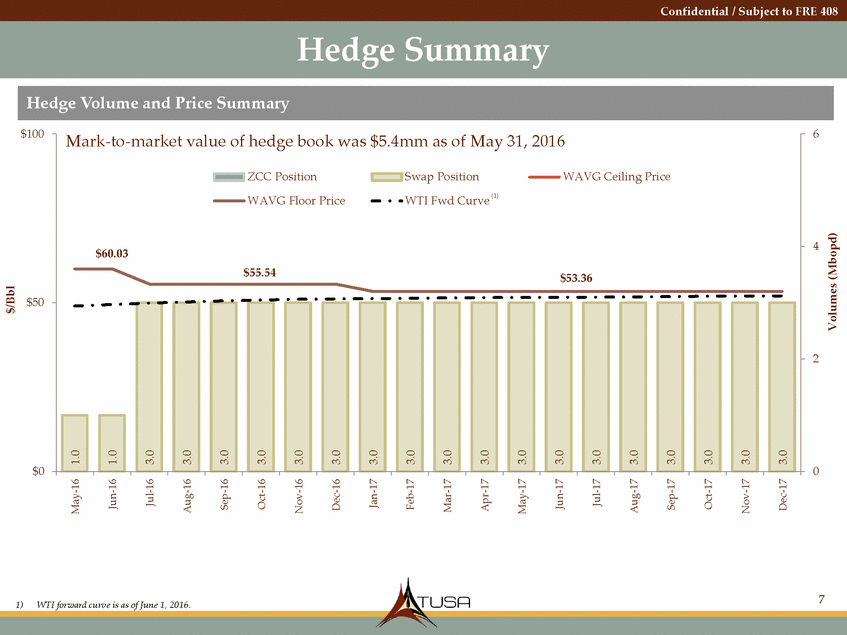
Confidential / Subject to FRE 408 Hedge Summary $100 6 WAVG Floor Price WTI Fwd Curve 4 $50 2 $0 0 7 1)WTI forward curve is as of June 1, 2016. $/Bbl 1.0 May-16 Jun-16 1.0 Jul-16 3.0 Aug-16 3.0 Sep-16 3.0 Oct-16 3.0 Nov-16 3.0 Dec-16 3.0 3.0 Jan-17 Feb-17 3.0 Mar-17 3.0 3.0 Apr-17 May-17 3.0 Jun-17 3.0 3.0 Jul-17 Aug-17 3.0 Sep-17 3.0 3.0 Oct-17 Nov-17 3.0 Dec-17 3.0 Volumes (Mbopd) Mark-to-market value of hedge book was $5.4mm as of May 31, 2016 ZCC PositionSwap PositionWAVG Ceiling Price (1) $60.03 $55.54$53.36 HHeeddggeeVVoolluummee,aPnrdicPerSicuemSmumarmy ary |
|
|
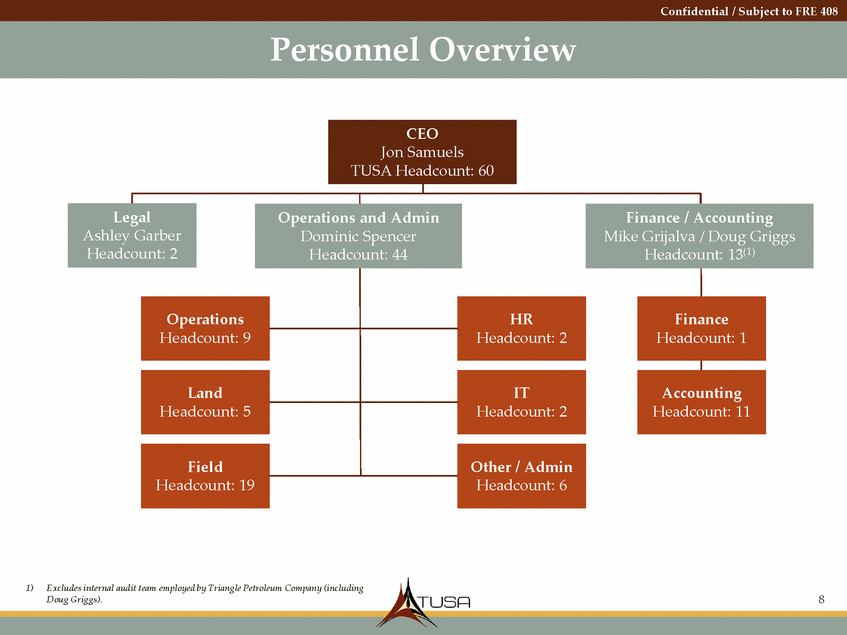
Confidential / Subject to FRE 408 Personnel Overview 1)Excludes internal audit team employed by Triangle Petroleum Company (including Doug Griggs). 8 CEO Jon Samuels TUSA Headcount: 60 Legal Ashley Garber Headcount: 2 Operations and Admin Dominic Spencer Headcount: 44 Finance / Accounting Mike Grijalva / Doug Griggs Headcount: 13(1) Operations Headcount: 9 HR Headcount: 2 Finance Headcount: 1 Land Headcount: 5 IT Headcount: 2 Accounting Headcount: 11 Field Headcount: 19 Other / Admin Headcount: 6 |
|
|
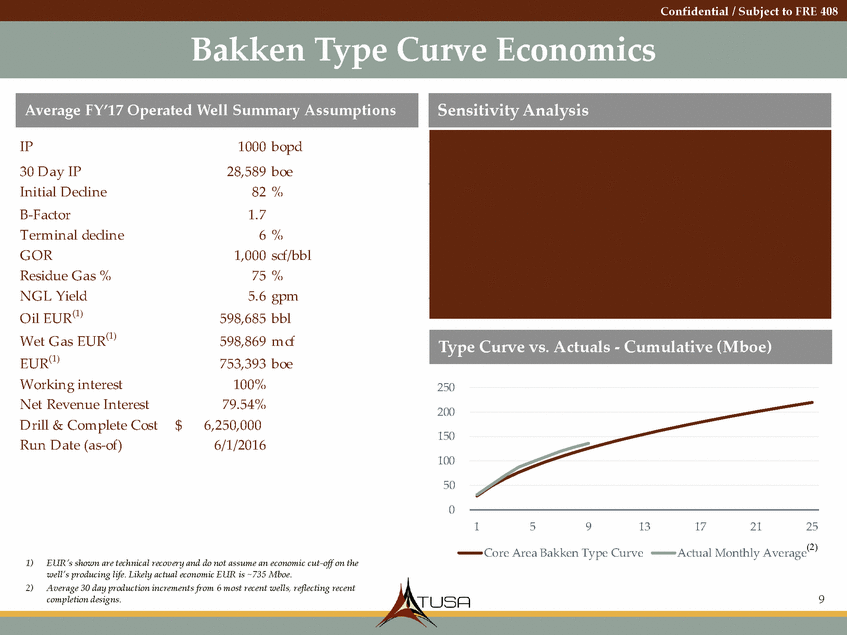
Confidential / Subject to FRE 408 Bakken Type Curve Economics IP 30 Day IP Initial Decline B-Factor Terminal decline G OR Residue G as % NG L Yield Oil EUR(1) 1000 bopd 28,589 boe 82 % 1.7 6 % 1,000 scf/bbl 75 % 5.6 gpm 598,685 bbl 598,869 mcf 753,393 boe 100% 79.54% 6,250,000 6/1/2016 (1) Wet G as EUR EUR(1) Working interest Net Revenue Interest Drill & Complete Cost Run Date (as-of) 250 200 $ 150 100 50 0 1 5 9 13 17 21 25 (2) Core Area Bakken Type Curve Actual Monthly Average 1)EUR’s shown are technical recovery and do not assume an economic cut-off on the well’s producing life. Likely actual economic EUR is ~735 Mboe. 2)Average 30 day production increments from 6 most recent wells, reflecting recent completion designs. 9 Type Curve vs. Actuals - Cumulative (Mboe) Sensitivity Analysis Dedication (Oil/Gas) Dedication (Oil/Gas) Dedication (Oil/Gas) Caliber /Caliber (2) Other /OneokCaliber /Other Oil Pr icePV10IRRPV10IRRPV10IRR $40($1.4)3.1%$0.110.4%($0.2)9.0% 500.914.9%2.424.4%2.122.6% 6/1 S trip1.819.0%3.328.3%3.026.3% 603.230.0%4.843.1%4.540.0% 705.650.1%7.167.3%6.863.5% Average FY’17 Operated Well Summary Assumptions |
|
|
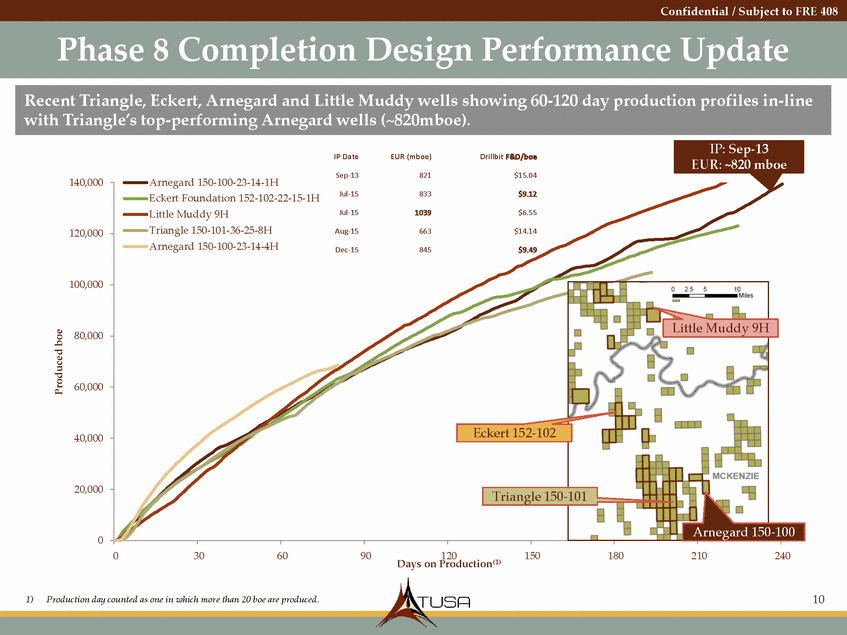
Confidential / Subject to FRE 408 Phase 8 Completion Design Performance Update IP: Sep-13 EUR: ~820 mboe IP Date EUR (mboe) Drillbit F&D/boe Sep-13 821 $15.04 140,000 Arnegard 150-100-23-14-1H 120,000 100,000 80,000 60,000 40,000 20,000 150-100 0 0 30 60 90 120 Days on Production(1) 150 180 210 240 1)Production day counted as one in which more than 20 boe are produced. 10 Produced boe Eckert Foundation 152-102-22-15-1HJul-15833$9.12 Little Muddy 9HJul-151039$6.55 Triangle 150-101-36-25-8HAug-15663$14.14 Arnegard 150-100-23-14-4HDec-15845$9.49 Eckert 152-102 Triangle 150-Little Muddy 9H 101 Arnegard Recent Triangle, Eckert, Arnegard and Little Muddy wells showing 60-120 day production profiles in-line with Triangle’s top-performing Arnegard wells (~820mboe). |
|
|
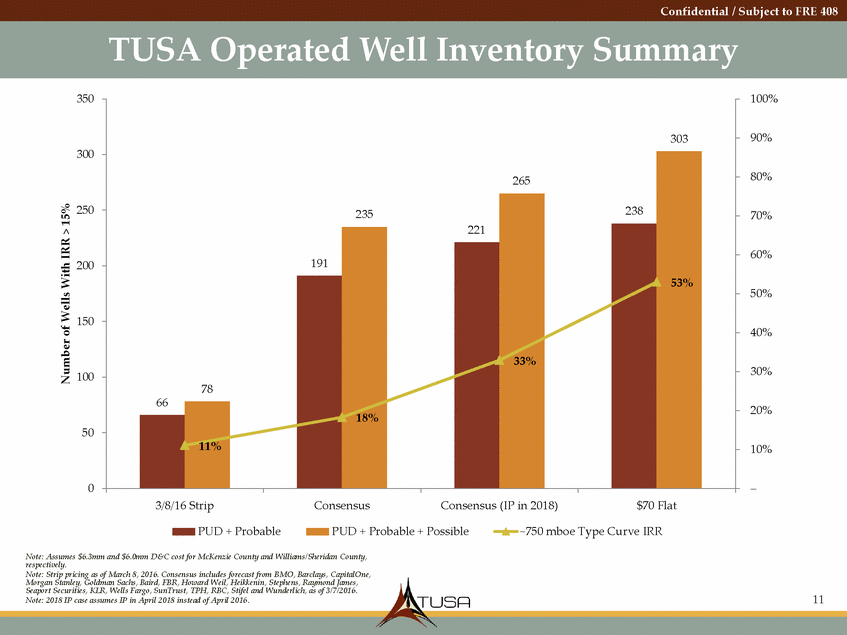
Confidential / Subject to FRE 408 TUSA Operated Well Inventory Summary 350 100% 90% 300 80% 250 70% 60% 200 50% 150 40% 30% 100 20% 50 10% 0 – 3/8/16 Strip Consensus Consensus (IP in 2018) $70 Flat PUD + Probable PUD + Probable + Possible ~750 mboe Type Curve IRR Note: Assumes $6.3mm and $6.0mm D&C cost for McKenzie County and Williams/Sheridan County, respectively. Note: Strip pricing as of March 8, 2016. Consensus includes forecast from BMO, Barclays, CapitalOne, Morgan Stanley, Goldman Sachs, Baird, FBR, Howard Weil, Heikkenin, Stephens, Raymond James, Seaport Securities, KLR, Wells Fargo, SunTrust, TPH, RBC, Stifel and Wunderlich, as of 3/7/2016. Note: 2018 IP case assumes IP in April 2018 instead of April 2016. 11 Number of Wells With IRR > 15% 303 265 53% 235 33% 238 191 18% 221 78 66 11% |
|
|
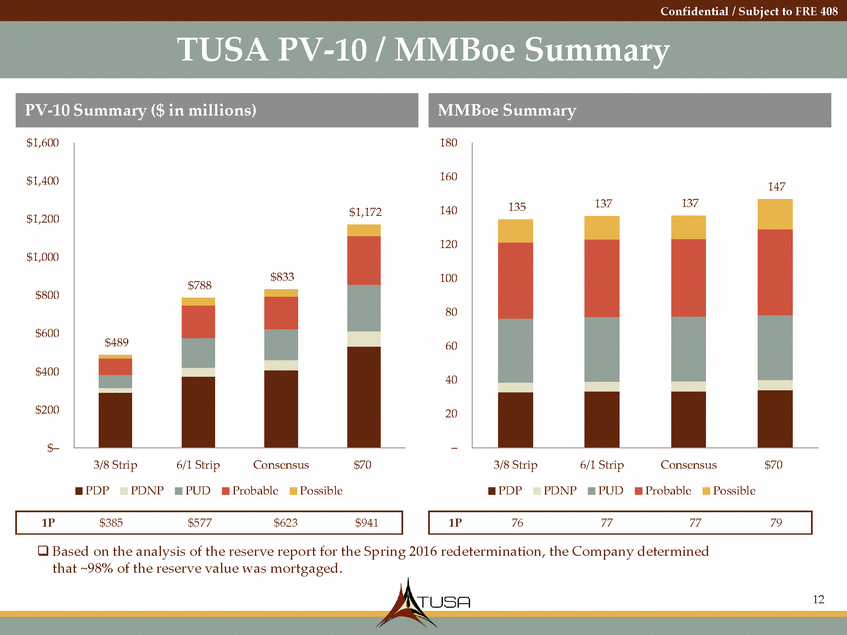
Confidential / Subject to FRE 408 TUSA PV-10 / MMBoe Summary $1,600 180 160 $1,400 140 $1,200 120 $1,000 100 $788 $800 80 $600 60 $400 40 $200 20 $– – 3/8 Strip 6/1 Strip Consensus $70 3/8 Strip 6/1 Strip Consensus $70 PDP PDNP PUD Probable Possible PDP PDNP PUD Probable Possible Based on the analysis of the reserve report for the Spring 2016 redetermination, the Company determined that ~98% of the reserve value was mortgaged. 12 1P76777779 1P$385$577$623$941 $1,172 $833 $489 147 135137137 MMBoe Summary PV-10 Summary ($ in millions) |
|
|
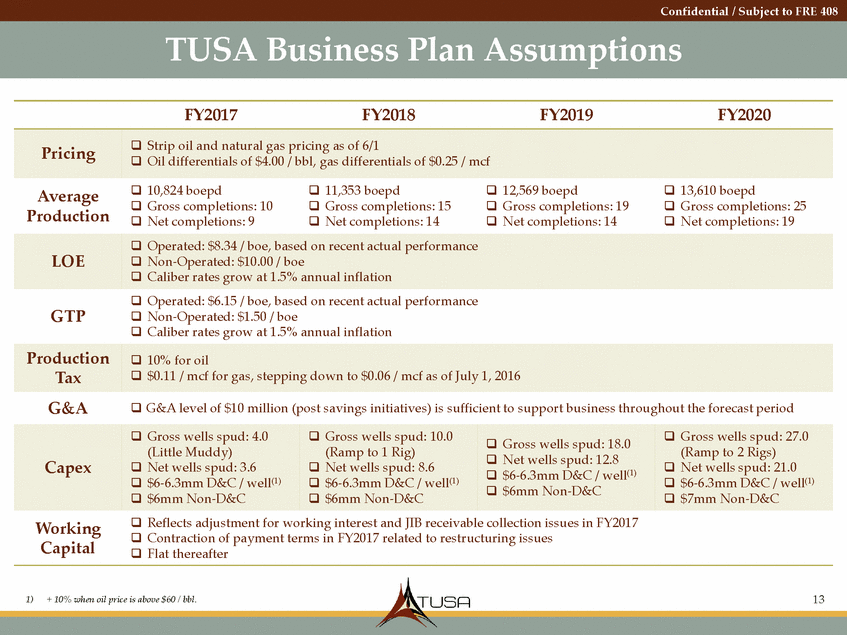
Confidential / Subject to FRE 408 TUSA Business Plan Assumptions FY2017 FY2018 FY2019 FY2020 Pricing Oil differentials of $4.00 / bbl, gas differentials of $0.25 / mcf 10,824 boepd Gross completions: 10 Net completions: 9 11,353 boepd Gross completions: 15 Net completions: 14 12,569 boepd Gross completions: 19 Net completions: 14 13,610 boepd Gross completions: 25 Net completions: 19 Average Production Caliber rates grow at 1.5% annual inflation Operated: $6.15 / boe, based on recent actual performance Non-Operated: $1.50 / boe Caliber rates grow at 1.5% annual inflation GTP G&A G&A level of $10 million (post savings initiatives) is sufficient to support business throughout the forecast period (Little Muddy) (Ramp to 1 Rig) (Ramp to 2 Rigs) Net wells spud: 12.8 $6-6.3mm D&C / well(1) $6-6.3mm D&C / well(1) $6-6.3mm D&C / well(1) $6mm Non-D&C Reflects adjustment for working interest and JIB receivable collection issues in FY2017 Contraction of payment terms in FY2017 related to restructuring issues Flat thereafter Working Capital 1)+ 10% when oil price is above $60 / bbl. 13 Gross wells spud: 4.0 Gross wells spud: 10.0 Gross wells spud: 18.0 Gross wells spud: 27.0 Capex Net wells spud: 3.6 Net wells spud: 8.6 $6-6.3mm D&C / well(1) Net wells spud: 21.0 $6mm Non-D&C $6mm Non-D&C $7mm Non-D&C Production 10% for oil Tax $0.11 / mcf for gas, stepping down to $0.06 / mcf as of July 1, 2016 Operated: $8.34 / boe, based on recent actual performance LOE Non-Operated: $10.00 / boe Strip oil and natural gas pricing as of 6/1 |
|
|
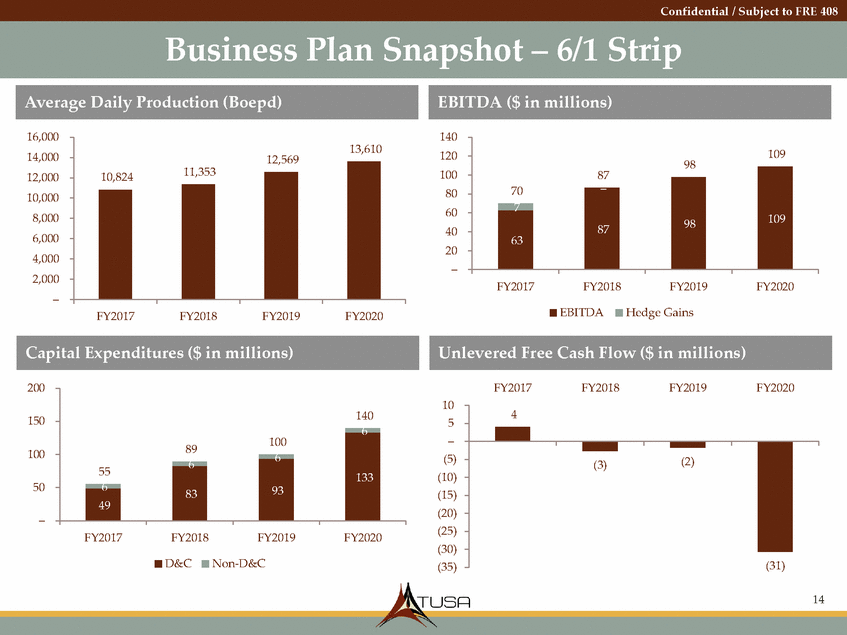
Confidential / Subject to FRE 408 Business Plan Snapshot – 6/1 Strip 16,000 14,000 12,000 10,000 8,000 6,000 4,000 2,000 – 140 120 100 80 60 40 20 – 12,569 87 FY2017 FY2018 FY2019 FY2020 EBITDA Hedge Gains FY2017 FY2018 FY2019 FY2020 200 FY2017 FY2018 FY2019 FY2020 10 5 – (5) (10) (15) (20) (25) (30) (35) 150 89 100 50 – FY2017 FY2018 FY2019 FY2020 D&C Non-D&C (31) 14 4 (3)(2) 140 100 133 93 55 83 49 Unlevered Free Cash Flow ($ in millions) Capital Expenditures ($ in millions) 98109 109 98 70 87 63 13,610 10,82411,353 EBITDA ($ in millions) Average Daily Production (Boepd) |
|
|
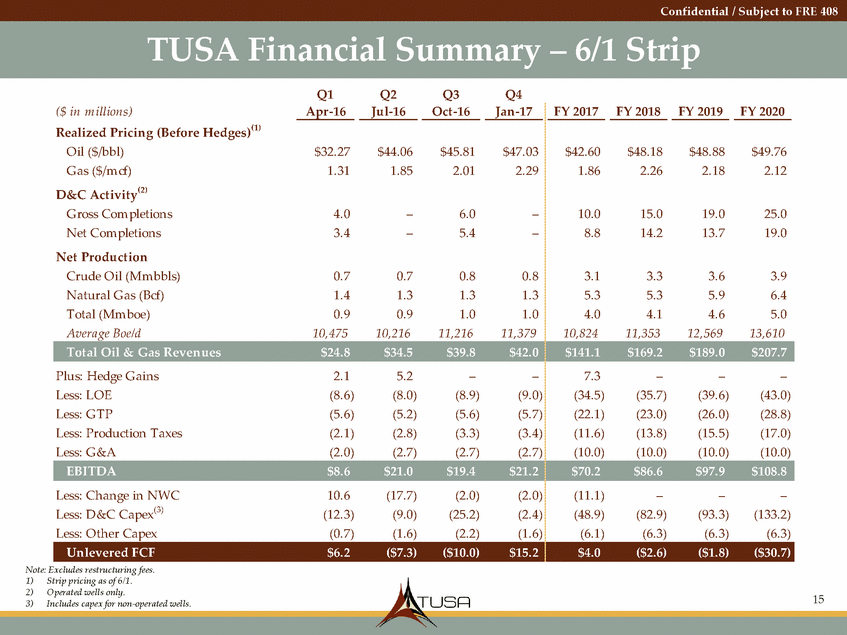
Confidential / Subject to FRE 408 TUSA Financial Summary – 6/1 Strip Q1 Apr-16 Q2 Jul-16 Q3 Oct-16 Q4 Jan-17 ($ in m illions) Realized Pricing (Before Hedges)(1) Oil ($/bbl) G as ($/mcf) D&C Activity(2) G ross Completions Net Completions Net Production Crude Oil (Mmbbls) Natural G as (Bcf) Total (Mmboe) Average Boe/d FY 2017 FY 2018 FY 2019 FY 2020 $32.27 1.31 $44.06 1.85 $45.81 2.01 $47.03 2.29 $42.60 1.86 $48.18 2.26 $48.88 2.18 $49.76 2.12 4.0 3.4 – – 6.0 5.4 – – 10.0 8.8 15.0 14.2 19.0 13.7 25.0 19.0 0.7 1.4 0.9 10,475 0.7 1.3 0.9 10,216 0.8 1.3 1.0 11,216 0.8 1.3 1.0 11,379 3.1 5.3 4.0 10,824 3.3 5.3 4.1 11,353 3.6 5.9 4.6 12,569 3.9 6.4 5.0 13,610 Plus: Hedge G ains Less: LOE Less: G TP Less: Production Taxes Less: G &A 2.1 (8.6) (5.6) (2.1) (2.0) 5.2 (8.0) (5.2) (2.8) (2.7) – (8.9) (5.6) (3.3) (2.7) – (9.0) (5.7) (3.4) (2.7) 7.3 (34.5) (22.1) (11.6) (10.0) – (35.7) (23.0) (13.8) (10.0) – (39.6) (26.0) (15.5) (10.0) – (43.0) (28.8) (17.0) (10.0) Less: Change in NWC Less: D&C Capex(3) Less: Other Capex 10.6 (12.3) (0.7) (17.7) (9.0) (1.6) (2.0) (25.2) (2.2) (2.0) (2.4) (1.6) (11.1) (48.9) (6.1) – (82.9) (6.3) – (93.3) (6.3) – (133.2) (6.3) Note: Excludes restructuring fees. 1) 2) 3) Strip pricing as of 6/1. Operated wells only. Includes capex for non-operated wells. 15 Unlevered FCF $6.2 ($7.3) ($10.0) $15.2 $4.0 ($2.6) ($1.8) ($30.7) EBITDA $8.6 $21.0 $19.4 $21.2 $70.2 $86.6 $97.9 $108.8 Total Oil & Gas Revenues $24.8 $34.5 $39.8 $42.0 $141.1 $169.2 $189.0 $207.7 |
|
|
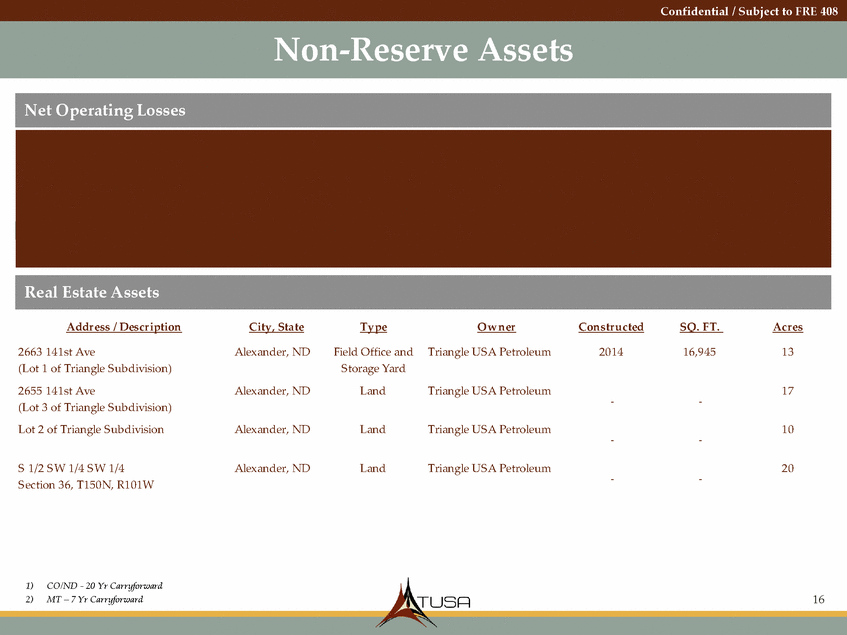
Confidential / Subject to FRE 408 Non-Reserve Assets Addr ess / Descr iption City, State Type Ow n er Con str u cted SQ. FT. Acr es 2663 141st Ave (Lot 1 of Triangle S ubdivision) 2655 141st Ave (Lot 3 of Triangle S ubdivision) Lot 2 of Triangle S ubdivision Alexander, ND Field Office and S torage Yard Land Triangle US A Petroleum 2014 16,945 13 Alexander, ND Triangle US A Petroleum 17 - - Alexander, ND Land Triangle US A Petroleum 10 - - S 1/2 S W 1/4 S W 1/4 S ection 36, T150N, R101W Alexander, ND Land Triangle US A Petroleum 20 - - 1)CO/ND - 20 Yr Carryforward 2)MT – 7 Yr Carryforward 16 Real Estate Assets Net Operating Losses ($ in '000s)TUSA Federal NOLTUSA CO NOL(1) TUSA MT NOL(2) TUSA ND NOL(1) Jan-16 NOL G ross Deferred135,79517,5712,257118,832 Tax Rate35.00%3.01%4.39%2.80% Net Deferred$47,528$529$99$3,329 |
|
|
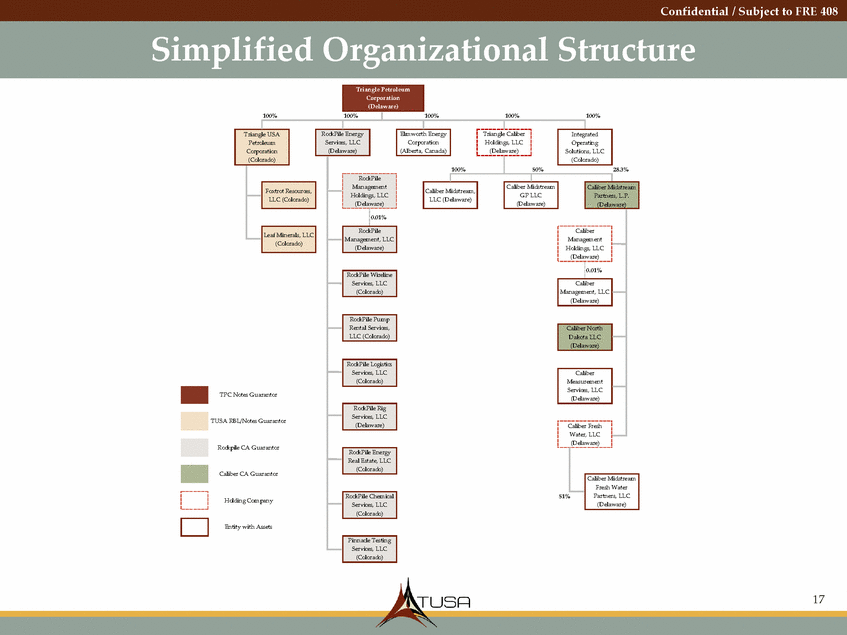
Confidential / Subject to FRE 408 Simplified Organizational Structure s, L.P. TPC Notes G uarantor TUSA RBL/Notes G uarantor Rockpi Caliber CA G uarantor Hol Ent 17 idstream Water s, LLC aware) 28.3% aware) idstream (Delaware) Triangle Petroleum Corporation (Delaware) 100%100% 100%100%100% Triangle USA Petroleum Corporation (Colorado) RockPile Energy Services, LLC (Delaware) Elmworth Energy Corporation (Alberta, Canada) Triangle Caliber Holdings, LLC (Delaware) Caliber M G P (Del Integrated Operating Solutions, LLC (Colorado) 100% 50% idstreamCaliber M LLCPartner Caliber Management Holdings, LLC (Delaware) 0.01% Caliber Management, LLC (Delaware) Caliber North Dakota LLC (Delaware) Caliber Measurement Services, LLC (Delaware) Caliber Fresh Water, LLC (Delaware) Caliber M Fresh 51%Partner (Del RockPile Management Holdings, LLC (Delaware) Caliber Midstream, LLC (Delaware) Foxtrot Resources, LLC (Colorado) 0.01% Leaf Minerals, LLC (Colorado) RockPile Management, LLC (Delaware) le CA G uarantor ding Company ity with Assets RockPile Wireline Services, LLC (Colorado) RockPile Pump Rental Services, LLC (Colorado) RockPile Logistics Services, LLC (Colorado) RockPile Rig Services, LLC (Delaware) RockPile Energy Real Estate, LLC (Colorado) RockPile Chemical Services, LLC (Colorado) Pinnacle Testing Services, LLC (Colorado) |
|
|
Triangle Petroleum PRESENTATION TO CREDITORS May 10, 2016 Confidential Subject to FRE 408 18 |
|
|
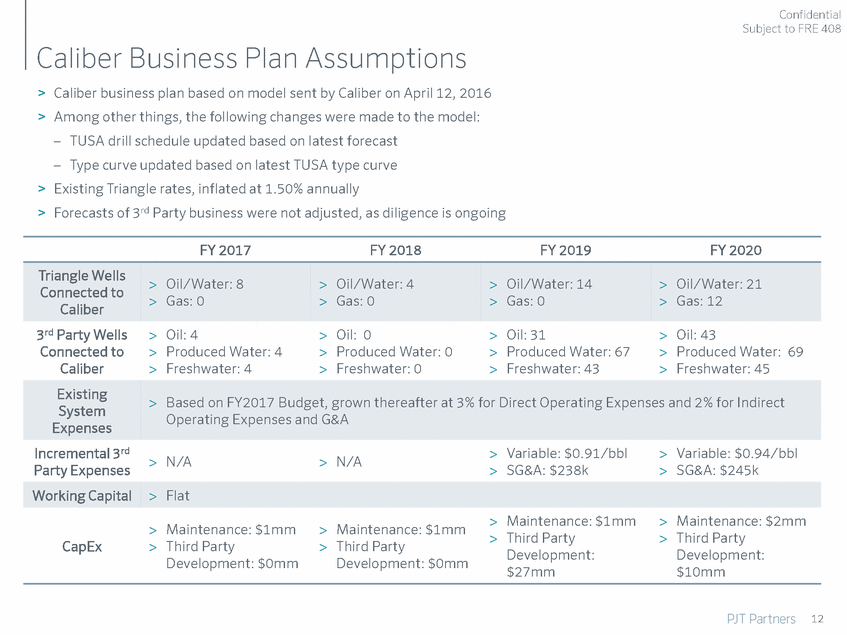
Confidential Subject to FRE 408 Caliber Business Plan Assumptions > > Caliber business plan based on model sent by Caliber on April 12, 2016 Among other things, the following changes were made to the model: ‒ TUSA drill schedule updated based on latest forecast ‒ Type curve updated based on latest TUSA type curve Existing Triangle rates, inflated at 1.50% annually Forecasts of 3rd Party business were not adjusted, as diligence is ongoing > > FY 2017 FY 2018 FY 2019 FY 2020 Connected to > Gas: 0 > Gas: 0 > Gas: 0 > Gas: 12 3rd Party Wells Connected to Caliber > > > Oil: 4 Produced Water: 4 Freshwater: 4 > > > Oil: 0 Produced Water: 0 Freshwater: 0 > > > Oil: 31 Produced Water: 67 Freshwater: 43 > > > Oil: 43 Produced Water: 69 Freshwater: 45 System Operating Expenses and G&A Incremental 3rd Party Expenses > > Variable: $0.91/bbl SG&A: $238k > > Variable: $0.94/bbl SG&A: $245k > N/A > N/A > > Maintenance: $1mm Third Party Development: $27mm > > Maintenance: $2mm Third Party Development: $10mm > > Maintenance: $1mm Third Party Development: $0mm > > Maintenance: $1mm Third Party Development: $0mm CapEx 12 Working Capital> Flat Existing> Based on FY2017 Budget, grown thereafter at 3% for Direct Operating Expenses and 2% for Indirect Expenses Triangle Wells> Oil/Water: 8 > Oil/Water: 4 > Oil/Water: 14 > Oil/Water: 21 Caliber |
|
|
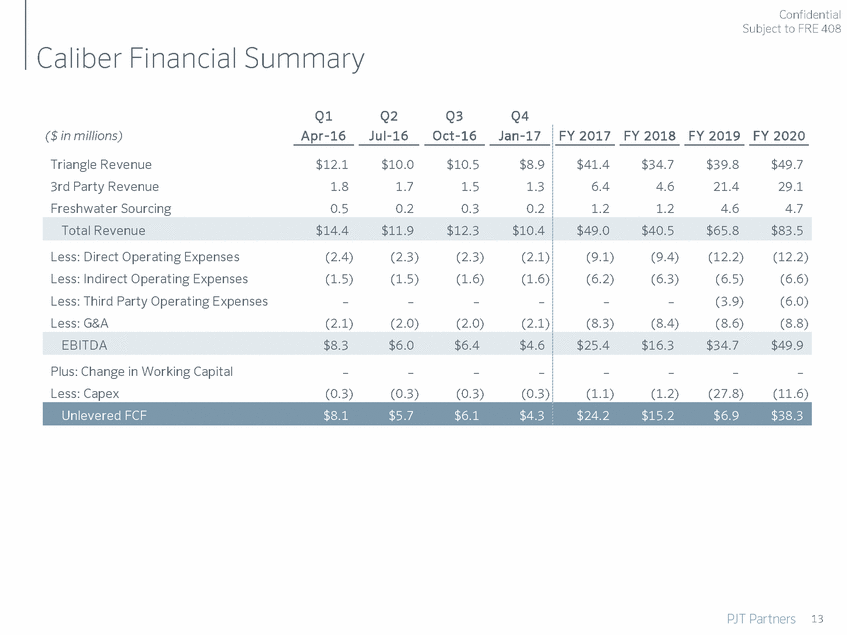
Confidential Subject to FRE 408 Caliber Financial Summary Q1 Apr -16 Q2 Jul-16 Q3 Oct-16 Q4 Jan-17 ($ in millions) FY 2017 FY 2018 FY 2019 FY 2020 Triangle Revenue 3rd Party Revenue Freshwater Sourcing $12.1 1.8 0.5 $10.0 1.7 0.2 $10.5 1.5 0.3 $8.9 1.3 0.2 $41.4 6.4 1.2 $34.7 4.6 1.2 $39.8 21.4 4.6 $49.7 29.1 4.7 Less: Direct Operating Expenses Less: Indirect Operating Expenses Less: Third Party Operating Expenses Less: G&A (2.4) (1.5) – (2.1) (2.3) (1.5) – (2.0) (2.3) (1.6) – (2.0) (2.1) (1.6) – (2.1) (9.1) (6.2) – (8.3) (9.4) (6.3) – (8.4) (12.2) (6.5) (3.9) (8.6) (12.2) (6.6) (6.0) (8.8) Plus: Change in Working Capital Less: Capex – (0.3) – (0.3) – (0.3) – (0.3) – (1.1) – (1.2) – (27.8) – (11.6) 13 Unlevered FCF$8.1 $5.7 $6.1 $4.3 $24.2 $15.2 $6.9 $38.3 EBITDA$8.3 $6.0 $6.4 $4.6 $25.4 $16.3 $34.7 $49.9 Total Revenue$14.4 $11.9 $12.3 $10.4 $49.0 $40.5 $65.8 $83.5 |

