Attached files
| file | filename |
|---|---|
| EX-32.1 - CERTIFICATION - JOHN WILEY & SONS, INC. | exhibit32_1.htm |
| EX-10.16 - FISCAL YEAR 2017 ANNUAL STATEGIC MILESTONES PLAN - JOHN WILEY & SONS, INC. | exhibit10_16.htm |
| EX-10.15 - FISCAL YEAR 2017 EAIP - JOHN WILEY & SONS, INC. | exhibit10_15.htm |
| EX-10.14 - FISCAL YEAR 2017 ELTIP - JOHN WILEY & SONS, INC. | exhibit10_14.htm |
| EX-32.2 - CERTIFICATION - JOHN WILEY & SONS, INC. | exhibit32_2.htm |
| EX-31.2 - CERTIFICATION - JOHN WILEY & SONS, INC. | exhibit31_2.htm |
| EX-31.1 - CERTIFICATION - JOHN WILEY & SONS, INC. | exhibit31_1.htm |
UNITED STATES
SECURITIES AND EXCHANGE COMMISSION
Washington, DC 20549
FORM 10-K
[x] ANNUAL REPORT PURSUANT TO SECTION 13 OR 15(d) OF
THE SECURITIES EXCHANGE ACT OF 1934
For the fiscal year ended: April 30, 2016
OR
[ ] TRANSITION REPORT PURSUANT TO SECTION 13 OR 15(d) OF THE
SECURITIES EXCHANGE ACT OF 1934 (FEE REQUIRED)
For the transition period from to
Commission file number 001-11507
JOHN WILEY & SONS, INC.
(Exact name of Registrant as specified in its charter)
|
NEW YORK
|
13-5593032
|
|
|
State or other jurisdiction of incorporation or organization
|
I.R.S. Employer Identification No.
|
|
|
111 River Street, Hoboken, NJ
|
07030
|
|
|
Address of principal executive offices
|
Zip Code
|
|
|
(201) 748-6000
|
||
|
Registrant’s telephone number including area code
|
||
|
Securities registered pursuant to Section 12(b) of the Act: Title of each class
|
Name of each exchange on which registered
|
|
|
Class A Common Stock, par value $1.00 per share
|
New York Stock Exchange
|
|
|
Class B Common Stock, par value $1.00 per share
|
New York Stock Exchange
|
|
|
Securities registered pursuant to Section 12(g) of the Act:
|
||
|
None
|
1
Indicate by check mark if the registrant is a well-known seasoned issuer, as defined in Rule 405 of the Securities Act.
Yes |X| No | |
Indicate by check mark if the registrant is not required to file reports pursuant to Section 13 or Section 15(d) of the Exchange Act.
Yes | | No |X |
Indicate by check mark whether the registrant (1) has filed all reports required to be filed by Section 13 or 15(d) of the Securities Exchange Act of 1934 during the preceding 12 months (or for such shorter period that the registrant was required to file such reports), and (2) has been subject to such filing requirements for the past 90 days.
Yes |X| No | |
Indicate by check mark whether the registrant has submitted electronically and posted on its corporate Web site, if any, every Interactive Data File required to be submitted and posted pursuant to Rule 405 of Regulation S-T (§232.405 of this chapter) during the preceding 12 months (or for such shorter period that the registrant was required to submit and post such files).
Yes |X| No | |
Indicate by check mark if disclosure of delinquent filers pursuant to Item 405 of Regulation S-K (§229.405 of this chapter) is not contained herein, and will not be contained, to the best of registrant’s knowledge, in definitive proxy or information statements incorporated by reference in Part III of this Form 10-K or any amendment to this Form 10-K. | |
Indicate by check mark whether the registrant is a large accelerated filer, an accelerated filer, a non-accelerated filer, or a smaller reporting company. See definitions of “large accelerated filer,” ”accelerated filer” and “smaller reporting company” in Rule 12b-2 of the Exchange Act.
Large accelerated filer |X| Accelerated filer | | Non-accelerated filer | | Smaller reporting company | |
Indicate by check mark whether the registrant is a shell company (as defined in Rule 12b-2 of the Exchange Act).
Yes | | No |X|
The aggregate market value of the voting stock held by non-affiliates of the registrant, computed by reference to the closing price as of the last business day of the registrant’s most recently completed second fiscal quarter, October 31, 2015, was approximately $2,331.2 million. The registrant has no non-voting common stock.
The number of shares outstanding of the registrant’s Class A and Class B Common Stock as of May 31, 2016 was 48,109,204 and 9,475,140 respectively.
DOCUMENTS INCORPORATED BY REFERENCE
Portions of the registrant’s definitive proxy statement for use in connection with its annual meeting of stockholders scheduled to be held on September 22, 2016, are incorporated by reference into Part III of this Form 10-K.
2
JOHN WILEY AND SONS, INC. AND SUBSIDIARIES
FORM 10-K
FOR THE FISCAL YEAR ENDED APRIL 30, 2016
INDEX
|
PART I
|
PAGE
|
|
|
ITEM 1.
|
Business
|
4
|
|
ITEM 1A.
|
Risk Factors
|
4-11
|
|
ITEM 1B.
|
Unresolved Staff Comments
|
11
|
|
ITEM 2.
|
Properties
|
12
|
|
ITEM 3.
|
Legal Proceedings
|
13
|
|
ITEM 4
|
Mine Safety Disclosures – Not Applicable
|
|
|
PART II
|
||
|
ITEM 5.
|
Market for the Company’s Common Equity, Related Stockholder Matters and Issuer Purchases of Equity Securities
|
13
|
|
ITEM 6.
|
Selected Financial Data
|
14
|
|
ITEM 7.
|
Management’s Discussion and Analysis of Financial Condition and Results of Operations
|
15-55
|
|
ITEM 7A.
|
Quantitative and Qualitative Disclosures About Market Risk
|
55-58
|
|
ITEM 8.
|
Financial Statements and Supplementary Data
|
59-98
|
|
ITEM 9.
|
Changes in and Disagreements with Accountants on Accounting and Financial Disclosure
|
99
|
|
ITEM 9A.
|
Controls and Procedures
|
99
|
|
ITEM 9B.
|
Other Information
|
99
|
|
PART III
|
||
|
ITEM 10.
|
Directors, Executive Officers and Corporate Governance
|
99-102
|
|
ITEM 11.
|
Executive Compensation
|
102
|
|
ITEM 12.
|
Security Ownership of Certain Beneficial Owners and Management and Related Stockholder Matters
|
102-103
|
|
ITEM 13.
|
Certain Relationships and Related Transactions, and Director Independence
|
103
|
|
ITEM 14.
|
Principal Accounting Fees and Services
|
103
|
|
|
||
|
PART IV
|
||
|
ITEM 15.
|
Exhibits, Financial Statement Schedules and Reports on Form 8-K
|
104-106
|
|
SIGNATURES
|
|
3
PART I
|
Item 1.
|
Business
|
The Company, founded in 1807, was incorporated in the state of New York on January 15, 1904. As used herein the term “Company” means John Wiley & Sons, Inc., and its subsidiaries and affiliated companies, unless the context indicates otherwise.
The Company is a global provider of knowledge and knowledge-enabled services that improve outcomes in areas of research, professional practice and education. Through the Research segment, the Company provides digital and print scientific, technical, medical and scholarly journals, reference works, books, database services and advertising. The Professional Development segment provides digital and print books, corporate learning solutions, employment assessment and training services, and test prep and certification. In Education, the Company provides print and digital content, and education solutions including online program management services for higher education institutions and course management tools for instructors and students. The Company takes full advantage of its content from all three businesses in developing and cross-marketing products to its diverse customer base of researchers, professionals, students, and educators. The use of technology enables the Company to make its content efficiently more accessible to its customers around the world. The Company’s operations are primarily located in the United States, Canada, Europe, Asia, and Australia.
Further description of the Company’s business is incorporated herein by reference in the Management’s Discussion and Analysis section of this 10-K.
Employees
As of April 30, 2016, the Company employed approximately 4,700 persons on a full-time equivalent basis worldwide.
Financial Information About Business Segments
The note entitled “Segment Information” of the Notes to Consolidated Financial Statements and pages 15 through 55 of the Management’s Discussion and Analysis section of this Form 10-K are incorporated herein by reference.
Financial Information About Foreign and Domestic Operations and Export Sales
The note entitled “Segment Information” of the Notes to Consolidated Financial Statements and pages 15 and 55 of the Management’s Discussion and Analysis section of this Form 10-K are incorporated herein by reference.
|
Item 1A.
|
Risk Factors
|
You should carefully consider all of the information set forth in this Form 10-K, including the following risk factors, before deciding to invest in any of the Company’s securities. The risks below are not the only ones the Company faces. Additional risks not currently known to the Company or that the Company presently deems immaterial may also impair its business operations. The Company’s business, financial condition, results of operations or prospects could be materially adversely affected by any of these risks.
4
Cautionary Statement Under the Private Securities Litigation Reform Act of 1995:
This Form 10-K for the year ended April 30, 2016 contains certain forward-looking statements concerning the Company’s operations, performance and financial condition. In addition, the Company provides forward-looking statements in other materials released to the public as well as oral forward-looking information. Statements which contain the words anticipate, expect, believes, estimate, project, forecast, plan, outlook, intend and similar expressions constitute forward-looking statements that involve risk and uncertainties. Reliance should not be placed on forward-looking statements, as actual results may differ materially from those in any forward-looking statements.
Any such forward-looking statements are based upon a number of assumptions and estimates that are inherently subject to uncertainties and contingencies, many of which are beyond the control of the Company, and are subject to change based on many important factors. Such factors include, but are not limited to (i) the level of investment in new technologies and products; (ii) subscriber renewal rates for the Company’s journals; (iii) the financial stability and liquidity of journal subscription agents; (iv) the consolidation of book wholesalers and retail accounts; (v) the market position and financial stability of key retailers; (vi) the seasonal nature of the Company’s education business and the impact of the used-book market; (vii) worldwide economic and political conditions; (viii) the Company’s ability to protect its copyrights and other intellectual property worldwide; (ix) the ability of the Company to successfully integrate acquired operations and realize expected opportunities and (x) other factors detailed from time to time in the Company’s filings with the Securities and Exchange Commission. The Company undertakes no obligation to update or revise any such forward-looking statements to reflect subsequent events or circumstances.
Operating and Administrative Costs and Expenses
In general, any significant increase in the costs of goods and services provided to the Company may adversely affect the Company’s costs of operation. The Company has a significant investment in its employee base around the world. The Company offers competitive salaries and benefits in order to attract and retain the highly skilled workforce needed to sustain and develop new products and services required for growth. Employment and benefit costs are affected by competitive market conditions for qualified individuals, and factors such as healthcare and retirement benefit costs. The Company is a large paper purchaser, and paper prices may fluctuate significantly from time-to-time. To reduce the impact of paper price increases, the Company relies upon multiple suppliers. As of April 30, 2016, the Company’s consolidated paper inventory was approximately $4.9 million and there were no outstanding multi-year supply contracts.
Protection of Intellectual Property Rights
A substantial portion of the Company’s publications are protected by copyright, held either in the Company’s name, in the name of the author of the work, or in the name of a sponsoring professional society. Such copyrights protect the Company’s exclusive right to publish the work in many countries abroad for specified periods, in most cases the author’s life plus 70 years, but in any event a minimum of 50 years for works published after 1978. The ability of the Company to continue to achieve its expected results depends, in part, upon the Company’s ability to protect its intellectual property rights. The Company’s results may be adversely affected by lack of legal and/or technological protections for its intellectual property in some jurisdictions and markets.
5
Maintaining the Company’s Reputation
The Company’s professional customers worldwide rely upon many of the Company’s publications to perform their jobs. It is imperative that the Company consistently demonstrates its ability to maintain the integrity of the information included in its publications. Adverse publicity, whether or not valid, may reduce demand for the Company’s publications.
Trade Concentration and Credit Risk
In the journal publishing business, subscriptions are primarily sourced through journal subscription agents who, acting as agents for library customers, facilitate ordering by consolidating the subscription orders/billings of each subscriber with various publishers. Cash is generally collected in advance from subscribers by the subscription agents and is principally remitted to the Company between the months of December and April. Although at fiscal year-end the Company had minimal credit risk exposure to these agents, future calendar-year subscription receipts from these agents are highly dependent on their financial condition and liquidity. Subscription agents account for approximately 22% of total annual consolidated revenue and no one agent accounts for more than 11% of total annual consolidated revenue.
The Company’s non-journal subscription business is not dependent upon a single customer. Although no one non-journal customer accounts for more than 9% of total consolidated revenue and 12% of accounts receivable at April 30, 2016, the top 10 non-journal customers account for approximately 16% of total consolidated revenue and approximately 26% of accounts receivable at April 30, 2016. The Company maintains approximately $25 million of trade credit insurance, subject to certain limitations, covering balances due from certain named customers which expires in May, 2017.
Changes in Laws and Regulations That Could Adversely Affect the Company’s Business
The Company maintains operations in Asia, Australia, Canada, Europe and the United States. The conduct of our business, including the sourcing of content, distribution, sales, marketing and advertising is subject to various laws and regulations administered by governments around the world. Changes in laws, regulations or government policies, including tax regulations and accounting standards, may adversely affect the Company’s future financial results.
The scientific research publishing industry generates much of its revenue from paid customer subscriptions to online and print journal content. There is debate within government, academic and library communities whether such journal content should be made available for free, immediately or following a period of embargo after publication, referred to as “open access”. For instance, certain governments have implemented mandates that require journal articles derived from government-funded research to be made available to the public at no cost after an embargo period. Open access can be achieved in two ways: Green, which enables authors to publish articles in subscription based journals and self–archive the author accepted version of the article for free public use after an embargo period, and Gold, which enables authors to publish their articles in journals that provide immediate free access to the article on the publisher’s website following payment of an article publication fee. These mandates have the potential to put pressure on subscription-based publications. If such regulations are widely implemented the Company’s operating results could be adversely affected. To date, the majority of governments that have taken a position on Open access have favored the green model and have generally specified embargo periods of twelve months. The publishing community generally takes the view that this period should be sufficient to protect subscription revenues provided that publishers’ platforms offer sufficient added value to the article. Governments in Europe have been more supportive of the gold model, which thus far is generating incremental revenue for publishers with active open access programs. A number of European administrations are showing interest in a business model which combines the purchasing of subscription content with the purchase of open access publishing for authors in their country. This development removes an element of risk by fixing revenues from that market, provided that the terms and price negotiated are acceptable.
6
Business Transformation and Restructuring
The Company is transforming portions of its business from a traditional publishing model to being a global provider of content-enabled solutions with a focus on digital products and services. The acquisition of Deltak.edu, LLC (“Deltak”), Inscape Holdings, Inc. (“Inscape”), Efficient Learning Systems, Inc. (“ELS”), Profiles International (“Profiles”) and CrossKnowledge Group Limited (“CrossKnowledge”), along with the divestment of the Company’s consumer publishing programs, are examples of strategic initiatives that were implemented as part of the Company’s business transformation. The Company will continue to explore opportunities to develop new business models and enhance the efficiency of its organizational structure. The rapid pace and scope of change increases the risk that not all of our strategic initiatives will deliver the expected benefits within the anticipated timeframes. In addition, these efforts may somewhat disrupt the Company’s business activities which could adversely affect its operating results.
The Company continues to restructure and realign its cost base with current and anticipated future market conditions. Significant risks associated with these actions that may impair the Company’s ability to achieve the anticipated cost reductions or that may disrupt its business include delays in the implementation of anticipated workforce reductions in highly regulated locations outside of the U.S.; decreases in employee morale; the failure to meet operational targets due to the loss of key employees; and disruptions of third parties to whom we have outsourced business functions. In addition, the Company’s ability to achieve the anticipated cost savings and other benefits from these actions within the expected timeframe is subject to many estimates and assumptions. These estimates and assumptions are subject to significant economic, competitive and other uncertainties, some of which are beyond our control. If these estimates and assumptions are incorrect, if we experience delays, or if other unforeseen events occur, our business and results of operations could be adversely affected.
Outsourcing of Business Processes
The Company has outsourced certain business functions, principally in technology, content management and certain transactional functions, to third-party service providers to achieve cost savings and efficiencies. If these third-party service providers do not perform effectively, the Company may not be able to achieve the expected cost savings and depending on the function involved, may experience business disruption or processing inefficiencies, all with potential adverse effects on the Company’s operating results.
7
Introduction of New Technologies, Products and Services
The Company must continue to invest in technology and other innovations to adapt and add value to its products and services to remain competitive. There are uncertainties whenever developing new products and services, and it is often possible that such new products and services may not be launched or if launched, may not be profitable or as profitable as existing products and services.
A common trend facing each of the Company’s businesses is the digitization of content and proliferation of distribution channels through the internet and other electronic means, which are replacing traditional print formats. The trend to digital content has also created contraction in the print book retail market which increases the risk of bankruptcy for certain retail customers, potentially leading to the disruption of short-term product supply to consumers as well as potential bad debt write-offs. New distribution channels, such as digital formats, the internet, online retailers and growing delivery platforms (e.g. tablets and e-readers), combined with the concentration of retailer power, present both threats and opportunities to the Company’s traditional publishing models, potentially impacting both sales volumes and pricing. In addition, there is an enhanced risk associated with the illegal unauthorized replication and distribution of digital products.
Student Demand for Lower Cost Textbooks in Higher Education
The Company’s Education business publishes educational content for undergraduate, graduate and advanced placement students, lifelong learners and in Australia secondary school students. Due to growing student demand for less expensive textbooks, many college bookstores, online retailers and other entities offer used or rental textbooks to students at lower prices than new textbooks. It is uncertain how such sales of lower priced textbooks will impact the Company’s operating results.
Factors that Reduce Enrollment at Colleges and Universities
Enrollment in U.S. colleges and universities can be adversely affected by many factors, including changes in government and private student loan and grant programs, uncertainty about current and future economic conditions, general decreases in family income and net worth and a perception of uncertain job prospects for recent graduates. In addition, enrollment levels at colleges and universities outside the United States are influenced by the global and local economic climate, local political conditions and other factors that make predicting foreign enrollment levels difficult. Reductions in expected levels of enrollment at colleges and universities both within and outside the United States could adversely affect demand for our higher education products.
Information Technology Risks
Information technology is a key part of the Company’s business strategy and operations. As a business strategy, Wiley’s technology enables the Company to provide customers with new and enhanced products and services and is critical to the Company’s success in migrating from print to digital business models. Information technology is also a fundamental component of all our business processes; collecting and reporting business data; and communicating internally and externally with customers, suppliers, employees and others.
We are continually improving and upgrading our computer systems and software. We are in the process of implementing a new Enterprise Resource Planning system as part of a multi-year plan to integrate and upgrade our operational and financial systems and processes. The implementation of this global system will occur in phases over the next several years. Implementation of a new enterprise resource planning system involves risks and uncertainties. Any disruptions, delays, or deficiencies in the design or implementation of a new system, could result in increased costs, disruptions in operations or delays in the collection of cash from our customers, as well as have an adverse effect on our ability to timely report our financial results, all of which could materially adversely affect our business, financial condition, and results of operations.
8
Information technology system failures, network disruptions and breaches of data security could significantly disrupt the operations of the Company. Management has designed and implemented policies, processes and controls to mitigate risks of information technology failure and to provide security from unauthorized access to our systems. In addition, the Company has in place disaster recovery plans to maintain business continuity. The size and complexity of our information technology and information security systems, and those of our third-party vendors with whom we contract, make such systems potentially vulnerable to cyber-attacks common to most industries from inadvertent or intentional actions by employees, vendors, or malicious third-parties. Such attacks are of ever-increasing levels of sophistication and are made by groups and individuals with a wide range of motives. While the Company has taken steps to address these risks, there can be no assurance that a system failure, disruption or data security breach would not adversely affect the Company’s business and operating results.
Competition for Market Share and Author and Society Relationships
The Company operates in highly competitive markets. Success and continued growth depends greatly on developing new products and the means to deliver them in an environment of rapid technological change. Attracting new authors and professional societies, while retaining our existing business relationships, are critical to our success.
Interest Rate and Foreign Exchange Risk
Non-U.S. revenues, as well as our substantial non-U.S. net assets, expose the Company’s results to foreign currency exchange rate volatility. The percentage of Consolidated Revenue for fiscal year 2016 recognized in the following currencies (on an equivalent U.S. dollar basis) were: approximately 57% U.S dollar; 28% British pound sterling; 8% euro and 7% other currencies. In addition, our interest-bearing loans and borrowings are subject to risk from changes in interest rates. These risks and the measures we have taken to help contain them are discussed in the Market Risk section of this 10-K. The Company from time-to-time uses derivative instruments to hedge such risks. Notwithstanding our efforts to foresee and mitigate the effects of changes in fiscal circumstances, we cannot predict with certainty changes in currency and interest rates, inflation or other related factors affecting our business.
Changes in Tax Legislation
The Company is subject to tax laws within the jurisdictions in which it does business. Changes in tax legislation could have a material impact on the Company’s financial results. There have been recent proposals to reform U.S. tax laws that would significantly impact how U.S. multinational corporations are taxed on earnings outside of the U.S. This could have a material impact on the Company’s financial results since a substantial portion of the Company’s income is earned outside the U.S. In addition, the Company is subject to audit by tax authorities. Although we believe our tax estimates are reasonable, the final determination of tax audits could be materially different from our historical income tax provisions and accruals and have a material impact on the Company’s net income, cash flow and financial position. See Note 12 (“Tax Audits”) for further details on the Company’s income tax audit in Germany.
9
Business Risk in Developing, Emerging and Other Foreign Markets
The Company sells its products to customers in the Middle East (including Iran and Syria), Africa (including Sudan), Cuba, and other developing markets where it does not have operating subsidiaries. The Company does not own any assets or liabilities in these markets except for trade receivables. Challenges and uncertainties associated with operating in developing markets has a higher relative risk due to political instability, economic volatility, crime, terrorism, corruption, social and ethnic unrest, and other factors. In fiscal year 2016, the Company recorded revenue and net profits of $3.7 million and $1.0 million, respectively, related to sales to Cuba, Sudan, Syria and Iran. While sales in these markets are not material to the Company’s business results, adverse developments related to the risks associated with these markets may cause actual results to differ from historical and forecasted future operating results.
The Company has certain technology development operations in Russia related to software development and architecture, digital content production and system testing services. Due to the political instability within the region, there is the potential for future government embargos and sanctions which could disrupt the Company’s operations in the area. While the Company has developed business continuity plans to address these issues, further adverse developments in the region could have a material impact on the Company’s business and operating results.
Approximately 14% of Research journal articles are sourced from authors in China. Any restrictions on exporting intellectual property could adversely affect the company’s business and operating results.
Liquidity and Global Economic Conditions
Changes in global financial markets have not had, nor do we anticipate they will have, a significant impact on our liquidity. Due to our significant operating cash flow, financial assets, access to capital markets and available lines of credit and revolving credit agreements, we continue to believe that we have the ability to meet our financing needs for the foreseeable future. As market conditions change, we will continue to monitor our liquidity position. However, there can be no assurance that our liquidity or our results of operations will not be affected by possible future changes in global financial markets and global economic conditions. Unprecedented market conditions including illiquid credit markets, volatile equity markets, dramatic fluctuations in foreign currency rates and economic recession could affect future results.
Effects of Increases in Pension Costs and Funding Requirements
The Company provides defined benefit pension plans for certain employees worldwide. The Company’s Board of Directors approved amendments to the U.S., Canada and U.K. defined benefit plans that froze the future accumulation of benefits effective June 30, 2013, December 31, 2015 and April 30, 2015, respectively. The funding requirements and costs of these plans are dependent upon various factors, including the actual return on plan assets, discount rates, plan participant population demographics and changes in pension regulations. Changes in these factors affect the Company’s plan funding, cash flow and results of operations.
10
Effects of Inflation and Cost Increases
The Company, from time to time, experiences cost increases reflecting, in part, general inflationary factors. There is no guarantee that the Company can increase selling prices or reduce costs to fully mitigate the effect of inflation on company costs.
Ability to Successfully Integrate Key Acquisitions
The Company’s growth strategy includes title, imprint and other business acquisitions, including knowledge-enabled services which complement the Company’s existing businesses. Acquisitions may have a substantial impact on the Company’s revenues, costs, cash flows, and financial position. Acquisitions involve risks and uncertainties, including difficulties in integrating acquired operations and in realizing expected opportunities; diversions of management resources and loss of key employees; challenges with respect to operating new businesses; debt incurred in financing such acquisitions; and other unanticipated problems and liabilities.
Valuation of Goodwill and Intangible Assets
At April 30, 2016, the Company had $951.7 million of goodwill and $877.0 million of intangible assets on its balance sheet. The intangible assets are principally comprised of content and publishing rights, customer relationships, and brands and trademarks. Failure to achieve business objectives and financial projections could result in an asset impairment charge, which would result in a non-cash charge to operating expenses. Goodwill and intangible assets with indefinite lives are tested for impairment on an annual basis and also when events or changes in circumstances indicate that impairment may have occurred. Intangible assets with determinable lives are tested for impairment only when events or changes in circumstances indicate that an impairment may have occurred. Determining whether an impairment exists can be difficult as a result of increased uncertainty and current market dynamics, and requires significant management estimates and judgment. In addition, the potential for goodwill impairment is increased during periods of economic uncertainty. An asset impairment charge could have a material adverse effect on the Company’s business, operating results and financial condition.
Attracting and Retaining Key Employees
The Company is highly dependent on the continued services of its Chief Executive Officer, Chief Financial Officer and other senior officers and key employees. The loss of the services of skilled personnel for any reason and the Company’s inability to replace them with suitable candidates quickly or at all, as well as any negative market perception resulting from such loss, could have a material adverse effect on the Company’s business, operating results and financial condition. In addition, we are dependent upon our ability to continue to attract new employees with key skills to support business growth.
|
Item 1B.
|
Unresolved Staff Comments
|
None
11
Item 2. Properties
The Company occupies office, warehouse, and distribution facilities in various parts of the world, as listed below (excluding those locations with less than 10,000 square feet of floor area, none of which is considered material property). All of the buildings and the equipment owned or leased are believed to be in good operating condition and are suitable for the conduct of its business.
|
Location
|
Purpose
|
Owned or Leased
|
Approx. Sq. Ft.
|
|
United States:
|
|||
|
New Jersey
|
Corporate Headquarters
|
Leased
|
415,000
|
|
Office & Warehouse
|
Leased
|
185,000
|
|
|
Indiana
|
Office
|
Leased
|
108,000
|
|
California
|
Office
|
Leased
|
19,000
|
|
Massachusetts
|
Office
|
Leased
|
34,000
|
|
Illinois
|
Office
|
Leased
|
51,000
|
|
Florida
|
Office
|
Leased
|
49,000
|
|
Minnesota
|
Offices
|
Leased
|
36,000
|
|
Texas
|
Offices
|
Leased
|
29,000
|
|
Colorado
|
Office
|
Leased
|
15,000
|
|
International:
|
|||
|
Australia
|
Offices
|
Leased
|
59,000
|
|
Canada
|
Office
|
Leased
|
12,000
|
|
England
|
Warehouses
|
Leased
|
297,000
|
|
Offices
|
Leased
|
80,000
|
|
|
Offices
|
Owned
|
70,000
|
|
|
Germany
|
Office
|
Owned
|
59,000
|
|
Office
|
Leased
|
24,000
|
|
|
Singapore
|
Offices
|
Leased
|
44,000
|
|
Russia
|
Office
|
Leased
|
21,000
|
|
India
|
Warehouse
|
Leased
|
16,000
|
|
China
|
Office
|
Leased
|
14,000
|
12
|
Item 3.
|
Legal Proceedings
|
The Company is involved in routine litigation in the ordinary course of its business. In the opinion of management, the ultimate resolution of all pending litigation will not have a material effect upon the financial condition or results of operations of the Company.
Over the past few years, the Company has from time to time faced claims from photographers or agencies that the Company has used photographs without licenses or beyond licensed permissions. The Company has insurance coverage for a significant portion of such claims. The Company does not believe that its exposure to such claims either individually or in the aggregate is material.
PART II
|
Item 5.
|
Market for the Company’s Common Equity, Related Stockholder Matters and Issuer Purchases of Equity Securities
|
The Company’s Class A and Class B shares are listed on the New York Stock Exchange under the symbols JWa and JWb, respectively. Dividends per share and the market price range (based on daily closing prices) by fiscal quarter for the past two fiscal years were as follows:
|
Class A Common Stock
|
Class B Common Stock
|
|||||
|
Market Price
|
Market Price
|
|||||
|
Dividends
|
High
|
Low
|
Dividends
|
High
|
Low
|
|
|
2016
|
||||||
|
First Quarter
|
$0.30
|
$58.66
|
$51.68
|
$0.30
|
$58.74
|
$52.54
|
|
Second Quarter
|
0.30
|
53.18
|
48.16
|
0.30
|
52.93
|
48.25
|
|
Third Quarter
|
0.30
|
54.29
|
40.29
|
0.30
|
53.80
|
41.25
|
|
Fourth Quarter
|
0.30
|
50.74
|
40.21
|
0.30
|
50.85
|
40.18
|
|
2015
|
||||||
|
First Quarter
|
$0.29
|
$62.05
|
$54.52
|
$0.29
|
$61.80
|
$54.35
|
|
Second Quarter
|
0.29
|
60.42
|
51.45
|
0.29
|
61.08
|
52.04
|
|
Third Quarter
|
0.29
|
62.85
|
56.48
|
0.29
|
62.75
|
56.37
|
|
Fourth Quarter
|
0.29
|
65.21
|
56.88
|
0.29
|
65.10
|
56.74
|
On a quarterly basis, the Board of Directors considers the payment of cash dividends based upon its review of earnings, the financial position of the Company, and other relevant factors. As of April 30, 2016, the approximate number of holders of the Company’s Class A and Class B Common Stock were 847 and 74 respectively, based on the holders of record.
During the fourth quarter of fiscal year 2016, the Company made the following purchases of Class A Common Stock under its stock repurchase program.
|
Total Number
of Shares Purchased
|
Average
Price Paid
Per Share
|
Total Number of Shares Purchased as part of a Publicly Announced Program
|
Maximum Number of Shares that May be Purchased Under the Program
|
||||
|
February 2016
|
-
|
-
|
-
|
963,022
|
|||
|
March 2016
|
118,036
|
$47.12
|
118,036
|
845,006
|
|||
|
April 2016
|
98,150
|
$48.00
|
98,150
|
746,836
|
|||
|
Total
|
216,186
|
$47.52
|
216,186
|
13
Item 6. Selected Financial Data
|
For the Years Ended April 30,
|
|||||
|
Dollars in millions (except per share data)
|
2016
|
2015
|
2014
|
2013
|
2012
|
|
Revenue
|
$1,727.0
|
$1,822.4
|
$1,775.2
|
$1,760.8
|
$1,782.7
|
|
Operating Income (a-b)
|
188.1
|
237.7
|
206.7
|
199.4
|
280.4
|
|
Net Income (a-c)
|
145.8
|
176.9
|
160.5
|
144.2
|
212.7
|
|
Working Capital (d)
|
(111.1)
|
(62.8)
|
60.1
|
(32.2)
|
(66.3)
|
|
Deferred Revenue in Working Capital (d)
|
(426.5)
|
(372.1)
|
(385.7)
|
(363.0)
|
(342.0)
|
|
Total Assets
|
2,921.1
|
3,004.2
|
3,077.4
|
2,806.4
|
2,532.9
|
|
Long-Term Debt
|
605.0
|
650.1
|
700.1
|
673.0
|
475.0
|
|
Shareholders’ Equity
|
1,037.1
|
1,055.0
|
1,182.2
|
988.4
|
1,017.6
|
|
Per Share Data
|
|||||
|
Earnings Per Share (a-c)
|
|||||
|
Diluted
|
$2.48
|
$2.97
|
$2.70
|
$2.39
|
$3.47
|
|
Basic
|
$2.51
|
$3.01
|
$2.73
|
$2.43
|
$3.53
|
|
Cash Dividends
|
|||||
|
Class A Common
|
$1.20
|
$1.16
|
$1.00
|
$0.96
|
$0.80
|
|
Class B Common
|
$1.20
|
$1.16
|
$1.00
|
$0.96
|
$0.80
|
|
a)
|
In fiscal years 2016, 2015, 2014 and 2013, the Company recorded restructuring charges of $28.6 million ($0.8 per share), $28.8 million ($0.34 per share), $42.7 million ($0.48 per share) and $29.3 million ($0.33 per share), respectively, and related impairment charges in fiscal years 2014 and 2013 of $4.8 million ($0.06 per share) and $30.7 million ($0.35 per share), respectively.
|
|
b)
|
In fiscal year 2013, the Company recorded a gain, net of losses, on the sale of certain Professional Development consumer publishing programs of $6.0 million ($0.04 per share).
|
|
c)
|
Certain tax benefits and charges included in fiscal year results are as follows:
|
|
·
|
Fiscal years 2016, 2014, 2013 and 2012 include tax benefits of $5.9 million ($0.10 per share), $10.6 million ($0.18 per share), $8.4 million ($0.14 per share), and $8.8 million ($0.14 per share), respectively, principally associated with consecutive tax legislation enacted in the United Kingdom that reduced the U.K. corporate income tax rates.
|
|
·
|
Fiscal year 2015 includes a non-recurring tax benefit of $3.1 million ($0.05 per share) related to tax deductions claimed on the write-up of certain foreign tax assets to fair market value.
|
|
·
|
Fiscal year 2012 includes a tax benefit of $7.5 million ($0.12 per share) related to the reversal of an income tax reserve recorded in conjunction with the Blackwell acquisition.
|
|
d)
|
The primary driver of the negative working capital is unearned deferred revenue related to subscriptions for which cash has been collected in advance. Cash received in advance for subscriptions is used by the Company for a number of purposes including acquisitions; debt repayments; funding operations; dividend payments; and purchasing treasury shares. The deferred revenue will be recognized in income over the term of the subscription; when the related issue is shipped or made available online, or the service is rendered.
|
14
|
Item 7.
|
Management’s Discussion and Analysis of Business, Financial Condition and Results of Operations
|
The Company is a global provider of knowledge and knowledge-enabled services that improve outcomes in areas of research, professional practice and education. Through the Research segment, the Company provides digital and print scientific, technical, medical and scholarly journals, reference works, books, database services and advertising. The Professional Development segment provides digital and print books, corporate learning solutions, post and pre-employment assessment and training services, and test preparation and certification. In Education, the Company provides print and digital content, and education solutions including online program management services for higher education institutions and course management tools for instructors and students. The Company takes full advantage of its content from all three businesses in developing and cross-marketing products to its diverse customer base of researchers, professionals, students, and educators. The use of technology enables the Company to make its content efficiently more accessible to its customers around the world. The Company’s operations are primarily located in the United States, Canada, Europe, Asia, and Australia.
Business growth comes from a combination of organic growth from existing brands and titles; title, imprint and other business acquisitions which complement the Company’s existing businesses; designing and implementing new methods of delivering products to our customers; and the development of new products and services. The Company’s revenue declined at a compound annual rate of 0.2% over the past five years.
Core Business Segments
Research:
The Company’s Research business serves the world’s research and scholarly communities and is the largest publisher for professional and scholarly societies. Research’s mission is to support researchers, professionals and learners in the discovery and use of research knowledge to help them achieve their goals in research, learning and practice. Research products include scientific, technical, medical and scholarly research journals, books, reference works, databases, clinical decision support tools, laboratory manuals and workflow tools, in the publishing areas of the physical sciences and engineering, health sciences, social science and humanities and life sciences. Research customers include academic, corporate, government, and public libraries; researchers; scientists; clinicians; engineers and technologists; scholarly and professional societies; and students and professors. The Company’s Research products are sold and distributed globally in digital and print formats through multiple channels, including research libraries and library consortia, independent subscription agents, direct sales to professional society members, bookstores, online booksellers and other customers. Publishing centers include Australia, China, Germany, India, the United Kingdom and the United States. Research accounted for approximately 56% of total Company revenue in fiscal year 2016 which declined at a compound annual rate of 1% over the past five years.
Research revenue by product type includes: Journal Subscriptions; Author-Funded Access; Other Journal Revenue, which includes publishing service charges for article customization charges, sales of journal licensing rights, journal reprint revenue, backfiles and individual articles. In addition, Print Books; Digital Books; and Other Books and Reference Revenue, which includes, advertising, book licensing rights, distribution services and the sale of protocols.
15
The graph below presents Research revenue by product type for fiscal year 2016 and 2015:
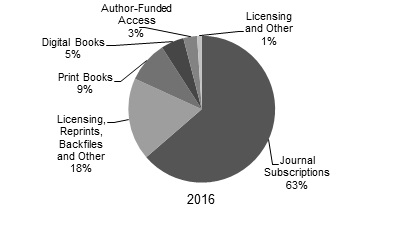
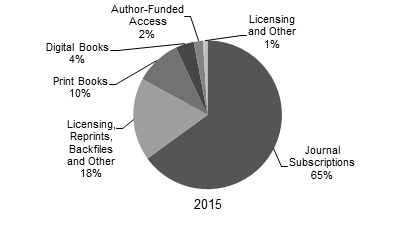
Key growth strategies for the Research business include evolving and developing new licensing models for the Company’s institutional customers; developing new funded access revenue streams; focusing resources on high-growth and emerging markets; and developing new digital products, services and workflow solutions to meet the needs of researchers, authors, societies and corporate customers.
Approximately 50% of Journal Subscription revenue is derived from publishing rights owned by the Company. Publishing alliances also play a major role in Research’s success. Approximately 50% of Journal Subscription revenue is derived from publication rights which are owned by professional societies and published by the Company pursuant to a long-term contract or owned jointly with a professional society. These society alliances bring mutual benefit, with the societies gaining Wiley’s publishing, marketing, sales and distribution expertise, while Wiley benefits from being affiliated with prestigious societies and their members. The Company publishes the journals of many prestigious societies, including the American Cancer Society, the American Heart Association, the British Journal of Surgery Society, the European Molecular Biology Organization, the American Anthropological Association, the American Geophysical Union and the German Chemical Society.
The Company transitioned from issue-based to time-based digital journal subscription agreements for calendar year 2016. Under this new model, the Company provides access to all journal content published within a calendar year and recognizes revenue on a straight-line basis over the calendar year. Under the Company’s previous licensing model, a customer subscribed to a discrete number of online journal issues and revenue was recognized as each issue was made available online. The change shifted approximately $37 million of revenue from fiscal year 2016 to the remainder of calendar year 2016 (fiscal year 2017). The change had no impact on free cash flow. The Company made these changes to significantly simplify the contracting and administration of digital journal subscriptions.
The Company’s Research business is a provider of content and services in evidence-based medicine (EBM). Through the Company’s alliance with The Cochrane Collaboration, the Company publishes The Cochrane Library, a premier source of high-quality independent evidence to inform healthcare decision-making, which provides the foundation for the Company’s growing suite of EBM products designed to improve patient healthcare. EBM facilitates the effective management of patients through clinical expertise informed by best practice evidence that is derived from medical literature.
Wiley Online Library, the online publishing platform for the Company’s Research business, is one of the world’s broadest and deepest multidisciplinary collections of online resources covering life, health and physical sciences, social science and the humanities. Designed with extensive input from scholars around the world, Wiley Online Library delivers seamless integrated access to over 7 million articles from 1,700 journals, 19,000 online books, and hundreds of multi-volume reference works, laboratory protocols and databases. Wiley Online Library provides the user with intuitive navigation, enhanced discoverability, expanded functionality and a range of personalization options. Access to abstracts is free, full content is accessible through licensing agreements or as individual article purchases. Large portions of the content are provided free or at nominal cost to nations in the developing world through partnerships with certain non-profit organizations. Wiley Online Library also provides the Company with revenue growth opportunities through new applications and business models, online advertising, deeper market penetration and individual sales and pay-per-view options.
16
Full content Access on Wiley Online Library is sold through licenses with academic and corporate libraries, consortia and other academic, government and corporate customers. The Company offers a range of licensing options including customized suites of journal publications for individual customer needs as well as subscriptions for individual journal and online book publications. Licenses are typically sold in durations of one to three years. Through the Article Select and PayPerView programs, the Company provides fee-based access to non-subscribed journal content, book chapters and major reference work articles.
Wiley Online Library takes advantage of technology to update content frequently and to add new features and resources on an ongoing basis to increase the productivity of scientists, professionals and students. Two examples are EarlyView, through which customers can access individual articles well in advance of print publication, and the Wiley Journals Apps service, which enables users to access articles and related content from over 200 titles on a tablet or other mobile device.
Wiley Open Access is the Company’s publishing program for open-access research articles. Under the Wiley Open Access business model, research articles submitted by authors are published in open-access journals. All research articles published in Wiley Open Access journals are freely available to the general public on Wiley Online Library to read, download and share. A publication service fee is charged upon acceptance of a research article by the Company, which may be paid by the individual author or by the author’s funder or institution. To actively support researchers and members who wish to publish in Wiley Open Access journals, an academic or research institution, society or corporation may fund the fee directly. In return for the service fee, the Company provides its customary publishing, editing, peer review, technology and distribution services. All accepted open-access articles are subject to the same rigorous peer-review process applied to the Company’s subscription based journals which are supported by the Company’s network of prestigious journals and societies. In addition to Wiley Open Access, the Company provides authors with the opportunity to make their individual research articles that were published within the Company’s paid subscription journals freely available to the general public through OnlineOpen on payment of an Article Payment Charge.
Professional Development (“PD”):
The Company’s Professional Development business acquires, develops and publishes professional information and content delivered through print and digital books, test preparation, assessments, online learning solutions and certification and training services. Communities served include business, finance, accounting, workplace learning, management, leadership, technology, behavioral health, engineering/architecture and education. Professional Development’s mission is to create products and services that help professionals worldwide learn, achieve results, and enhance their skills throughout their careers enabling corporations to maximize their investment in employees, having them become more effective in the workplace. Products are developed in print and digitally for worldwide distribution through multiple channels, including chain and online booksellers, libraries, colleges and universities, corporations, direct to consumer, websites, distributor networks and other online applications. Publishing centers include Australia, Germany, India, the United Kingdom and the United States. Professional Development accounted for approximately 23% of total Company revenue in fiscal year 2016 which declined at a compound annual rate of 1% over the past five years, including the impact of the divested consumer publishing programs in fiscal year 2013 and the acquisitions of Inscape in fiscal year 2012, Efficient Learning Systems, Inc. in fiscal year 2013, Profiles in fiscal year 2014 and CrossKnowledge in fiscal year 2015.
17
Professional Development revenue by product type includes Print Books; Digital Books; Online Test Preparation and Certification; Assessments; and Corporate Learning.
The graph below presents PD revenue by product type for fiscal year 2016 and 2015:
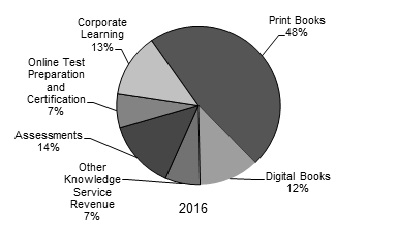
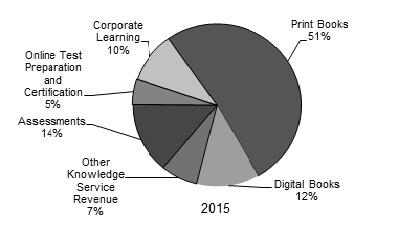
Key growth strategies for the Professional Development business include: developing and acquiring products and services to drive corporate development and professional career development; developing leading brands and franchises; executing strategic acquisitions and partnerships; innovating digital book formats while expanding their global discoverability and distribution; and creating advertising opportunities on the Company’s branded websites and online applications. Several of the more recent acquisitions that focus on achieving these growth strategies are described in more detail below.
In May 2014, the Company acquired CrossKnowledge for approximately $166 million in cash, net of cash acquired. CrossKnowledge is a learning solutions provider focused on leadership and managerial skills development that offers subscription-based, digital learning solutions for global corporations, universities, and small and medium-sized enterprises. CrossKnowledge’s solutions include a variety of managerial and leadership skills assessments, courses, certifications, content and executive training programs that are delivered on a cloud-based LMS platform with over 19,000 learning objects in 17 languages. CrossKnowledge serves over seven million end-users in 80 countries. CrossKnowledge generated revenue of $50.7 million in fiscal year 2016.
In April 2014, the Company acquired Profiles International (“Profiles”) for approximately $48 million in cash, net of cash acquired. Profiles provides pre-employment assessment and selection tools that enable employers to optimize candidate selections and develop the full potential of their employees. Solutions include pre-hire assessments, including those designed to measure and match personality, knowledge, skills, managerial fit, loyalty, and values; and post-hire assessments, focused on measuring sales and managerial effectiveness, employee performance and career potential. Profiles serves approximately 4,000 corporate clients and millions of end users in over 120 countries, with assessments available in 32 languages. Profiles generated revenue of $20.3 million in fiscal year 2016.
18
In 2012, the Company acquired Efficient Learning Systems, Inc. (“ELS”) for approximately $24 million in cash, net of cash acquired. ELS is an e-learning system provider focused in the areas of professional finance and accounting. ELS’ flagship product, CPAExcel, is a modular, digital platform comprised of online self-study, videos, mobile apps, and sophisticated planning tools that has helped over 65,000 professionals prepare for the CPA exam since 1998. The acquisition enhanced Wiley’s position in the growing CPA test preparation market and provided the Company with a scalable platform that can be leveraged globally across other areas of its Professional Development business. In 2013, the Company also acquired Elan Guides for approximately $2.5 million. Elan Guides provides content in multiple formats to help prepare candidates for the CFA examinations. The fiscal year 2016 revenue associated with these businesses was approximately $14.1 million.
In 2012, Wiley acquired Inscape Holdings, Inc. (“Inscape”), a leading provider of assessment-based employee training solutions, for approximately $85 million in cash, net of cash acquired. The acquisition combined Wiley’s deep well of valuable content and global reach in leadership and training with Inscape’s talent development content, technology and distribution network, including the innovative EPIC online assessment-delivery platform and an elite global authorized distributor network of over 1,700 independent consultants, trainers, and coaches. Inscape’s solution-focused products are used in thousands of organizations, including major government agencies and Fortune 500 companies. Inscape generated revenue of $29.3 million in fiscal year 2016.
Inscape’s solutions-focused DiSC® offerings complement Wiley’s existing offerings, such as Kouzes and Posner’s Leadership Practices Inventory® and The Five Behaviors of a Cohesive TeamTM, in the growing workplace learning industry. The combined assessment offerings increased the Company’s presence in the professional training and development arena. We believe Inscape’s competitive strengths will also advance a number of Professional Development’s major strategic goals. As a workplace learning business with more than 90% of revenue from a proprietary digital platform, Inscape enables Wiley to move more rapidly into digital delivery within the growing workplace learning and assessment market and build a significant market position in the category of leadership development. Inscape also enhanced Wiley’s global presence, serving customers around the world in more than 30 languages each year, with approximately 28% of fiscal year 2016 revenue generated outside the U.S through Inscape’s dedicated global distributor network.
Publishing Alliances and Programs:
Publishing alliances and franchise products are central to the Company’s strategy. Professional Development alliance partners include Bloomberg Press, the American Institute of Architects, the Leader to Leader Institute, Fisher Investments, the CFA Institute, ACT (American College Test), Autodesk and many others.
The Company also promotes an active and growing Professional Development custom publishing program. Custom publications are typically used by organizations for internal promotional or incentive programs. The Company’s custom publications include digital and print books written specifically for a customer and customizations of Professional Development’s existing publications to include custom cover art, such as imprints, messages and slogans. Of special note are customized For Dummies publications, which leverage the power of this well-known brand to meet the specific information needs of a wide range of organizations around the world.
Education:
The Company’s Education business produces educational content and solutions, including course management tools for instructors and students and online program services for higher education institutions. Education’s mission is to help teachers teach and students learn by delivering personalized content, tools and services that demonstrate results to students, faculty and institutions throughout the world. Education offers learning solutions, innovative products and services principally delivered through college bookstores, online distributors and directly to institutions and more recently direct-to-student, with customers having access to content in digital and custom print formats, as well as the traditional print textbook. Education’s cost-effective, flexible solutions are available in each of its publishing disciplines, including sciences, engineering, computer science, mathematics, business and accounting, statistics, geography, hospitality and the culinary arts, education, psychology and modern languages.
19
Education accounted for approximately 21% of total Company revenue in fiscal year 2016 and generated revenue growth at a compound annual rate of 3% over the past five years, including the acquisition of Deltak in fiscal year 2013.
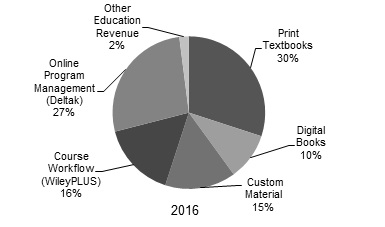
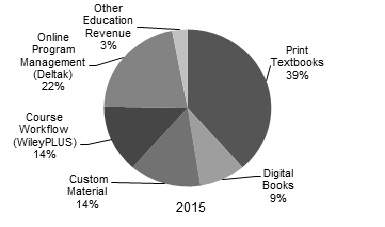
Education revenue by product type includes Print Textbooks; Digital Books; Online Program Management (Deltak); Custom Material; Course Workflow (WileyPLUS), and Other Education revenue which includes revenue from the licensing of publishing content rights and other content adaptions.
The graph below presents Education revenue by product type for fiscal year 2016 and 2015:
The Company continues to transform the Education business from a content publisher to an education solutions provider. Education’s key growth strategies include developing and acquiring digital products and solutions across the educational value chain; continuing the transformation of the business from traditional print products to digital and custom products and services; focusing on institutional relationships and direct-to-student digital products; and developing the Company’s online education services model acquired with Deltak.
In 2012, the Company acquired Deltak for approximately $220 million in cash, net of cash acquired. Deltak works in close partnership with leading colleges and universities to develop and support online degree and certificate programs. These new services position the Company as an online education services provider. Wiley now provides a complete solution to help higher education institutions transition their programs into valuable online experiences. Deltak offers market research to validate degree or certification program demand; instructional design; marketing; student recruitment; and retention services. Deltak uses its Engage Learning Management System and Student Relationship Platform to enhance the quality and efficacy of online and hybrid programs. The Company now has access to high-growth markets and a variety of capabilities and technologies for its expansion into custom online courses and curriculum development. The Company leverages its strong reputation and financial stability for new program investment, to accelerate growth globally, to access professional consumers and corporations and to expand content and faculty development offerings. As of April 30, 2016, the Company had 38 partners and 226 degree programs under contract. Deltak generated revenue of $96.5 million in fiscal year 2016.
20
Strategic partnerships and relationships with companies such as Microsoft®, Blackboard, Canvas, Snapwiz and the Culinary Institute of America are an important component of Education’s growth strategy. The ability to join Wiley’s product development, sales, marketing, distribution and technology with a partner’s content, technology and/or brand name has contributed to Education’s success.
Education offers high-quality online learning solutions including Course Workflow (WileyPLUS), a research-based, online environment for effective teaching and learning that is integrated with a complete digital textbook. WileyPLUS improves student learning through instant feedback, personalized learning plans, and self-evaluation tools as well as a full range of course-oriented activities, including online planning, presentations, study, homework and testing. In selected courses, WileyPlus includes a personalized adaptive learning component, Orion, which is based on cognitive science. Orion helps to build student proficiency on topics while improving the effectiveness of their study time. It assists educators in identifying areas that need reinforcement and measures student engagement and proficiency throughout the course.
Education promotes and supports the customization of its content. Wiley Custom Learning Solutions is a full-service custom publishing program that offers an array of tools and services designed to put creation of customized content in instructors’ hands. Our suite of custom products empowers users to create high-quality, affordable education solutions tailored to meet individual classroom needs. Through Wiley Custom Select, an online custom textbook system, instructors can easily build print and digital materials tailored to their specific course needs and add their own content to create a customized solution derived from any one of the Company’s three business segments.
Knowledge-Enabled Products and Services:
Journal Products:
The Company publishes approximately 1,700 Research and Professional Development journals. Journal Subscription revenue and other related publishing income, such as Author-Funded Access, advertising, backfile sales, the licensing of publishing rights, journal reprints and individual article sales accounted for approximately 48% of the Company’s consolidated fiscal year 2016 revenue. The journal portfolio includes titles owned by the Company, in which case they may or may not be sponsored by a professional society; titles owned jointly with a professional society; and titles owned by professional societies and published by the Company pursuant to long-term contracts.
The Company sells journal subscriptions directly through Company sales representatives; indirectly through independent subscription agents; through promotional campaigns; and through memberships in professional societies for those journals that are sponsored by societies. Journal subscriptions are primarily licensed through contracts for digital content delivered through the Company’s online platform, Wiley Online Library. Contracts are negotiated by the Company directly with customers or their subscription agents. Licenses range from one to three years in duration and typically cover calendar years. Print journals are generally mailed to subscribers directly from independent printers. The Company does not own or manage printing facilities. The print journal content is also available online via Wiley Online Library. Subscription revenue is generally collected in advance, and deferred until the Company has fulfilled its obligation to the customer at which time the revenue is earned. The Company transitioned from issue-based to time-based digital journal subscription agreements for calendar year 2016. Under this new model, the Company provides access to all journal content published within a calendar year and recognizes revenue on a straight-line basis over the calendar year. Under the Company’s previous licensing model, a customer subscribed to a discrete number of online journal issues and revenue was recognized as each issue was made available online. The Company made these changes to simplify the contracting and administration of digital journal subscriptions. Print journal subscription revenue is recognized once the related issue is shipped.
21
Societies that sponsor or own such journals generally receive a royalty and/or other consideration. The Company may procure editorial services from such societies on a pre-negotiated fee basis. The Company also enters into agreements with outside independent editors of journals that define the duties of the editors, and the fees and expenses for their services. Contributors of articles to the Company’s journal portfolio transfer publication rights to the Company or a professional society, as applicable. Journal articles may be based on funded research through government or charitable grants. In certain cases the terms of the grant may require the grant holder to make articles (either the published version or an earlier unedited version) available free of charge to the general public, typically after an embargo period. Funded open access under the Company’s Wiley Open Access and OnlineOpen business models facilitate the ability of the grant holder to comply.
Book Products:
Book products and other book publishing revenue, such as advertising and the sale of publishing rights, accounted for approximately 41% of the Company’s consolidated fiscal year 2016 revenue. Materials for book publications are obtained from authors throughout most of the world through the efforts of an editorial staff, outside editorial advisors, and advisory boards. Most materials are originated by the authors themselves or as a result of suggestion or solicitations by editors and advisors. The Company enters into agreements with authors that state the terms and conditions under which the materials will be published, the name in which the copyright will be registered, the basis for any royalties, and other matters. Most of the authors are compensated with royalties, which vary depending on the nature of the product. The Company may make advance payments against future royalties to authors of certain publications. Royalty advances are reviewed for recoverability and a reserve for loss is maintained, if appropriate.
The Company continues to add new titles, revise existing titles, and discontinue the sale of others in the normal course of its business, and also creates adaptations of original content for specific markets based on customer demand. The Company’s general practice is to revise its textbooks approximately every three years, if warranted, and to revise other titles as appropriate. Subscription-based products are updated on a more frequent basis.
Professional books are sold to bookstores and online booksellers serving the general public; wholesalers who supply such bookstores; warehouse clubs; college bookstores; individual practitioners; and research institutions, libraries (including public, professional, academic, and other special libraries), industrial organizations, and government agencies. The Company employs sales representatives who call upon independent bookstores, national and regional chain bookstores and wholesalers. Sales of professional books also result from direct mail campaigns, telemarketing, online access, advertising and reviews in periodicals. Trade sales are generally made on a returnable basis with certain restrictions. The Company provides for estimated future returns on sales made during the year based on historical return experience and current market trends.
Adopted education textbooks and related supplementary material and digital products are sold primarily to bookstores and online booksellers, serving both for-profit, nonprofit educational institutions and direct-to-students. The Company employs sales representatives who call on faculty responsible for selecting books to be used in courses, and on the bookstores that serve such institutions and their students. Textbook sales are generally made on a returnable basis with certain restrictions. The textbook business is seasonal, with the majority of textbook sales occurring during the June through August and November through January periods. There are active used and rental textbook markets, which adversely affect the sale of new textbooks.
The Company generally contracts with independent printers and binderies globally for their services. The Company purchases its paper from independent suppliers and printers. The fiscal year 2016 weighted average U.S. paper prices decreased approximately 1% from fiscal year 2015. Approximately 75% of the Company’s paper inventory is held in the United States. Management believes that adequate printing and binding facilities, sources of paper and other required materials are available to it, and that it is not dependent upon any single supplier. Printed book products are distributed from both Company-operated warehouses and independent distributors.
22
The Company develops content in a digital format that can be used for both digital and print products, resulting in productivity and efficiency savings, and enabling print-on-demand delivery. Book content is available online through Wiley Online Library, WileyPLUS, Wiley Custom Select and other proprietary platforms. Digital books are delivered to intermediaries including Amazon, Apple and Google, for re-sale to individuals in various industry-standard formats, which are now the preferred deliverable for licensees of all types, including foreign language publishers. Digital books are also licensed to libraries through aggregators. Specialized formats for digital textbooks go to distributors servicing the academic market, and digital book collections are sold by subscription through independent third-party aggregators servicing distinct communities. Custom deliverables are provided to corporations, institutions and associations to educate their employees, generate leads for their products, and extend their brands. Content from digital books is also used to create website articles, mobile apps, newsletters and promotional collateral. This continual re-use of content improves margins, speeds delivery and helps satisfy a wide range of customer needs. The Company’s online presence not only enables it to deliver content online, but also to sell more books. The growth of online booksellers benefits the Company because they provide unlimited virtual “shelf space” for the Company’s entire backlist.
Marketing and distribution services are made available to other publishers under agency arrangements. The Company also engages in co-publishing titles with international publishers and receives licensing revenue from photocopies, reproductions, translations, and digital uses of its content.
Solutions:
The Company believes that the demand for learning solutions will continue to increase for the foreseeable future. In order to meet this demand, the Company is focused on delivering knowledge-enabled services, which improve learning, career development and employment management for its target communities. With the goal of servicing its customers across the arc of their careers the Company is creating new revenue streams through organic development and acquisition. The acquisitions of Deltak, Inscape, ELS, Profiles and CrossKnowledge have enhanced the Company’s portfolio of knowledge-enabled digital services and provided the Company with new capabilities and expertise, including new channels to market and direct end-user engagement. The Inscape, ELS, Profiles and CrossKnowledge acquisitions highlight the Company’s focus on providing digital content; workflow solutions around professional career development and talent assessment, while the Deltak acquisition positions the Company as an online higher educational solutions provider with a variety of capabilities and technologies for its expansion into custom online course and curriculum development. In addition, Education’s Course Workflow (WileyPLUS) platform improves student learning through instant feedback, personalized learning plans and self-evaluation tools.
Corporate Learning:
The Corporate Learning (CrossKnowledge) business offers digital learning solutions for global corporations, universities, and small and medium-sized enterprises, which are sold on a subscription or fee basis. CrossKnowledge’s solutions include a variety of managerial and leadership topics such as leadership, diversity, value creation, client orientation, change and corporate strategy, that are delivered on a cloud-based LMS platform with over 19,000 learning objects in 17 languages. Its Mohive offering also provides a collaborative e-learning publishing and program creation system. Revenue growth is derived from legacy markets, such as Europe, Asia and the Nordics, and in newer markets, such as the U.S. and Latin America. In addition, content and LMS offerings are continuously refreshed and expanded to serve a wider variety of customer needs. Corporate Learning revenue was approximately $50.7 million in fiscal year 2016.
23
Assessments:
The Inscape and Profiles businesses represent the core of the Company’s professional assessment services. These businesses offer four of the leading assessment brands available in the market today. The offerings are delivered to customers through online digital delivery platforms either directly or through an authorized distributor network of independent consultants, trainers and coaches. The Company’s professional assessment services offer highly flexible packages and modules for its customers that include online pre and post-hire assessments. Revenue for these products and services are deferred until the Company’s obligation has been performed, typically when an online assessment has been completed. Assessment revenue was approximately $57.4 million in fiscal year 2016.
Professional Online Test Preparation and Certifications:
The Company’s acquisitions of ELS and Elan Guides represent the Company’s professional Online Test Preparation and Certification services. These businesses offer a variety of online learning solutions and training activities that are delivered to customers directly through online digital delivery platforms. ELS’ flagship product, CPAExcel, is a modular, digital platform comprised of online self-study, videos, mobile apps, and sophisticated planning tools to help professionals prepare for the CPA exam. Elan Guides provides content in multiple formats to help prepare candidates for the Certified Financial Analyst examinations. Revenue for these products and services are deferred until the Company’s obligation has been performed, typically when an online training program has been completed or over the timeframe covered by a license to use the online training and study materials. PD’s Online Test Preparation and Certification revenue was approximately $28.2 million in fiscal year 2016.
Online Program Management (Deltak):
As student demand continues to drive higher education institutions to offer online degree and certificate programs, institutions are partnering with online program management businesses to develop and support these programs. Through the Deltak acquisition, the Company has entered this high-growth market, accelerated its digital learning strategy and diversified the service offerings of its Education business to include both operational and academic solutions for higher education institutions. Through Deltak, the Company acquired capabilities and technologies to expand into custom online course and curriculum development. Deltak services include market research, marketing, student recruitment, enrollment support, proactive retention support, academic services to design courses, faculty support and access to the Deltak Engage Learning Management System. Deltak’s online program management revenue is derived from pre-negotiated contracts with institutions that provide for a share of tuition generated from students who enroll in programs that Deltak develops and manages for its institutional partners. Online program management revenue is deferred and recognized over the timeframe that each student is enrolled in the online program. As of April 30, 2016 the Company had 38 partners and 226 degree programs under contract. Deltak generated revenue of $96.5 million in fiscal year 2016.
Course Workflow (WileyPLUS):
Through Education’s WileyPLUS platform, the Company offers an online environment for effective teaching and learning that is fully integrated with a complete digital or print textbook. WileyPLUS improves student learning through instant feedback, personalized learning plans, and self-evaluation tools as well as a full range of course-oriented activities, including online planning, presentations, study, homework and testing. WileyPLUS revenue is deferred and recognized over the timeframe that each student is enrolled in the online course. WileyPLUS revenue was approximately $58.6 million in fiscal year 2016.
24
Advertising Revenue:
The Company generates advertising revenue from print and online journal subscription products; its online publishing platform, Wiley Online Library; online events such as webinars and virtual conferences; community interest websites such as spectroscopyNOW.com and websites for the Company’s leading brands like Dummies.com. These revenues accounted for approximately 2% of the Company’s consolidated fiscal year 2016 revenue.
Advertisements are sold by company and independent sales representatives to advertising agencies representing the Company’s target customers. Typical customers include worldwide pharmaceutical companies; equipment manufacturers and distributors servicing the pharmaceutical industry; recruiters; and a variety of businesses targeting the Company’s leading brand customers. The Company’s advertising growth strategy focuses on increasing the volume of advertising on its online publishing platform; leveraging the brand recognition of its titles and society partnerships; the development of new advertising products such as online video promotions or event sponsorship arrangements; and advertising in new and emerging technologies such as the mobile devices market (i.e. applications for smartphones and tablets).
Global Operations
The Company’s publications and services are sold throughout most of the world through operations primarily located in Europe, Canada, Australia, Asia, and the United States. All operations market their indigenous publications, as well as publications produced by other publishing locations of the Company. The Company also markets publications through independent agents as well as independent sales representatives in countries not served by the Company. John Wiley & Sons International Rights, Inc., a wholly owned subsidiary of the Company, sells reprint and translations rights worldwide. The Company publishes or licenses others to publish its products, which are distributed throughout the world in many languages. Approximately 49% of the Company’s consolidated fiscal year 2016 revenue was billed in non-U.S. markets.
The global nature of the Company’s business creates an exposure to foreign currency. Each of the Company’s geographic locations sells products worldwide in multiple currencies. The percentage of Consolidated Revenue for fiscal year 2016 recognized in the following currencies (on an equivalent U.S. dollar basis) were: approximately 57% U.S dollar; 28% British pound sterling; 8% euro and 7% other currencies.
Competition and Economic Drivers within the Publishing Industry
The sectors of the publishing and information services industry in which the Company is engaged are competitive. The principal competitive criteria for the publishing industry are considered to be the following: product quality, customer service, suitability and searchability of format and subject matter, author reputation, price, timely availability of both new titles and revisions of existing books, digital availability of published products, and timely delivery of products to customers.
The Company is in the top rank of publishers of research journals worldwide, a leading commercial research chemistry publisher; the leading professional society journal publisher; one of the leading publishers of university and college textbooks and related materials for the “hardside” disciplines, (i.e. sciences, engineering, and mathematics), and a leading publisher in its targeted Professional Development markets. The Company knows of no reliable industry statistics that would enable it to determine its share of the various international markets in which it operates.
25
Performance Measurements
The Company measures its performance based upon revenue, operating income, earnings per share and cash flow, excluding unusual or one-time events, and considering worldwide and regional economic and market conditions. The Company evaluates market share statistics for publishing programs in each of its businesses. Research uses various reports to monitor competitor performance and industry financial metrics. Specifically for Research journal titles, the Thomson Reuters® Journal Citation Reports are used as a key metric of a journal title’s influence in scientific publishing. For Professional Development, the Company evaluates market share statistics periodically published by BOOKSCAN, a statistical clearinghouse for book industry point of sale data in the United States. The statistics include survey data from all major retail outlets, online booksellers, mass merchandisers, small chain and independent retail outlets. For Education, the Company subscribes to Management Practices Inc., which publishes customized comparative sales reports, and also uses industry statistics and reports produced by the Association of American Publishers.
Results of Operations
Throughout this report, references to variances “excluding foreign exchange”, “currency neutral basis” and “performance basis” exclude both foreign currency translation effects and transactional gains and losses. Foreign currency translation effects are based on the change in average exchange rates for each reporting period multiplied by the current period’s volume of activity in local currency for each non-U.S. location. For fiscal years 2016 and 2015, the average annual exchange rates to convert British pounds sterling to U.S. dollars were 1.50 and 1.60; the average annual exchange rates to convert euros into U.S. dollars were 1.11 and 1.25, respectively; and the average annual exchange rates to convert Australian dollars into U.S. dollars were 0.74 and 0.86, respectively. Unless otherwise noted, all variance explanations below are on a currency neutral basis.
FISCAL YEAR 2016 SUMMARY RESULTS
Revenue:
Revenue for fiscal year 2016 decreased 5% to $1,727.0 million, or 2% excluding the unfavorable impact of foreign exchange. The decrease was mainly driven by a decline in print books ($44 million) and the previously announced transition to time-based digital journal subscription agreements for calendar year 2016 ($37 million), partially offset by growth in Online Program Management (Deltak) ($14 million); Corporate Learning (CrossKnowledge) ($13 million); online test preparation and certification ($6 million); new product formats in Education ($6 million); digital books ($4 million) and other ($4 million).
As previously announced the Company transitioned from issue-based to time-based digital journal subscription agreements for calendar year 2016. The transition to time-based digital journal subscription agreements shifted approximately $37 million of revenue from fiscal year 2016 to the remainder of calendar year 2016 (fiscal year 2017). The change had no impact on free cash flow. The Company made these changes to simplify the contracting and administration of digital journal subscriptions.
Cost of Sales and Gross Profit:
Cost of sales for fiscal year 2016 decreased 7% to $465.9 million, or 4% excluding the favorable impact of foreign exchange. The decrease was mainly driven by lower sales volume ($8 million); cost savings from outsourcing and procurement initiatives and lower cost digital products ($13 million); lower royalty cost due to the transition to time-based digital journal subscription agreements ($5 million) and other ($4 million), mainly lower composition costs, partially offset by higher royalty rates on society owned journals ($5 million); growth in Corporate Learning (CrossKnowledge) ($4 million) and Online Program Management (Deltak) ($2 million).
26
Gross profit margin for fiscal year 2016 increased 40 basis points to 73.0% mainly driven by growth in higher margin digital products (70 basis points), partially offset by the impact of transitioning to time-based digital journal subscription agreements.
Operating and Administrative Expenses:
Operating and administrative expense for fiscal year 2016 decreased 1% to $994.6 million, but increased 2% excluding the favorable impact of foreign exchange. The increase reflects higher student recruitment costs to support new Online Program Management (Deltak) programs ($14 million); investment in the Company’s Enterprise Resource Planning and related systems ($13 million) and other technology development and maintenance ($17 million); higher employment costs ($13 million), mainly merit increases and higher accrued variable incentive compensation; investments in Corporate Learning (CrossKnowledge) ($11 million); and higher process reengineering consulting ($4 million) and legal costs ($4 million). Restructuring and other cost savings initiatives ($41 million); synergies from the Talent Solution-Assessment business ($6 million); and lower distribution costs due to lower sales volumes of print books and journals ($2 million) partially offset the cost increases.
Restructuring Charges:
Beginning in fiscal year 2013, the Company initiated a program (the “Restructuring and Reinvestment Program”) to restructure and realign its cost base with current and anticipated future market conditions. The Company is targeting a majority of the cost savings achieved to improve margins and earnings, while the remainder will be reinvested in high growth digital business opportunities.
In fiscal years 2016 and 2015, the Company recorded pre-tax restructuring charges of $28.6 million ($0.32 per share) and $28.8 million ($0.34 per share), respectively, related to this program. These charges are reflected in Restructuring Charges in the Consolidated Statements of Income and summarized in the following table (in thousands):
|
Total Charges
|
|||||
|
2016
|
2015
|
Incurred to Date
|
|||
|
Charges by Segment:
|
|||||
|
Research
|
$5,048
|
$4,555
|
$20,273
|
||
|
Professional Development
|
2,277
|
4,385
|
24,806
|
||
|
Education
|
1,206
|
1,571
|
4,786
|
||
|
Shared Services
|
20,080
|
18,293
|
74,724
|
||
|
Total Restructuring Charges
|
$28,611
|
$28,804
|
$124,589
|
||
|
Charges by Activity:
|
|||||
|
Severance
|
$16,443
|
$17,093
|
$79,204
|
||
|
Process reengineering consulting
|
7,191
|
301
|
18,666
|
||
|
Other activities
|
4,977
|
11,410
|
26,719
|
||
|
Total Restructuring Charges
|
$28,611
|
$28,804
|
$124,589
|
Other Activities reflects leased facility consolidations, contract termination costs and the curtailment of certain defined benefit pension plans. The fiscal year 2016 restructuring charges of $28.6 million are expected to be fully recovered within the next 18 months.
27
Amortization of Intangibles:
Amortization of intangibles decreased $1.5 million in fiscal year 2016 mainly due to the effect of foreign exchange.
Interest Expense/Income, Foreign Exchange and Other:
Interest expense for fiscal year 2016 decreased $0.4 million to $16.7 million due to a decrease in the Company’s average borrowing rate from 2.1% to 2.0%, partially offset by higher average debt balances outstanding. Foreign exchange transaction gains decreased from $1.7 million to $0.5 million in fiscal year 2016.
Provision for Income Taxes:
The effective tax rate for fiscal year 2016 was 16.6% compared to 21.6% in the prior year. In fiscal year 2016, the Company recorded non-cash deferred tax benefits of $5.9 million ($0.10 per share), principally associated with new tax legislation enacted in the United Kingdom (“U.K.”) that reduced the future U.K. statutory income tax rates by 2%. The benefits reflect the remeasurement of all applicable U.K. deferred tax balances to the new income tax rates of 19% effective April 1, 2017 and 18% effective April 1, 2020. In fiscal year 2015, the Company recognized a non-recurring tax benefit of $3.1 million ($0.05 per share) related to tax deductions claimed on the write-up of certain foreign tax assets to fair market value. Excluding the impact of the tax benefits described above, the Company’s effective tax rate decreased from 22.9% to 19.9% principally due to lower foreign tax rates, a tax reserve release and a lower proportion of income from the U.S. at higher tax rates.
Earnings Per Share:
Earnings per diluted share for fiscal year 2016 decreased $0.49 per share to $2.48 per share, or $0.43 per share excluding the current ($0.32 per share) and prior year ($0.34 per share) restructuring charges, the current year deferred tax benefit on the U.K. rate change ($0.10 per share), the prior year non-recurring tax benefit ($0.05 per share) and the unfavorable impact of foreign exchange ($0.13 per share). The decline was mainly driven by the transition to time-based digital journal subscription agreements ($0.42 per share); investments in the Company’s Enterprise Resource Planning and related systems, Online Program Management (Deltak) and Corporate Learning (CrossKnowledge), partially offset by restructuring and other cost savings initiatives.
BUSINESS SEGMENT RESULTS:
As part of Wiley’s Restructuring and Reinvestment Program, the Company consolidated its marketing services functions into a single global shared service function. This newly centralized service group enables significant cost reduction opportunities, including efficiencies gained from standardized technology and centralized management. The costs of these functions were previously reported as direct operating expenses in each business segment but are now reported within Shared Services and Administrative Costs and are allocated to each business segment. In addition, the Company modified its product/service revenue categories for the Research segment. As a result, prior year amounts have been restated to reflect these same reporting methodologies. The Company uses occupied square footage of space; number of employees; units shipped; specific identification/activity-based; gross profit; revenue and number of invoices to allocate shared service costs to each business segment.
28
|
% change
|
||||
|
RESEARCH:
|
2016
|
2015
|
% change
|
w/o FX (a)
|
|
Revenue:
|
||||
|
Journal Revenue:
|
||||
|
Journal Subscriptions
|
$611,403
|
$672,218
|
-9%
|
-6%
|
|
Author-Funded Access
|
25,669
|
22,388
|
15%
|
21%
|
|
Licensing, Reprints, Backfiles, and Other
|
178,542
|
188,326
|
-5%
|
0%
|
|
Total Journal Revenue
|
815,614
|
882,932
|
-8%
|
-4%
|
|
|
||||
|
Books and References:
|
||||
|
Print Books
|
90,586
|
99,746
|
-9%
|
-6%
|
|
Digital Books
|
44,788
|
42,512
|
5%
|
9%
|
|
Licensing and Other
|
14,266
|
15,605
|
-9%
|
0%
|
|
Total Books and References Revenue
|
149,640
|
157,863
|
-5%
|
-1%
|
|
|
||||
|
Total Revenue
|
$965,254
|
$1,040,795
|
-7%
|
-3%
|
|
Cost of Sales
|
(262,693)
|
(275,487)
|
-5%
|
-1%
|
|
Gross Profit
|
$702,561
|
$765,308
|
-8%
|
-4%
|
|
Gross Profit Margin
|
72.8%
|
73.5%
|
||
|
Direct Expenses
|
(229,666)
|
(245,278)
|
-6%
|
-2%
|
|
Amortization of Intangibles
|
(27,546)
|
(28,190)
|
-2%
|
2%
|
|
Restructuring Charges (see Note 6)
|
(5,048)
|
(4,555)
|
||
|
Direct Contribution to Profit
|
$440,301
|
$487,285
|
-10%
|
-6%
|
|
Direct Contribution Margin
|
45.6%
|
46.8%
|
||
|
Shared Services and Administrative Costs:
|
||||
|
Distribution and Operation Services
|
(39,348)
|
(44,620)
|
-12%
|
-7%
|
|
Technology and Content Management
|
(98,442)
|
(96,486)
|
2%
|
5%
|
|
Occupancy and Other
|
(29,516)
|
(30,405)
|
-3%
|
2%
|
|
Contribution to Profit
|
$272,995
|
$315,774
|
-14%
|
-10%
|
|
Contribution Margin
|
28.3%
|
30.3%
|
||
(a) Adjusted to exclude the fiscal year 2016 and 2015 Restructuring Charges
Revenue:
Research revenue for fiscal year 2016 decreased 7% to $965.3 million, or 3% excluding the unfavorable impact of foreign exchange. As previously announced, the Company transitioned from issue-based to time-based digital journal subscription agreements for calendar year 2016. The change shifted approximately $37 million of revenue from fiscal year 2016 to the remainder of calendar year 2016 (fiscal year 2017). The change had no impact on free cash flow. The Company made these changes to simplify the contracting and administration of digital journal subscriptions. Excluding the impact of the transition to time-based subscriptions and foreign exchange, Research revenue was flat with the prior year.
Journal Subscriptions revenue decreased 6% on a currency neutral basis mainly due the impact of moving to time-based digital journal subscriptions ($37 million) and the trailing effects of the Swets bankruptcy ($3 million). As previously disclosed, Swets Information Services, a global library subscription agent based in Amsterdam, declared bankruptcy in late September 2014. Excluding the impact of transitioning to time-based journal subscription agreements and foreign exchange, Journal Subscription revenue was flat with the prior year. As of April 30, 2016, calendar year 2016 journal subscription renewals were 1% higher than calendar year 2015 billings on a constant currency basis with approximately 95% of targeted business under contract for the 2016 calendar year.
29
Author-Funded Access, which represents article publication fees that provide for free access to articles, grew $3.3 million in fiscal year 2016. Licensing, Reprints, Backfiles and Other revenue of $178.5 million was flat with the prior year on a constant currency basis.
On a currency neutral basis, Print Books declined 6% to $90.6 million in fiscal year 2016. Digital Books grew 9% on a currency neutral basis which was mainly driven by a single $4 million digital book sale in the current year. Licensing and Other revenue of $14.3 million was flat with the prior year on a currency neutral basis.
Revenue by Region is as follows:
|
% of
|
% change
|
|||
|
2016
|
2015
|
Revenue
|
w/o FX
|
|
|
Revenue by Region:
|
||||
|
Americas
|
$370,111
|
$398,573
|
38%
|
-6%
|
|
EMEA
|
540,562
|
585,693
|
56%
|
-3%
|
|
Asia-Pacific
|
54,581
|
56,529
|
6%
|
7%
|
|
Total Revenue
|
$965,254
|
$1,040,795
|
100%
|
-3%
|
Cost of Sales:
Cost of Sales for fiscal year 2016 decreased 5% to $262.7 million, or 1% excluding the favorable impact of foreign exchange. The decrease was mainly driven by lower royalty costs due to the transition to time-based digital journal subscription agreements ($5 million) and cost savings from outsourcing and procurement initiatives and lower cost digital products ($4 million), partially offset by higher royalty rates on society owned journals ($5 million) and higher print inventory obsolescence provisions ($1 million).
Gross Profit:
Gross Profit Margin decreased 70 basis points to 72.8% in fiscal year 2016 mainly due to the impact of transitioning to time-based digital journal subscription agreements.
Direct Expenses and Amortization:
Direct Expenses for fiscal year 2016 decreased 6% to $229.7 million, or 2% excluding the favorable impact of foreign exchange. The decrease was mainly driven by the curtailment of a Company defined benefit pension plan ($3 million) and other restructuring savings and cost containment initiatives ($6 million), partially offset by merit increases ($2 million); higher legal and process reengineering consulting fees ($2 million); and higher accrued incentive compensation ($1 million). Amortization of Intangibles decreased $0.6 million to $27.5 million in fiscal year 2016 mainly due to the favorable impact of foreign exchange.
Contribution to Profit:
Contribution to Profit for fiscal year 2016 decreased 14% to $273.0 million, or 10% excluding the unfavorable impact of foreign exchange and the current and prior year Restructuring Charges. The decrease was principally driven by the impact of the transition to time-based journal subscriptions; higher royalty rates on society owned journals; and higher employment costs, partially offset by restructuring and other cost savings from outsourcing and procurement initiatives. Contribution Margin was 28.3% compared to 30.3% in the prior year period.
30
Society Partnerships
|
·
|
6 new society journals were signed with combined annual revenue of approximately $12 million
|
|
·
|
87 renewals/extensions were signed with approximately $54 million in combined annual revenue
|
|
·
|
18 journals were not renewed with combined annual revenue of approximately $11 million
|
Journal Impact Index
In July 2015, Wiley announced a strong performance in the number of its journal titles indexed in the Thomson Reuters® 2014 Journal Citation Reports (JCR). A total of 1,200 Wiley titles were indexed, with 24 Wiley journals achieving the top rank in their respective categories and 240 achieving a top 10 ranking. The Thomson Reuters index is a barometer of journal influence across the research community.
|
% change
|
||||
|
PROFFESIONAL DEVELOPMENT (PD):
|
2016
|
2015
|
% change
|
w/o FX (a)
|
|
Revenue:
|
||||
|
Knowledge Services:
|
||||
|
Print Books
|
$192,149
|
$206,086
|
-7%
|
-4%
|
|
Digital Books
|
47,089
|
49,672
|
-5%
|
-3%
|
|
Online Test Preparation and Certification
|
28,169
|
22,119
|
27%
|
27%
|
|
Other Knowledge Service Revenue
|
28,813
|
30,094
|
-4%
|
-2%
|
|
296,220
|
307,971
|
-4%
|
-2%
|
|
|
Talent Solutions:
|
||||
|
Assessment
|
$57,369
|
$57,035
|
1%
|
1%
|
|
Corporate Learning
|
50,692
|
42,017
|
21%
|
31%
|
|
108,061
|
99,052
|
9%
|
14%
|
|
|
Total Revenue
|
$404,281
|
$407,023
|
-1%
|
2%
|
|
Cost of Sales
|
(103,652)
|
(114,014)
|
-9%
|
-7%
|
|
Gross Profit
|
$300,629
|
$293,009
|
3%
|
6%
|
|
Gross Profit Margin
|
74.4%
|
72.0%
|
||
|
Direct Expenses
|
(118,638)
|
(131,969)
|
-10%
|
-7%
|
|
Amortization of Intangibles
|
(12,691)
|
(13,498)
|
-6%
|
-3%
|
|
Restructuring Charges (see Note 6)
|
(2,277)
|
(4,385)
|
||
|
Direct Contribution to Profit
|
$167,023
|
$143,157
|
17%
|
17%
|
|
Direct Contribution Margin
|
41.3%
|
35.2%
|
||
|
Shared Services and Administrative Costs:
|
||||
|
Distribution and Operation Services
|
(28,364)
|
(30,838)
|
-8%
|
-5%
|
|
Technology and Content Management
|
(40,951)
|
(48,002)
|
-15%
|
-13%
|
|
Occupancy and Other
|
(23,160)
|
(26,180)
|
-12%
|
-8%
|
|
Contribution to Profit
|
$74,548
|
$38,137
|
95%
|
84%
|
|
Contribution Margin
|
18.4%
|
9.4%
|
||
(a) Adjusted to exclude the fiscal year 2016 and 2015 Restructuring Charges
Revenue:
PD revenue for fiscal year 2016 decreased 1% to $404.3 million, but increased 2% excluding the unfavorable impact of foreign exchange. The increase on a currency neutral basis was driven by growth in Talent Solutions, and Online Test Preparation and Certification partially offset by a decline in Book Revenue.
31
Knowledge Services revenue decreased 4% to $296.2 million, or 2% excluding the unfavorable impact of foreign exchange. The decrease was mainly driven by Print ($9 million) and Digital ($2 million) Books and Other Knowledge Services Revenue ($1 million), partially offset by growth in Online Test Preparation and Certification ($6 million). Print and Digital Books results reflected continued retail softness, particularly in EMEA and Asia, partially offset by lower sales return provisions. The increase in Online Test Preparation and Certification was driven by new editions of GMAT titles and growth in proprietary sales of the Company’s CPA, CFA and CMA online certification products. The decline in Other Knowledge Services was driven by lower revenue from the licensing of intellectual content.
Talent Solutions revenue increased 9% to $108.1 million, or 14% excluding the unfavorable impact of foreign exchange. Revenue growth in Corporate Learning came from new customers, including the expansion into the U.S. market, and renewals for existing customers, with France, U.S. and Central and South American markets driving the results. Assessment revenue grew 1% in fiscal year 2016 and was driven by higher post-hire assessment revenue, partially offset by an expected decline in pre-hire assessment revenue following portfolio actions to optimize longer-term profitable growth.
Revenue by Region is as follows:
|
% of
|
% change
|
|||
|
2016
|
2015
|
Revenue
|
w/o FX
|
|
|
Revenue by Region:
|
||||
|
Americas
|
$291,258
|
$288,882
|
72%
|
1%
|
|
EMEA
|
92,106
|
95,613
|
23%
|
4%
|
|
Asia-Pacific
|
20,917
|
22,528
|
5%
|
0%
|
|
Total Revenue
|
$404,281
|
$407,023
|
100%
|
2%
|
Cost of Sales:
Cost of Sales for fiscal year 2016 decreased 9% to $103.7 million, or 7% excluding the favorable impact of foreign exchange. The decrease was mainly driven by lower cost digital products ($6 million); lower royalty and print inventory obsolescence provisions ($4 million); and lower sales volume ($2 million), partially offset by growth in the Corporate Learning business ($4 million).
Gross Profit:
Gross Profit Margin increased by 240 basis points to 74.4% in fiscal year 2016. The improvement was mainly driven by higher margin digital revenue (170 bps) and lower royalty and print inventory obsolescence provisions (70 bps).
Direct Expenses and Amortization:
Direct Expenses for fiscal year 2016 decreased 10% to $118.6 million, or 7% excluding the favorable impact of foreign exchange. The reduction was driven by restructuring and other cost savings ($18 million) and lower process reengineering consulting fees ($1 million), partially offset by Corporate Learning business growth ($8 million); higher accrued variable incentive compensation ($2 million); and merit increases ($1 million). Amortization of Intangibles decreased $0.8 million to $12.7 million in fiscal year 2016.
Contribution to Profit:
Contribution to Profit for fiscal year 2016 was $74.5 million compared to $38.1 million in the prior year. The improvement was mainly driven by restructuring and other cost savings, gross margin improvement and reduced technology investment. Contribution Margin for fiscal year 2016 increased from 9.4% to 18.4%.
32
Test Preparation Partnership
Wiley announced a partnership with ACT, the nation’s leader in college and career readiness, to enhance both organizations’ test prep product offerings and take over as the exclusive publisher for ACT’s The Real ACT® Prep Guide beginning in January 2016. Maker of the ACT test and ACT WorkKeys®, among other respected assessment programs, ACT (American College Test) is committed to providing insights that help individuals better prepare for success throughout their lives—from education through career.
Junior Achievement Program
CrossKnowledge and Junior Achievement USA® announced a joint partnership that will bring digital learning solutions to thousands of students and educators. As part of the agreement, CrossKnowledge has donated the use of its Learning Management System (LMS) to Junior Achievement USA (JA) for the next five years (starting in 2016) through the CrossKnowledge Foundation. This in-kind contribution is one of the largest of its kind in the history of JA. By 2020, we expect that CrossKnowledge programs will reach 1.6 million JA users.
CrossKnowledge/L’Oréal platform:
CrossKnowledge announced the creation of MySalon-Edu.com, an online platform that focuses on salon education, in conjunction with L’Oréal group. The e-cademy massive online open course (MOOC) was created for professional hairdressers and beauticians.
|
% change
|
||||
|
EDUCATION:
|
2016
|
2015
|
% change
|
w/o FX (a)
|
|
Revenue:
|
||||
|
Books:
|
||||
|
Print Textbooks
|
$107,636
|
$144,500
|
-26%
|
-20%
|
|
Digital Books
|
34,462
|
34,086
|
1%
|
5%
|
|
142,098
|
178,586
|
-20%
|
-15%
|
|
|
Custom Materials
|
51,842
|
50,659
|
2%
|
2%
|
|
Course Workflow Solutions (WileyPLUS)
|
58,551
|
54,200
|
8%
|
10%
|
|
Online Program Management (Deltak)
|
96,469
|
81,593
|
18%
|
18%
|
|
Other Education Revenue
|
8,542
|
9,584
|
-11%
|
-11%
|
|
Total Revenue
|
$357,502
|
$374,622
|
-5%
|
-2%
|
|
Cost of Sales
|
(99,573)
|
(110,182)
|
-10%
|
-8%
|
|
Gross Profit
|
$257,929
|
$264,440
|
-2%
|
0%
|
|
Gross Profit Margin
|
72.1%
|
70.6%
|
||
|
Direct Expenses
|
(128,821)
|
(125,613)
|
3%
|
5%
|
|
Amortization of Intangibles
|
(9,527)
|
(9,527)
|
0%
|
0%
|
|
Restructuring Charges (see Note 6)
|
(1,206)
|
(1,571)
|
0%
|
|
|
Direct Contribution to Profit
|
$118,375
|
$127,729
|
-7%
|
-3%
|
|
Direct Contribution Margin
|
33.1%
|
34.1%
|
||
|
Shared Services and Administrative Costs:
|
||||
|
Distribution and Operation Services
|
(15,207)
|
(12,863)
|
18%
|
24%
|
|
Technology and Content Management
|
(51,612)
|
(54,272)
|
-5%
|
-3%
|
|
Occupancy and Other
|
(15,688)
|
(13,950)
|
12%
|
15%
|
|
Contribution to Profit
|
$35,868
|
$46,644
|
-23%
|
-18%
|
|
Contribution Margin
|
10.0%
|
12.5%
|
||
|
(a)
|
Adjusted to exclude the fiscal year 2016 and 2015 Restructuring Charges
|
33
Revenue:
Education revenue for fiscal year 2016 decreased 5% to $357.5 million, or 2% excluding the unfavorable impact of foreign exchange. Print Textbooks decreased 20% to $107.6 million due to higher returns; retail channel consolidation; lower enrollments; increased market penetration by rental; and a shift to lower priced alternatives such as Digital Books, Custom Materials and Course Workflow Solutions (WileyPLUS). Digital books increased 5% to $34.5 million, Custom Materials increased 2% to $51.8 million, and Course Workflow Solutions (WileyPLUS) increased 10% to $58.6 million on a currency neutral basis due to new and digital formats. Other Education Revenue decreased 11% to $8.5 million principally due to lower revenue from the licensing of intellectual content.
Revenue from Online Program Management (Deltak) grew 18% to $96.5 million reflecting higher enrollments; an increase in institutional partners and programs generating revenue; and growth in fee-for-service agreements. As of April 30, 2016, Deltak had 38 partners and 226 degree programs under contract, compared to 38 partners and 200 programs as of April 30, 2015. As of April 30, 2016, 186 of Deltak’s 226 degree programs were revenue generating.
Revenue by Region is as follows:
|
|
% of
|
% change
|
||
|
2016
|
2015
|
Revenue
|
w/o FX
|
|
|
Revenue by Region:
|
||||
|
Americas
|
$295,296
|
$300,174
|
83%
|
-1%
|
|
EMEA
|
15,764
|
19,265
|
4%
|
-15%
|
|
Asia-Pacific
|
46,442
|
55,183
|
13%
|
-4%
|
|
Total Revenue
|
$357,502
|
$374,622
|
100%
|
-2%
|
Cost of Sales:
Cost of Sales for fiscal year 2016 decreased 10% to $99.6 million, or 8% excluding the favorable impact of foreign exchange. The decrease was mainly driven by lower sales volume ($7 million); savings from procurement initiatives and lower cost digital products ($3 million); and lower composition costs ($3 million), partially offset by higher Online Program Management (Deltak) costs due to program growth ($2 million) and higher royalty costs due to mix ($2 million).
Gross Profit:
Gross Profit Margin for fiscal year 2016 improved 150 basis points to 72.1% principally due higher margin growth from Online Program Management (Deltak) (80 bps) and lower inventory and composition costs.
Direct Expenses and Amortization:
Direct Expenses increased 3% to $128.8 million, or 5% excluding the favorable impact of foreign exchange. The increase was mainly driven by student recruitment costs to support new Online Program Management (Deltak) programs ($14 million) and merit increases ($1 million), partially offset by restructuring and other cost savings ($5 million); lower accrued variable incentive compensation ($2 million); and other, mainly lower third-party advertising and promotional expenses ($2 million). Amortization of Intangibles was $9.5 million in fiscal years 2016 and 2015.
34
Contribution to Profit:
Contribution to Profit for fiscal year 2016 decreased 23% to $35.9 million, or 18% excluding the current and prior year Restructuring Charges and the unfavorable impact of foreign exchange. The decline was mainly driven by lower print book revenue; investment in Online Program Management (Deltak) programs; and higher digital fulfillment and marketing support costs, partially offset by restructuring and other cost savings and reduced technology investments. Contribution Margin was 10.0% compared to 12.5% in the prior year.
SHARED SERVICES AND ADMINISTRATIVE COSTS:
As part of Wiley’s Restructuring and Reinvestment Program, the Company consolidated its marketing services functions into a single global shared service function. This newly centralized service group enables significant cost reduction opportunities, including efficiencies gained from standardized technology and centralized management. The costs of these functions were previously reported as direct operating expenses in each business segment but are now reported within Shared Services and Administrative Costs and are allocated to each business segment. As a result, prior year amounts have been restated to reflect these same reporting methodologies. The Company uses occupied square footage of space; number of employees; units shipped; specific identification/activity-based; gross profit; revenue and number of invoices to allocate shared service costs to each business segment.
|
% Change
|
||||
|
Dollars in thousands
|
2016
|
2015
|
% Change
|
w/o FX (a)
|
|
Distribution and Operation Services
|
$83,109
|
$89,024
|
-7%
|
-3%
|
|
Technology and Content Management
|
257,822
|
244,850
|
5%
|
8%
|
|
Finance
|
49,798
|
52,796
|
-6%
|
-2%
|
|
Other Administration
|
126,777
|
115,469
|
10%
|
13%
|
|
Restructuring Charges (see Note 6)
|
20,080
|
18,293
|
||
|
Total
|
$537,586
|
$520,432
|
3%
|
6%
|
(a) Adjusted to exclude the fiscal year 2016 and 2015 Restructuring Charges
Shared Services and Administrative Costs for fiscal year 2016 increased 3% to $537.6 million, or 6% on a currency neutral basis and excluding the current and prior year Restructuring Charges. Lower Distribution and Operation Services costs mainly reflect lower journal shipping and handling costs ($2 million). Technology and Content Management increased mainly due to incremental investments in the Company’s Enterprise Resource Planning and related systems ($13 million); higher license, maintenance and hosting costs ($11 million); investments in Corporate Learning (CrossKnowledge) and Online Program Management (Deltak) programs ($3 million); and merit increases ($2 million), partially offset by restructuring and other cost savings ($14 million). Finance costs decreased 2% on a currency neutral basis mainly due to restructuring and other cost savings ($1 million). Other Administration costs increased mainly due to higher employment costs ($8 million); higher legal costs ($3 million); Online Program Management (Deltak) program growth ($2 million); and process reengineering consulting costs ($2 million).
U.S. Distribution Outsourcing:
As part of the Company’s restructuring initiatives, in November 2015, Wiley entered into an agreement to outsource its US-based print textbook fulfillment operations to Cengage Learning, with the aim of creating a more efficient and variable cost model. As of April 30, 2016 these operations were fully transitioned to Cengage.
35
LIQUIDITY AND CAPITAL RESOURCES:
The Company’s Cash and Cash Equivalents balance was $363.8 million at the end of fiscal year 2016, compared with $457.4 million a year earlier. Cash Provided by Operating Activities in fiscal year 2016 decreased $5.2 million from fiscal year 2015 to $350.0 million principally due to the timing of vendor and royalty payments ($28 million); higher employee retirement plan contributions ($6 million); and higher royalty advance payments due to higher royalty rates on society owned journals and new society contracts ($5 million), partially offset by lower annual incentive compensation payments ($15 million); lower income tax payments and deposits ($11 million); lower payments related to the Company’s restructuring programs ($2 million); and timing of journal subscription cash collections. The change in deferred revenue was driven by lower non-cash earnings mainly due to the impact of transitioning to time-based digital journal subscription agreements; foreign exchange; and timing of cash collections.
Cash Used for Investing Activities in fiscal year 2016 was $151.4 million compared to $279.7 million in the prior year. Fiscal year 2015 includes the acquisition of CrossKnowledge (Corporate Learning) for approximately $166 million in cash, net of cash acquired. The acquisition was funded through the use of the existing credit facilities and available cash and did not have an impact on the Company’s ability to meet other operating, investing and financing needs. Acquisitions in fiscal year 2016 mainly reflect the acquisition of publication rights for society journals. During fiscal year 2015, the Company received $1.1 million of escrow proceeds from the sale of certain consumer publishing assets in fiscal year 2013 which represented the final amounts due to the Company from the sale of those assets.
Composition spending was $37.3 million in fiscal year 2016 compared to $39.4 million in the prior year. Cash used for technology, property and equipment was $93.7 million in fiscal year 2016 compared to $69.1 million in the prior year. The increase mainly reflects incremental investment in the Company’s Enterprise Resource Planning and related systems ($18 million) and other technology infrastructure.
Cash Used for Financing Activities was $285.7 million in fiscal year 2016 compared to $61.0 million in the prior year. During fiscal year 2016, net debt repayments were $145.1 million compared to borrowings of $47.7 million in the prior year. The Company’s net debt (debt less cash and cash equivalents) decreased $51.4 million from the prior year to $241.2 million.
On March 1, 2016, the Company amended and extended its existing revolving credit agreement (“RCA”) with a syndicated bank group led by Bank of America. The previous RCA consisted of a $940 million senior revolving credit facility due on November 2, 2016. The new agreement consists of a $1.1 billion five-year senior revolving credit facility payable March 1, 2021. The proceeds of the amended facility will be used for general corporate purposes including seasonal operating cash requirements investments in technology systems and new businesses, and strategic acquisitions. Under the agreement, which can be drawn in multiple currencies, the Company has the option of borrowing at the following floating interest rates: (i) at a rate based on the London Interbank Offered Rate (“LIBOR”) plus an applicable margin ranging from 0.98% to 1.50%, depending on the Company’s consolidated leverage ratio, as defined, or (ii) for U.S. dollar-denominated loans only, at the lender’s base rate plus an applicable margin ranging from zero to 0.45%, depending on the Company’s consolidated leverage ratio. The lender’s base rate is defined as the highest of (i) the U.S. federal funds effective rate plus a 0.50% margin, (ii) the Eurocurrency rate, as defined, plus a 1.00% margin, or (iii) the Bank of America prime lending rate. In addition, the Company pays a facility fee ranging from 0.15% to 0.25% depending on the Company’s consolidated leverage ratio. The Company also has the option to request an additional credit limit increase of up to $350 million in minimum increments of $50 million, subject to the approval of the lenders. The credit agreement contains certain restrictive covenants related to the Company’s consolidated leverage ratio and interest coverage ratio, which the Company was in compliance with as of April 30, 2016. Due to the fact that there are no principal payments due until the end of the agreement in fiscal year 2021, the Company has classified its entire debt obligation related to this facility as long-term which was approximately $605.0 million as of April 30, 2016. As of April 30, 2015, the entire debt obligation related to the previous facility of approximately $750.1 was classified as long-term. As part of the amendment, the Company paid $3.4 million in debt financing costs in fiscal year 2016 which were capitalized and included in the Other Assets line item in the Consolidated Statements of Financial Position. The total notional amount of the fixed interest rate swap agreements associated with the Company’s revolving credit facility was $500.0 million as of April 30, 2016.
36
On August 6, 2015, the Company amended its December 22, 2014 364-day U.S. dollar revolving credit facility reinstated every 30 days with Santander Bank, N.A. by increasing the facility to $100 million from $50 million. The additional $50 million was drawn during August and used to repay a portion of the senior revolving credit facility. The facility was equally ranked with the Company’s previous agreement with Bank of America - Merrill Lynch and The Royal Bank of Scotland plc, and TD Bank, N.A. The facility was fully paid on April 29, 2016. This facility’s termination date was May 23, 2016 and was not renewed.
During fiscal year 2016, the Company repurchased 1,432,284 shares of common stock at an average price of $48.86 compared to 1,082,502 shares at an average price of $57.26 in the prior year. In fiscal year 2016, the Company increased its quarterly dividend to shareholders by 3% to $0.30 per share versus $0.29 per share in the prior year. Lower proceeds from the exercise of stock options mainly reflected lower stock option exercises in fiscal year 2016 compared to the prior year.
The Company’s operating cash flow is affected by the seasonality and timing of receipts from its Research journal subscriptions and its Education business. Cash receipts for calendar year Research subscription journals occur primarily from December through April. Reference is made to the Customer Credit Risk section, which follows, for a description of the impact on the Company as it relates to independent journal agents’ financial position and liquidity. Sales primarily in the U.S. higher education market tend to be concentrated in June through August, and again in November through January. Due to this seasonality, the Company normally requires increased funds for working capital from May through October.
Cash and Cash Equivalents held outside the U.S. were approximately $339 million as of April 30, 2016. The balances in equivalent U.S. dollars were comprised primarily of pound sterling ($222 million), euros ($46 million), Singapore dollars ($19 million), U.S. dollars ($18 million), Australian dollars ($14 million), and other ($20 million). Maintenance of these cash and cash equivalent balances outside the U.S. does not have a material impact on the liquidity or capital resources of the Company’s global, including U.S., operations. Cash and cash equivalent balances outside the U.S. may be subject to U.S. taxation, if repatriated. The Company intends to reinvest cash outside the U.S. except in instances where repatriating such earnings would result in no additional income tax. Accordingly, the Company has not accrued for U.S. income tax on the repatriation of non-U.S. earnings. It is not practical to determine the U.S. income tax liability that would be payable if such cash and cash equivalents were not indefinitely reinvested.
As of April 30, 2016, the Company had approximately $605 million of debt outstanding and approximately $602 million of unused borrowing capacity under its Revolving Credit and other facilities. The Company believes that its operating cash flow, together with its revolving credit facilities and other available debt financing, will be adequate to meet its operating, investing and financing needs in the foreseeable future, although there can be no assurance that continued or increased volatility in the global capital and credit markets will not impair its ability to access these markets on terms commercially acceptable. The Company does not have any off-balance-sheet debt.
37
The Company’s working capital can be negative due to the seasonality of its businesses. The primary driver of the negative working capital is unearned deferred revenue related to subscriptions for which cash has been collected in advance. Cash received in advance for subscriptions is used by the Company for a number of purposes including acquisitions; debt repayments; funding operations; dividend payments; and purchasing treasury shares. The deferred revenue will be recognized as income when the products are shipped or made available online to the customers over the term of the subscription. Current liabilities as of April 30, 2016 include $426.5 million of such deferred subscription revenue for which cash was collected in advance.
Projected capital spending for Technology, Property and Equipment and Composition for fiscal year 2017 is forecast to be approximately $115 million and $50 million, respectively. The increase in fiscal year 2017 Technology, Property and Equipment projected spending is mainly driven by investment in new enterprise resource systems to enable future operating efficiency gains and spending to transform the Company’s Hoboken headquarters to enable consolidation and productivity gains. Projected spending for author advances, which is classified as an operating activity, for fiscal year 2017 is forecast to be approximately $110 million.
FISCAL YEAR 2015 SUMMARY RESULTS
Revenue:
Revenue for fiscal year 2015 increased 3% to $1,822.4 million, or 4% excluding the unfavorable impact of foreign exchange. The increase mainly reflects incremental revenue from the recent acquisitions of CrossKnowledge Group, Ltd. (“CrossKnowledge”) ($42 million) and Profiles International (“Profiles”) ($21 million), growth in Education custom products and workflow solutions ($12 million), Education Services (Deltak) ($11 million), the sale of an individually large journal backfile license ($10 million), journal subscriptions ($7 million), funded access revenue ($5 million), growth in online test preparation ($3 million) and other ($9 million), mainly the licensing of research publication content, partially offset by lower print book revenue in all three businesses ($46 million).
Cost of Sales and Gross Profit:
Cost of sales for fiscal year 2015 decreased 1% to $499.7 million, but was flat excluding the favorable impact of foreign exchange. Cost savings from outsourcing and procurement initiatives ($10 million), lower print volume ($5 million) and lower cost digital products ($5 million) were partially offset by incremental costs from acquisitions ($8 million), higher royalty rates on society owned journals ($5 million), Education Services (Deltak) program growth ($3 million) and higher journal subscription volume ($3 million).
Gross profit for fiscal year 2015 of 72.6% was 120 basis points higher than prior year due to cost savings from outsourcing and procurement initiatives and growth in digital products (90 basis points) and incremental revenue from higher margin acquisitions (60 basis points), partially offset by higher royalty rates on society owned journals (30 basis points).
Operating and Administrative Expenses:
Operating and administrative expenses for fiscal year 2015 increased 4% to $1,005.0 million, or 5% excluding the favorable impact of foreign exchange. The increase was mainly driven by incremental operating and administrative expenses from acquisitions ($54 million), higher technology costs related to investments in internal systems and digital platforms ($18 million) including continued development costs related to the Company’s new global Enterprise Resource Planning (“ERP”) system ($6 million), Education Services (Deltak) program growth ($16 million), other employment costs, principally merit ($3 million); the expiration of a real estate tax incentive related to the Hoboken headquarters ($3 million) and higher editorial costs in Research to support business growth ($2 million), partially offset by restructuring and other cost savings ($39 million) and lower accrued incentive compensation ($12 million).
38
Restructuring Charges:
In fiscal year 2013, the Company initiated a program (the “Restructuring and Reinvestment Program”) to restructure and realign its cost base with current and anticipated future market conditions. The Company is targeting a majority of the cost savings achieved to improve margins and earnings, while the remainder will be reinvested in high growth digital business opportunities.
In fiscal years 2015 and 2014, the Company recorded pre-tax restructuring charges of $28.8 million ($0.34 per share) and $42.7 million ($0.48 per share), respectively, related to this program. These charges are summarized in the following table (in thousands):
|
Total Charges
|
|||||
|
2015
|
2014
|
Incurred to Date
|
|||
|
Charges by Segment:
|
|||||
|
Research
|
$4,555
|
$7,774
|
$15,225
|
||
|
Professional Development
|
4,385
|
11,860
|
22,529
|
||
|
Education
|
1,571
|
891
|
3,580
|
||
|
Shared Services
|
18,293
|
22,197
|
54,644
|
||
|
Total Restructuring Charges
|
$28,804
|
$42,722
|
$95,978
|
||
|
Charges by Activity:
|
|||||
|
Severance
|
$17,093
|
$25,962
|
$62,761
|
||
|
Process reengineering consulting
|
301
|
8,556
|
11,475
|
||
|
Other activities
|
11,410
|
8,204
|
21,742
|
||
|
Total Restructuring Charges
|
$28,804
|
$42,722
|
$95,978
|
Other Activities mainly reflect lease and other contract termination costs. The cumulative charge recorded to-date related to the Restructuring and Reinvestment Program of $96.0 million is expected to be fully recovered by April 30, 2016.
Impairment Charges:
In fiscal year 2014, the Company terminated a multi-year software development program for an internal operations application due to a change in the Company’s longer-term enterprise systems plans. As a result, the Company recorded an asset impairment charge for previously capitalized software costs related to the program of $4.8 million ($0.06 per share).
Amortization of Intangibles:
Amortization of intangibles increased $6.5 million to $51.2 million in fiscal year 2015 and was mainly driven by Talent Solutions acquisitions in Professional Development.
Interest Expense/Income, Foreign Exchange and Other:
Interest expense for fiscal year 2015 increased $3.2 million to $17.1 million. The increase was driven by higher interest rates and higher average debt due to acquisition financing. The Company’s average cost of borrowing in fiscal years 2015 and 2014 was 1.9% and 1.8%, respectively. In fiscal year 2015, the Company recognized foreign exchange transaction gains of $1.7 million mainly related to U.S. dollar intercompany receivables in the U.K. and Germany.
39
Provision for Income Taxes:
The effective tax rate for fiscal year 2015 was 21.6% compared to 17.9% in the prior year. In the fourth quarter of fiscal year 2015, the Company recognized a non-recurring tax benefit of $3.1 million related to tax deductions claimed on the write up of certain foreign tax assets to fair market value. During fiscal year 2014, the Company recorded non-cash deferred tax benefits of $10.6 million ($0.18 per share), principally associated with new tax legislation enacted in the United Kingdom (“U.K”) that reduced the U.K. statutory income tax rates by 3%. The benefits reflect the measurement of all applicable U.K. deferred tax balances to the new income tax rates of 21% effective April 1, 2014 and 20% effective April 1, 2015. Excluding the impact of the tax benefits described above, the Company’s effective tax rate decreased from 23.3% to 22.9% principally due to higher non-U.S. tax benefits and lower U.K. income tax rates, partially offset by lower net tax reserve releases of $2.0 million.
Earnings Per Share:
Earnings per diluted share for fiscal year 2015 increased 10% to $2.97 per share. Excluding the impact of the fiscal year 2015 ($0.34 per share) and the fiscal year 2014 ($0.48 per share) restructuring charges, the prior year asset impairment charges ($0.06 per share), fiscal year 2015 ($0.05 per share) and fiscal year 2014 ($0.18 per share) non-recurring tax benefits and the unfavorable impact of foreign exchange ($0.11 per share), earnings per diluted share increased 7%. The growth was mainly driven by company-wide restructuring and other cost savings, higher margin digital revenue and lower accrued incentive compensation, partially offset by the dilutive impacts of investments in CrossKnowledge and Education Services (Deltak) and costs incurred for the development of internal systems and digital platforms.
FISCAL YEAR 2015 SEGMENT RESULTS:
As part of Wiley’s Restructuring and Reinvestment Program, during the first quarter of fiscal year 2015, the Company consolidated certain decentralized business functions (Content Management, Vendor Procurement Services, Marketing Services, etc.) into Shared Service and Administrative functions. These newly centralized service groups are part of the Company’s plan to reduce costs through efficiencies gained from standardized technology and centralized management. The costs of these functions were previously reported as direct operating expenses in each business segment but are now reported within the shared service functions. Prior year amounts have been restated to reflect the same reporting methodology. The Company uses occupied square footage of space; number of employees; units shipped; specific identification/activity-based; gross profit; revenue and number of invoices to allocate shared service costs to each business segment.
40
|
% change
|
||||
|
RESEARCH:
|
2015
|
2014
|
% change
|
w/o FX (a)
|
|
Revenue:
|
||||
|
Journal Revenue:
|
||||
|
Journal Subscriptions
|
$672,218
|
$675,266
|
0%
|
1%
|
|
Author-Funded Access
|
22,388
|
17,673
|
27%
|
29%
|
|
Licensing, Reprints, Backfiles, and Other
|
188,326
|
177,255
|
6%
|
9%
|
|
Total Journal Revenue
|
882,932
|
870,194
|
1%
|
3%
|
|
Books and References:
|
||||
|
Print Books
|
99,746
|
112,386
|
-11%
|
-10%
|
|
Digital Books
|
42,512
|
45,934
|
-7%
|
-5%
|
|
Licensing and Other
|
15,605
|
15,835
|
-1%
|
2%
|
|
Total Books and References Revenue
|
157,863
|
174,155
|
-9%
|
-7%
|
|
|
|
|
|
|
|
Total Revenue
|
$1,040,795
|
$1,044,349
|
0%
|
2%
|
|
Cost of Sales
|
(275,487)
|
(280,794)
|
-2%
|
-1%
|
|
Gross Profit
|
$765,308
|
$763,555
|
0%
|
2%
|
|
Gross Profit Margin
|
73.5%
|
73.1%
|
||
|
Direct Expenses
|
(245,278)
|
(248,404)
|
-1%
|
1%
|
|
Amortization of Intangibles
|
(28,190)
|
(28,188)
|
0%
|
0%
|
|
Restructuring Charges (see Note 6)
|
(4,555)
|
(7,774)
|
|
|
|
Direct Contribution to Profit
|
$487,285
|
$479,189
|
2%
|
3%
|
|
Direct Contribution Margin
|
46.8%
|
45.9%
|
||
|
Shared Services and Administrative Costs:
|
||||
|
Distribution and Operation Services
|
(44,620)
|
(45,773)
|
-3%
|
-1%
|
|
Technology and Content Management
|
(96,486)
|
(99,929)
|
-3%
|
-3%
|
|
Occupancy and Other
|
(30,405)
|
(28,491)
|
7%
|
9%
|
|
Contribution to Profit
|
$315,774
|
$304,996
|
4%
|
5%
|
|
Contribution Margin
|
30.3%
|
29.2%
|
||
(a) Adjusted to exclude the fiscal year 2015 and 2014 Restructuring Charges
Revenue:
Research revenue for fiscal year 2015 of $1,040.8 million was flat with the prior year, but increased 2% excluding the unfavorable impact of foreign exchange. The increase was driven by Journal Subscriptions; Licensing, Reprints, Backfiles and Other Journal revenue; and Author-Funded Access, partially offset by declines in Print and Digital Books. Journal Subscription revenue growth was driven by new subscriptions ($4 million), new titles ($2 million) and publication timing ($1 million). As of April 30, 2015, calendar year 2015 journal subscription renewals were up approximately 1% over calendar year 2014 on a constant currency basis with approximately 97% of targeted business closed. Growth in Licensing, Reprints, Backfiles, and Other was mainly driven by the sale of an individually large journal backfile license ($10 million) and journal content rights ($6 million).
41
Author-Funded Access revenue, which represents article publication fees that provide for free access to author articles, grew $4.7 million in fiscal year 2015 due to a higher volume of articles published by the Company. Print Books declined 10% to $99.7 million and Digital Books declined 5% to $42.5 million excluding the unfavorable impact of foreign exchange.
Revenue by Region is as follows:
|
% of
|
% change
|
|||
|
2015
|
2014
|
Revenue
|
w/o FX
|
|
|
Revenue by Region:
|
||||
|
Americas
|
$398,573
|
$408,001
|
38%
|
-2%
|
|
EMEA
|
585,693
|
578,099
|
56%
|
4%
|
|
Asia-Pacific
|
56,529
|
58,249
|
6%
|
3%
|
|
Total Revenue
|
$1,040,795
|
$1,044,349
|
100%
|
1%
|
Cost of Sales:
Cost of Sales for fiscal year 2015 decreased 2% to $275.5 million, or 1% excluding the favorable impact of foreign exchange. The decrease reflects cost savings from outsourcing and procurement initiatives and lower cost digital products ($10 million), partially offset by higher royalty rates on society owned journals ($5 million) and higher journal volume ($3 million).
Gross Profit:
Gross Profit Margin for fiscal year 2015 of 73.5% was 40 basis points higher than prior year mainly due to cost savings from outsourcing and procurement initiatives and growth in digital products (110 basis points), including the sale of an individually large digital journal backfile license, partially offset by higher royalty rates on society owned journals (70 basis points).
Direct Expenses and Amortization:
Direct Expenses for fiscal year 2015 of $245.3 million decreased 1% from the prior year, but increased 1% excluding the favorable impact of foreign exchange. The increase was mainly driven by higher editorial costs to support business growth ($3 million) and higher employment costs ($3 million), partially offset by lower accrued incentive compensation ($3 million). Amortization of Intangibles in fiscal year 2015 of $28.2 million was flat with the prior year.
Contribution to Profit:
Contribution to Profit for fiscal year 2015 increased 4% to $315.8 million, or 5% excluding the current and prior year Restructuring Charges and the unfavorable impact of foreign exchange. Revenue growth and cost savings from outsourcing and procurement initiatives were partially offset by higher royalty rates on society owned journals and higher employment costs. Contribution Margin increased 110 basis points to 30.3% in fiscal year 2015 mainly due to cost savings from outsourcing and procurement initiatives and growth in digital products, partially offset by higher royalty rates on society owned journals.
Society Partnerships
|
·
|
9 new society journals were signed with combined annual revenue of approximately $5 million
|
|
·
|
45 renewals/extensions were signed with approximately $30 million in combined annual revenue
|
|
·
|
14 journals were not renewed with combined annual revenue of approximately $9 million
|
42
Journal Impact Index
In July 2014, the Company announced a continued increase in the number of its journal titles indexed in the Thomson Reuters® 2013 Journal Citation Reports (JCR). A total of 1,202 Wiley titles were indexed, up from 1,193 in the previous year report. 27 Wiley journals achieved the top category rank, up from 25 in the previous year. The Thomson Reuters index is an important barometer of journal influence and impact.
|
% change
|
||||
|
PROFFESIONAL DEVELOPMENT (PD):
|
2015
|
2014
|
% change
|
w/o FX (a)
|
|
Revenue:
|
||||
|
Knowledge Services:
|
||||
|
Print Books
|
$206,086
|
$229,199
|
-10%
|
-9%
|
|
Digital Books
|
49,672
|
53,764
|
-8%
|
-7%
|
|
Online Test Preparation and Certification
|
22,119
|
17,975
|
23%
|
23%
|
|
Other Knowledge Service Revenue
|
30,094
|
29,884
|
1%
|
1%
|
|
307,971
|
330,822
|
-7%
|
-6%
|
|
|
Talent Solutions:
|
||||
|
Assessment
|
$57,035
|
$33,047
|
73%
|
73%
|
|
Corporate Learning
|
42,017
|
-
|
-
|
|
|
99,052
|
33,047
|
200%
|
200%
|
|
|
Total Revenue
|
$407,023
|
$363,869
|
12%
|
13%
|
|
Cost of Sales
|
(114,014)
|
(111,911)
|
2%
|
3%
|
|
Gross Profit
|
$293,009
|
$251,958
|
16%
|
17%
|
|
Gross Profit Margin
|
72.0%
|
69.2%
|
||
|
Direct Expenses
|
(131,969)
|
(102,706)
|
28%
|
29%
|
|
Amortization of Intangibles
|
(13,498)
|
(6,965)
|
94%
|
94%
|
|
Restructuring Charges (see Note 6)
|
(4,385)
|
(11,860)
|
||
|
Direct Contribution to Profit
|
$143,157
|
$130,427
|
10%
|
8%
|
|
Direct Contribution Margin
|
35.2%
|
35.8%
|
||
|
Shared Services and Administrative Costs:
|
||||
|
Distribution and Operation Services
|
(30,838)
|
(37,673)
|
-18%
|
-17%
|
|
Technology and Content Management
|
(48,002)
|
(50,426)
|
-5%
|
-5%
|
|
Occupancy and Other
|
(26,180)
|
(19,712)
|
33%
|
33%
|
|
Contribution to Profit
|
$38,137
|
$22,616
|
69%
|
47%
|
|
Contribution Margin
|
9.4%
|
6.2%
|
||
(a) Adjusted to exclude the fiscal year 2015 and 2014 Restructuring Charges
Revenue:
PD revenue for fiscal year 2015 increased 12% to $407.0 million, or 13% excluding the unfavorable impact of foreign exchange. Revenue includes incremental revenue from the Talent Solutions acquisitions of CrossKnowledge ($42 million) and Profiles ($21 million). Excluding revenue from both acquisitions, revenue decreased 6% on a currency neutral basis as declines in Book sales, exceeded growth in Online Test Preparation and Certification and other Assessment revenue. The decline in Book revenue was mainly driven by slow demand for backlist titles through retail and wholesale accounts and strategically planned reductions in front list titles. Growth in Online Test Preparation and Certification reflects the addition of new products, mainly test preparation for the CFA and CMA exams, to the ELS Excel platform. Growth in Assessment revenue excluding the acquisitions was approximately $3.0 million and driven by new Inscape assessment products and other growth in Workplace Learning Solutions products. Other Knowledge Services revenue, which includes the sale of licensing rights, subscription revenue and advertising and agency revenue, increased 1% to $30.1 million due to growth in licensing revenue.
43
Revenue by Region is as follows:
|
% of
|
% change
|
|||
|
2015
|
2014
|
Revenue
|
w/o FX
|
|
|
Revenue by Region:
|
||||
|
Americas
|
$288,882
|
$285,376
|
71%
|
2%
|
|
EMEA
|
95,613
|
54,240
|
23%
|
78%
|
|
Asia-Pacific
|
22,528
|
24,253
|
6%
|
-4%
|
|
Total Revenue
|
$407,023
|
$363,869
|
100%
|
13%
|
Cost of Sales:
Cost of Sales for fiscal year 2015 increased 2% or 3% excluding the favorable impact of foreign exchange to $114.0 million. The increase was mainly driven by costs from new acquisitions ($8 million), partially offset by lower Print Book volume ($5 million).
Gross Profit:
Gross Profit Margin increased from 69.2% to 72.0% in fiscal year 2015. The improvement was mainly driven by higher margin incremental revenue from the CrossKnowledge (150 basis points) and Profiles (140 basis points) acquisitions.
Direct Expenses and Amortization:
Direct Expenses for fiscal year 2015 increased 28% to $132.0 million, or 29% excluding the favorable impact of foreign exchange. The increase was driven by incremental operating expenses from Talent Solutions acquisitions ($40 million) and content development costs for new assessment products ($1 million), partially offset by restructuring and other cost savings ($12 million). Amortization of Intangibles increased $6.5 million in fiscal year 2015 principally due to the Talent Solutions acquisitions of CrossKnowledge and Profiles.
Contribution to Profit:
Contribution to Profit increased 69% to $38.1 million in fiscal year 2015, or 47% on a currency neutral basis and excluding the current and prior year Restructuring Charges. The improvement was mainly driven by restructuring and other cost savings, partially offset by lower Book revenue and the dilutive impact of the CrossKnowledge acquisition. Contribution Margin increased from 6.2% to 9.4% in fiscal year 2015, or 120 basis points on a currency neutral basis and excluding the Restructuring Charges. The increase was mainly driven by restructuring and other cost savings, partially offset by the dilutive impact of the CrossKnowledge acquisition.
Acquisitions
|
·
|
On April 1, 2014, the Company acquired Profiles International (“Profiles”) for approximately $48 million in cash, net of cash acquired. Profiles provides pre-employment assessment and selection tools that enable employers to optimize candidate selections and develop the full potential of their employees. Solutions include pre-hire assessments, including those designed to measure and match personality, knowledge, skills, managerial fit, loyalty, and values; and post-hire assessments, focused on measuring sales and managerial effectiveness, employee performance and career potential. Profiles serves approximately 4,000 corporate clients and millions of end users in over 120 countries, with assessments available in 32 languages. Profiles revenue and operating income for fiscal year 2015 was $23.3 million and $1.0 million, respectively.
|
44
|
·
|
On May 1, 2014, the Company acquired CrossKnowledge Group Limited (“CrossKnowledge”) for approximately $166 million in cash, net of cash acquired. CrossKnowledge is a learning solutions provider focused on leadership and managerial skills development that offers subscription-based, digital learning solutions for global corporations, universities, and small and medium-sized enterprises. CrossKnowledge’s solutions include a variety of managerial and leadership skills assessments, courses, certifications, content and executive training programs that are delivered on a cloud-based LMS platform with over 19,000 learning objects in 17 languages. CrossKnowledge serves over seven million end-users in 80 countries. For the fiscal year ended April 30, 2015, CrossKnowledge’s revenue and operating loss included in Wiley’s results was $42.0 million and $5.1 million, respectively, including $4.6 million of acquisition amortization.
|
Collaborations and Alliances
|
·
|
CrossKnowledge announced an agreement with Gavisus, a Scandinavian-based digital learning and talent development company. CrossKnowledge will provide Gavisus with the technology to plan, design and deliver online leadership training to clients in Norway, Sweden and Denmark.
|
|
·
|
Wiley announced a strategic collaboration with SilverCloud Health, a global provider of online behavioral and wellness solutions. The partnership, which will provide a comprehensive range of therapeutic programs across behavioral health and long-term chronic disease management, brings together Wiley’s evidence-based psychological and wellness content and SilverCloud Health’s award-winning cloud-based technology platform. The first set of programs, released in 2015, will address Generalized Anxiety Disorder and Diabetes, conditions that affect more than 40 million people in the United States on a daily basis alone.
|
|
·
|
Wiley has partnered with Chinese Cultural University to distribute the CPAexcel test preparation platform in China.
|
|
·
|
The Institute of Management Accountants announced a partnership agreement in India with Wiley to offer Wiley’s Certified Management Accountant Exam (CMA) Learning System as part of a full offering that includes live training from Miles Professional Education, a major professional certification course provider in India.
|
45
|
% change
|
||||
|
EDUCATION:
|
2015
|
2014
|
% change
|
w/o FX (a)
|
|
Revenue:
|
||||
|
Books:
|
||||
|
Print Textbooks
|
$144,500
|
$163,152
|
-11%
|
-9%
|
|
Digital Books
|
34,086
|
30,137
|
13%
|
15%
|
|
178,586
|
193,289
|
-8%
|
-6%
|
|
|
Custom Materials
|
50,659
|
43,556
|
16%
|
16%
|
|
Course Workflow Solutions (WileyPLUS)
|
54,200
|
49,459
|
10%
|
11%
|
|
Online Program Management (Deltak)
|
81,593
|
70,179
|
16%
|
16%
|
|
Other Education Revenue
|
9,584
|
10,494
|
-9%
|
-9%
|
|
Total Revenue
|
$374,622
|
$366,977
|
2%
|
3%
|
|
Cost of Sales
|
(110,182)
|
(114,174)
|
-3%
|
-2%
|
|
Gross Profit
|
$264,440
|
$252,803
|
5%
|
6%
|
|
Gross Profit Margin
|
70.6%
|
68.9%
|
||
|
Direct Expenses
|
(125,613)
|
(118,240)
|
6%
|
7%
|
|
Amortization of Intangibles
|
(9,527)
|
(9,527)
|
0%
|
0%
|
|
Restructuring Charges (see Note 6)
|
(1,571)
|
(891)
|
||
|
Direct Contribution to Profit
|
$127,729
|
$124,145
|
3%
|
4%
|
|
Direct Contribution Margin
|
34.1%
|
33.8%
|
||
|
Shared Services and Administrative Costs:
|
||||
|
Distribution and Operation Services
|
(12,863)
|
(15,685)
|
-18%
|
-16%
|
|
Technology and Content Management
|
(54,272)
|
(48,097)
|
13%
|
13%
|
|
Occupancy and Other
|
(13,950)
|
(11,769)
|
19%
|
19%
|
|
Contribution to Profit
|
$46,644
|
$48,594
|
-4%
|
0%
|
|
Contribution Margin
|
12.5%
|
13.2%
|
||
|
(a)
|
Adjusted to exclude the fiscal year 2015 and 2014 Restructuring Charges
|
Revenue:
Education revenue for fiscal year 2015 increased 2% to $374.6 million, or 3% excluding the unfavorable impact of foreign exchange. The growth was mainly driven by Online Program Management (Deltak), Custom Materials, Course Workflow Solutions (WileyPLUS) and Digital Books, partially offset by a decline in Print Textbooks. WileyPLUS revenue, which is earned ratably over the school semester, grew 10% in fiscal year 2015. Unearned deferred WileyPLUS revenue as of April 30, 2015 was $3.8 million. The decline in Print Textbooks reflects student’s preference for Digital Books and Custom Products, a decline in for-profit enrollments and impact from rental book programs.
Online Program Management (Deltak) accounted for 22% of total Education revenue in fiscal year 2015 compared to 19% in the prior year. During the fiscal year, Wiley added 27 net programs and signed the University of Birmingham (UK), Manhattan College (US), University College Cork (Ireland), University of Delaware (US), and the largest partnership to-date, a university-wide agreement with one of America’s most prestigious institutions. As of April 30, 2015, Deltak had 38 partners and 200 degree programs under contract.
46
Revenue by Region is as follows:
|
|
% of
|
% change
|
||
|
2015
|
2014
|
Revenue
|
w/o FX
|
|
|
Revenue by Region:
|
||||
|
Americas
|
$300,174
|
$288,329
|
80%
|
5%
|
|
EMEA
|
19,265
|
19,334
|
5%
|
0%
|
|
Asia-Pacific
|
55,183
|
59,314
|
15%
|
-2%
|
|
Total Revenue
|
$374,622
|
$366,977
|
100%
|
3%
|
Cost of Sales
Cost of Sales for fiscal year 2015 decreased 3% to $110.2 million, or 2% excluding the favorable impact of foreign exchange. The decrease was mainly driven by lower composition costs from lower cost digital products ($3 million), lower royalty costs due to product mix ($2 million) and lower inventory obsolescence provisions ($1 million), partially offset by higher student recruitment costs in Online Program Management (Deltak) due to growth in new partners and programs ($3 million).
Gross Profit:
Gross Profit Margin for fiscal year 2015 improved 170 basis points to 70.6% principally due to lower composition costs from lower cost digital products (70 basis points), lower royalty costs due to product mix (60 basis points) and lower inventory obsolescence provisions (40 basis points).
Direct Expenses and Amortization:
Direct Expenses increased 6% to $125.6 million, or 7% excluding the favorable impact of foreign exchange. The increase was mainly driven by costs associated with growth in Online Program Management (Deltak) partner programs ($12 million), partially offset by restructuring and other cost savings ($2 million), lower accrued incentive compensation ($1 million) and lower editorial costs due to a reduced title count ($1 million). Amortization of Intangibles was $9.5 million in fiscal years 2015 and 2014.
Contribution to Profit:
Contribution to Profit for fiscal year 2015 decreased 4% to $46.6 million, but was flat on a currency neutral basis and excluding the current and prior year Restructuring Charges. Digital revenue growth and cost savings initiatives were partially offset by continued investment in Online Program Management (Deltak) programs. Contribution Margin decreased 70 basis points to 12.5% in fiscal year 2015, or 40 basis points on a currency neutral basis and excluding the Restructuring Charges. The decline was mainly driven by continued investment in Online Program Management (Deltak) program development, partially offset by higher gross profit margins and restructuring and other cost savings.
47
SHARED SERVICES AND ADMINISTRATIVE COSTS:
The following table reflects total shared services and administrative costs by function, which are included in the Operating and Administrative Expenses line item in the Consolidated Statements of Income. A portion of these costs are allocated to each segment above based on allocation methodologies described in Note 20.
|
% Change
|
||||
|
Dollars in thousands
|
2015
|
2014
|
% Change
|
w/o FX (a)
|
|
Distribution and Operation Services
|
$89,024
|
$100,310
|
-11%
|
-10%
|
|
Technology and Content Management
|
244,850
|
240,797
|
2%
|
2%
|
|
Finance
|
52,796
|
54,191
|
-3%
|
-1%
|
|
Other Administration
|
115,469
|
104,807
|
10%
|
12%
|
|
Restructuring Charges (see Note 6)
|
18,293
|
22,197
|
-
|
-
|
|
Impairment Charges (see Note 7)
|
-
|
4,786
|
-
|
-
|
|
Total
|
$520,432
|
$527,088
|
-1%
|
1%
|
(a) Adjusted to exclude the fiscal year 2015 and 2014 Restructuring and fiscal year 2014 Impairment Charges
Shared Services and Administrative Costs for fiscal year 2015 decreased 1% to $520.4 million, but increased 1% on a currency neutral basis and excluding the current and prior year Restructuring Charges and prior year Asset Impairment Charges.
Distribution and Operation Services costs decreased mainly due to the outsourcing of certain warehousing ($8 million), lower print volume ($1 million) and lower accrued incentive compensation ($1 million). Technology and Content Management costs increased mainly due to investments in digital platforms and internal systems ($20 million), including approximately $6 million for the continued investment in the Company’s Enterprise Resource Planning System, incremental costs from Talent Solutions acquisitions ($7 million) and investments in new Online Program Management (Deltak) partners and programs ($2 million), partially offset by Content Management restructuring and other cost savings ($18 million) and lower accrued incentive compensation ($4 million). Finance costs decreased mainly due to lower employment costs ($4 million), partially offset by incremental costs from acquisitions ($3 million). Other Administration costs increased mainly due to incremental costs from the CrossKnowledge acquisition ($5 million) and the expiration of a real estate tax incentive related to the Company’s Hoboken headquarters ($3 million).
LIQUIDITY AND CAPITAL RESOURCES:
The Company’s Cash and Cash Equivalents balance was $457.4 million at the end of fiscal year 2015, compared with $486.4 million a year earlier. Cash Provided by Operating Activities in fiscal year 2015 increased $6.9 million to $355.1 million principally due to lower income tax payments ($18 million), lower income tax deposits paid to German tax authorities ($7 million), lower employee retirement plan contributions ($6 million) and lower royalty advance payments ($5 million), partially offset by higher annual incentive compensation payments ($20 million), higher payments related to the Company’s restructuring programs ($4 million) and other working capital changes mainly due to timing.
Cash Used for Investing Activities in fiscal year 2015 was $279.7 million compared to $149.3 million in the prior year. Fiscal year 2015 includes the acquisition of CrossKnowledge for approximately $166 million in cash, net of cash acquired, while fiscal year 2014 includes the acquisition of Profiles for approximately $48 million, net of cash acquired. The acquisitions were funded through the use of the existing credit facility and available cash and did not have an impact on the Company’s ability to meet other operating, investing and financing needs. During fiscal years 2015 and 2014, the Company received $1.1 million and $3.3 million of escrow proceeds, respectively, from the sale of certain consumer publishing assets in fiscal year 2013 which represented the final amounts due to the Company from the sale of those assets.
48
Composition spending was $39.4 million in fiscal year 2015 compared to $40.6 million in the prior year. The decrease reflects lower spending in Education and Research due to cost reduction efficiencies and lower planned title volume. Cash used for technology, property and equipment was $69.1 million in fiscal year 2015 compared to $57.6 million in the prior year. The increase mainly reflects Deltak curriculum development costs due to growth in new partners and programs ($5 million), incremental capital spending for CrossKnowledge ($4 million), and capital spending on new leased facilities ($2 million).
Cash Used for Financing Activities was $61.0 million in fiscal year 2015 as compared to $53.5 million in the prior year. The Company’s net debt (debt less cash and cash equivalents) increased $78.9 million from the prior year principally to fund the CrossKnowledge acquisition ($166 million). During fiscal year 2015, net debt borrowings were $47.7 million compared to $27.1 million in the prior year. The total notional amount of the interest rate swap agreements associated with the Company’s revolving credit facilities was $300 million as of April 30, 2015.
To take advantage of more favorable interest rates available in the current market, on December 22, 2014, the Company entered into a $50 million 364-day U.S. dollar revolving credit facility reinstated every 30 days with Santander Bank, N.A. which is equally ranked with the Company’s existing agreement with Bank of America - Merrill Lynch and The Royal Bank of Scotland plc, and TD Bank, N.A.. The facility was fully drawn as of April 30, 2015. The borrowing rate is LIBOR plus a margin of 1.00%. The proceeds of the revolving credit facility were used to pay a portion of the Company’s existing revolving credit facilities and meet seasonal operating cash requirements.
On October 31, 2014, the Company entered into a U.S. dollar facility with TD Bank, N.A. which is equally ranked with the Company’s existing agreement with Bank of America - Merrill Lynch and The Royal Bank of Scotland plc, and Santander Bank. The new agreement consists of a $50 million 364-day revolving credit facility. The facility was fully drawn as of April 30, 2015. The borrowing rate is LIBOR plus an applicable margin ranging from 0.80% to 1.40%, and a facility fee will be due on any undrawn amounts ranging from 0.125% to 0.30%, both depending on the Company consolidated leverage ratio, as defined. The credit agreement contains certain restrictive covenants related to the Company’s consolidated leverage ratio and interest coverage ratio, which the Company was in compliance with as of April 30, 2015. The proceeds of the new revolving credit facility were used to pay a portion of the Company’s existing revolving credit facility and meet seasonal operating cash requirements.
During fiscal year 2015, the Company repurchased 1,082,502 shares of common stock at an average price of $57.26 compared to 1,248,030 shares at an average price of $50.79 in the prior year. In fiscal year 2015, the Company increased its quarterly dividend to shareholders by 16% to $0.29 per share versus $0.25 per share in the prior year. Lower proceeds from the exercise of stock options reflect a lower volume of stock option exercises in fiscal year 2015 compared to the prior year.
The Company’s operating cash flow is affected by the seasonality and timing of receipts from its Research journal subscriptions and its Education business. Cash receipts for calendar year Research subscription journals occur primarily from December through April. Reference is made to the Customer Credit Risk section, which follows, for a description of the impact on the Company as it relates to independent journal agents’ financial position and liquidity. Sales primarily in the U.S. higher education market tend to be concentrated in June through August, and again in November through January. Due to this seasonality, the Company normally requires increased funds for working capital from May through October.
49
Cash and Cash Equivalents held outside the U.S. were approximately $411.6 million as of April 30, 2015. The balances in equivalent U.S. dollars were comprised primarily of pound sterling ($256 million), euros ($73 million), Australian dollars ($45 million), Singapore dollars ($34 million) and other ($4 million). Maintenance of these cash and cash equivalent balances outside the U.S. does not have a material impact on the liquidity or capital resources of the Company’s global, including U.S., operations. Cash and cash equivalent balances outside the U.S. may be subject to U.S. taxation, if repatriated. The Company intends to reinvest cash outside the U.S. except in instances where repatriating such earnings would result in no additional income tax. Accordingly, the Company has not accrued for U.S. income tax on the repatriation of non-U.S. earnings. It is not practical to determine the U.S. income tax liability that would be payable if such cash and cash equivalents were not indefinitely reinvested.
As of April 30, 2015, the Company had approximately $750.1 million of debt outstanding and approximately $302.9 million of unused borrowing capacity under its Revolving Credit and other facilities. The Company believes that its operating cash flow, together with its revolving credit facilities and other available debt financing, will be adequate to meet its operating, investing and financing needs in the foreseeable future, although there can be no assurance that continued or increased volatility in the global capital and credit markets will not impair its ability to access these markets on terms commercially acceptable. The Company does not have any off-balance-sheet debt.
The Company’s working capital can be negative due to the seasonality of its businesses. The primary driver of the negative working capital is unearned deferred revenue related to subscriptions for which cash has been collected in advance. Cash received in advance for subscriptions is used by the Company for a number of purposes including acquisitions; debt repayments; funding operations; dividend payments; and purchasing treasury shares. The deferred revenue will be recognized as income when the products are shipped or made available online to the customers over the term of the subscription. Current liabilities as of April 30, 2015 include $372.1 million of such deferred subscription revenue for which cash was collected in advance.
CRITICAL ACCOUNTING POLICIES AND ESTIMATES:
The preparation of the Company’s financial statements in conformity with accounting principles generally accepted in the U.S. requires management to make estimates and assumptions that affect the reported amount of assets and liabilities, disclosure of contingent assets and liabilities as of the date of the financial statements, and reported amounts of revenue and expenses during the reporting period. Management continually evaluates the basis for its estimates. Actual results could differ from those estimates, which could affect the reported results. Note 2 of the “Notes to Consolidated Financial Statements” includes a summary of the significant accounting policies and methods used in preparation of our Consolidated Financial Statements. Set forth below is a discussion of the Company’s more critical accounting policies and methods.
Revenue Recognition: The Company recognizes revenue when the following criteria are met: persuasive evidence that an arrangement exists; delivery has occurred or services have been rendered; the price to the customer is fixed or determinable; and collectability is reasonably assured. If all of the above criteria have been met, revenue is recognized upon shipment of products or when services have been rendered. Revenue related to journal subscriptions and other products and services that are generally collected in advance are deferred and recognized as earned over the term of the subscription; when the related issue is shipped; made available online; or the service is rendered, in accordance with contractual terms. Collectability is evaluated based on the amount involved, the credit history of the customer, and the status of the customer’s account with the Company.
50
The Company transitioned from issue-based to time-based digital journal subscription agreements for calendar year 2016. Under this new contractual agreement, the Company provides access to all journal content published within a calendar year and recognizes revenue on a straight-line basis over the calendar year. Under the Company’s previous licensing model, a customer subscribed to a discrete number of online journal issues and revenue was recognized as each issue was made available online. The Company made these changes to simplify the contracting and administration of digital journal subscriptions.
When a product is sold with multiple deliverables, the Company accounts for each deliverable within the arrangement as a separate unit of accounting due to the fact that each deliverable is also sold on a stand-alone basis. The total consideration of a multiple-element arrangement is allocated to each unit of accounting based on the price charged by the Company when it is sold separately. The Company’s multiple deliverable arrangements principally include WileyPLUS, the online course management tool for the Company’s Education business which includes a complete print or digital textbook for the course; negotiated licenses for bundles of digital content available on Wiley Online Library, the online publishing platform for the Company’s Research business; and test preparation, assessment, certification and training services sold by the Professional Development business which can include bundles of print and digital content and online workflow solutions.
The Company enters into contracts for the resale of its content through a third party where the Company is not the primary obligor of the arrangement because it is not responsible for fulfilling the customer’s order; handling customer requests or claims and/or maintains credit risk. The Company recognizes revenue for the sale of its content, net of any commission owed to the third party seller or taxes which are remitted to government authorities.
Allowance for Doubtful Accounts: The estimated allowance for doubtful accounts is based on a review of the aging of the accounts receivable balances, historical write-off experience, credit evaluations of customers and current market conditions. A change in the evaluation of a customer’s credit could affect the estimated allowance. The allowance for doubtful accounts is shown as a reduction of Accounts Receivable in the Consolidated Statements of Financial Position and amounted to $7.3 million and $8.3 million as of April 30, 2016 and 2015, respectively.
Sales Return Reserve: The estimated allowance for sales returns is based on a review of the historical return patterns, as well as current market trends in the businesses in which we operate. Associated with the estimated sales return reserves, the Company also includes a related reduction in inventory and royalty costs as a result of the expected returns. Net print book sales return reserves amounted to $19.9 million and $25.3 million as of April 30, 2016 and 2015, respectively. The reserves are reflected in the following accounts of the Consolidated Statements of Financial Position – increase (decrease):
|
2016
|
2015
|
|
|
Accounts Receivable
|
$(29,447)
|
$(37,300)
|
|
Inventories
|
4,924
|
6,555
|
|
Accounts and Royalties Payable
|
(4,662)
|
(5,405)
|
|
Decrease in Net Assets
|
$(19,861)
|
$(25,340)
|
A one percent change in the estimated sales return rate could affect net income by approximately $2.0 million. A change in the pattern or trends in returns could affect the estimated allowance.
51
Reserve for Inventory Obsolescence: Inventories are carried at the lower of cost or market. A reserve for inventory obsolescence is estimated based on a review of damaged, obsolete, or otherwise unsalable inventory. The review encompasses historical unit sales trends by title; current market conditions, including estimates of customer demand compared to the number of units currently on hand; and publication revision cycles. A change in sales trends could affect the estimated reserve. The inventory obsolescence reserve is reported as a reduction of the Inventories balance in the Consolidated Statements of Financial Position and amounted to $22.0 million and $21.9 million as of April 30, 2016 and 2015, respectively.
Allocation of Acquisition Purchase Price to Assets Acquired and Liabilities Assumed: In connection with acquisitions, the Company allocates the cost of the acquisition to the assets acquired and the liabilities assumed based on the estimates of fair value for such items, including intangible assets and technology acquired. Such estimates include discounted estimated cash flows to be generated by those assets and the expected useful lives based on historical experience, current market trends, and synergies to be achieved from the acquisition and expected tax basis of assets acquired. The Company may use a third party valuation consultant to assist in the determination of such estimates.
Goodwill and Indefinite-lived Intangible Assets: Goodwill is the excess of the purchase price paid over the fair value of the net assets of the business acquired. Indefinite-lived intangible assets primarily consist of brands, trademarks, content and publishing rights and are typically characterized by intellectual property with a long and well-established revenue stream resulting from strong and well-established imprint/brand recognition in the market. Goodwill and indefinite-lived intangible assets are not amortized but are reviewed annually for impairment, or more frequently if events or changes in circumstances indicate the asset might be impaired. The Company evaluates the recoverability of indefinite-lived intangible assets by comparing the fair value of the intangible asset to its carrying value.
To evaluate the recoverability of goodwill, the Company primarily uses a two-step impairment test approach at the reporting unit level. In the first step, the estimated fair value of the entire reporting unit is compared to its carrying value including goodwill. If the fair value of the reporting unit is less than the carrying value, a second step is performed to determine the charge for goodwill impairment. In the second step, the Company determines an implied fair value of the reporting unit’s goodwill by determining the fair value of the individual assets and liabilities (including any previously unrecognized intangible assets) of the reporting unit other than goodwill. The resulting implied fair value of the goodwill is compared to the carrying amount and an impairment charge is recognized for the difference.
In certain circumstances, the Company uses a qualitative assessment as an alternative to the two-step test approach. Under this approach certain market, industry and financial performance factors are considered to determine whether it is more likely than not that the fair value of a reporting unit is less than its carrying amount. If that is the case, the two-step approach described above is then performed to evaluate the recoverability of goodwill.
Intangible Assets with Finite Lives and Other Long-Lived Assets: Finite-lived intangible assets principally consist of brands, trademarks, content and publication rights, customer relationships and non-compete agreements and are amortized over their estimated useful lives. The most significant factors in determining the estimated life of these intangibles is the history and longevity of the brands, trademarks and content and publication rights acquired, combined with the strength of cash flows. Content and publication rights, trademarks, customer relationships and brands with finite lives are amortized on a straight-line basis over periods ranging from 5 to 40 years. Non-compete agreements are amortized over the terms of the individual agreement, generally up to 5 years.
52
Intangible assets with finite lives are amortized on a straight line basis over the following weighted average estimated useful lives: content and publishing rights – 31 years; customer relationships – 20 years; brands and trademarks – 13 years; non-compete agreements – 4 years.
Assets with finite lives are only evaluated for impairment upon a significant change in the operating or macroeconomic environment. In these circumstances, if an evaluation of the projected undiscounted cash flows indicates impairment, the asset is written down to its estimated fair value based on the discounted future cash flows.
Share-Based Compensation: The Company recognizes share-based compensation expense based on the fair value of the share-based awards on the grant date, reduced by an estimate of future forfeited awards. As such, share-based compensation expense is only recognized for those awards that are expected to ultimately vest. The fair value of share-based awards is recognized in net income on a straight-line basis over the requisite service period. The grant date fair value for stock options is estimated using the Black-Scholes option-pricing model. The determination of the assumptions used in the Black-Scholes model requires the Company to make significant judgments and estimates, which include the expected life of an option, the expected volatility of the Company’s Common Stock over the estimated life of the option, a risk-free interest rate and the expected dividend yield. Judgment is also required in estimating the amount of share-based awards that may be forfeited. Share-based compensation expense associated with performance-based stock awards is based on actual financial results for targets established three years in advance. The cumulative effect on current and prior periods of a change in the estimated number of performance share awards, or estimated forfeiture rate, is recognized as an adjustment to earnings in the period of the revision. If actual results differ significantly from estimates, the Company’s share-based compensation expense and results of operations could be impacted.
Retirement Plans: The Company provides defined benefit pension plans for certain employees worldwide. The Company’s Board of Directors approved amendments to the U.S., Canada and U.K. defined benefit plans that froze the future accumulation of benefits effective June 30, 2013, December 31, 2015 and April 30, 2015, respectively. Under the amendments, no new employees will be permitted to enter these plans and no additional benefits for current participants for future services will be accrued after the effective dates of the amendments.
The accounting for benefit plans is highly dependent on assumptions concerning the outcome of future events and circumstances, including compensation increases, long-term return rates on pension plan assets, healthcare cost trends, discount rates and other factors. In determining such assumptions, the Company consults with outside actuaries and other advisors. The discount rates for the U.S., United Kingdom and Canadian pension plans are based on the derivation of a single-equivalent discount rate using a standard spot rate curve and the timing of expected payments as of the balance sheet date. The spot rate curve is based upon a portfolio of Moody’s-rated Aa3 (or higher) corporate bonds. The discount rates for other non-U.S. plans are based on similar published indices with durations comparable to that of each plan’s liabilities. The expected long-term rates of return on pension plan assets are estimated using market benchmarks for equities, real estate and bonds applied to each plan’s target asset allocation and are estimated by asset class including an anticipated inflation rate. The expected long-term rates are then compared to the historic investment performance of the plan assets as well as future expectations and estimated through consultation with investment advisors and actuaries. Salary growth and healthcare cost trend assumptions are based on the Company’s historical experience and future outlook. While the Company believes that the assumptions used in these calculations are reasonable, differences in actual experience or changes in assumptions could materially affect the expense and liabilities related to the defined benefit pension plans of the Company. A hypothetical one percent increase in the discount rate would impact net income and the accrued pension liability by approximately $1.5 million and $143.3 million, respectively. A one percent decrease in the discount rate would impact net income and the accrued pension liability by approximately $1.2 million and $178.6 million, respectively. A one percent change in the expected long term rate of return would affect net income by approximately $3.7 million.
53
Recently Issued Accounting Standards:
In March 2016, the FASB issued ASU 2016-09 “Compensation-Stock Compensation (Topic 718): Improvements to Employee Share-Based Payment Accounting” which simplifies the accounting for share-based payment transactions, including income taxes, classification of awards as either equity or liabilities, and classification on the statement of cash flows. The new guidance also allows an entity to make an accounting policy election to account for forfeitures when they occur or to estimate the number of awards that are expected to vest with a subsequent true up to actual forfeitures (current GAAP). The standard is effective for the company on May 1, 2017, with early adoption permitted. The Company is currently assessing the impact the new guidance will have on its consolidated financial statements.
In February 2016, the FASB issued ASU 2016-02 "Leases (Topic 842)”. ASU 2016-02 requires lessees to recognize most leases on the balance sheet which will result in an increase in reported assets and liabilities. The recognition of expenses within the income statement is consistent with the existing lease accounting standards. There are no significant changes in the new standard for lessors under operating leases. The standard is effective for the Company on May 1, 2019 with early adoption permitted. Adoption requires application of the new guidance for all periods presented. The Company is currently assessing the impact the new guidance will have on its consolidated financial statements.
In November 2015, the FASB issued ASU 2015-17 “Income Taxes- Balance Sheet Classification of Deferred Taxes”. To simplify the presentation of deferred income taxes, the amendments in this update require that all deferred tax liabilities and assets, including those previously classified as current, be classified as noncurrent in a classified statement of financial position. The amendments in this Update will align the presentation of deferred income tax assets and liabilities with IFRS. The standard is effective for the company May 1, 2017 with early adoption permitted. The Company is currently assessing the impact the new guidance will have on its consolidated financial statements.
In April 2015, the FASB issued ASU 2015-05 "Intangibles- Goodwill and Other- Internal-Use Software (Subtopic 350-40): Customer’s Accounting for Fees Paid in Cloud Computing Arrangements" (“ASU 2015-05”). Cloud computing arrangements represent the delivery of hosted services over the internet which includes software, platforms, infrastructure and other hosting arrangements. The ASU provides criteria to determine whether the cloud computing arrangement includes a software license. A software license can include customized development, maintenance, hosting and other related costs. If the criteria are met, the customer will capitalize the fee attributable to the software license portion of the arrangement as internal-use software. If the arrangement does not include a software license, it should be treated as a service contract. The standard is effective for the Company on May 1, 2016 with early adoption permitted. An entity can elect to adopt either prospectively for all arrangements entered into or materially modified after the effective date or retrospectively. The Company intends to adopt the new guidance on a prospective basis as of May 1, 2016.
54
In May 2014, the Financial Accounting Standards Board (“FASB”) issued ASU 2014-09 "Revenue from Contracts with Customers" (Topic 606) (“ASU 2014-09”), and the International Accounting Standards Board (“IASB”) published its equivalent standard, International Financial Reporting Standard (“IFRS”) 15, “Revenue from Contracts with Customers”. These joint comprehensive new revenue recognition standards will supersede most existing revenue recognition guidance and are intended to improve and converge revenue recognition and related financial reporting requirements. The standard is effective for the Company on May 1, 2018 with early adoption permitted on May 1, 2017. The standard allows for either “full retrospective” adoption, meaning the standard is applied to all periods presented, or “cumulative effect” adoption, meaning the standard is applied only to the most current period presented in the financial statements. Subsequently, the FASB issued ASU No. 2016-08, Revenue from Contracts with Customers (Topic 606) – Principal versus Agent Considerations (“ASU 2016-08”), ASU No. 2016-10, Revenue from Contracts with Customers (Topic 606) – Identifying Performance Obligations and Licensing (“ASU 2016-10”), and ASU 2016-12, Revenue from Contracts with Customers (Topic 606) – Narrow Scope Improvements and Practical Expedients (“ASU 2016-12”), which provide clarification and additional guidance related to ASU 2014-09. The Company must adopt ASU 2016-08, ASU 2016-10, and ASU 2016-12 with ASU 2014-09. The Company is currently assessing whether the adoption of the new guidance will have a significant impact on its consolidated financial statements.
Contractual Obligations and Commercial Commitments
A summary of contractual obligations and commercial commitments, excluding unrecognized tax benefits further described in Note 12, as of April 30, 2016 is as follows (in thousands):
|
Payments Due by Period
|
|||||
|
Within
|
2-3
|
4-5
|
After 5
|
||
|
Total
|
Year 1
|
Years
|
Years
|
Years
|
|
|
Total Debt
|
$605.0
|
$ -
|
$ -
|
$605.0
|
$ -
|
|
Interest on Debt1
|
50.7
|
11.6
|
20.4
|
18.7
|
-
|
|
Non-Cancelable Leases
|
328.2
|
35.2
|
47.3
|
46.4
|
199.3
|
|
Minimum Royalty Obligations
|
257.4
|
83.4
|
97.4
|
55.0
|
21.6
|
|
Other Operating Commitments
|
71.7
|
30.5
|
30.0
|
11.2
|
-
|
|
Total
|
$1,313.0
|
$160.7
|
$195.1
|
$736.3
|
$220.9
|
1 Interest on Debt includes the effect of the Company’s interest rate swap agreements and the estimated future interest payments on the Company’s unhedged variable rate debt, assuming that the interest rates as of April 30, 2016 remain constant until the maturity of the debt.
Item 7A. Quantitative and Qualitative Disclosures about Market Risk
The Company is exposed to market risk primarily related to interest rates, foreign exchange and credit risk. It is the Company’s policy to monitor these exposures and to use derivative financial investments and/or insurance contracts from time to time to reduce fluctuations in earnings and cash flows when it is deemed appropriate to do so. The Company does not use derivative financial instruments for trading or speculative purposes.
Interest Rates:
The Company had $605.0 million of variable rate loans outstanding at April 30, 2016, which approximated fair value.
On April 4, 2016, the Company entered into a forward starting interest rate swap agreement which fixed a portion of the variable interest due on a variable rate debt renewal on May 16, 2016. Under the terms of the agreement, the Company will pay a fixed rate of 0.92% and receives a variable rate of interest based on one-month LIBOR (as defined) from the counterparty which is reset every month for a three-year period starting May 16, 2016 ending May 15, 2019. As of April 30, 2016, the notional amount of the interest rate swap was $350.0 million.
55
On August 15, 2014, the Company entered into an interest rate swap agreement which fixed a portion of the variable interest due on its variable rate loans outstanding. Under the terms of the agreement, the Company pays a fixed rate of 0.65% and receives a variable rate of interest based on one-month LIBOR (as defined) from the counterparty which is reset every month for a two-year period ending August 15, 2016. As of April 30, 2016, the notional amount of the interest rate swap was $150.0 million.
It is management’s intention that the notional amount of interest rate swaps be less than the variable rate loans outstanding during the life of the derivatives. During fiscal year 2016, the Company recognized a loss on its hedge contracts of approximately $0.9 million which is reflected in Interest Expense in the Consolidated Statements of Income. At April 30, 2016, the fair value of the outstanding interest rate swaps was a deferred loss of $0.6 million. Based on the maturity dates of the contracts, approximately $0.1 million and $0.5 million of the deferred loss was recorded in Other Accrued Liabilities and Other Long-Term Liabilities, respectively. On an annual basis, a hypothetical one percent change in interest rates for the $455 million of unhedged variable rate debt as of April 30, 2016 would affect net income and cash flow by approximately $0.7 million.
Foreign Exchange Rates:
Fluctuations in the currencies of countries where the Company operates outside the U.S. may have a significant impact on financial results. The Company is primarily exposed to movements in British pound sterling, euros, Canadian and Australian dollars, and certain currencies in Asia. The Statements of Financial Position of non-U.S. business units are translated into U.S. dollars using period-end exchange rates for assets and liabilities and weighted-average exchange rates for revenues and expenses. The percentage of Consolidated Revenue for fiscal year 2016 recognized in the following currencies (on an equivalent U.S. dollar basis) were: approximately 57% U.S dollar; 28% British pound sterling; 8% euro and 7% other currencies.
The Company’s significant investments in non-U.S. businesses are exposed to foreign currency risk. Adjustments resulting from translating assets and liabilities are reported as a separate component of Accumulated Other Comprehensive Loss within Shareholders’ Equity under the caption Foreign Currency Translation Adjustment. During fiscal year 2016, the Company recorded foreign currency translation losses in other comprehensive income of approximately $21.1 million primarily as a result of the weakening of the U.S. dollar relative to the British pound sterling.
Exchange rate gains or losses related to foreign currency transactions are recognized as transaction gains or losses in the Consolidated Statements of Income as incurred. Under certain circumstances, the Company may enter into derivative financial instruments in the form of foreign currency forward contracts to hedge against specific transactions, including intercompany purchases and loans. The Company does not use derivative financial instruments for trading or speculative purposes.
The Company may enter into forward exchange contracts to manage the Company’s exposure on certain foreign currency denominated assets and liabilities. The forward exchange contracts are marked to market through Foreign Exchange Transaction Gains and Losses on the Consolidated Statements of Income, and carried at their fair value on the Consolidated Statements of Financial Position. Foreign currency denominated assets and liabilities are remeasured at spot rates in effect on the balance sheet date, with the effects of changes in spot rates reported in Foreign Exchange Transaction Gains and Losses. As of April 30, 2016 and 2015, the Company had two open forward contracts with notional amounts of 31 million Euros and 274 million Pound Sterling to hedge intercompany loans. As of April 30, 2015, the Company did not maintain any open forward contracts. During fiscal years 2014 through 2016, the Company did not designate any forward exchange contracts as hedges under current accounting standards as the benefits of doing so were not material due to the short-term nature of the contracts. The fair value changes in the forward exchange contracts substantially mitigated the changes in the value of the applicable foreign currency denominated assets and liabilities. As of April 30, 2016, the fair value of the open forward exchange contracts was a gain of approximately $1.3 million which was measured on a recurring basis using Level 2 inputs and recorded within the Prepaid and Other Line item in the Consolidated Statements of Financial Position. For fiscal years 2016, 2015 and 2014, the gains (losses) recognized on the forward contracts were $1.3 million, $(11.2) million, and $(0.4) million, respectively.
56
Customer Credit Risk:
In the journal publishing business, subscriptions are primarily sourced through journal subscription agents who, acting as agents for library customers, facilitate ordering by consolidating the subscription orders/billings of each subscriber with various publishers. Cash is generally collected in advance from subscribers by the subscription agents and is principally remitted to the Company between the months of December and April. Although at fiscal year-end the Company had minimal credit risk exposure to these agents, future calendar-year subscription receipts from these agents are highly dependent on their financial condition and liquidity. Subscription agents account for approximately 22% of total annual consolidated revenue and no one agent accounts for more than 11% of total annual consolidated revenue.
The Company’s non-journal subscription business is not dependent upon a single customer. Although no one non-journal customer accounts for more than 9% of total consolidated revenue and 12% of accounts receivable at April 30, 2016, the top 10 non-journal customers account for approximately 16% of total consolidated revenue and approximately 26% of accounts receivable at April 30, 2016. The Company maintains approximately $25 million of trade credit insurance, subject to certain limitations, covering balances due from certain named customers which expires in May, 2017.
Disclosure of Certain Activities Relating to Iran:
The European Union, Canada and United States have imposed sanctions on business relationships with Iran, including restrictions on financial transactions and prohibitions on direct and indirect trading with listed “designated persons.” In fiscal year 2016, the Company recorded revenue and net profits of approximately $2.8 million and $0.7 million, respectively, related to the sale of scientific and medical content to certain publicly funded universities, hospitals and institutions that meet the definition of the “Government of Iran” as defined under section 560.304 of title 31, Code of Federal Regulations. The Company has assessed its business relationship and transactions with Iran and believes it is in compliance with the regulations governing the sanctions. The Company intends to continue in these or similar sales as long as they continue to be consistent with all applicable sanctions-related regulations.
57
“Safe Harbor” Statement Under the
Private Securities Litigation Reform Act of 1995
This report contains certain forward-looking statements concerning the Company’s operations, performance, and financial condition. Reliance should not be placed on forward-looking statements, as actual results may differ materially from those in any forward-looking statements. Any such forward-looking statements are based upon a number of assumptions and estimates that are inherently subject to uncertainties and contingencies, many of which are beyond the control of the Company, and are subject to change based on many important factors. Such factors include, but are not limited to (i) the level of investment in new technologies and products; (ii) subscriber renewal rates for the Company’s journals; (iii) the financial stability and liquidity of journal subscription agents; (iv) the consolidation of book wholesalers and retail accounts; (v) the market position and financial stability of key retailers; (vi) the seasonal nature of the Company’s education business and the impact of the used-book market; (vii) worldwide economic and political conditions; (viii) the Company’s ability to protect its copyrights and other intellectual property worldwide; (ix) the ability of the Company to successfully integrate acquired operations and realize expected opportunities and (x) other factors detailed from time to time in the Company’s filings with the Securities and Exchange Commission. The Company undertakes no obligation to update or revise any such forward-looking statements to reflect subsequent events or circumstances.
58
Item 8. Financial Statements and Supplementary Data
MANAGEMENT’S REPORT ON INTERNAL CONTROL OVER FINANCIAL REPORTING
To our Shareholders
John Wiley and Sons, Inc.:
The management of John Wiley and Sons, Inc. and subsidiaries is responsible for establishing and maintaining adequate internal control over financial reporting, as such term is defined in Exchange Act Rules 13a-15(f) and 15d-15(f).
Under the supervision and with the participation of our management, we conducted an evaluation of the effectiveness of our internal control over financial reporting based on the framework in Internal Control – Integrated Framework (2013) issued by the Committee of Sponsoring Organizations of the Treadway Commission (COSO). Based on our evaluation under the framework in Internal Control – Integrated Framework issued by COSO, our management concluded that our internal control over financial reporting was effective as of April 30, 2016.
Changes in Internal Control over Financial Reporting:
We are in the process of implementing a new global enterprise resource planning system (“ERP”) that will enhance our business and financial processes and standardize our information systems. We have completed the implementation with respect to certain subsidiaries/locations and will continue to roll out the ERP in phases over the next three years.
As with any new information system we implement, this application, along with the internal controls over financial reporting included in this process, will require testing for effectiveness. In connection with this ERP implementation, we are updating our internal controls over financial reporting, as necessary, to accommodate modifications to our business processes and accounting procedures. We do not believe that the ERP implementation will have an adverse effect on our internal control over financial reporting.
Except as described above, there were no changes in our internal control over financial reporting that have materially affected, or are reasonably likely to materially affect, our internal control over financial reporting during fiscal year 2016.
The effectiveness of our internal control over financial reporting as of April 30, 2016 has been audited by KPMG LLP, an independent registered public accounting firm, as stated in their report which is included herein.
The Company’s Corporate Governance Principles, Committee Charters, Business Conduct and Ethics Policy and the Code of Ethics for Senior Financial Officers are published on our web site at www.wiley.com under the “About Wiley—Investor Relations—Corporate Governance” captions. Copies are also available free of charge to shareholders on request to the Corporate Secretary, John Wiley & Sons, Inc., 111 River Street, Hoboken, NJ 07030-5774.
|
/s/ Mark Allin
|
|
|
Mark Allin
|
|
|
President and
|
|
|
Chief Executive Officer
|
|
59
|
/s/ John A. Kritzmacher
|
|
|
John A. Kritzmacher
|
|
|
Chief Financial Officer and
|
|
|
Executive Vice President, Technology and Operations
|
|
|
/s/ Edward J. Melando
|
|
|
Edward J. Melando
|
|
|
Senior Vice President, Controller and
|
|
|
Chief Accounting Officer
|
|
|
June 29, 2016
|
60
Report of Independent Registered Public Accounting Firm
The Board of Directors and Shareholders
John Wiley & Sons, Inc.:
We have audited the accompanying consolidated statements of financial position of John Wiley & Sons, Inc. (the “Company”) and subsidiaries as of April 30, 2016 and 2015, and the related consolidated statements of income, comprehensive income (loss), cash flows and shareholders’ equity for each of the years in the three-year period ended April 30, 2016. In connection with our audits of the consolidated financial statements, we also have audited Schedule II of this Form 10-K. These consolidated financial statements and financial statement schedule are the responsibility of the Company’s management. Our responsibility is to express an opinion on these consolidated financial statements and financial statement schedule based on our audits.
We conducted our audits in accordance with the standards of the Public Company Accounting Oversight Board (United States). Those standards require that we plan and perform the audit to obtain reasonable assurance about whether the financial statements are free of material misstatement. An audit includes examining, on a test basis, evidence supporting the amounts and disclosures in the financial statements. An audit also includes assessing the accounting principles used and significant estimates made by management, as well as evaluating the overall financial statement presentation. We believe that our audits provide a reasonable basis for our opinion.
In our opinion, the consolidated financial statements referred to above present fairly, in all material respects, the financial position of John Wiley & Sons, Inc. and subsidiaries as of April 30, 2016 and 2015, and the results of their operations and their cash flows for each of the years in the three-year period ended April 30, 2016, in conformity with U.S. generally accepted accounting principles. Also in our opinion, the related financial statement schedule, when considered in relation to the basic consolidated financial statements taken as a whole, presents fairly, in all material respects, the information set forth therein.
We also have audited, in accordance with the standards of the Public Company Accounting Oversight Board (United States), John Wiley & Sons, Inc.’s internal control over financial reporting as of April 30, 2016, based on criteria established in Internal Control – Integrated Framework (2013) issued by the Committee of Sponsoring Organizations of the Treadway Commission (COSO)”), and our report dated June 29, 2016 expressed an unqualified opinion on the effectiveness of the Company’s internal control over financial reporting.
(signed) KPMG LLP
Short Hills, New Jersey
June 29, 2016
61
Report of Independent Registered Public Accounting Firm
The Board of Directors and Shareholders
John Wiley & Sons, Inc.:
We have audited John Wiley & Sons, Inc.’s internal control over financial reporting as of April 30, 2016, based on criteria established in Internal Control – Integrated Framework (2013) issued by the Committee of Sponsoring Organizations of the Treadway Commission (COSO). John Wiley & Sons, Inc.’s management is responsible for maintaining effective internal control over financial reporting and for its assessment of the effectiveness of internal control over financial reporting, included in the accompanying Management’s Report on Internal Control Over Financial Reporting. Our responsibility is to express an opinion on the Company’s internal control over financial reporting based on our audit.
We conducted our audit in accordance with the standards of the Public Company Accounting Oversight Board (United States). Those standards require that we plan and perform the audit to obtain reasonable assurance about whether effective internal control over financial reporting was maintained in all material respects. Our audit included obtaining an understanding of internal control over financial reporting, assessing the risk that a material weakness exists, and testing and evaluating the design and operating effectiveness of internal control based on the assessed risk. Our audit also included performing such other procedures as we considered necessary in the circumstances. We believe that our audit provides a reasonable basis for our opinion.
A company’s internal control over financial reporting is a process designed to provide reasonable assurance regarding the reliability of financial reporting and the preparation of financial statements for external purposes in accordance with generally accepted accounting principles. A company’s internal control over financial reporting includes those policies and procedures that (1) pertain to the maintenance of records that, in reasonable detail, accurately and fairly reflect the transactions and dispositions of the assets of the company; (2) provide reasonable assurance that transactions are recorded as necessary to permit preparation of financial statements in accordance with generally accepted accounting principles, and that receipts and expenditures of the company are being made only in accordance with authorizations of management and directors of the company; and (3) provide reasonable assurance regarding prevention or timely detection of unauthorized acquisition, use, or disposition of the company’s assets that could have a material effect on the financial statements.
Because of its inherent limitations, internal control over financial reporting may not prevent or detect misstatements. Also, projections of any evaluation of effectiveness to future periods are subject to the risk that controls may become inadequate because of changes in conditions, or that the degree of compliance with the policies or procedures may deteriorate.
In our opinion, John Wiley & Sons, Inc. maintained, in all material respects, effective internal control over financial reporting as of April 30, 2016, based on criteria established in Internal Control – Integrated Framework (2013) issued by the Committee of Sponsoring Organizations of the Treadway Commission.
We also have audited, in accordance with the standards of the Public Company Accounting Oversight Board (United States), the consolidated statements of financial position of John Wiley & Sons, Inc. and subsidiaries as of April 30, 2016 and 2015, and the related consolidated statements of income, comprehensive income (loss), cash flows and shareholders’ equity for each of the years in the three-year period ended April 30, 2016, and our report dated June 29, 2016 expressed an unqualified opinion on those consolidated financial statements.
(signed) KPMG LLP
Short Hills, New Jersey
June 29, 2016
62
|
CONSOLIDATED STATEMENTS OF FINANCIAL POSITION
|
||||
|
John Wiley & Sons, Inc., and Subsidiaries
|
April 30,
|
|||
|
Dollars in thousands
|
2016
|
2015
|
||
|
Assets:
|
||||
|
Current Assets
|
||||
|
Cash and cash equivalents
|
$
|
363,806
|
$
|
457,441
|
|
Accounts receivable
|
167,638
|
147,183
|
||
|
Inventories
|
57,779
|
63,779
|
||
|
Prepaid and other
|
81,456
|
72,516
|
||
|
Total Current Assets
|
670,679
|
740,919
|
||
|
Product Development Assets
|
72,126
|
69,589
|
||
|
Technology, Property & Equipment
|
214,770
|
193,010
|
||
|
Intangible Assets
|
877,007
|
917,621
|
||
|
Goodwill
|
951,663
|
962,367
|
||
|
Income Tax Deposits
|
62,912
|
57,098
|
||
|
Other Assets
|
71,939
|
63,639
|
||
|
Total Assets
|
$
|
2,921,096
|
$
|
3,004,243
|
|
Liabilities and Shareholders’ Equity:
|
||||
|
Current Liabilities
|
||||
|
Short-term debt
|
$
|
-
|
$
|
100,000
|
|
Accounts and royalties payable
|
166,222
|
161,465
|
||
|
Deferred revenue
|
426,489
|
372,051
|
||
|
Accrued employment costs
|
97,902
|
93,922
|
||
|
Accrued income taxes
|
9,450
|
9,484
|
||
|
Accrued pension liability
|
5,492
|
4,594
|
||
|
Other accrued liabilities
|
76,252
|
62,167
|
||
|
Total Current Liabilities
|
781,807
|
803,683
|
||
|
Long-Term Debt
|
605,007
|
650,090
|
||
|
Accrued Pension Liability
|
224,170
|
209,727
|
||
|
Deferred Income Tax Liabilities
|
189,868
|
198,947
|
||
|
Other Long-Term Liabilities
|
83,138
|
86,756
|
||
|
Shareholders’ Equity
|
||||
|
Preferred Stock, $1 par value: Authorized - 2 million, Issued - zero
|
-
|
-
|
||
|
Class A Common Stock, $1 par value: Authorized - 180 million,
|
||||
|
Issued – 69,797,994
|
69,798
|
69,798
|
||
|
Class B Common Stock, $1 par value: Authorized - 72 million,
|
||||
|
Issued – 13,392,268
|
13,392
|
13,392
|
||
|
Additional paid-in capital
|
368,698
|
353,018
|
||
|
Retained earnings
|
1,673,325
|
1,597,439
|
||
|
Accumulated other comprehensive (loss):
|
||||
|
Foreign currency translation adjustment
|
(267,920)
|
(246,854)
|
||
|
Unamortized retirement costs, net of tax
|
(179,405)
|
(159,434)
|
||
|
Unrealized loss on interest rate swap, net of tax
|
(361)
|
(345)
|
||
|
(447,686)
|
(406,633)
|
|||
|
Less Treasury Shares At Cost (Class A – 21,708,905 and 20,441,767;
|
||||
|
Class B – 3,917,128 and 3,910,264)
|
(640,421)
|
(571,974)
|
||
|
Total Shareholders’ Equity
|
1,037,106
|
1,055,040
|
||
|
Total Liabilities and Shareholders’ Equity
|
$
|
2,921,096
|
$
|
3,004,243
|
|
The accompanying notes are an integral part of the consolidated financial statements.
|
||||
63
|
CONSOLIDATED STATEMENTS OF INCOME
|
||||||
|
John Wiley & Sons, Inc., and Subsidiaries
|
For the years ended April 30,
|
|||||
|
Dollars in thousands, except per share data
|
2016
|
2015
|
2014
|
|||
|
Revenue
|
$
|
1,727,037
|
$
|
1,822,440
|
$
|
1,775,195
|
|
Costs and Expenses
|
||||||
|
Cost of sales
|
465,917
|
499,683
|
506,879
|
|||
|
Operating and administrative expenses
|
994,632
|
1,005,000
|
969,456
|
|||
|
Restructuring charges
|
28,611
|
28,804
|
42,722
|
|||
|
Impairment charges
|
-
|
-
|
4,786
|
|||
|
Amortization of intangibles
|
49,764
|
51,214
|
44,679
|
|||
|
Total Costs and Expenses
|
1,538,924
|
1,584,701
|
1,568,522
|
|||
|
Operating Income
|
188,113
|
237,739
|
206,673
|
|||
|
Interest expense
|
(16,707)
|
(17,077)
|
(13,916)
|
|||
|
Foreign exchange transaction gains (losses)
|
473
|
1,742
|
(8)
|
|||
|
Interest income and other
|
2,914
|
3,057
|
2,785
|
|||
|
Income Before Taxes
|
174,793
|
225,461
|
195,534
|
|||
|
Provision for Income Taxes
|
29,011
|
48,593
|
35,024
|
|||
|
Net Income
|
$
|
145,782
|
$
|
176,868
|
$
|
160,510
|
|
Earnings Per Share
|
||||||
|
Diluted
|
$
|
2.48
|
$
|
2.97
|
$
|
2.70
|
|
Basic
|
2.51
|
3.01
|
2.73
|
|||
|
Cash Dividends Per Share
|
||||||
|
Class A Common
|
$
|
1.20
|
$
|
1.16
|
$
|
1.00
|
|
Class B Common
|
1.20
|
1.16
|
1.00
|
|||
|
Average Shares
|
||||||
|
Diluted
|
58,734
|
59,594
|
59,514
|
|||
|
Basic
|
57,998
|
58,733
|
58,635
|
|||
|
The accompanying notes are an integral part of the consolidated financial statements.
|
||||||
64
|
CONSOLIDATED STATEMENTS OF COMPREHENSIVE INCOME (LOSS)
|
||||||
|
John Wiley & Sons, Inc., and Subsidiaries
|
For the years ended April 30,
|
|||||
|
Dollars in thousands
|
2016
|
2015
|
2014
|
|||
|
Net Income
|
$
|
145,782
|
$
|
176,868
|
$
|
160,510
|
|
Other Comprehensive Income (Loss):
|
||||||
|
Foreign currency translation adjustment
|
(21,066)
|
(180,190)
|
67,875
|
|||
|
Unrealized retirement costs net of tax benefit (provision) of $8,807; $15,779 and $(12,946), respectively
|
(19,971)
|
(36,409)
|
20,099
|
|||
|
Unrealized (loss) gain on interest rate swaps net of tax benefit (provision) of $10; $(157) and $(225), respectively
|
(16)
|
257
|
367
|
|||
|
Total Other Comprehensive Income (Loss)
|
(41,053)
|
(216,342)
|
88,341
|
|||
|
Comprehensive Income (Loss)
|
$
|
104,729
|
$
|
(39,474)
|
$
|
248,851
|
|
The accompanying notes are an integral part of the consolidated financial statements.
|
||||||
65
|
CONSOLIDATED STATEMENTS OF CASH FLOWS
|
||||||
|
John Wiley & Sons, Inc., and Subsidiaries
|
For the years ended April 30,
|
|||||
|
Dollars in thousands
|
2016
|
2015
|
2014
|
|||
|
Operating Activities
|
||||||
|
Net Income
|
$
|
145,782
|
$
|
176,868
|
$
|
160,510
|
|
Adjustments to reconcile net income to net cash provided by operating activities
|
||||||
|
Amortization of intangibles
|
49,764
|
51,214
|
44,679
|
|||
|
Amortization of composition costs
|
39,658
|
40,639
|
45,097
|
|||
|
Depreciation of technology, property and equipment
|
66,427
|
62,072
|
58,321
|
|||
|
Restructuring and impairment charges
|
28,611
|
28,804
|
47,508
|
|||
|
Deferred tax benefits on U.K. rate changes
|
(5,859)
|
-
|
(10,634)
|
|||
|
Share-based compensation
|
16,105
|
13,617
|
12,851
|
|||
|
(Excess) shortfalls in tax benefits from share-based compensation
|
(1,027)
|
(3,191)
|
1,466
|
|||
|
Employee retirement plan expense
|
14,323
|
22,599
|
30,454
|
|||
|
Royalty advances
|
(110,135)
|
(104,876)
|
(107,639)
|
|||
|
Earned royalty advances
|
109,102
|
110,054
|
107,529
|
|||
|
Other non-cash credits, net
|
1,463
|
(8,046)
|
(3,626)
|
|||
|
Income tax deposits
|
(1,151)
|
(5,280)
|
(11,968)
|
|||
|
Changes in Operating Assets and Liabilities
|
||||||
|
Source (Use), excluding acquisitions
|
||||||
|
Accounts receivable
|
(14,456)
|
4,488
|
18,558
|
|||
|
Inventories
|
3,571
|
9,696
|
11,146
|
|||
|
Accounts and royalties payable
|
3,997
|
31,305
|
7,297
|
|||
|
Deferred revenue
|
66,983
|
3,913
|
(750)
|
|||
|
Income taxes payable
|
(7,091)
|
8,330
|
(14,131)
|
|||
|
Restructuring payments
|
(29,864)
|
(32,341)
|
(28,276)
|
|||
|
Other accrued liabilities
|
14,968
|
(10,901)
|
30,581
|
|||
|
Employee retirement plan contributions
|
(34,214)
|
(28,503)
|
(33,889)
|
|||
|
Other
|
(7,000)
|
(15,339)
|
(16,860)
|
|||
|
Cash Provided by Operating Activities
|
349,957
|
355,122
|
348,224
|
|||
|
Investing Activities
|
||||||
|
Composition spending
|
(37,272)
|
(39,421)
|
(40,568)
|
|||
|
Additions to technology, property and equipment
|
(93,705)
|
(69,121)
|
(57,564)
|
|||
|
Acquisitions, net of cash acquired
|
(20,418)
|
(172,229)
|
(54,515)
|
|||
|
Proceeds from sale of consumer publishing programs
|
-
|
1,100
|
3,300
|
|||
|
Cash Used for Investing Activities
|
(151,395)
|
(279,671)
|
(149,347)
|
|||
|
Financing Activities
|
||||||
|
Repayment of long-term debt
|
(460,085)
|
(711,654)
|
(658,224)
|
|||
|
Repayment of short-term debt
|
(150,000)
|
-
|
-
|
|||
|
Borrowings of long-term debt
|
415,000
|
659,369
|
685,324
|
|||
|
Borrowing of short-term debt
|
50,000
|
100,000
|
-
|
|||
|
Purchase of treasury stock
|
(69,977)
|
(61,981)
|
(63,393)
|
|||
|
Change in book overdrafts
|
1,725
|
(6,711)
|
(12,354)
|
|||
|
Cash dividends
|
(69,896)
|
(68,498)
|
(58,953)
|
|||
|
Debt financing costs
|
(3,362)
|
-
|
-
|
|||
|
Net (payments)/proceeds from exercise of stock options and other
|
(95)
|
25,326
|
55,532
|
|||
|
Excess (shortfalls ) in tax benefits from share-based compensation
|
1,027
|
3,191
|
(1,466)
|
|||
|
Cash Used for Financing Activities
|
(285,663)
|
(60,958)
|
(53,534)
|
|||
|
Effects of Exchange Rate Changes on Cash
|
(6,534)
|
(43,429)
|
6,894
|
|||
|
Cash and Cash Equivalents
|
||||||
|
(Decrease) Increase for year
|
(93,635)
|
(28,936)
|
152,237
|
|||
|
Balance at beginning of year
|
457,441
|
486,377
|
334,140
|
|||
|
Balance at end of year
|
363,806
|
457,441
|
486,377
|
|||
|
Cash Paid During the Year for
|
||||||
|
Interest
|
$
|
15,050
|
$
|
14,875
|
$
|
12,511
|
|
Income taxes, net
|
$
|
38,579
|
$
|
45,646
|
$
|
63,815
|
|
The accompanying notes are an integral part of the consolidated financial statements
|
||||||
66
|
CONSOLIDATED STATEMENTS OF SHAREHOLDERS’ EQUITY
|
|||||||
|
Common
Stock
Class A
|
Common
Stock
Class B
|
Additional
Paid-in
Capital
|
Retained
Earnings
|
Treasury
Stock
|
Accumulated
Other Comp-
rehensive
Income
(Loss)
|
Total
Share-
holder’s
Equity
|
|
|
John Wiley & Sons, Inc., and Subsidiaries
|
|||||||
|
Dollars in thousands
|
|||||||
|
Balance at April 30, 2013
|
$69,793
|
$13,397
|
$290,762
|
$1,387,512
|
$(494,476)
|
$(278,632)
|
$988,356
|
|
Restricted Shares Issued under Share-based Compensation Plans
|
(5,962)
|
6,144
|
182
|
||||
|
Proceeds from Exercise of Stock Options and other
|
31,403
|
24,417
|
55,820
|
||||
|
Shortfall in Tax Benefits from Share-based Compensation
|
|
(1,466)
|
|
(1,466)
|
|||
|
Share-based compensation expense
|
12,851
|
12,851
|
|||||
|
Purchase of Treasury Shares
|
(63,393)
|
(63,393)
|
|||||
|
Class A Common Stock Dividends
|
(51,842)
|
(51,842)
|
|||||
|
Class B Common Stock Dividends
|
(7,111)
|
(7,111)
|
|||||
|
Common Stock Class Conversions
|
5
|
(5)
|
-
|
||||
|
Comprehensive Income
|
160,510
|
88,341
|
248,851
|
||||
|
Balance at April 30, 2014
|
$69,798
|
$13,392
|
$327,588
|
$1,489,069
|
$(527,308)
|
$(190,291)
|
$1,182,248
|
|
Restricted Shares Issued under Share-based Compensation Plans
|
(3,471)
|
4,085
|
614
|
||||
|
Proceeds from Exercise of Stock Options and other
|
12,093
|
13,230
|
25,323
|
||||
|
Excess Tax Benefits from Share-based Compensation
|
|
3,191
|
|
3,191
|
|||
|
Share-based compensation expense
|
13,617
|
13,617
|
|||||
|
Purchase of Treasury Shares
|
(61,981)
|
(61,981)
|
|||||
|
Class A Common Stock Dividends
|
(57,541)
|
(57,541)
|
|||||
|
Class B Common Stock Dividends
|
(10,957)
|
(10,957)
|
|||||
|
Comprehensive Income (Loss)
|
176,868
|
(216,342)
|
(39,474)
|
||||
|
Balance at April 30, 2015
|
$69,798
|
$13,392
|
$353,018
|
$1,597,439
|
$(571,974)
|
$(406,633)
|
$1,055,040
|
|
Restricted Shares Issued under Share-based Compensation Plans
|
(3,152)
|
3,325
|
173
|
||||
|
Net (Payments)/Proceeds from Exercise of Stock Options and other
|
1,700
|
(1,795)
|
(95)
|
||||
|
Excess Tax Benefits from Share-based Compensation
|
|
1,027
|
|
1,027
|
|||
|
Share-based compensation expense
|
16,105
|
16,105
|
|||||
|
Purchase of Treasury Shares
|
(69,977)
|
(69,977)
|
|||||
|
Class A Common Stock Dividends
|
(58,658)
|
(58,658)
|
|||||
|
Class B Common Stock Dividends
|
(11,238)
|
11,238
|
|||||
|
Comprehensive Income (Loss)
|
145,782
|
(41,053)
|
104,729
|
||||
|
Balance at April 30, 2016
|
$69,798
|
$13,392
|
$368,698
|
$1,673,325
|
$(640,421)
|
$(447,686)
|
$1,037,106
|
|
The accompanying notes are an integral part of the consolidated financial statements.
|
|||||||
67
Notes to Consolidated Financial Statements
Note 1 – Description of Business
The Company, founded in 1807, was incorporated in the state of New York on January 15, 1904. As used herein the term “Company” means John Wiley & Sons, Inc., and its subsidiaries and affiliated companies, unless the context indicates otherwise.
The Company is a global provider of knowledge and knowledge-enabled services that improve outcomes in areas of research, professional practice and education. Through the Research segment, the Company provides digital and print scientific, technical, medical and scholarly journals, reference works, books, database services and advertising. The Professional Development segment provides digital and print books, corporate learning solutions, employment assessment and training services, and test prep and certification. In Education, the Company provides print and digital content, and education solutions including online program management services for higher education institutions and course management tools for instructors and students. The Company takes full advantage of its content from all three businesses in developing and cross-marketing products to its diverse customer base of researchers, professionals, students, and educators. The use of technology enables the Company to make its content efficiently more accessible to its customers around the world. The Company’s operations are primarily located in the United States, Canada, Europe, Asia, and Australia.
Note 2 - Summary of Significant Accounting Policies
Principles of Consolidation: The consolidated financial statements include the accounts of the Company. Investments in entities in which the Company has at least a 20%, but less than a majority interest, are accounted for using the equity method of accounting. Investments in entities in which the Company has less than a 20% ownership and in which it does not exercise significant influence are accounted for using the cost method of accounting. All intercompany accounts and transactions have been eliminated in consolidation.
Use of Estimates: The preparation of the Company’s financial statements in conformity with accounting principles generally accepted in the United States requires management to make estimates and assumptions that affect the reported amounts of assets and liabilities and disclosure of contingent assets and liabilities as of the date of the financial statements and reported amounts of revenue and expenses during the reporting period. Actual results could differ from those estimates.
Reclassifications: Certain prior year amounts have been reclassified to conform to the current year’s presentation.
Book Overdrafts: Under the Company’s cash management system, a book overdraft balance exists for the Company’s primary disbursement accounts. This overdraft represents uncleared checks in excess of cash balances in individual bank accounts. The Company’s funds are transferred from other existing bank account balances or from lines of credit as needed to fund checks presented for payment. As of April 30, 2016 and 2015, book overdrafts of $17.8 million and $16.1 million, respectively, were included in Accounts and Royalties Payable in the Consolidated Statements of Financial Position.
Revenue Recognition: The Company recognizes revenue when the following criteria are met: persuasive evidence that an arrangement exists; delivery has occurred or services have been rendered; the price to the customer is fixed or determinable; and collectability is reasonably assured. If all of the above criteria have been met, revenue is recognized upon shipment of products or when services have been rendered. Revenue related to journal subscriptions and other products and services that are generally collected in advance are deferred and recognized as earned over the term of the subscription; when the related issue is shipped; made available online; or the service is rendered, in accordance with contractual terms. Collectability is evaluated based on the amount involved, the credit history of the customer, and the status of the customer’s account with the Company.
68
The Company transitioned from issue-based to time-based digital journal subscription agreements for calendar year 2016. Under this new contractual agreement, the Company provides access to all journal content published within a calendar year and recognizes revenue on a straight-line basis over the calendar year. Under the Company’s previous licensing model, a customer subscribed to a discrete number of online journal issues and revenue was recognized as each issue was made available online. The Company made these changes to simplify the contracting and administration of digital journal subscriptions.
When a product is sold with multiple deliverables, the Company accounts for each deliverable within the arrangement as a separate unit of accounting due to the fact that each deliverable is also sold on a stand-alone basis. The total consideration of a multiple-element arrangement is allocated to each unit of accounting based on the price charged by the Company when it is sold separately. The Company’s multiple deliverable arrangements principally include WileyPLUS, the online course management tool for the Company’s Education business which includes a complete print or digital textbook for the course; negotiated licenses for bundles of digital content available on Wiley Online Library, the online publishing platform for the Company’s Research business; and test preparation, assessment, certification and training services sold by the Professional Development business which can include bundles of print and digital content and online workflow solutions.
The Company enters into contracts for the resale of its content through a third party where the Company is not the primary obligor of the arrangement because it is not responsible for fulfilling the customer’s order; handling customer requests or claims and/or maintains credit risk. The Company recognizes revenue for the sale of its content, net of any commission owed to the third party seller or taxes which are remitted to government authorities.
Cash Equivalents: Cash equivalents consist of highly liquid investments with an original maturity of three months or less and are stated at cost plus accrued interest, which approximates market value.
Allowance for Doubtful Accounts: The estimated allowance for doubtful accounts is based on a review of the aging of the accounts receivable balances, historical write-off experience, credit evaluations of customers and current market conditions. A change in the evaluation of a customer’s credit could affect the estimated allowance. The allowance for doubtful accounts is shown as a reduction of Accounts Receivable in the Consolidated Statements of Financial Position and amounted to $7.3 million and $8.3 million as of April 30, 2016 and 2015, respectively.
Sales Return Reserves: The process which the Company uses to determine its sales returns and the related reserve provision charged against revenue is based on applying an estimated return rate to current year returnable print book sales. This rate is based upon an analysis of actual historical return experience in the various markets and geographic regions in which the Company does business. The Company collects, maintains and analyzes significant amounts of sales returns data for large volumes of homogeneous transactions. This allows the Company to make reasonable estimates of the amount of future returns. All available data is utilized to identify the returns by market and as to which fiscal year the sales returns apply. This enables management to track the returns in detail and identify and react to trends occurring in the marketplace, with the objective of being able to make the most informed judgments possible in setting reserve rates. Associated with the estimated sales return reserves, the Company also includes a related reduction in inventory and royalty costs as a result of the expected returns. Net print book sales return reserves amounted to $19.9 million and $25.3 million as of April 30, 2016 and 2015, respectively.
69
The reserves are reflected in the following accounts of the Consolidated Statements of Financial Position – increase (decrease) as of April 30:
|
2016
|
2015
|
|
|
Accounts Receivable
|
$(29,447)
|
$(37,300)
|
|
Inventories
|
4,924
|
6,555
|
|
Accounts and Royalties Payable
|
(4,662)
|
(5,405)
|
|
Decrease in Net Assets
|
$(19,861)
|
$(25,340)
|
Inventories: Inventories are carried at the lower of cost or market. U.S. book inventories aggregating $31.0 million and $35.7 million at April 30, 2016 and 2015, respectively, are valued using the last-in, first-out (LIFO) method. All other inventories are valued using the first-in, first-out (FIFO) method.
Reserve for Inventory Obsolescence: A reserve for inventory obsolescence is estimated based on a review of damaged, obsolete, or otherwise unsalable inventory. The review encompasses historical unit sales trends by title; current market conditions, including estimates of customer demand compared to the number of units currently on hand; and publication revision cycles. The inventory obsolescence reserve is reported as a reduction of the Inventories balance in the Consolidated Statements of Financial Position and amounted to $22.0 million and $21.9 million as of April 30, 2016 and 2015, respectively.
Product Development Assets: Product development assets consist of composition costs and royalty advances. Costs associated with developing a publication are expensed until the product is determined to be commercially viable. Composition costs represent the costs incurred to bring an edited commercial manuscript to publication, which include typesetting, proofreading, design, illustration costs, and digital formatting. Composition costs are capitalized and are generally amortized on a double-declining basis over their estimated useful lives, ranging from 1 to 3 years. Royalty advances are capitalized and, upon publication, are expensed as royalties earned based on sales of the published works. Royalty advances are reviewed for recoverability and a reserve for loss is maintained, if appropriate.
Shipping and Handling Costs: Costs incurred for third party shipping and handling are reflected in the Operating and Administrative Expenses line item in the Consolidated Statements of Income. The Company incurred $40.5 million, $42.5 million and $42.2 million in shipping and handling costs in fiscal years 2016, 2015 and 2014, respectively.
Advertising Expense: Advertising costs are expensed as incurred. The Company incurred $54.1 million, $40.8 million and $35.2 million in advertising costs in fiscal years 2016, 2015 and 2014, respectively.
Technology, Property and Equipment: Technology, property and equipment is recorded at cost. Major renewals and improvements are capitalized, while maintenance and repairs are expensed as incurred.
Technology, property and equipment is depreciated using the straight-line method based upon the following estimated useful lives: Buildings and Leasehold Improvements – the lesser of the estimated useful life of the asset up to 40 years or the duration of the lease; Furniture and Fixtures - 3 to 10 years; Computer Hardware and Software - 3 to 10 years.
70
Costs incurred for computer software developed or obtained for internal use are capitalized during the application development stage and expensed as incurred during the preliminary project and post-implementation stages. Costs incurred during the application development stage include costs of materials and services, and payroll and payroll-related costs for employees who are directly associated with the software project. Such costs are amortized over the expected useful life of the related software which is generally 3 to 6 years. Costs related to the investment in the Company’s Enterprise Resource Planning and related systems are amortized over an expected useful life of 10 years. Maintenance, training, and upgrade costs that do not result in additional functionality are expensed as incurred.
Allocation of Acquisition Purchase Price to Assets Acquired and Liabilities Assumed: In connection with acquisitions, the Company allocates the cost of the acquisition to the assets acquired and the liabilities assumed based on the estimates of fair value for such items, including intangible assets and technology acquired. Such estimates include discounted estimated cash flows to be generated by those assets and the expected useful lives based on historical experience, current market trends, and synergies to be achieved from the acquisition and the expected tax basis of assets acquired. The Company may use a third party valuation consultant to assist in the determination of such estimates.
Goodwill and Indefinite-lived Intangible Assets: Goodwill is the excess of the purchase price paid over the fair value of the net assets of the business acquired. Indefinite-lived intangible assets primarily consist of brands, trademarks, content and publishing rights and are typically characterized by intellectual property with a long and well-established revenue stream resulting from strong and well-established imprint/brand recognition in the market. Goodwill and indefinite-lived intangible assets are not amortized but are reviewed annually for impairment, or more frequently if events or changes in circumstances indicate the asset might be impaired. The Company evaluates the recoverability of indefinite-lived intangible assets by comparing the fair value of the intangible asset to its carrying value.
To evaluate the recoverability of goodwill, the Company uses a two-step impairment test approach at the reporting unit level. In the first step, the estimated fair value of the entire reporting unit is compared to its carrying value including goodwill. If the fair value of the reporting unit is less than the carrying value, a second step is performed to determine the charge for goodwill impairment. In the second step, the Company determines an implied fair value of the reporting unit’s goodwill by determining the fair value of the individual assets and liabilities (including any previously unrecognized intangible assets) of the reporting unit other than goodwill. The resulting implied fair value of the goodwill is compared to the carrying amount and an impairment charge is recognized for the difference.
In certain circumstances, the Company uses a qualitative assessment as an alternative to the two-step test approach. Under this approach certain market, industry and financial performance factors are considered to determine whether it is more likely than not that the fair value of a reporting unit is less than its carrying amount. If that is the case, the two-step approach described above is then performed to evaluate the recoverability of goodwill.
Intangible Assets with Finite Lives and Other Long-Lived Assets: Finite-lived intangible assets principally consist of brands, trademarks, content and publication rights, customer relationships and non-compete agreements and are amortized over their estimated useful lives. The most significant factors in determining the estimated lives of these intangibles are the history and longevity of the brands, trademarks and content and publication rights acquired combined with the strength of cash flows. Content and publication rights, trademarks, customer relationships and brands with finite lives are amortized on a straight-line basis over periods ranging from 5 to 40 years. Non-compete agreements are amortized over the terms of the individual agreement, generally up to 5 years.
71
Intangible assets with finite lives as of April 30, 2016 are amortized on a straight line basis over the following weighted average estimated useful lives: content and publishing rights – 31 years; customer relationships – 20 years; brands and trademarks – 13 years; non-compete agreements – 4 years.
Assets with finite lives are only evaluated for impairment upon a significant change in the operating or macroeconomic environment. In these circumstances, if an evaluation of the projected undiscounted cash flows indicates impairment, the asset is written down to its estimated fair value based on the discounted future cash flows.
Derivative Financial Instruments: The Company, from time to time, enters into forward exchange and interest rate swap contracts as a hedge against foreign currency asset and liability commitments, changes in interest rates and anticipated transaction exposures, including intercompany purchases. All derivatives are recognized as assets or liabilities and measured at fair value. Derivatives that are not determined to be effective hedges are adjusted to fair value with a corresponding adjustment to earnings. The Company does not use financial instruments for trading or speculative purposes.
Foreign Currency Gains/Losses: The Company maintains operations in many non-U.S. locations. Assets and liabilities are translated into U.S. dollars using end of period exchange rates and revenues and expense are translated into U.S. dollars using weighted average rates. The Company’s significant investments in non-U.S. businesses are exposed to foreign currency risk. Foreign currency translation adjustments are reported as a separate component of Accumulated Other Comprehensive Loss within Shareholders’ Equity. During fiscal year 2016, the Company recorded $21.1 million of foreign currency translation losses primarily due to the strengthening of the U.S. dollar relative to the British pound sterling. Foreign currency transaction gains or losses are recognized in the Consolidated Statements of Income as incurred.
Share-Based Compensation: The Company recognizes share-based compensation expense based on the fair value of the share-based awards on the grant date, reduced by an estimate for future forfeited awards. As such, share-based compensation expense is only recognized for those awards that are expected to ultimately vest. The fair value of share-based awards is recognized in net income on a straight-line basis over the requisite service period. Share-based compensation expense associated with performance-based stock awards is based on actual financial results for targets established three years in advance. The cumulative effect on current and prior periods of a change in the estimated number of performance share awards, or estimated forfeiture rate, is recognized as an adjustment to earnings in the period of the revision.
Recently Issued Accounting Standards:
In March 2016, the FASB issued ASU 2016-09 “Compensation-Stock Compensation (Topic 718): Improvements to Employee Share-Based Payment Accounting” which simplifies the accounting for share-based payment transactions, including income taxes, classification of awards as either equity or liabilities, and classification on the statement of cash flows. The new guidance also allows an entity to make an accounting policy election to account for forfeitures when they occur or to estimate the number of awards that are expected to vest with a subsequent true up to actual forfeitures (current GAAP). The standard is effective for the company on May 1, 2017, with early adoption permitted. The Company is currently assessing the impact the new guidance will have on its consolidated financial statements.
In February 2016, the FASB issued ASU 2016-02 "Leases (Topic 842)”. ASU 2016-02 requires lessees to recognize most leases on the balance sheet which will result in an increase in reported assets and liabilities. The recognition of expenses within the income statement is consistent with the existing lease accounting standards. There are no significant changes in the new standard for lessors under operating leases. The standard is effective for the Company on May 1, 2019 with early adoption permitted. Adoption requires application of the new guidance for all periods presented. The Company is currently assessing the impact the new guidance will have on its consolidated financial statements.
72
In November 2015, the FASB issued ASU 2015-17 “Income Taxes- Balance Sheet Classification of Deferred Taxes”. To simplify the presentation of deferred income taxes, the amendments in this update require that all deferred tax liabilities and assets, including those previously classified as current, be classified as noncurrent in a classified statement of financial position. The amendments in this Update will align the presentation of deferred income tax assets and liabilities with IFRS. The standard is effective for the company May 1, 2017 with early adoption permitted. The Company is currently assessing the impact the new guidance will have on its consolidated financial statements.
In April 2015, the FASB issued ASU 2015-05 "Intangibles- Goodwill and Other- Internal-Use Software (Subtopic 350-40): Customer’s Accounting for Fees Paid in Cloud Computing Arrangements" (“ASU 2015-05”). Cloud computing arrangements represent the delivery of hosted services over the internet which includes software, platforms, infrastructure and other hosting arrangements. The ASU provides criteria to determine whether the cloud computing arrangement includes a software license. A software license can include customized development, maintenance, hosting and other related costs. If the criteria are met, the customer will capitalize the fee attributable to the software license portion of the arrangement as internal-use software. If the arrangement does not include a software license, it should be treated as a service contract. The standard is effective for the Company on May 1, 2016 with early adoption permitted. An entity can elect to adopt either prospectively for all arrangements entered into or materially modified after the effective date or retrospectively. The Company intends to adopt the new guidance on a prospective basis as of May 1, 2016.
In May 2014, the Financial Accounting Standards Board (“FASB”) issued ASU 2014-09 "Revenue from Contracts with Customers" (Topic 606) (“ASU 2014-09”), and the International Accounting Standards Board (“IASB”) published its equivalent standard, International Financial Reporting Standard (“IFRS”) 15, “Revenue from Contracts with Customers”. These joint comprehensive new revenue recognition standards will supersede most existing revenue recognition guidance and are intended to improve and converge revenue recognition and related financial reporting requirements. The standard is effective for the Company on May 1, 2018 with early adoption permitted on May 1, 2017. The standard allows for either “full retrospective” adoption, meaning the standard is applied to all periods presented, or “cumulative effect” adoption, meaning the standard is applied only to the most current period presented in the financial statements. Subsequently, the FASB issued ASU No. 2016-08, Revenue from Contracts with Customers (Topic 606) – Principal versus Agent Considerations (“ASU 2016-08”), ASU No. 2016-10, Revenue from Contracts with Customers (Topic 606) – Identifying Performance Obligations and Licensing (“ASU 2016-10”), and issued ASU 2016-12, Revenue from Contracts with Customers (Topic 606) – Narrow Scope Improvements and Practical Expedients (“ASU 2016-12”), which provide clarification and additional guidance related to ASU 2014-09. The Company must adopt ASU 2016-08, ASU 2016-10, and ASU 2016-12 with ASU 2014-09. The Company is currently assessing whether the adoption of the new guidance will have a significant impact on its consolidated financial statements.
73
Note 3 – Reconciliation of Weighted Average Shares Outstanding
A reconciliation of the shares used in the computation of earnings per share for the years ended April 30 follows (in thousands):
|
2016
|
2015
|
2014
|
|
|
Weighted Average Shares Outstanding
|
58,253
|
59,004
|
58,925
|
|
Less: Unearned Restricted Shares
|
(255)
|
(271)
|
(290)
|
|
Shares Used for Basic Earnings Per Share
|
57,998
|
58,733
|
58,635
|
|
Dilutive Effect of Stock Options and Other Stock Awards
|
736
|
861
|
879
|
|
Shares Used for Diluted Earnings Per Share
|
58,734
|
59,594
|
59,514
|
Since their inclusion in the calculation of diluted earnings per share would have been anti-dilutive, options to purchase 336,803, 178,144 and 389,400 shares of Class A Common Stock have been excluded for fiscal years 2016, 2015 and 2014, respectively. In addition, for fiscal years 2016 and 2015 unearned restricted shares of 15,200 and 2,500, respectively, have been excluded as their inclusion would have been anti-dilutive.
Note 4- Accumulated Other Comprehensive Loss
Changes in Accumulated Other Comprehensive Loss by component, net of tax, for the fiscal years ended April 30, 2016 and 2015 were as follows (in thousands):
|
Foreign
|
Unamortized
|
Interest
|
|||||
|
Currency
|
Retirement
|
Rate
|
|||||
|
Translation
|
Costs
|
Swaps
|
Total
|
||||
|
Balance at April 30, 2014
|
$(66,664)
|
$(123,025)
|
|
$(602)
|
$(190,291)
|
||
|
Other comprehensive income (loss) before reclassifications
|
(180,190)
|
(42,347)
|
(783)
|
(223,320)
|
|||
|
Reclassification of amounts to Consolidated Statements of Income
|
-
|
5,938
|
1,040
|
6,978
|
|||
|
Total other comprehensive income (loss)
|
(180,190)
|
(36,409)
|
257
|
(216,342)
|
|||
|
Balance at April 30, 2015
|
$(246,854)
|
$(159,434)
|
|
$(345)
|
$(406,633)
|
||
|
Other comprehensive income (loss) before reclassifications
|
(21,066)
|
(24,930)
|
(569)
|
(46,565)
|
|||
|
Reclassification of amounts to Consolidated Statements of Income
|
-
|
4,959
|
553
|
5,512
|
|||
|
Total other comprehensive income (loss)
|
(21,066)
|
(19,971)
|
(16)
|
(41,053)
|
|||
|
Balance at April 30, 2016
|
$(267,920)
|
$(179,405)
|
|
$(361)
|
$(447,686)
|
For the fiscal years ended April 30, 2016 and 2015, pre-tax actuarial losses included in Unamortized Retirement Costs of approximately $6.2 million and $7.8 million, respectively, were amortized from Accumulated Other Comprehensive Loss and recognized as pension expense in Operating and Administrative Expenses in the Consolidated Statements of Income.
74
Note 5 – Acquisitions
CrossKnowledge:
On May 1, 2014, the Company acquired CrossKnowledge Group Limited (“CrossKnowledge”) for approximately $166 million in cash, net of cash acquired. CrossKnowledge is a learning solutions provider focused on leadership and managerial skills development that offers subscription-based, digital learning solutions for global corporations, universities, and small and medium-sized enterprises. CrossKnowledge’s solutions include a variety of managerial and leadership skills assessments, courses, certifications, content and executive training programs that are delivered on a cloud-based LMS platform with over 19,000 learning objects in 17 languages. CrossKnowledge serves over seven million end-users in 80 countries. For the fiscal years ended April 30, 2016 and 2015, CrossKnowledge’s revenue included in Wiley’s results was $50.7 million and $42.0 million, respectively.
The $166 million purchase price was allocated to identifiable long-lived intangible assets, mainly customer relationships and content ($63.0 million); technology ($6.3 million); long-term deferred tax liabilities ($21.5 million); negative working capital ($4.3 million); and goodwill ($122.5 million). The fair value of intangible assets and technology acquired was based on management’s assessment performed with the assistance of a third party valuation consultant. Goodwill represents the excess of the purchase price over the fair value of net assets acquired and comprises the estimated value of CrossKnowledge’s workforce, unidentifiable intangible assets and the fair value of expected synergies. None of the goodwill is deductible for tax purposes. The identifiable long-lived intangible assets are primarily amortized over a weighted average estimated useful life of approximately 15 years. The acquisition was funded through the use of the Company’s existing credit facility and available cash balances.
Profiles International:
On April 1, 2014, the Company acquired all of the stock of Profiles International (“Profiles”) for approximately $47.5 million in cash, net of cash acquired. Profiles provides pre-employment assessment and selection tools that enable employers to optimize candidate selections and develop the full potential of their employees. Solutions include pre-hire assessments, including those designed to measure and match personality, knowledge, skills, managerial fit, loyalty, and values; and post-hire assessments, focused on measuring sales and managerial effectiveness, employee performance and career potential. Profiles serves approximately 4,000 corporate clients and millions of end users in over 120 countries, with assessments available in 32 languages. The $47.5 million purchase price was allocated to identifiable long-lived intangible assets, mainly customer relationships and assessment content ($22.9 million); technology ($2.7 million); long-term deferred tax liabilities ($9.7 million); a credit to short-term deferred tax assets ($2.9 million); negative working capital ($5.9 million) and goodwill ($40.4 million). The fair value of intangible assets and technology acquired was based on management’s assessment performed with the assistance of a third party valuation consultant. Goodwill represents the excess of the purchase price over the fair value of net assets acquired and comprises the estimated value of Profile’s workforce, unidentifiable intangible assets and the fair value of expected synergies. None of the goodwill is deductible for tax purposes. The identifiable long-lived intangible assets are primarily amortized over a weighted average estimated useful life of approximately 13 years. Profiles contributed $20.3 million, $23.3 million and $1.9 million to the Company’s revenue for fiscal years 2016, 2015 and 2014, respectively.
Unaudited proforma financial information has not been presented for any of these acquisitions since the effects of the acquisitions were not material individually or in the aggregate.
75
Note 6 – Restructuring Charges
In fiscal years 2016, 2015 and 2014, the Company recorded pre-tax restructuring charges of $28.6 million ($0.32 per share), $28.8 million ($0.34 per share) and $42.7 million ($0.48 per share), respectively, which are reflected in the Restructuring Charges line item in the Consolidated Statements of Income and described in more detail below:
Restructuring and Reinvestment Program:
Beginning in fiscal year 2013, the Company initiated a program (the “Restructuring and Reinvestment Program”) to restructure and realign its cost base with current and anticipated future market conditions. The Company is targeting a majority of the cost savings achieved to improve margins and earnings, while the remainder will be reinvested in high growth digital business opportunities.
The following table summarizes the pre-tax restructuring charges related to this program (in thousands):
|
2016
|
2015
|
2014
|
Total Charges Incurred to Date
|
||||
|
Charges by Segment:
|
|||||||
|
Research
|
$5,048
|
$4,555
|
$7,774
|
$20,273
|
|||
|
Professional Development
|
2,277
|
4,385
|
11,860
|
24,806
|
|||
|
Education
|
1,206
|
1,571
|
891
|
4,786
|
|||
|
Shared Services
|
20,080
|
18,293
|
22,197
|
74,724
|
|||
|
Total Restructuring Charges
|
$28,611
|
$28,804
|
$42,722
|
$124,589
|
|||
|
Charges by Activity:
|
|||||||
|
Severance
|
$16,443
|
$17,093
|
$25,962
|
$79,204
|
|||
|
Process reengineering consulting
|
7,191
|
301
|
8,556
|
18,666
|
|||
|
Other activities
|
4,977
|
11,410
|
8,204
|
26,719
|
|||
|
Total Restructuring Charges
|
$28,611
|
$28,804
|
$42,722
|
$124,589
|
Other Activities reflects leased facility consolidations, contract termination costs and the curtailment of certain defined benefit pension plans.
The following table summarizes the activity for the Restructuring and Reinvestment Program liability as of April 30 (in thousands):
|
Foreign
|
|||||
|
Translation &
|
|||||
|
2015
|
Charges
|
Payments
|
Reclassifications
|
2016
|
|
|
Severance
|
$18,794
|
$16,443
|
$(18,485)
|
$(95)
|
$16,657
|
|
Process reengineering consulting
|
-
|
7,191
|
(7,191)
|
-
|
-
|
|
Other activities
|
11,859
|
4,977
|
(4,188)
|
(796)
|
11,852
|
|
Total
|
$30,653
|
$28,611
|
$(29,864)
|
$(891)
|
$28,509
|
The restructuring liability for accrued Severance costs is reflected in Accrued Employment Costs in the Consolidated Statements of Financial Position. Approximately $0.6 million and $11.3 million of the Other Activities are reflected in Other Accrued Liabilities and Other Long-Term Liabilities, respectively.
76
Note 7 – Impairment Charges
In fiscal year 2014, the Company terminated a multi-year software development program for an internal operations application due to a change in the Company’s longer-term enterprise systems plans. As a result, the Company recorded an asset impairment charge for previously capitalized software costs related to the program of $4.8 million ($0.06 per share).
Note 8 – Inventories
Inventories at April 30 were as follows (in thousands):
|
2016
|
2015
|
|
|
Finished Goods
|
$45,170
|
$52,705
|
|
Work-in-Process
|
7,592
|
6,552
|
|
Paper, Cloth, and Other
|
4,867
|
4,676
|
|
57,629
|
63,933
|
|
|
Inventory Value of Estimated Sales Returns
|
4,924
|
6,555
|
|
LIFO Reserve
|
(4,774)
|
(6,709)
|
|
Total Inventories
|
$57,779
|
$63,779
|
See Note 2, Summary of Significant Accounting Policies - Sales Return Reserves for a discussion of the Inventory Value of Estimated Sales Returns.
Note 9 – Product Development Assets
Product development assets consisted of the following at April 30 (in thousands):
|
2016
|
2015
|
|
|
Composition Costs
|
$40,944
|
$41,280
|
|
Royalty Advances
|
31,182
|
28,309
|
|
Total
|
$72,126
|
$69,589
|
Composition costs are net of accumulated amortization of $199.3 million and $198.2 million as of April 30, 2016 and 2015, respectively.
Note 10 – Technology, Property and Equipment
Technology, property and equipment consisted of the following at April 30 (in thousands):
|
2016
|
2015
|
|
|
Capitalized Software and Computer Hardware
|
$539,968
|
$460,199
|
|
Buildings and Leasehold Improvements
|
84,923
|
86,225
|
|
Furniture, Fixtures and Warehouse Equipment
|
54,607
|
60,460
|
|
Land and Land Improvements
|
3,726
|
3,820
|
|
683,224
|
610,704
|
|
|
Accumulated Depreciation
|
(468,454)
|
(417,694)
|
|
Total
|
$214,770
|
$193,010
|
The net book value of capitalized software costs was $151.5 million and $121.9 million as of April 30, 2016 and 2015, respectively. Depreciation expense recognized in fiscal years 2016, 2015, and 2014 for capitalized software costs was approximately $49.6 million, $42.1 million and $36.5 million, respectively.
77
Note 11 - Goodwill and Intangible Assets
The following table summarizes the activity in goodwill by segment as of April 30 (in thousands):
|
2015
|
Acquisitions
|
Foreign Translation Adjustment
|
2016
|
|
|
Research
|
$447,326
|
-
|
$(14,025)
|
$433,301
|
|
Professional Development
|
365,215
|
-
|
3,321
|
368,536
|
|
Education
|
149,826
|
-
|
-
|
149,826
|
|
Total
|
$962,367
|
-
|
$(10,704)
|
$951,663
|
Intangible assets as of April 30 were as follows (in thousands):
|
2016
|
2015
|
|||||
|
Cost
|
Accumulated
Amortization
|
Cost
|
Accumulated
Amortization
|
|||
|
Intangible Assets with Determinable Lives
|
||||||
|
Content and Publishing Rights
|
$790,055
|
$(333,174)
|
$781,618
|
$(299,022)
|
||
|
Customer Relationships
|
224,839
|
(54,677)
|
225,239
|
(43,967)
|
||
|
Brands & Trademarks
|
30,116
|
(15,713)
|
30,008
|
(13,225)
|
||
|
Covenants not to Compete
|
1,687
|
(1,011)
|
1,343
|
(677)
|
||
|
1,046,697
|
(404,575)
|
1,038,208
|
(356,891)
|
|||
|
Intangible Assets with Indefinite Lives
|
||||||
|
Brands & Trademarks
|
147,683
|
-
|
152,332
|
-
|
||
|
Content and Publishing Rights
|
87,202
|
-
|
83,972
|
-
|
||
|
$1,281,582
|
$(404,575)
|
$1,274,512
|
$(356,891)
|
|||
Based on the current amount of intangible assets subject to amortization and assuming current foreign exchange rates, the estimated amortization expense for each of the succeeding five fiscal years are as follows: 2017 - $48 million; 2018 – $44 million; 2019 - $42 million; 2020 - $38 million and 2021 - $35 million.
Note 12 - Income Taxes
The provisions for income taxes for the years ended April 30 were as follows (in thousands):
|
2016
|
2015
|
2014
|
|
|
Current Provision
|
|||
|
US – Federal
|
$(5,365)
|
$27,137
|
$13,541
|
|
International
|
31,958
|
27,613
|
34,519
|
|
State and Local
|
1,657
|
1,007
|
(733)
|
|
Total Current Provision
|
$28,250
|
$55,757
|
$47,327
|
|
Deferred Provision (Benefit)
|
|||
|
US – Federal
|
$6,625
|
$(7,554)
|
$(1,748)
|
|
International
|
(6,459)
|
606
|
(10,008)
|
|
State and Local
|
595
|
(216)
|
(547)
|
|
Total Deferred (Benefit)
|
$761
|
$(7,164)
|
$(12,303)
|
|
Total Provision
|
$29,011
|
$48,593
|
$35,024
|
78
International and United States pretax income for the years ended April 30, 2016 were as follows (in thousands):
|
2016
|
2015
|
2014
|
|
|
International
|
$159,152
|
$165,085
|
$159,442
|
|
United States
|
15,641
|
60,376
|
36,092
|
|
Total
|
$174,793
|
$225,461
|
$195,534
|
The Company’s effective income tax rate as a percentage of pretax income differed from the U.S. federal statutory rate as shown below:
|
2016
|
2015
|
2014
|
|
|
U.S. Federal Statutory Rate
|
35.0%
|
35.0%
|
35.0%
|
|
Benefit from Lower Taxes on Non-U.S. Income
|
(14.6)
|
(11.9)
|
(10.8)
|
|
State Income Taxes, Net of U.S. Federal Tax Benefit
|
0.8
|
0.3
|
0.4
|
|
Deferred Tax Benefit From Statutory Tax Rate Change
|
(3.4)
|
-
|
(5.4)
|
|
Tax Adjustments and Other
|
(1.2)
|
(1.8)
|
(1.3)
|
|
Effective Income Tax Rate
|
16.6%
|
21.6%
|
17.9%
|
Note: A substantial portion of the Company’s income is earned outside the U.S. in jurisdictions with lower statutory income tax rates than the U.S. including: U.K. (20%): Germany (27%): Australia (30%): Canada (28%).
Deferred Tax Benefit from Statutory Tax Rate Change: In fiscal years 2016 and 2014, the Company recognized non-cash deferred tax benefits of $5.9 million ($0.10 per share), and 10.6 million ($0.18 per share), respectfully, principally associated with new tax legislation enacted in the United Kingdom (“U.K.”) that reduced the U.K. statutory income tax rates by 2% and 3%, respectively. The benefits reflect the remeasurement of all applicable U.K deferred tax balances to the new income tax rates of 19% effective April 1, 2017 and 18% effective April 1, 2020.
Tax Adjustments and Other: In fiscal years 2016, 2015 and 2014, the Company recorded tax benefits of $1.3 million, $0.7 million, and $2.6 million, respectively, related to the expiration of the statute of limitations and favorable resolutions of certain federal, state and foreign tax matters with tax authorities. In addition, in fiscal year 2015, the Company recognized a non-recurring tax benefit of $3.1 million related to tax deductions claimed on the write-up of certain foreign tax assets to fair market value.
Accounting for Uncertainty in Income Taxes:
As of April 30, 2016 and April 30, 2015, the total amount of unrecognized tax benefits were $19.9 million and $19.3 million, respectively, of which $3.5 million and $3.0 million represented accruals for interest and penalties recorded as additional tax expense in accordance with the Company’s accounting policy. Within the income tax provision for both fiscal years 2016 and 2015, the Company recorded net interest expense on reserves for unrecognized and recognized tax benefits of $0.5 million in each year. As of April 30, 2016 and April 30, 2015, the total amount of unrecognized tax benefits that, would reduce the Company’s income tax provision, if recognized, were approximately $19.2 million and $18.8 million, respectively. The Company does not expect any significant changes to the unrecognized tax benefits within the next twelve months.
79
A reconciliation of the unrecognized tax benefits included within the Other Long-Term Liabilities line item in the Consolidated Statements of Financial Position follows (in thousands):
|
2016
|
2015
|
|
|
Balance at May 1st
|
$19,349
|
$23,826
|
|
Additions for Current Year Tax Positions
|
1,077
|
503
|
|
Additions for Prior Year Tax Positions
|
533
|
519
|
|
Reductions for Prior Year Tax Positions
|
(214)
|
(595)
|
|
Foreign Translation Adjustment
|
569
|
(4,207)
|
|
Payments
|
(132)
|
-
|
|
Reductions for Lapse of Statute of Limitations
|
(1,319)
|
(697)
|
|
Balance at April 30th
|
$19,863
|
$19,349
|
Tax Audits:
The Company files income tax returns in the U.S. and various states and non-U.S. tax jurisdictions. The Company’s major taxing jurisdictions include the United States, the United Kingdom and Germany. The Company is no longer subject to income tax examinations for years prior to fiscal year 2010 in the major jurisdictions in which the Company is subject to tax. The Company’s last completed U.S. federal audit was for fiscal years 2006 through 2009, which resulted in minimal adjustments principally related to temporary differences. The IRS is currently auditing the fiscal year 2013 U.S. Federal income tax return.
In fiscal year 2003, the Company merged several of its German subsidiaries into a new operating entity which enabled the Company to increase (“step-up”) the tax deductible net asset basis of the merged subsidiaries to fair market value. The expected tax benefits to be derived from the step-up are approximately 50 million euros claimed as amortization over 15 years beginning in fiscal year 2003.
In May 2012, as part of its routine tax audit process, the German tax authorities filed a challenge to the Company’s tax position with respect to the amortization of certain stepped-up assets. The Company filed an appeal with the local finance court in September 2014. Under German tax law, the Company must pay all contested taxes and the related interest to have the right to defend its position. The Company has made all required payments to date with total deposits paid of 48 million euros through April 30, 2016. The Company expects that it will be required to deposit additional amounts up to 10 million euros plus interest for tax returns to be filed in future periods until the issue is resolved.
In October 2014, the Company received an unfavorable decision from the local finance court and is in the process of appealing the court decision. The Company’s management and its advisors continue to believe that the Company is “more likely than not” to successfully defend that the tax treatment was proper and in accordance with German tax regulations. As such, the Company has not recorded any charges related to the loss of the step-up benefit. The Company filed its appeal in January 2015. Resolution of the appeal is expected to take up to 24 months from January 2015. If the Company is ultimately successful, as expected, the tax deposits will be returned with 6% simple interest, based on current German legislation. As of April 30, 2016, the USD equivalent of the deposit and accrued interest was $62.9 million, which is recorded as Income Tax Deposits on the Consolidated Statements of Financial Position. The Company records the accrued interest at 6% within the Provision for Income Taxes in the Consolidated Statements of Income.
80
Deferred Taxes:
Deferred taxes result from temporary differences in the recognition of revenue and expense for tax and financial reporting purposes. It is more likely than not that the results of future operations will generate sufficient taxable income to realize the deferred tax assets. The significant components of deferred tax assets and liabilities at April 30 were as follows (in thousands):
|
2016
|
2015
|
|
|
Inventories
|
$5,349
|
$5,230
|
|
Intangible and Fixed Assets
|
288,769
|
297,323
|
|
Total Deferred Tax Liabilities
|
$294,118
|
$302,553
|
|
Net Operating Losses
|
$3,148
|
$4,599
|
|
Reserve for Sales Returns and Doubtful Accounts
|
6,075
|
6,922
|
|
Accrued Employee Compensation
|
29,550
|
28,093
|
|
Other Accrued Expenses
|
14,842
|
14,583
|
|
Retirement and Post-Employment Benefits
|
64,438
|
62,385
|
|
Total Deferred Tax Assets
|
$118,053
|
$116,582
|
|
Net Deferred Tax Liabilities
|
$176,065
|
$185,971
|
|
Reported As
|
||
|
Current Deferred Tax Assets
|
$11,126
|
$9,981
|
|
Non-current Deferred Tax Assets
|
2,677
|
2,995
|
|
Non-current Deferred Tax Liabilities
|
189,868
|
198,947
|
|
Net Deferred Tax Liabilities
|
$176,065
|
$185,971
|
Pretax earnings of a non-U.S. subsidiary or affiliate are subject to U.S. taxation when repatriated. The Company intends to reinvest earnings outside the U.S. except in instances where repatriating such earnings would result in no additional tax. Accordingly, the Company has not recognized U.S. tax expense on non-U.S. earnings. At April 30, 2016, the accumulated undistributed earnings of non-U.S. subsidiaries approximated $716 million. It is not practical to determine the U.S. income tax liability that would be payable if such earnings were not indefinitely reinvested.
Note 13 - Debt and Available Credit Facilities
As of April 30, 2016 and 2015, the Company’s debt of approximately $605.0 million and $750.1 million, respectively consisted of amounts due under the following revolving credit facilities:
On March 1, 2016, the Company amended and extended its existing revolving credit agreement (“RCA”) with a syndicated bank group led by Bank of America. The previous RCA consisted of a $940 million senior revolving credit facility due on November 2, 2016. The new agreement consists of a $1.1 billion five-year senior revolving credit facility payable March 1, 2021. The proceeds of the amended facility will be used for general corporate purposes including seasonal operating cash requirements investments in technology systems and new businesses, and strategic acquisitions. Under the agreement, which can be drawn in multiple currencies, the Company has the option of borrowing at the following floating interest rates: (i) at a rate based on the London Interbank Offered Rate (“LIBOR”) plus an applicable margin ranging from 0.98% to 1.50%, depending on the Company’s consolidated leverage ratio, as defined, or (ii) for U.S. dollar-denominated loans only, at the lender’s base rate plus an applicable margin ranging from zero to 0.45%, depending on the Company’s consolidated leverage ratio. The lender’s base rate is defined as the highest of (i) the U.S. federal funds effective rate plus a 0.50% margin, (ii) the Eurocurrency rate, as defined, plus a 1.00% margin, or (iii) the Bank of America prime lending rate. In addition, the Company pays a facility fee ranging from 0.15% to 0.25% depending on the Company’s consolidated leverage ratio. The Company also has the option to request an additional credit limit increase of up to $350 million in minimum increments of $50 million, subject to the approval of the lenders. The credit agreement contains certain restrictive covenants related to the Company’s consolidated leverage ratio and interest coverage ratio, which the Company was in compliance with as of April 30, 2016. Due to the fact that there are no principal payments due until the end of the agreement in fiscal year 2021, the Company has classified its entire debt obligation related to this facility as long-term which was approximately $605.0 million as of April 30, 2016. As of April 30, 2015, the entire debt obligation related to the previous facility of approximately $750.1 was classified as long-term. As part of the amendment, the Company paid $3.4 million in debt financing costs in fiscal year 2016 which were capitalized and included in the Other Assets line item in the Consolidated Statements of Financial Position.
81
On October 31, 2015, the Company renewed its U.S. dollar facility with TD Bank, N.A. which was equally ranked with the Company’s previous agreement with Bank of America - Merrill Lynch and The Royal Bank of Scotland plc, and Santander Bank. The agreement consisted of a $50 million 364-day revolving credit facility which was drawn in fiscal year 2015. The facility was terminated and fully paid off with the proceeds of the RCA refinancing on March 1, 2016.
On August 6, 2015, the Company amended its December 22, 2014 364-day U.S. dollar revolving credit facility reinstated every 30 days with Santander Bank, N.A. by increasing the facility to $100 million from $50 million. The additional $50 million was drawn during August and was used to repay a portion of the senior revolving credit facility. The facility was equally ranked with the Company’s previous agreement with Bank of America - Merrill Lynch and The Royal Bank of Scotland plc, and TD Bank, N.A. The facility was fully paid on April 29, 2016. This facility’s termination date was May 23, 2016 and was not renewed.
The Company and its subsidiaries have other lines of credit aggregating $7.2 million at various interest rates. There were no outstanding borrowings under these credit lines at April 30, 2016. Outstanding borrowings under these credit lines were approximately $0.1 million as of April 30, 2015.
The Company’s total available lines of credit as of April 30, 2016 were approximately $1.1 billion, of which approximately $0.5 billion was unused. The weighted average interest rates on total debt outstanding during fiscal years 2016 and 2015 were 1.88% and 1.93%, respectively. As of April 30, 2016 and 2015, the weighted average interest rates for the total debt were 2.12% and 1.77%, respectively. Based on estimates of interest rates currently available to the Company for loans with similar terms and maturities, the fair value of the Company’s debt approximates its carrying value.
Note 14 – Derivative Instruments and Activities
The Company, from time-to-time, enters into forward exchange and interest rate swap contracts as a hedge against foreign currency asset and liability commitments, changes in interest rates and anticipated transaction exposures, including intercompany purchases. All derivatives are recognized as assets or liabilities and measured at fair value. Derivatives that are not determined to be effective hedges are adjusted to fair value with a corresponding adjustment to earnings. The Company does not use financial instruments for trading or speculative purposes.
Interest Rate Contracts:
The Company had $605.0 million of variable rate loans outstanding at April 30, 2016, which approximated fair value. As of April 30, 2016 and 2015, the interest rate swap agreements maintained by the Company were designated as fully effective cash flow hedges as defined under Accounting Standards Codification (“ASC”) 815 “Derivatives and Hedging.” As a result, there was no impact on the Company’s Consolidated Statements of Income from changes in the fair value of the interest rate swaps as they were fully offset by changes in the interest expense on the underlying variable rate debt instruments. Under ASC 815, fully effective derivative instruments that are designated as cash flow hedges have changes in their fair value recorded initially within Accumulated Other Comprehensive Loss in the Consolidated Statements of Financial Position. As interest expense is recognized based on the variable rate loan agreements, the corresponding deferred gain or loss on the interest rate swaps is reclassified from Accumulated Other Comprehensive Loss to Interest Expense in the Consolidated Statements of Income. It is management’s intention that the notional amount of interest rate swaps be less than the variable rate loans outstanding during the life of the derivatives.
82
On April 4, 2016, the Company entered into a forward starting interest rate swap agreement which fixed a portion of the variable interest due on a variable rate debt renewal on May 16, 2016. Under the terms of the agreement, the Company will pay a fixed rate of 0.92% and receives a variable rate of interest based on one-month LIBOR (as defined) from the counterparty which is reset every month for a three-year period starting May 16, 2016 ending May 15, 2019. As of April 30, 2016, the notional amount of the interest rate swap was $350.0 million.
On August 15, 2014, the Company entered into an interest rate swap agreement which fixed a portion of the variable interest due on its variable rate loans outstanding. Under the terms of the agreement, the Company pays a fixed rate of 0.65% and receives a variable rate of interest based on one-month LIBOR (as defined) from the counterparty which is reset every month for a two-year period ending August 15, 2016. As of April 30, 2016, the notional amount of the interest rate swap was $150.0 million.
On January 15, 2014, the Company entered into a $150.0 million notional value interest rate swap agreement which fixed a portion of the variable interest due on its variable rate loans outstanding. Under the terms of the agreement which expired on January 15, 2016, the Company paid a fixed rate of 0.47% and received a variable rate of interest based on one-month LIBOR (as defined) from the counterparty which was reset every month for a two-year period.
The Company records the fair value of its interest rate swaps on a recurring basis using Level 2 inputs of quoted prices for similar assets or liabilities in active markets. The fair value of the interest rate swaps as of April 30, 2016 and 2015 was a deferred loss of $0.6 million. Based on the maturity dates of the contracts, approximately $0.1 million and $0.2 million of the deferred losses as of April 30, 2016 and 2015 were recorded in Other Accrued Liabilities, with the remaining deferred losses in each period of $0.5 million and $0.4 million recorded in Other Long-Term Liabilities, respectively. The pre-tax losses that were reclassified from Accumulated Other Comprehensive Loss into Interest Expense for fiscal years 2016, 2015 and 2014 were $0.9 million, $1.7 million and $1.3 million, respectively. Based on the amount in Accumulated Other Comprehensive Loss at April 30, 2016, approximately $0.7 million, net of tax, of unrecognized loss would be reclassified into net income in the next twelve months.
Foreign Currency Contracts:
The Company may enter into forward exchange contracts to manage the Company’s exposure on certain foreign currency denominated assets and liabilities. The forward exchange contracts are marked to market through Foreign Exchange Transaction Gains (Losses) in the Consolidated Statements of Income, and carried at their fair value in the Consolidated Statements of Financial Position with gains reported in Prepaid and Other and losses reported in Other Accrued Liabilities. Foreign currency denominated assets and liabilities are remeasured at spot rates in effect on the balance sheet date, with the effects of changes in spot rates reported in Foreign Exchange Transaction Gains (Losses).
83
As of April 30, 2016, there were two open forward exchange contracts with notional amounts of 31 million Euros and 274 million Pounds Sterling to hedge intercompany loans. As of April 30, 2015, the Company did not maintain any open forward contracts. During fiscal years 2014 through 2016, the Company did not designate any forward exchange contracts as hedges under current accounting standards as the benefits of doing so were not material due to the short-term nature of the contracts. The fair value changes in the forward exchange contracts substantially mitigated the changes in the value of the applicable foreign currency denominated assets and liabilities. The fair value of the open forward exchange contracts was measured on a recurring basis using Level 2 inputs. For fiscal years 2016, 2015 and 2014, the gains (losses) recognized on forward contracts were $1.3 million, $(11.2) million, and $(0.4) million, respectively.
Note 15 - Commitment and Contingencies
The following schedule shows the composition of rent expense for operating leases (in thousands):
|
2016
|
2015
|
2014
|
|
|
Minimum Rental
|
$37,206
|
$39,748
|
$40,929
|
|
Less: Sublease Rentals
|
(597)
|
(639)
|
(642)
|
|
Total
|
$36,609
|
$39,109
|
$40,287
|
Future minimum payments under operating leases were $328.1 million at April 30, 2016. Annual minimum payments under these leases for fiscal years 2017 through 2021 are approximately $35.2 million, $20.2 million, $27.1 million, $25.0 million, and $21.4 million, respectively. Rent expense associated with operating leases that include scheduled rent increases and tenant incentives, such as rent holidays or leasehold improvement allowances, are recorded on a straight-line basis over the term of the lease. During the first quarter of fiscal year 2015, the Company renewed the lease for its corporate headquarters in Hoboken, New Jersey. The lease renewal is an operating lease which commences on July 1, 2017 and extends the current lease through March 31, 2033. As a result of the renewal, the Company’s total future minimum payments under the new lease will be $223.0 million, with annual minimum payments of $14.4 million in fiscal years 2018 through 2021.
The Company is involved in routine litigation in the ordinary course of its business. A provision for litigation is accrued when information available to the Company indicates that it is probable a liability has been incurred and the amount of loss can be reasonably estimated. Significant judgment may be required to determine both the probability and estimates of loss. When the amount of the loss can only be estimated within a range, the most likely outcome within that range is accrued. If no amount within the range is a better estimate than any other amount, the minimum amount within the range is accrued. When uncertainties exist related to the probable outcome of litigation and/or the amount or range of loss, the Company does not record a liability, but discloses facts related to the nature of the contingency and possible losses if management considers the information to be material. Reserves for legal defense costs are recorded when management believes such future costs will be material. The accruals for loss contingencies and legal costs are reviewed regularly and may be adjusted to reflect updated information on the status of litigation and advice of legal counsel. In the opinion of management, the ultimate resolution of all pending litigation as of April 30, 2016 will not have a material effect upon the financial condition or results of operations of the Company.
Over the past few years, the Company has from time to time faced claims from photographers or agencies that the Company has used photographs without licenses or beyond licensed permissions. The Company has insurance coverage for a significant portion of such claims. The Company does not believe that its exposure to such claims either individually or in the aggregate is material.
84
Note 16 - Retirement Plans
The Company and its principal subsidiaries have retirement plans that cover substantially all employees. The plans generally provide for employee retirement between the ages of 60 and 65, and benefits based on length of service and compensation, as defined.
Recent Plan Curtailments
In fiscal year 2013, the Company’s Board of Directors approved plan amendments that froze the U.S. Employees’ Retirement Plan, Supplemental Benefit Plan, and Supplemental Executive Retirement Plan, effective June 30, 2013. These plans are U.S. defined benefit plans. Under the amendments, no new employees are permitted to enter these plans and no additional benefits for current participants for future services will be accrued after June 30, 2013.
The Company’s Board of Directors approved plan amendments that froze the Retirement Plan for the Employees of John Wiley & Sons, Canada, effective December 31, 2015. Under the amendments, no new employees are permitted to enter this plan and no additional benefits for current participants for future services will be accrued after December 31, 2015. The Company recorded a one-time pension plan benefit of $0.6 million in fiscal year 2015 as a result of the plan amendments. The curtailment benefit is included within the fiscal year 2015 Restructuring Charges line item in the Consolidated Statements of Income.
The Company’s Board of Directors approved plan amendments that froze the Retirement Plan for the Employees of John Wiley & Sons, Ltd., a U.K. plan, effective April 30, 2015. Under the amendments, no new employees are permitted to enter this plan and no additional benefits for current participants for future services will be accrued after April 30, 2015. While there was no significant amount recorded for the curtailment, there was a resulting concession with employees to contribute an additional $0.8 million to the Company’s defined contribution plans in fiscal year 2015. This contribution was recognized in the Restructuring charges line item in the Company’s Consolidated Statements of Income.
The Company maintains the Supplemental Executive Retirement Plan for certain officers and senior management which provides for the payment of supplemental retirement benefits after the termination of employment for 10 years or in a lifetime annuity. Under certain circumstances, including a change of control as defined, the payment of such amounts could be accelerated on a present value basis. Future accrued benefits to the Plan have been discontinued as noted above.
The components of net pension expense for the defined benefit plans and the weighted-average assumptions were as follows (in thousands):
|
2016
|
2015
|
2014
|
||||||
|
U.S.
|
Non-U.S.
|
U.S.
|
Non-U.S.
|
U.S.
|
Non-U.S.
|
|||
|
Service Cost
|
$ -
|
$1,455
|
$ -
|
$5,942
|
$ -
|
$8,066
|
||
|
Interest Cost
|
13,612
|
16,446
|
13,159
|
17,417
|
12,613
|
17,144
|
||
|
Expected Return on Plan Assets
|
(14,756)
|
(25,088)
|
(13,782)
|
(22,654)
|
(14,838)
|
(21,607)
|
||
|
Net Amortization of Prior Service Cost and Transition Asset
|
(154)
|
55
|
(115)
|
68
|
-
|
124
|
||
|
Recognized Net Actuarial Loss
|
2,240
|
2,475
|
1,470
|
6,299
|
5,681
|
7,490
|
||
|
Curtailment/Settlement Loss (Gain)
|
1,857
|
-
|
-
|
(428)
|
-
|
79
|
||
|
Net Pension Charge (Credit)
|
$2,799
|
$(4,657)
|
$732
|
$6,644
|
$3,456
|
$11,296
|
||
|
Discount Rate
|
4.2%
|
3.5%
|
4.7%
|
4.2%
|
4.2%
|
4.2%
|
||
|
Rate of Compensation Increase
|
N/A
|
3.0%
|
N/A
|
3.2%
|
N/A
|
3.2%
|
||
|
Expected Return on Plan Assets
|
6.8%
|
6.7%
|
6.8%
|
6.7%
|
8.0%
|
6.7%
|
||
85
The curtailment/settlement loss in fiscal year 2016 of $1.9 million, noted above, relates to a disability payment made subject to terms of the Company’s Supplemental Executive Retirement Plan.
The projected benefit obligation, accumulated benefit obligation, and fair value of plan assets for the retirement plans with accumulated benefit obligations in excess of plan assets were $797.4 million, $759.2 million and $567.8 million, respectively, as of April 30, 2016 and $813.3 million, $773.4 million and $589.9 million, respectively, as of April 30, 2015.
The Recognized Net Actuarial Loss for each fiscal year is calculated using the “corridor method” which reflects the amortization of the net loss at the beginning of the fiscal year in excess of 10% of the greater of the market value of plan assets or the projected benefit obligation. The amortization period is based on the average expected life of plan participants.
The Company recognizes the overfunded or underfunded status of defined benefit postretirement plans, measured as the difference between the fair value of plan assets and the projected benefit obligation, in the Consolidated Statements of Financial Position. The change in the funded status of the plan is recognized within Accumulated Other Comprehensive Loss in the Consolidated Statements of Financial Position. Plan assets and obligations are measured at fair value as of the Company’s balance sheet date.
The amounts in Accumulated Other Comprehensive Loss that are expected to be recognized as components of net periodic benefit cost during the next fiscal year are as follows (in thousands):
|
|
U.S.
|
Non-U.S.
|
Total
|
|
|
Actuarial Loss
|
$2,712
|
$2,819
|
$5,531
|
|
|
Prior Service Cost
|
(154)
|
56
|
(98)
|
|
|
Total
|
$2,558
|
$2,875
|
$5,433
|
86
The following table sets forth the changes in and the status of the Company’s defined benefit plans’ assets and benefit obligations:
|
Dollars in thousands
|
2016
|
2015
|
||
|
CHANGE IN PLAN ASSETS
|
U.S.
|
Non-U.S.
|
U.S.
|
Non-U.S.
|
|
Fair Value of Plan Assets, Beginning of Year
|
$222,966
|
$376,576
|
$207,986
|
$351,092
|
|
Actual Return on Plan Assets
|
2,610
|
(2,789)
|
23,166
|
60,997
|
|
Employer Contributions
|
9,459
|
8,450
|
3,972
|
9,701
|
|
Employee Contributions
|
-
|
68
|
-
|
1,566
|
|
Settlements
|
(4,446)
|
-
|
-
|
(2,353)
|
|
Benefits Paid
|
(14,666)
|
(14,354)
|
(12,158)
|
(7,118)
|
|
Foreign Currency Rate Changes
|
-
|
(15,467)
|
-
|
(37,309)
|
|
Fair Value, End of Year
|
$215,923
|
$352,484
|
$222,966
|
$376,576
|
|
CHANGE IN PROJECTED BENEFIT OBLIGATION
|
|
|
|
|
|
Benefit Obligation, Beginning of Year
|
$(329,388)
|
$(484,458)
|
$(285,659)
|
$(442,703)
|
|
Service Cost
|
-
|
(1,455)
|
-
|
(5,942)
|
|
Interest Cost
|
(13,612)
|
(16,446)
|
(13,159)
|
(17,417)
|
|
Employee Contributions
|
-
|
(68)
|
-
|
(1,566)
|
|
Actuarial Gain (Loss)
|
(13,020)
|
9,582
|
(45,868)
|
(83,782)
|
|
Benefits Paid
|
14,666
|
14,354
|
12,158
|
7,118
|
|
Foreign Currency Rate Changes
|
-
|
17,330
|
-
|
52,513
|
|
Curtailment
|
-
|
-
|
-
|
5,147
|
|
Settlements and Other
|
4,446
|
-
|
3,140
|
2,174
|
|
Benefit Obligation, End of Year
|
$(336,908)
|
$(461,161)
|
$(329,388)
|
$(484,458)
|
|
Funded Status
|
$(120,985)
|
$(108,677)
|
$(106,422)
|
$(107,882)
|
|
AMOUNTS RECOGNIZED IN THE STATEMENT OF FINANCIAL POSITION:
|
|
|
|
|
|
Other Noncurrent Assets
|
-
|
-
|
-
|
17
|
|
Current Pension Liability
|
(4,817)
|
(675)
|
(4,086)
|
(508)
|
|
Noncurrent Pension Liability
|
(116,168)
|
(108,002)
|
(102,336)
|
(107,391)
|
|
Net Amount Recognized in Statement of Financial Position
|
$(120,985)
|
$(108,677)
|
$(106,422)
|
$(107,882)
|
|
AMOUNTS RECOGNIZED IN ACCUMULATED OTHER COMPREHENSIVE LOSS (before tax) CONSIST OF:
|
|
|||
|
Net Actuarial (Loss)
|
$(124,087)
|
$(139,307)
|
$(103,017)
|
$(128,280)
|
|
Prior Service Cost Gain (Loss)
|
2,870
|
(521)
|
3,024
|
(555)
|
|
Total Accumulated Other Comprehensive Loss
|
$(121,217)
|
$(139,828)
|
$(99,993)
|
$(128,835)
|
|
Change in Accumulated Other Comprehensive Loss
|
$(21,224)
|
$(10,993)
|
$(31,988)
|
$(20,329)
|
|
WEIGHTED AVERAGE ASSUMPTIONS USED IN DETERMINING ASSETS AND LIABILITIES:
|
||||
|
Discount Rate
|
4.0%
|
3.5%
|
4.2%
|
3.5%
|
|
Rate of Compensation Increase
|
N/A
|
3.0%
|
N/A
|
3.0%
|
|
Accumulated Benefit Obligations
|
$(336,908)
|
$(422,861)
|
$(329,389)
|
$(444,561)
|
87
Basis for determining discount rate:
The discount rates for the United States, United Kingdom and Canadian pension plans were based on the derivation of a single-equivalent discount rate using a standard spot rate curve and the timing of expected benefit payments. The spot rate curve used is based upon a portfolio of Moody’s-rated Aa3 (or higher) corporate bonds. The discount rates for the other international plans were based on similar published indices with durations comparable to that of each plan’s liabilities.
Basis for determining the expected asset return:
The expected long-term rates of return were estimated using market benchmarks for equities, real estate, and bonds applied to each plan’s target asset allocation and are estimated by asset class including an anticipated inflation rate. The expected long-term rates are then compared to the historic investment performance of the plan assets as well as future expectations and estimated through consultation with investment advisors and actuaries.
Pension plan assets/investments:
The investment guidelines for the defined benefit pension plans are established based upon an evaluation of market conditions, plan liabilities, cash requirements for benefit payments, and tolerance for risk. Investment guidelines include the use of actively and passively managed securities. The investment objective is to ensure that funds are available to meet the plan’s benefit obligations when they are due. The investment strategy is to invest in high quality and diversified equity and debt securities to achieve our long-term expectation. The plans’ risk management practices provide guidance to the investment managers, including guidelines for asset concentration, credit rating and liquidity. Asset allocation favors a balanced portfolio, with a global aggregated target allocation of approximately 49% equity securities, 50% fixed income securities and cash, and 1% real estate. Due to volatility in the market, the target allocation is not always desirable and asset allocations will fluctuate between acceptable ranges of plus or minus 5%. The Company regularly reviews the investment allocations and periodically rebalances investments to the target allocations. The Company categorizes its pension assets into three levels based upon the assumptions (inputs) used to price the assets. Level 1 provides the most reliable measure of fair value, whereas Level 3 generally requires significant management judgment. The three levels are defined as follows:
|
·
|
Level 1: Unadjusted quoted prices in active markets for identical assets.
|
|
·
|
Level 2: Observable inputs other than those included in Level 1. For example, quoted prices for similar assets in active markets or quoted prices for identical assets in inactive markets.
|
|
·
|
Level 3: Unobservable inputs reflecting assumptions about the inputs used in pricing the asset.
|
88
The Company did not maintain any level 3 assets during fiscal years 2016 and 2015. The following tables set forth, by level within the fair value hierarchy, pension plan assets at their fair value as of April 30 (in thousands):
|
2016
|
2015
|
||||||
|
Level 1
|
Level 2
|
Total
|
Level 1
|
Level 2
|
Total
|
||
|
U.S. Plan Assets
|
|||||||
|
Equity Securities:
|
|||||||
|
U.S. Commingled Funds
|
$ -
|
$69,550
|
$69,550
|
$ -
|
$68,671
|
$68,671
|
|
|
Non-U.S. Commingled Funds
|
-
|
28,741
|
28,741
|
-
|
38,336
|
38,336
|
|
|
Fixed Income Commingled Funds
|
-
|
105,841
|
105,841
|
-
|
105,363
|
105,363
|
|
|
Real Estate
|
-
|
11,791
|
11,791
|
-
|
10,596
|
10,596
|
|
|
Total U.S. Plan Assets
|
$ -
|
$215,923
|
$215,923
|
$ -
|
$222,966
|
$222,966
|
|
|
Non-U.S. Plan Assets
|
|||||||
|
Equity Securities:
|
|||||||
|
U.S. Equities
|
$ -
|
$24,688
|
$24,688
|
$ -
|
$25,551
|
$25,551
|
|
|
Non-U.S. Equities
|
-
|
72,892
|
72,892
|
-
|
80,014
|
80,014
|
|
|
Balanced Managed Funds
|
10,070
|
32,203
|
42,273
|
10,295
|
66,707
|
77,002
|
|
|
Fixed Income Funds:
|
-
|
211,561
|
211,561
|
-
|
190,344
|
190,344
|
|
|
Other:
|
|||||||
|
Real Estate/Other
|
-
|
508
|
508
|
-
|
489
|
489
|
|
|
Cash and Cash Equivalents
|
562
|
-
|
562
|
3,176
|
-
|
3,176
|
|
|
Total Non-U.S. Plan Assets
|
$10,632
|
$341,852
|
$352,484
|
$13,471
|
$363,105
|
$376,576
|
|
|
Total Plan Assets
|
$10,632
|
$557,775
|
$568,407
|
$13,471
|
$586,071
|
$599,542
|
|
Expected employer contributions to the defined benefit pension plans in fiscal year 2017 will be approximately $17.9 million, including $8.0 million of minimum amounts required for the Company’s non-U.S. plans. From time to time, the Company may elect to make voluntary contributions to its defined benefit plans to improve their funded status.
Benefit payments to retirees from all defined benefit plans are expected to approximate $22.8 million in fiscal year 2017, $24.0 million in fiscal year 2018, $23.9 million in fiscal year 2019, $25.4 million in fiscal year 2020, $25.2 million in fiscal year 2021 and $150.9 million for fiscal years 2022 through 2026.
The Company provides contributory life insurance and health care benefits, subject to certain dollar limitations for substantially all of its eligible retired U.S. employees. The retiree health benefit will no longer be available for any employee who retires after December 31, 2017. The cost of such benefits is expensed over the years the employee renders service and is not funded in advance. The accumulated post-retirement benefit obligation recognized in the Consolidated Statements of Financial Position as of April 30, 2016 and 2015 was $2.2 million and $6.7 million, respectively. Annual expenses for these plans for fiscal years 2016, 2015 and 2014 were $0.2 million, $0.7 million and $0.9 million, respectively.
The Company has defined contribution savings plans. The Company contribution is based on employee contributions and the level of Company match. The Company may make discretionary contributions to all employees as a group. The employer cash contributions to these plans were approximately $16.3 million, $14.8 million and $13.9 million in fiscal years 2016, 2015, and 2014 respectively. Approximately $0.8 million of the fiscal year 2015 contributions were reflected in the Restructuring Charges line item as they were related to contractual obligations resulting from the curtailment of the U.K. defined benefit pension plan. The expense recorded for these plans was approximately $16.2 million, $15.2 million and $15.7 million in fiscal years 2016, 2015, and 2014 respectively.
89
Note 17 – Share-Based Compensation
All equity compensation plans have been approved by shareholders. Under the 2014 Key Employee Stock Plan, (“the Plan”), qualified employees are eligible to receive awards that may include stock options, performance-based stock awards and other restricted stock awards. Under the Plan, a maximum number of 8 million shares of Company Class A stock may be issued. As of April 30, 2016, there were approximately 5,873,090 securities remaining available for future issuance under the Plan. The Company issues treasury shares to fund awards issued under the Plan.
Stock Option Activity:
Under the terms of the Company’s stock option plan, the exercise price of stock options granted may not be less than 100% of the fair market value of the stock at the date of grant. Options are exercisable over a maximum period of 10 years from the date of grant. For fiscal years 2015 and prior, options generally vest 50% on the fourth and fifth anniversary date after the award is granted. Starting in fiscal year 2016, options vest 25% per year on April 30th. Under certain circumstances relating to a change of control, as defined, the right to exercise options outstanding may be accelerated.
The following table provides the estimated weighted average fair value for options granted each period using the Black-Scholes option-pricing model and the significant weighted average assumptions used in their determination. The expected life represents an estimate of the period of time stock options will be outstanding based on the historical exercise behavior of option recipients. The risk-free interest rate is based on the corresponding U.S. Treasury yield curve in effect at the time of the grant. The expected volatility is based on the historical volatility of the Company’s Common Stock price over the estimated life of the option while, the dividend yield is based on the expected dividend payments to be made by the Company.
|
For the Years
Ended April 30,
|
|||||
|
2016
|
2015
|
2014
|
|||
|
Fair Value of Options on Grant Date
|
$14.77
|
$16.97
|
$10.12
|
||
|
Weighted Average assumptions:
|
|||||
|
Expected Life of Options (years)
|
7.2
|
7.2
|
7.4
|
||
|
Risk-Free Interest Rate
|
2.1%
|
2.2%
|
2.1%
|
||
|
Expected Volatility
|
29.7%
|
30.9%
|
30.5%
|
||
|
Expected Dividend Yield
|
2.1%
|
1.9%
|
2.5%
|
||
|
Fair Value of Common Stock on Grant Date
|
$55.99
|
$59.70
|
$39.53
|
||
90
A summary of the activity and status of the Company’s stock option plans follows:
|
2016
|
2015
|
2014
|
|||||||||
|
Options
(in 000’s)
|
Weighted Average Exercise
Price
|
Weighted Average Remaining Term (in years)
|
Aggregate
Intrinsic
Value (in millions)
|
Options
(in 000’s)
|
Weighted Average Exercise Price
|
Options
(in 000’s)
|
Weighted Average Exercise Price
|
||||
|
Outstanding at Beginning of Year
|
1,921
|
$45.50
|
2,508
|
$42.34
|
3,732
|
$42.85
|
|||||
|
Granted
|
166
|
$55.99
|
189
|
$59.70
|
322
|
$39.53
|
|||||
|
Exercised
|
(103)
|
$40.22
|
(747)
|
$38.32
|
(1,421)
|
$42.57
|
|||||
|
Expired or Forfeited
|
(18)
|
$51.02
|
(29)
|
$49.32
|
(125)
|
$47.65
|
|||||
|
Outstanding at End of Year
|
1,966
|
$46.62
|
4.3
|
$8.6
|
1,921
|
$45.50
|
2,508
|
$42.34
|
|||
|
Exercisable at End of Year
|
1,140
|
$45.22
|
3.1
|
$5.3
|
815
|
$42.31
|
1,191
|
$39.16
|
|||
|
Vested and Expected to Vest in the Future at April 30
|
1,925
|
$46.61
|
4.3
|
$8.5
|
1,872
|
$42.91
|
2,432
|
$42.38
|
|||
The intrinsic value is the difference between the Company’s common stock price and the option grant price. The total intrinsic value of options exercised during fiscal years 2016, 2015 and 2014 was $1.5 million, $16.1 million and $12.4 million, respectively. The total grant date fair value of stock options vested during fiscal year 2016 was $5.7 million.
As of April 30, 2016, there was $2.9 million of unrecognized share-based compensation expense related to stock options, which is expected to be recognized over a period up to 4 years, or 2.2 years on a weighted average basis.
The following table summarizes information about stock options outstanding and exercisable at April 30, 2016:
|
Options Outstanding
|
Options Exercisable
|
|||||
|
Range of
Exercise Prices
|
Number of Options
(in 000’s)
|
Weighted Average Remaining Term (in years)
|
Weighted Average Exercise Price
|
Number of Options
(in 000’s)
|
Weighted Average Exercise
Price
|
|
|
$33.05 to $35.04
|
154
|
2.4
|
$34.88
|
154
|
$34.88
|
|
|
$39.53 to $40.02
|
560
|
4.4
|
$39.75
|
253
|
$40.02
|
|
|
$47.55 to $49.55
|
915
|
3.2
|
$48.65
|
692
|
$48.77
|
|
|
$55.99 to $59.70
|
337
|
7.9
|
$57.87
|
41
|
$55.99
|
|
|
Total/Average
|
1,966
|
4.3
|
$46.62
|
1,140
|
$45.22
|
|
Performance-Based and Other Restricted Stock Activity:
Under the terms of the Company’s long-term incentive plans, performance-based restricted stock awards are payable in restricted shares of the Company’s Class A Common Stock upon the achievement of certain three-year financial performance-based targets. During each three-year period, the Company adjusts compensation expense based upon its best estimate of expected performance. For fiscal years 2015 and prior, restricted performance shares vest 50% on the first and second anniversary date after the award is earned. For three year periods beginning with fiscal year 2016, restricted performance shares vest 50% at the end of the three-year performance cycle and 50% on April 30th of the following year.
91
The Company may also grant individual restricted awards of the Company’s Class A Common Stock to key employees in connection with their employment. For fiscal years 2015 and prior, the restricted shares generally vest 50% at the end of the fourth and fifth years following the date of the grant. Starting with fiscal year 2016 grants, restricted performance shares vest ratably 25% per year on the anniversary of the grant.
Under certain circumstances relating to a change of control or termination, as defined, the restrictions would lapse and shares would vest earlier. Activity for performance-based and other restricted stock awards during fiscal years 2016, 2015 and 2014 was as follows (shares in thousands):
|
2016
|
2015
|
2014
|
|||
|
Restricted Shares
|
Weighted Average Grant Date Value
|
Restricted Shares
|
Restricted Shares
|
||
|
Nonvested Shares at Beginning of Year
|
752
|
$50.64
|
745
|
837
|
|
|
Granted
|
289
|
$55.78
|
363
|
348
|
|
|
Change in shares due to performance
|
86
|
$47.27
|
(65)
|
(92)
|
|
|
Vested and Issued
|
(154)
|
$43.69
|
(159)
|
(256)
|
|
|
Forfeited
|
(58)
|
$47.61
|
(132)
|
(92)
|
|
|
Nonvested Shares at End of Year
|
915
|
$52.60
|
752
|
745
|
|
As of April 30, 2016, there was $21.2 million of unrecognized share-based compensation cost related to performance-based and other restricted stock awards, which is expected to be recognized over a period up to 5 years, or 3.2 years on a weighted average basis. Compensation expense for restricted stock awards is measured using the closing market price of the Company’s Class A Common Stock at the date of grant. The total grant date value of shares vested during fiscal years 2016, 2015 and 2014 was $7.2 million, $6.8 million and $9.7 million, respectively.
Director Stock Awards:
Under the terms of the Company’s Director Stock Plan (the “Director Plan”), each non-employee director receives an annual award of Class A Common Stock equal in value to 100% of the annual director retainer fee (excluding additional retainer fees paid to committee chairpersons), based on the stock price on the date of grant. The granted shares may not be sold or transferred during the time the non-employee director remains a director. There were 19,559; 12,131 and 12,408 shares awarded under the Director Plan for fiscal years 2016, 2015 and 2014, respectively.
Note 18 - Capital Stock and Changes in Capital Accounts
Each share of the Company’s Class B Common Stock is convertible into one share of Class A Common Stock. The holders of Class A stock are entitled to elect 30% of the entire Board of Directors and the holders of Class B stock are entitled to elect the remainder. On all other matters, each share of Class A stock is entitled to one tenth of one vote and each share of Class B stock is entitled to one vote.
During fiscal year 2014, the Board of Directors of the Company approved a share repurchase program for an additional four million shares of Class A or Class B Common Stock. During fiscal year 2016, the Company repurchased 1,432,284 shares at an average price of $48.86 per share. As of April 30, 2016, the Company has authorization from its Board of Directors to purchase up to 746,836 additional shares.
92
Note 19 - Segment Information
The Company’s operations are primarily located in the United States, Canada, Europe, Asia and Australia. Below is a description of the Company’s three operating segments:
Research serves the world’s research and scholarly communities and is the largest publisher for professional and scholarly societies. Research products include scientific, technical, medical and scholarly research journals, books, reference works, databases, clinical decision support tools, laboratory manuals and workflow tools, in the publishing areas of the physical sciences and engineering, health sciences, social science and humanities and life sciences. Research customers include academic, corporate, government, and public libraries; researchers; scientists; clinicians; engineers and technologists; scholarly and professional societies; and students and professors. The Company’s Research products are sold and distributed globally in digital and print formats through multiple channels, including research libraries and library consortia, independent subscription agents, direct sales to professional society members, bookstores, online booksellers and other customers. Publishing centers include Australia, China, Germany, India, the United Kingdom and the United States.
Professional Development acquires, develops and publishes professional information and content delivered through print and digital books, test preparation, assessments, online learning solutions and certification and training services. Communities served include business, finance, accounting, workplace learning, management, leadership, technology, behavioral health, engineering/architecture and education. Products are developed in print and digitally for worldwide distribution through multiple channels, including chain and online booksellers, libraries, colleges and universities, corporations, direct to consumer, websites, distributor networks and other online applications. Publishing centers include Australia, Germany, India, the United Kingdom and the United States.
Education produces educational content and solutions, including course management tools for instructors and students and online program services for higher education institutions. Education offers learning solutions, innovative products and services principally delivered through college bookstores, online distributors and directly to institutions, with customers having access to content in digital and custom print formats, as well as the traditional print textbook. Education’s cost-effective, flexible solutions are available in each of its publishing disciplines, including sciences, engineering, computer science, mathematics, business and accounting, statistics, geography, hospitality and the culinary arts, education, psychology and modern languages. Publishing centers include Asia, Australia, Canada, India, the United Kingdom and the United States.
Shared Services - The Company reports financial data for shared service functions, which are centrally managed for the benefit of the three global businesses, including Distribution and Operation Services, Technology and Content Management, Occupancy and Other Administration support.
As part of Wiley’s Restructuring and Reinvestment Program, the Company consolidated its marketing services functions into a single global shared service function. This newly centralized service group enables significant cost reduction opportunities, including efficiencies gained from standardized technology and centralized management. The costs of these functions were previously reported as direct operating expenses in each business segment but are now reported within Shared Services and Administrative Costs and are allocated to each business segment. In addition, the Company modified its product/service revenue categories for the Research segment. As a result, prior year amounts have been restated to reflect these same reporting methodologies. The Company uses occupied square footage of space; number of employees; units shipped; specific identification/activity-based; gross profit; revenue and number of invoices to allocate shared service costs to each business segment.
93
Segment information is as follows (in thousands):
|
For the years ended April 30,
|
|||
|
2016
|
2015
|
2014
|
|
|
RESEARCH:
|
|||
|
Revenue
|
$965,254
|
$1,040,795
|
$1,044,349
|
|
Direct Contribution to Profit
|
440,301
|
487,285
|
479,189
|
|
Allocated Shared Services and Administrative Costs:
|
|||
|
Distribution and Operation Services
|
(39,348)
|
(44,620)
|
(45,773)
|
|
Technology and Content Management
|
(98,442)
|
(96,486)
|
(99,929)
|
|
Occupancy and Other
|
(29,516)
|
(30,405)
|
(28,491)
|
|
Contribution to Profit
|
$272,995
|
$315,774
|
$304,996
|
|
PROFESSIONAL DEVELOPMENT:
|
|||
|
Revenue
|
$404,281
|
$407,023
|
$363,869
|
|
Direct Contribution to Profit
|
$167,023
|
$143,157
|
130,427
|
|
Allocated Shared Services and Administrative Costs:
|
|||
|
Distribution and Operation Services
|
(28,364)
|
(30,838)
|
(37,673)
|
|
Technology and Content Management
|
(40,951)
|
(48,002)
|
(50,426)
|
|
Occupancy and Other
|
(23,160)
|
(26,180)
|
(19,712)
|
|
Contribution to Profit
|
$74,548
|
$38,137
|
22,616
|
|
EDUCATION:
|
|||
|
Revenue
|
$357,502
|
$374,622
|
$366,977
|
|
Direct Contribution to Profit
|
118,375
|
127,729
|
124,145
|
|
Allocated Shared Services and Administrative Costs:
|
|||
|
Distribution and Operation Services
|
(15,207)
|
(12,863)
|
(15,685)
|
|
Technology and Content Management
|
(51,612)
|
(54,272)
|
(48,097)
|
|
Occupancy and Other
|
(15,688)
|
(13,950)
|
(11,769)
|
|
Contribution to Profit
|
$35,868
|
$46,644
|
48,594
|
|
Total Contribution to Profit
|
$383,411
|
$400,555
|
$376,206
|
|
Unallocated Shared Services and Administrative Costs
|
(195,298)
|
(162,816)
|
(169,533)
|
|
Foreign Exchange Transaction Gains (Losses)
|
473
|
1,742
|
(8)
|
|
Interest Expense & Other, Net
|
(13,793)
|
(14,020)
|
(11,131)
|
|
Income Before Taxes
|
$174,793
|
$225,461
|
$195,534
|
The following table reflects total shared services and administrative costs by function, which are allocated to business segments based on the methodologies described above:
|
For the years ended April 30,
|
|||
|
SHARED SERVICES AND ADMINISTRATIVE COSTS:
|
2016
|
2015
|
2014
|
|
Distribution and Operation Services
|
$83,109
|
$89,024
|
$100,310
|
|
Technology and Content Management
|
257,822
|
244,850
|
240,797
|
|
Finance
|
49,798
|
52,796
|
54,191
|
|
Other Administration
|
126,777
|
115,469
|
104,807
|
|
Restructuring Charges (see Note 6)
|
20,080
|
18,293
|
22,197
|
|
Impairment Charges (see Note 7)
|
-
|
-
|
4,786
|
|
Total
|
$537,586
|
$520,432
|
$527,088
|
94
In the fiscal year 2015, the Company modified its segment product/service revenue categories to reflect recent changes to the business, including acquisitions and restructuring. All prior periods have been revised to reflect the new categorization as follows:
|
For the years ended April 30,
|
|||
|
Total Revenue by Product/Service
|
2016
|
2015
|
2014
|
|
Journal Revenue
|
$815,614
|
$882,932
|
$870,194
|
|
Books and Custom Material
|
582,818
|
642,866
|
693,963
|
|
Online Program Management (Deltak)
|
96,469
|
81,593
|
70,179
|
|
Talent Solutions
|
108,061
|
99,052
|
33,047
|
|
Course Workflow Solutions (WileyPlus)
|
58,551
|
54,200
|
49,459
|
|
Other
|
65,524
|
61,797
|
58,353
|
|
Total
|
$1,727,037
|
$1,822,440
|
$1,775,195
|
|
|
|||
|
Total Assets
|
|||
|
Research
|
$1,216,350
|
$1,246,673
|
$1,392,373
|
|
Professional Development
|
730,434
|
695,859
|
554,146
|
|
Education
|
426,077
|
430,733
|
455,848
|
|
Corporate/Shared Services
|
548,235
|
630,978
|
674,998
|
|
Total
|
$2,921,096
|
$3,004,243
|
$3,077,365
|
|
Expenditures for Long Lived Assets
|
|||
|
Research
|
$32,294
|
$18,288
|
$23,311
|
|
Professional Development
|
15,020
|
179,174
|
59,837
|
|
Education
|
10,376
|
14,188
|
11,935
|
|
Corporate/Shared Services
|
93,705
|
69,121
|
57,564
|
|
Total
|
$151,395
|
$280,771
|
$152,647
|
|
Depreciation and Amortization
|
|||
|
Research
|
$55,646
|
$57,992
|
$62,664
|
|
Professional Development
|
37,837
|
31,943
|
28,542
|
|
Education
|
35,536
|
38,928
|
40,023
|
|
Corporate/Shared Services
|
26,830
|
25,062
|
16,868
|
|
Total
|
$155,849
|
$153,925
|
$148,097
|
Export sales from the United States to unaffiliated customers amounted to approximately $164.4 million, $168.0 million and $169.0 million in fiscal years 2016, 2015 and 2014, respectively. The pretax income for consolidated operations outside the United States was approximately $159.2 million, $165.1 million and $159.4 million in fiscal years 2016, 2015 and 2014, respectively.
95
Revenue from external customers based on the location of the customer and long-lived assets by geographic area were as follows (in thousands):
|
Revenue
|
Long-Lived Assets
(Technology, Property & Equipment)
|
||||||||||
|
|
2016
|
2015
|
2014
|
2016
|
2015
|
2014
|
|||||
|
United States
|
$884,185
|
$920,166
|
$937,106
|
$166,878
|
$143,786
|
$135,711
|
|||||
|
United Kingdom
|
153,442
|
142,680
|
127,716
|
23,246
|
24,711
|
32,286
|
|||||
|
Germany
|
69,676
|
83,714
|
89,107
|
9,629
|
9,781
|
12,877
|
|||||
|
Japan
|
76,930
|
84,420
|
80,074
|
35
|
21
|
40
|
|||||
|
China
|
52,815
|
45,159
|
41,581
|
244
|
307
|
516
|
|||||
|
India
|
38,208
|
39,494
|
39,953
|
234
|
180
|
172
|
|||||
|
Australia
|
78,786
|
80,380
|
79,453
|
1,041
|
1,696
|
2,712
|
|||||
|
France
|
49,970
|
57,492
|
25,376
|
9,517
|
6,720
|
-
|
|||||
|
Canada
|
50,243
|
56,949
|
61,559
|
1,617
|
1,606
|
729
|
|||||
|
Other Countries
|
272,782
|
311,986
|
293,270
|
2,329
|
4,202
|
3,675
|
|||||
|
Total
|
$1,727,037
|
$1,822,440
|
$1,775,195
|
$214,770
|
$193,010
|
$188,718
|
|||||
96
Supplementary Financial Information - Results By Quarter (Unaudited)
|
$ In millions, except per share data
|
2016
|
2015
|
|||||||
|
Revenue
|
|||||||||
|
First Quarter
|
$
|
422.9
|
$
|
437.9
|
|||||
|
Second Quarter
|
433.4
|
477.0
|
|||||||
|
Third Quarter
|
436.4
|
465.9
|
|||||||
|
Fourth Quarter
|
434.3
|
441.6
|
|||||||
|
Fiscal Year
|
$
|
1,727.0
|
$
|
1,822.4
|
|||||
|
Gross Profit
|
|||||||||
|
First Quarter
|
$
|
303.2
|
$
|
313.9
|
|||||
|
Second Quarter
|
316.6
|
342.4
|
|||||||
|
Third Quarter
|
316.2
|
341.7
|
|||||||
|
Fourth Quarter
|
325.1
|
324.8
|
|||||||
|
Fiscal Year
|
$
|
1,261.1
|
$
|
1,322.8
|
|||||
|
Operating Income
|
|||||||||
|
First Quarter (a)
|
$
|
44.9
|
$
|
49.6
|
|||||
|
Second Quarter (b)
|
60.3
|
76.1
|
|||||||
|
Third Quarter (c)
|
39.6
|
54.0
|
|||||||
|
Fourth Quarter (d)
|
43.3
|
58.0
|
|||||||
|
Fiscal Year
|
$
|
188.1
|
$
|
237.7
|
|||||
|
Net Income
|
|||||||||
|
First Quarter (a)
|
$
|
32.5
|
$
|
33.7
|
|||||
|
Second Quarter (b)
|
43.6
|
53.8
|
|||||||
|
Third Quarter (c)
|
35.5
|
42.5
|
|||||||
|
Fourth Quarter (d)
|
34.2
|
46.9
|
|||||||
|
Fiscal Year
|
$
|
145.8
|
$
|
176.9
|
|||||
|
2016
|
2015
|
||||||||
|
Income Per Share
|
Diluted
|
Basic
|
Diluted
|
Basic
|
|||||
|
First Quarter (a)
|
$
|
0.55
|
$
|
0.55
|
$
|
0.56
|
$
|
0.57
|
|
|
Second Quarter (b)
|
0.74
|
0.75
|
0.90
|
0.91
|
|||||
|
Third Quarter (c)
|
0.61
|
0.62
|
0.72
|
0.73
|
|||||
|
Fourth Quarter (d)
|
0.59
|
0.60
|
0.79
|
0.80
|
|||||
|
Fiscal Year
|
$
|
2.48
|
$
|
2.51
|
$
|
2.97
|
$
|
3.01
|
|
|
a)
|
In the first quarters of fiscal years 2016 and 2015, the Company recorded a restructuring charge of $3.4 million ($0.03 per share) and a restructuring credit of $(0.2) million, respectively, under its restructuring programs.
|
|
b)
|
In the second quarter of fiscal year 2016, the Company recorded a restructuring charge of $3.7 million ($0.04 per share) under its restructuring program.
|
|
c)
|
In the third quarters of fiscal years 2016 and 2015, the Company recorded restructuring charges of $13.7 million ($0.16 per share) and $24.0 million ($0.28 per share) under its restructuring programs, respectively. In the third quarter of fiscal year 2016, the Company recorded deferred tax benefits of $5.9 million ($0.10 per share) associated with tax legislation enacted in the United Kingdom that reduced the U.K. corporate income tax rates by 2%.
|
|
d)
|
In the fourth quarters of fiscal years 2016 and 2015, the Company recorded restructuring charges of $7.8 million ($0.08 per share) and $4.9 million ($0.07 per share), respectively, under its restructuring programs. In the fourth quarter of fiscal year 2015, the Company recorded a non-recurring tax benefit of $3.1 million ($0.05 per share) related to tax deductions claimed on the write-up of certain foreign tax assets to fair market value.
|
97
Schedule II
JOHN WILEY & SONS, INC., AND SUBSIDIARIES
VALUATION AND QUALIFYING ACCOUNTS
FOR THE YEARS ENDED APRIL 30, 2016, 2015, AND 2014
(Dollars in thousands)
|
Additions/ (Deductions)
|
||||
|
Description
|
Balance at Beginning of Period
|
Charged to
Expenses and Other
|
Deductions From Reserves(2)
|
Balance at End of Period
|
|
Year Ended April 30, 2016
|
||||
|
Allowance for Sales Returns (1)
|
$25,340
|
$56,094
|
$61,573
|
$19,861
|
|
Allowance for Doubtful Accounts
|
$8,290
|
$698
|
$1,734
|
$7,254
|
|
Allowance for Inventory Obsolescence
|
$21,901
|
$15,167
|
$15,100
|
$21,968
|
|
Year Ended April 30, 2015
|
||||
|
Allowance for Sales Returns (1)
|
$28,633
|
$52,848
|
$56,141
|
$25,340
|
|
Allowance for Doubtful Accounts
|
$7,946
|
$3,100(3)
|
$2,756
|
$8,290
|
|
Allowance for Inventory Obsolescence
|
$25,087
|
$17,655
|
$20,841
|
$21,901
|
|
Year Ended April 30, 2014
|
||||
|
Allowance for Sales Returns (1)
|
$31,834
|
$52,770
|
$55,971
|
$28,633
|
|
Allowance for Doubtful Accounts
|
$7,360
|
$2,441
|
$1,855
|
$7,946
|
|
Allowance for Inventory Obsolescence
|
$28,243
|
$18,202
|
$21,358
|
$25,087
|
|
|
(1)
|
Allowance for Sales Returns represents anticipated returns net of a recovery of inventory and royalty costs. The provision is reported as a reduction of gross sales to arrive at revenue and the reserve balance is reported as a reduction of Accounts Receivable with a corresponding increase in Inventories and a reduction in Accounts and Royalties Payable (See Note 2).
|
|
|
(2)
|
Deductions from reserves include foreign exchange translation adjustments and accounts written off, less recoveries.
|
|
|
(3)
|
Additions to Allowance for Doubtful Accounts includes approximately $2 million related to the CrossKnowledge acquisition on May 1, 2014.
|
98
Item 9. Changes in and Disagreements with Accountants on Accounting and Financial Disclosure
None
Item 9A. Controls and Procedures
Disclosure Controls and Procedures: The Company's Chief Executive Officer and Chief Financial Officer, together with the Chief Accounting Officer and other members of the Company's management, have conducted an evaluation of the Company’s disclosure controls and procedures as defined in Rules 13a-15(e) and 15d-15(e) under the Securities Exchange Act of 1934 (the “Exchange Act”) as of the end of the period covered by this report. Based on this evaluation, the Chief Executive Officer and Chief Financial Officer have concluded that the Company's disclosure controls and procedures were effective to ensure that information required to be disclosed by the Company in reports filed or submitted under the Exchange Act is (i) recorded, processed, summarized and reported within the time periods specified by the Securities and Exchange Commission's rules and forms and (ii) accumulated and communicated to the Company’s management, including its Chief Executive Officer and Chief Financial Officer, as appropriate to allow timely decisions regarding required disclosure.
Management’s Report on Internal Control over Financial Reporting: Our Management is responsible for establishing and maintaining adequate internal control over financial reporting, as such term is defined in Rule 13a-15(f) of the Exchange Act. Under the supervision and with the participation of our management, including our Chief Executive Officer and Chief Financial Officer, we conducted an evaluation of the effectiveness of our internal control over financial reporting based upon the framework in Internal Control – Integrated Framework (2013) issued by the Committee of Sponsoring Organizations of the Treadway Commission. Based on that evaluation, our management concluded that our internal control over financial reporting is effective as of April 30, 2016.
KPMG LLP, an independent registered public accounting firm, has audited the consolidated financial statements included in this Annual Report on Form 10-K and, as part of their audit, has issued their report, included herein, on the effectiveness of our internal control over financial reporting.
Changes in Internal Control over Financial Reporting: There were no changes in our internal control over financial reporting in the fourth quarter of fiscal year 2016 that have materially affected, or are reasonably likely to materially affect, our internal control over financial reporting.
Item 9B. Other Information
None
PART III
Item 10. Directors, Executive Officers and Corporate Governance
The name, age and background of each of the directors nominated for election are contained under the caption “Election of Directors” in the Proxy Statement for our 2016 Annual Meeting of Shareholders (“2016 Proxy Statement”) and are incorporated herein by reference.
Information on the audit committee financial experts is contained in the 2016 Proxy Statement under the caption “Report of the Audit Committee” and is incorporated herein by reference.
99
Information on the Audit Committee Charter is contained in the 2016 Proxy Statement under the caption “Committees of the Board of Directors and Certain Other Information concerning the Board.”
Information with respect to the Company’s Corporate Governance principles is publicly available on the Company’s Corporate Governance website at www.wiley.com/WileyCDA/Section/id-301708.html.
Executive Officers
Set forth below are the executive officers of the Company as of April 30, 2016. Each of the officers listed will serve until the next organizational meetings of the Board of Directors of the Company and until each of the respective successors are duly elected and qualified.
MATTHEW S. KISSNER - 62
|
|
October 2015 - Chairman of the Board, John Wiley and Sons, Inc. (Director since 2003)
|
MARK J. ALLIN – 55
|
|
June 2015 - President and Chief Executive Officer and Director, John Wiley and Sons, Inc.
|
|
|
February 2015- Executive Vice President and Chief Operating Officer- responsible for strategy and operations for all of Wiley’s businesses. (succeeded Steve Smith as President and Chief Executive Officer, effective June 1, 2015.)
|
|
|
September 2014 – Executive Vice President, Professional Development
|
|
|
August 2010 - Senior Vice President, Professional Development – responsible for leading the Company’s global Professional Development business.
|
JOHN A. KRITZMACHER – 55
|
|
July 2013 – Chief Financial Officer and Executive Vice President, Technology and Operations, John Wiley & Sons Inc. – responsible for the Company’s worldwide financial organization, strategic planning and business development, technology, internal audit, customer service, distribution and investor relations.
|
|
|
October 2012 - Senior Vice President of Business Operations, Organizational Planning & Structure at WebMD Health Corp
|
|
|
October 2008 - Chief Financial Officer and Executive Vice President of Global Crossing Ltd
|
MARY-JO O’LEARY – 53 (to be succeeded by Archana Singh effective June 30, 2016)
|
|
September 2014 – Executive Vice President, Human Resources
|
|
|
May 2013 – Senior Vice President, Human Resources
|
|
|
October 2012 – Vice President and Director, Human Resources – responsible for working with the Senior Vice President, Human Resources to manage the Company’s Global Human Resources organization.
|
|
|
July 2003 – Vice President, Marketing & Sales – responsible for managing the sales, marketing and custom publishing functions for the Company’s Education business.
|
ARCHANA SINGH - 46 (to succeed Mary-Jo O’Leary effective June 30, 2016)
|
|
2016 – Executive Vice President and Chief Human Resources Officer
|
|
|
2014 – Chief Human Resources Officer, Hay Group - responsible for aligning HR strategies and initiatives to support the organization into its’ next stage of growth. Leading all aspects of Human Resources with a strong focus on talent management, culture alignment and integration.
|
|
|
2012 – Vice President, Human Resources, Computer Science Corporation - Human Resources Leader for CSC’s enterprise business (technology consulting, application software, services and regions)
|
|
|
2008 – Corporate Vice President, Human Resources, Advanced Micro Devices (“AMD”) - Human Resources Business Partner for global sales, marketing, manufacturing, product engineering, shared services, corporate functions
|
100
GARY M. RINCK – 64
|
|
September 2014 – Executive Vice President, General Counsel
|
|
|
2004 – Senior Vice President, General Counsel – responsible for all of the Company’s legal and corporate governance functions at Wiley.
|
PHILIP CARPENTER – 60
|
|
May 2015 – Executive Vice President, Research – responsible for leading the Company’s worldwide journals publishing business.
|
|
|
September 2014 – Senior Vice President and Managing Director, Research Communications
|
|
|
May 2013 – Vice President and Managing Director, Research Communications – responsible for leading the Company’s worldwide journals publishing business, as part of the broader Research organization.
|
|
|
December 2007 – Vice President and Managing Director, SSH– responsible for leading the Company’s worldwide Social Sciences and Humanities journals publishing business, as part of the broader Research organization.
|
VINCENT MARZANO – 53
|
|
September 2014 – Senior Vice President, Treasurer
|
|
|
September 2006 - Vice President, Treasurer – responsible for global treasury operations, insurable risk management, accounts receivable, and credit and collections.
|
EDWARD J. MELANDO – 60
|
|
January 2013 – Senior Vice President, Corporate Controller– and Chief Accounting Officer – responsible for Financial Reporting, Taxes, and Financial Shared Services.
|
|
|
2002 - Vice President, Corporate Controller– responsible for Financial Reporting, Taxes and the Financial Shared Services.
|
REED ELFENBEIN – 62
|
|
May 2015 – Executive Vice President, International Development and Global Research Sales
|
|
|
May 2014 - Senior Vice President, International Development and Global Research Sales
|
|
|
October 2012 – Senior Vice President, International Development and STMS – leads team responsible for increasing market share in growing and emerging markets and leads the worldwide Research sales team.
|
|
|
February 2007 – Vice President and Managing Director, Sales and Marketing – responsible for leading the domestic and international sales and marketing teams.
|
CLAY E. STOBAUGH – 58
|
|
September 2014 – Executive Vice President & Chief Marketing Officer
|
|
|
October 2013 - Senior Vice President & Chief Marketing Officer
|
|
|
August 2011 – Senior Vice President, Corporate Marketing – responsible for strategic marketing and customer relationship management.
|
JOHN W. SEMEL – 45
|
|
May 2015- Executive Vice President and Chief Strategy Officer- responsible for developing, prioritizing, and implementing strategies that drive business growth.
|
|
|
February 2009 – Senior Vice President, Planning and Development – responsible for global acquisitions and divestitures, strategic investments, strategic planning, corporate alliances and business development.
|
101
JOAN O’NEIL - 53
|
|
November 2015 – Executive Vice President, Knowledge & Learning – responsible for leading the Company’s global Knowledge & Learning business
|
|
|
September 2014 – Senior Vice President and Managing Director, Knowledge Services, Professional Development – responsible for leading the Knowledge Services business within the Professional Development business
|
|
|
May 2013 – Vice President and Managing Director, Business, Finance & Accounting, Professional Development – responsible for leading the global business, finance and accounting programs within Professional Development
|
|
|
January 2011 – Vice President & Group Executive Publisher, Professional/Trade – responsible for the finance and accounting programs within the Professional/Trade business
|
JEFFREY L. SUGARMAN - 60
|
|
May 2015 – Executive Vice President, Talent Solutions and Education Services Group – responsible for leading Wiley’s combined Talent Solutions and Education Services (i.e. CrossKnowledge, Deltak, Profiles International and Inscape Publishing) in the corporate learning and higher education marketplaces.
|
|
|
February 2012 – Senior Vice President, Venture Development – responsible for leading execution and integration of Wiley’s talent solutions business acquisition including Inscape Publishing, CrossKnowledge and Profiles International.
|
|
|
November 2001 – President and CEO, Inscape Publishing – responsible for the transformation into an independent company after being acquired by a prominent New York-based private equity firm.
|
EDWARD J. MAY – 53
|
|
November 2013 - Corporate Secretary – responsible for Board administration and compliance with corporate regulatory requirements.
|
|
|
October 2012 - Director of Corporate Governance, Tyco International Ltd. – responsible for the governance structure and ERM program at Tyco International Ltd.
|
Item 11. Executive Compensation
Information on compensation of the directors and executive officers is contained in the 2016 Proxy Statement under the captions “Directors’ Compensation” and “Executive Compensation,” respectively, and is incorporated herein by reference.
Item 12. Security Ownership of Certain Beneficial Owners and Management and Related Stockholder Matters
Information on the beneficial ownership reporting for the directors and executive officers is contained under the caption “Section 16(a) Beneficial Ownership Reporting Compliance” within the “Beneficial Ownership of Directors and Management” section of the 2016 Proxy Statement and is incorporated herein by reference. Information on the beneficial ownership reporting for all other shareholders that own 5% of more of the Company’s Class A or Class B Common Stock is contained under the caption “Voting Securities, Record Date, Principal Holders” in the 2016 Proxy Statement and is incorporated herein by reference.
102
The following table summarizes the Company’s equity compensation plan information as of April 30, 2016:
|
Plan Category
|
Number of
securities to be
issued upon
exercise of
outstanding
options, warrants
and rights
|
Weighted-average
exercise price of
outstanding
options, warrants
and rights
|
Number of
securities remaining
available for future
issuance under equity
compensation plans
|
||
|
Equity compensation plans approved by shareholders
|
2,880,697 | $46.62 | 5,873,090 |
(1) This amount includes the following awards issued under the 2009 Key Employee Stock Plan:
|
·
|
1,965,940 shares issuable upon the exercise of outstanding stock options with a weighted average exercise price of $46.62
|
|
·
|
914,757 non-vested performance-based and other restricted stock awards. Since these awards have no exercise price, they are not included in the weighted average exercise price calculation.
|
All of the Company’s equity compensation plans are approved by shareholders.
Item 13. Certain Relationships and Related Transactions, and Director Independence
Information on related party transactions and the policies and procedures for reviewing and approving related party transactions are contained under the caption “Transactions with Related Persons” within the “Board and Committee Oversight of Risk” section of the 2016 Proxy Statement and are incorporated herein by reference.
Information on director independence is contained under the caption “Director Independence” within the “Board of Directors and Corporate Governance” section of the 2016 Proxy Statement.
Item 14. Principal Accountant Fees and Services
Information required by this item is contained in the 2016 Proxy Statement under the caption “Report of the Audit Committee” and is incorporated herein by reference.
103
PART IV
Item 15. Exhibits, Financial Statement Schedules and Reports on Form 8-K
|
(a)
|
Financial Statements and Schedules are included in the attached index on page 3 and are filed as part of this report
|
|
(b)
|
Reports on Form 8-K submitted to the Securities and Exchange Commission since the filing of the Company’s 10-Q on March 10, 2016:
|
|
Announcement of the election of director issued on Form 8-K dated May 2, 2016.
|
|
|
Earnings release on the fiscal year 2016 results issued on Form 8-K dated June 14, 2016, which included certain condensed financial statements of the Company.
|
|
|
(c)
|
Exhibits
|
|
3.1
|
Restated Certificate of Incorporation (incorporated by reference to the Company’s Report on Form 10-K for the year ended April 30, 1992).
|
|
3.2
|
Certificate of Amendment of the Certificate of Incorporation dated October 13, 1995 (incorporated by reference to the Company’s Report on Form 10-K for the year ended April 30, 1997).
|
|
3.3
|
Certificate of Amendment of the Certificate of Incorporation dated as of September 1998 (incorporated by reference to the Company’s Report on Form 10-Q for the quarterly period ended October 31, 1998).
|
|
3.4
|
Certificate of Amendment of the Certificate of Incorporation dated as of September 1999 (incorporated by reference to the Company’s Report on Form 10-Q for the quarterly period ended October 31, 1999).
|
|
3.5
|
By-Laws as Amended and Restated dated as of September 2007 (incorporated by reference to the Company’s Report on Form 10-K for the year ended April 30, 2008).
|
|
10.1
|
Amended and Restated Credit Agreement dated March 1, 2016, among the Company and Bank of America, N.A., as Administrative Agent, Swing line Lender, and L/C Issuer, and Other Lenders Party Hereto (incorporated by reference to the Company’s Report on Form 10-Q for the quarterly period ended January 31, 2016).
|
|
10.2
|
Agreement of the Lease dated as of July 14, 2014 between Hub Properties Trust as Landlord, an independent third party and John Wiley and Sons, Inc as Tenant (incorporated by reference to the Company’s Report on Form 10-Q for the quarterly period ended July 31, 2014).
|
|
10.3
|
2014 Director Stock Plan (incorporated by reference to the Company’s Report on Form 10-Q for the quarterly period ended October 31, 2014).
|
|
10.4
|
2014 Executive Annual Incentive Plan (incorporated by reference to the Company’s Report on Form 10-Q for the quarterly period ended October 31, 2014).
|
|
10.5
|
Amended 2014 Key Employee Stock Plan (incorporated by reference to the Company’s Report on Form 10-Q for the quarterly period ended October 31, 2014).
|
|
10.6
|
Supplemental Executive Retirement Plan as Amended and Restated effective as of January 1, 2009 (incorporated by reference to the Company’s Report on Form 10-K for the year ended April 30, 2010).
|
|
10.7
|
Amendments A and B to the Supplemental Executive Retirement Plan as Amended and Restated Effective January 1, 2009 (incorporated by reference to the Company’s Report on Form 10-Q for the quarterly period ended July 31, 2010).
|
|
10.8
|
Resolution amending the Supplemental Executive Retirement Plan to Cease Accruals and Freeze Participation effective June 30, 2013.
|
|
10.9
|
Supplemental Benefit Plan Amended and Restated as of January 1, 2009, including amendments through August 1, 2010 (incorporated by reference to the Company’s Report on Form 10-Q for the quarterly period ended January 31, 2011).
|
|
10.10
|
Resolution amending the Supplemental Benefit (Retirement) Plan to Cease Accruals and Freeze Participation effective June 30, 2013.
|
|
10.11
|
Deferred Compensation Plan as Amended and Restated Effective as of January 1, 2008 (incorporated by reference to the Company’s Report on Form 10-K for the year ended April 30, 2010).
|
|
10.12
|
Resolution amending the Deferred Compensation Plan effective July 1, 2013.
|
104
|
10.13
|
Deferred Compensation Plan for Directors’ 2005 & After Compensation (incorporated by reference to the Report on Form 8-K, filed December 21, 2005).
|
|
10.14*
|
Form of the Fiscal Year 2017 Qualified Executive Long Term Incentive Plan.
|
|
10.15*
|
Form of the Fiscal Year 2017 Qualified Executive Annual Incentive Plan.
|
|
10.16*
|
Form of the Fiscal Year 2017 Executive Annual Strategic Milestones Incentive Plan.
|
|
10.17
|
Form of the Fiscal Year 2016 Qualified Executive Long Term Incentive Plan (incorporated by reference to the Company’s Report on Form 10-K for the year ended April 30, 2015).
|
|
10.18
|
Form of the Fiscal Year 2016 Qualified Executive Annual Incentive Plan (incorporated by reference to the Company’s Report on Form 10-K for the year ended April 30, 2015).
|
|
10.19
|
Form of the Fiscal Year 2016 Executive Annual Strategic Milestones Incentive Plan (incorporated by reference to the Company’s Report on Form 10-K for the year ended April 30, 2015).
|
|
10.20
|
Form of the Fiscal Year 2015 Qualified Executive Long Term Incentive Plan (incorporated by reference to the Company’s Report on Form 10-K for the year ended April 30, 2014).
|
|
10.21
|
Form of the Fiscal Year 2015 Qualified Executive Annual Incentive Plan (incorporated by reference to the Company’s Report on Form 10-K for the year ended April 30, 2014).
|
|
10.22
|
Form of the Fiscal Year 2015 Executive Annual Strategic Milestones Incentive Plan (incorporated by reference to the Company’s Report on Form 10-K for the year ended April 30, 2014).
|
|
10.23
|
Senior Executive Employment Agreement to Arbitrate dated as of April 29, 2003 (incorporated by reference to the Company’s Report on Form 10-K for the year ended April 30, 2003).
|
|
10.24
|
Senior Executive Non-competition and Non-Disclosure Agreement dated as of April 29, 2003 (incorporated by reference to the Company’s Report on Form 10-K for the year ended April 30, 2003).
|
|
10.25
|
Senior executive Employment Agreement dated as of September 17, 2010 and effective as of May 1, 2011, between Stephen M. Smith and the Company (incorporated by reference to the Company’s Report on Form 8-K dated as of September 22, 2010).
|
|
10.26
|
Senior Executive Employment Agreement dated as of April 15, 2015 between Mark Allin and the Company (incorporated by reference to the Company’s Report on Form 8-K dated as of April 15, 2015).
|
|
10.27
|
Senior executive Employment Agreement dated as of May 20, 2013 between John A. Kritzmacher and the Company (incorporated by reference to the Company’s Report on Form 8-K dated as of June 4, 2013).
|
|
10.28
|
Senior executive Employment Agreement letter dated as of March 15, 2004, between Gary M. Rinck and the Company (incorporated by reference to the Company’s Report on Form 10-K for the year ended April 30, 2011).
|
|
21*
|
List of Subsidiaries of the Company
|
|
23*
|
Consent of KPMG LLP
|
|
31.1*
|
Certification of Chief Executive Officer pursuant to Section 302 of the Sarbanes-Oxley Act of 2002.
|
|
31.2*
|
Certification of the Chief Financial Officer pursuant to Section 302 of the Sarbanes-Oxley Act of 2002.
|
|
32.1*
|
Certification of the Chief Executive Officer pursuant to 18 U.S.C. Section 1350, as adopted pursuant to Section 906 of the Sarbanes-Oxley Act of 2002.
|
|
32.2*
|
Certification of Chief Financial Officer pursuant to 18 U.S.C. Section 1350, as adopted pursuant to Section 906 of the Sarbanes-Oxley Act of 2002.
|
105
|
101.INS
|
XBRL Instance Document
|
|
101.SCH
|
XBRL Taxonomy Extension Schema Document
|
|
101.CAL
|
XBRL Taxonomy Extension Calculation Linkbase Document
|
|
101.LAB
|
XBRL Taxonomy Extension Label Linkbase Document
|
|
101.PRE
|
XBRL Taxonomy Extension Presentation Linkbase Document
|
|
101.DEF
|
XBRL Taxonomy Extension Definition Linkbase Document
|
|
|
*
|
Filed herewith
|
106
SIGNATURES
Pursuant to the requirements of Section 13 or 15(d) of the Securities Exchange Act of 1934, the Company has duly caused this report to be signed on its behalf by the undersigned, thereunto duly authorized.
|
JOHN WILEY & SONS, INC.
|
|||
|
(Company)
|
|||
|
Dated: June 29, 2016
|
By:
|
/s/ Mark Allin
|
|
|
Mark Allin
|
|||
|
President and
|
|||
|
Chief Executive Officer
|
Pursuant to the requirements of the Securities Exchange Act of 1934, this report has been signed below by the following persons on behalf of the Company and in the capacities and on the dates indicated.
|
Signatures
|
Titles
|
Dated
|
|||
|
/s/ Mark Allin
|
President and Chief Executive Officer
|
June 29, 2016
|
|||
|
Mark Allin
|
Director
|
||||
|
/s/ John A. Kritzmacher
|
Chief Financial Officer and
|
June 29, 2016
|
|||
|
John A. Kritzmacher
|
Executive Vice President, Technology and Operations
|
||||
|
/s/ Edward J. Melando
|
Senior Vice President, Controller and
|
June 29, 2016
|
|||
|
Edward J. Melando
|
Chief Accounting Officer
|
||||
|
/s/ Peter Booth Wiley
|
Director
|
June 29, 2016
|
|||
|
Peter Booth Wiley
|
|||||
|
/s/ Jesse C. Wiley
|
Manager, Business Development Client Solutions and
|
June 29, 2016
|
|||
|
Jesse C. Wiley
|
Director
|
||||
|
/s/ William J. Pesce
|
Director
|
June 29, 2016
|
|||
|
William J. Pesce
|
|||||
|
/s/ William B. Plummer
|
Director
|
June 29, 2016
|
|||
|
William B. Plummer
|
|||||
|
/s/ Kalpana Raina
|
Director
|
June 29, 2016
|
|||
|
Kalpana Raina
|
|||||
|
/s/ Mari J. Baker
|
Director
|
June 29, 2016
|
|||
|
Mari J. Baker
|
|||||
|
/s/ Mathew S. Kissner
|
Director
|
June 29, 2016
|
|||
|
Mathew S. Kissner
|
|||||
|
/s/ Raymond McDaniel, Jr.
|
Director
|
June 29, 2016
|
|||
|
Raymond McDaniel, Jr.
|
|||||
|
/s/ Eduardo R. Menascé
|
Director
|
June 29, 2016
|
|||
|
Eduardo R. Menascé
|
|||||
|
/s/ George Bell
|
Director
|
June 29, 2016
|
|||
|
George Bell
|
|||||
|
/s/ Laurie Leshin
|
Director
|
June 29, 2016
|
|||
|
Laurie Leshin
|
|
||||
|
/s/ William Pence
|
Director
|
June 29, 2016
|
|||
|
William Pence
|
|
||||
107
Exhibit 21
|
SUBSIDIARIES OF JOHN WILEY & SONS, INC. (1)
|
|
|
As of April 30, 2016
|
|
|
Jurisdiction
|
|
|
In Which
|
|
|
Incorporated
|
|
|
John Wiley & Sons International Rights, Inc.
|
Delaware
|
|
Wiley.edu, LLC
|
Delaware
|
|
Wiley Brasil Divulgacao De Materiais Didaticos LTDA
Wiley Periodicals, Inc.
|
Brazil
Delaware
|
|
Wiley Publishing Services, Inc.
Wiley Subscription Services, Inc.
|
Delaware
Delaware
|
|
Inscape Publishing LLC
|
Delaware
|
|
Profiles International, LLC
|
Texas
|
|
Wiley Publishing LLC
|
Delaware
|
|
Wiley India Private Ltd.
|
India
|
|
Crossknowledge Inc.
|
Delaware
|
|
WWL Corp.
|
Delaware
|
|
John Wiley & Sons Rus LLC
|
Delaware
|
|
Wiley International, LLC
|
Delaware
|
|
John Wiley & Sons UK LLP
|
United Kingdom
|
|
John Wiley & Sons UK 2 LLP
|
United Kingdom
|
|
Wiley Japan KK
|
Japan
|
|
Wiley Europe Investment Holdings, Ltd.
|
United Kingdom
|
|
Wiley U.K. (Unlimited Co.)
|
United Kingdom
|
|
Wiley Europe Ltd.
|
United Kingdom
|
|
John Wiley & Sons, Ltd.
|
United Kingdom
|
|
John Wiley & Sons Singapore Pte. Ltd.
|
Singapore
|
|
John Wiley & Sons Commercial Service (Beijing) Co., Ltd.
|
China
|
|
J Wiley Ltd.
|
United Kingdom
|
|
John Wiley & Sons GmbH
|
Germany
|
|
Wiley-VCH Verlag GmbH & Co. KGaA
|
Germany
|
|
CrossKnowledge Group Limited
|
United Kingdom
|
|
E-Learning SAS
|
France
|
|
Epistema Sarl
|
France
|
|
Wiley Heyden Ltd.
|
United Kingdom
|
|
Wiley Distribution Services Ltd.
|
United Kingdom
|
|
Blackwell Publishing (Holdings) Ltd.
|
United Kingdom
|
|
Blackwell Science Ltd.
|
United Kingdom
|
|
Blackwell Science (Overseas Holdings)
|
United Kingdom
|
|
John Wiley & Sons A/S
|
Denmark
|
|
Blackwell Verlag GmbH
|
Germany
|
|
Wiley Publishing Japan KK
|
Japan
|
|
Blackwell Publishing (HK) Ltd.
|
Hong Kong
|
|
Wiley Publishing Australia Pty Ltd.
|
Australia
|
|
John Wiley and Sons Australia, Ltd.
|
Australia
|
|
John Wiley & Sons Canada Limited
|
Canada
|
|
John Wiley & Sons (HK) Limited
|
Hong Kong
|
|
Wiley Publishing Canada Limited
|
Canada
|
|
Simulated Biomolecular Systems, Inc.
|
Canada
|
|
(1)\ The names of other subsidiaries that would not constitute a significant subsidiary in the aggregate have been omitted.
|
|
108
Exhibit 23
CONSENT OF INDEPENDENT REGISTERED PUBLIC ACCOUNTING FIRM
The Board of Directors and Shareholders
John Wiley & Sons, Inc.:
We consent to the incorporation by reference in Registration Statement Nos. 33-62605 and 333-167697 on Form S-8 of John Wiley & Sons, Inc. (the “Company”) of our reports dated June 29, 2016, with respect to the consolidated statements of financial position of John Wiley & Sons, Inc. as of April 30, 2016 and 2015, and the related consolidated statements of income, comprehensive income, cash flows and shareholders’ equity for each of the years in the three-year period ended April 30, 2016, and the related financial statement schedule, and the effectiveness of internal control over financial reporting as of April 30, 2016, which reports appear in the April 30, 2016 annual report on Form 10-K of John Wiley & Sons, Inc.
/s/ KPMG LLP
Short Hills, New Jersey
June 29, 2016
109