Attached files
| file | filename |
|---|---|
| 8-K - 8-K - Jefferies Financial Group Inc. | d216424d8k.htm |
Leucadia National Corporation
June 2016
Note on Forward Looking Statements
This document contains “forward looking statements” within the meaning of the safe harbor provisions of Section 27A of the Securities Act of 1933 and Section 21E of the
Securities Exchange Act of 1934. Forward looking statements include statements about our future and statements that are not historical facts. These forward looking statements are usually preceded by the words “should,” “expect,”
“intend,” “may,” “will,” or similar expressions. Forward looking statements may contain expectations regarding revenues, earnings, operations, and other results, and may include statements of future performance, plans,
and objectives. Forward looking statements also include statements pertaining to our strategies for future development of our businesses and products. Forward looking statements represent only our belief or intentions regarding future events, many
of which by their nature are inherently uncertain. It is possible that the actual results may differ materially from the anticipated results indicated in these forward-looking statements. Information regarding important factors, including our Risk
Factors, that could cause actual results to differ, perhaps materially, from those in our forward looking statements is contained in reports we file with the SEC. You should read and interpret any forward looking statement together with reports we
file with the SEC.
June 2016 i
Table of Contents
Page
Leucadia Overview 1
Jefferies Overview 9
Leucadia Investments Overview 16
Appendix 32
June 2016 ii

Leucadia Overview
June
2016 1
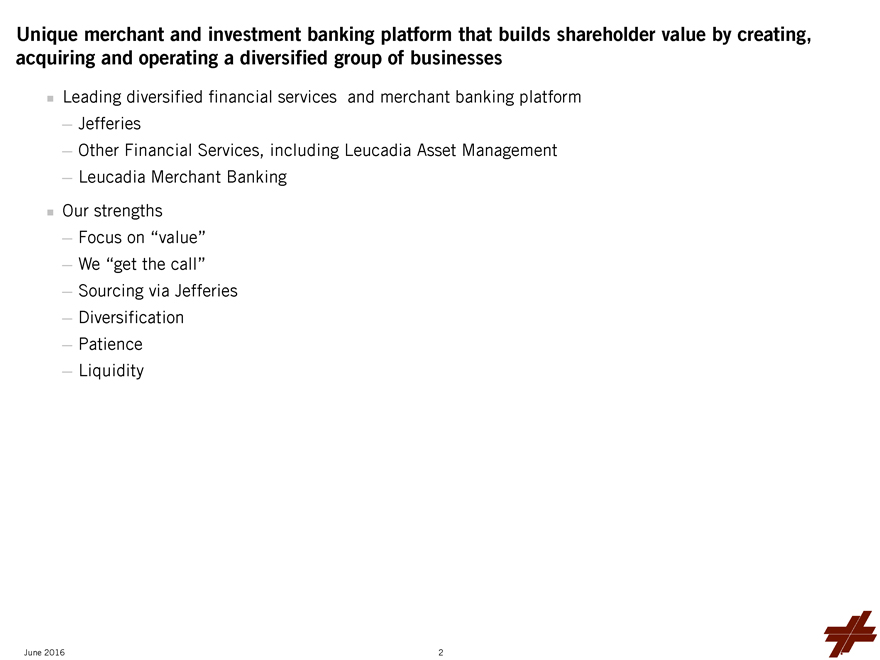
Unique merchant and investment banking platform that builds shareholder value by creating, acquiring and
operating a diversified group of businesses
Leading diversified financial services and merchant banking platform
Jefferies
Other Financial Services, including Leucadia Asset Management
Leucadia Merchant Banking
Our strengths
Focus on “value”
We “get the call”
Sourcing via Jefferies
Diversification
Patience
Liquidity
June 2016 2
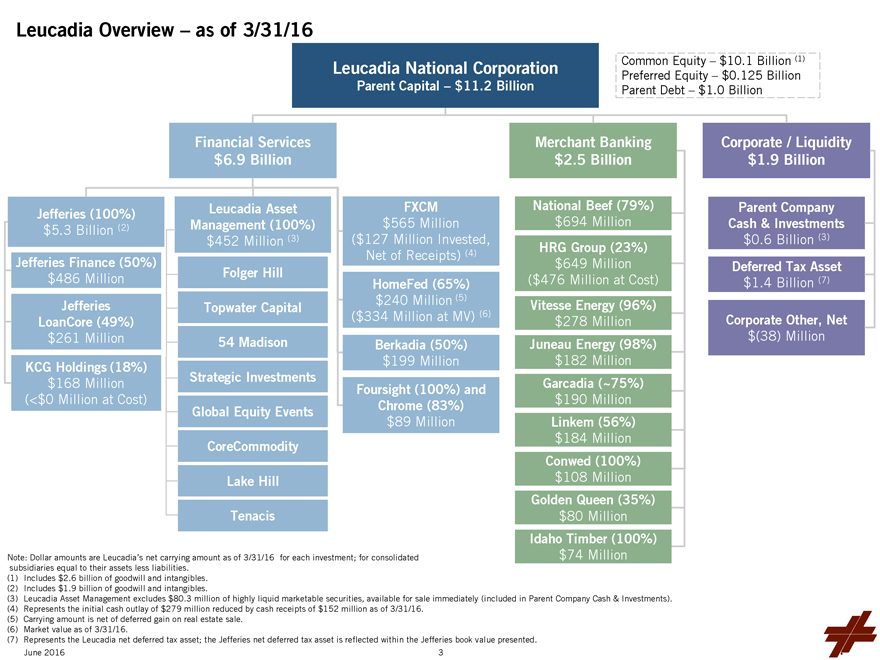
Leucadia Overview – as of 3/31/16
Leucadia National Corporation
Parent Capital – $11.2 Billion
Common Equity – $10.1 Billion (1)
Preferred Equity – $0.125 Billion
Parent Debt – $1.0 Billion
Jefferies (100%) $5.3 Billion (2)
Jefferies Finance (50%) $486 Million
Jefferies LoanCore (49%) $261 Million
KCG Holdings (18%) $168 Million (<$0 Million at Cost)
Financial Services $6.9 Billion
Leucadia Asset Management (100%) $452 Million (3)
Folger Hill Topwater
Capital 54 Madison Strategic Investments Global Equity Events CoreCommodity Lake Hill Tenacis
FXCM $565 Million ($127 Million Invested, Net of Receipts) (4)
HomeFed (65%) $240 Million (5) ($334 Million at MV) (6)
Berkadia (50%) $199
Million
Foursight (100%) and Chrome (83%) $89 Million
Merchant Banking $2.5
Billion
National Beef (79%) $694 Million
HRG Group (23%) $649 Million ($476
Million at Cost)
Vitesse Energy (96%) $278 Million
Juneau Energy (98%) $182
Million
Garcadia (~75%) $190 Million
Linkem (56%) $184 Million
Conwed (100%) $108 Million
Golden Queen (35%) $80 Million
Idaho Timber (100%) $74 Million
Corporate / Liquidity $1.9 Billion
Parent Company Cash & Investments $0.6 Billion (3)
Deferred Tax Asset $1.4 Billion (7)
Corporate Other, Net $(38) Million
Note: Dollar amounts are Leucadia’s
net carrying amount as of 3/31/16 for each investment; for consolidated subsidiaries equal to their assets less liabilities.
(1) Includes $2.6 billion of goodwill
and intangibles.
(2) Includes $1.9 billion of goodwill and intangibles.
(3)
Leucadia Asset Management excludes $80.3 million of highly liquid marketable securities, available for sale immediately (included in Parent Company Cash & Investments).
(4) Represents the initial cash outlay of $279 million reduced by cash receipts of $152 million as of 3/31/16.
(5) Carrying amount is net of deferred gain on real estate sale.
(6) Market value as of
3/31/16.
(7) Represents the Leucadia net deferred tax asset; the Jefferies net deferred tax asset is reflected within the Jefferies book value presented.
June 2016 3
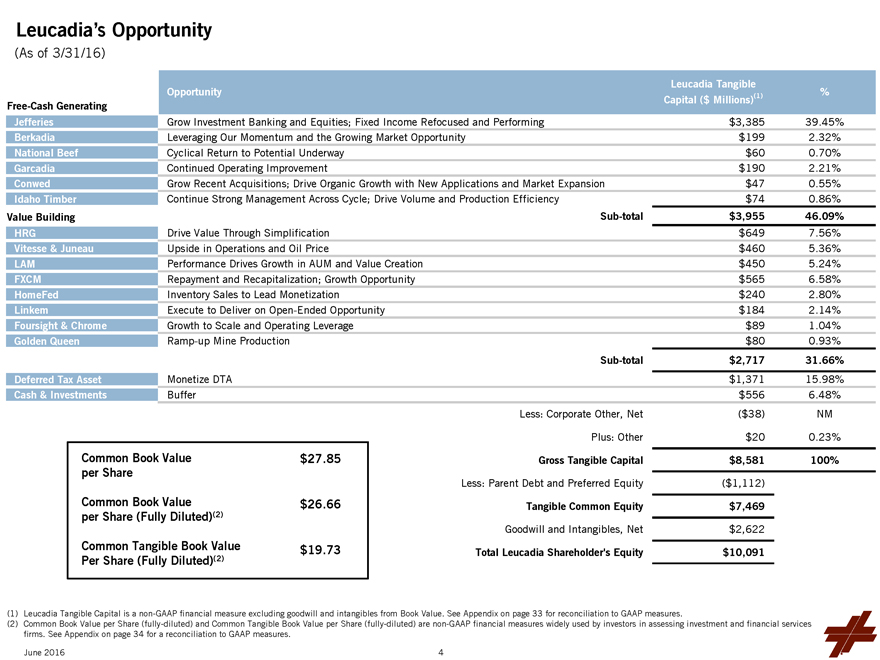
Leucadia’s Opportunity
(As of 3/31/16)
Free-Cash Generating Opportunity Leucadia Tangible Capital ($
Millions)(1) %
Jefferies Grow Investment Banking and Equities; Fixed Income Refocused and Performing $3,385 39.45%
Berkadia Leveraging Our Momentum and the Growing Market Opportunity $199 2.32%
National Beef
Cyclical Return to Potential Underway $60 0.70%
Garcadia Continued Operating Improvement $190 2.21%
Conwed Grow Recent Acquisitions; Drive Organic Growth with New Applications and Market Expansion $47 0.55%
Idaho Timber Continue Strong Management Across Cycle; Drive Volume and Production Efficiency $74 0.86%
Value Building Sub-total $3,955 46.09%
HRG Drive Value Through Simplification $649 7.56%
Vitesse & Juneau Upside in Operations and Oil Price $460 5.36%
LAM
Performance Drives Growth in AUM and Value Creation $450 5.24%
FXCM Repayment and Recapitalization; Growth Opportunity $565 6.58%
HomeFed Inventory Sales to Lead Monetization $240 2.80%
Linkem Execute to Deliver on
Open-Ended Opportunity $184 2.14%
Foursight & Chrome Growth to Scale and Operating Leverage $89 1.04%
Golden Queen Ramp-up Mine Production $80 0.93%
Sub-total $2,717 31.66%
Deferred Tax Asset Monetize DTA $1,371 15.98%
Cash & Investments Buffer $556 6.48%
Less: Corporate Other, Net ($38) NM
Plus: Other $20 0.23%
Gross Tangible Capital $8,581 100%
Less: Parent Debt and Preferred Equity ($1,112)
Tangible Common Equity $7,469
Goodwill and Intangibles, Net $2,622
Total Leucadia Shareholder’s Equity $10,091
Common Book Value per Share $27.85
Common Book Value per Share (Fully Diluted)(2) $26.66
Common Tangible Book
Value Per Share (Fully Diluted)(2) $19.73
(1) Leucadia Tangible Capital is a non-GAAP financial measure excluding goodwill and intangibles from Book Value. See
Appendix on page 33 for reconciliation to GAAP measures.
(2) Common Book Value per Share (fully-diluted) and Common Tangible Book Value per Share (fully-diluted)
are non-GAAP financial measures widely used by investors in assessing investment and financial services firms. See Appendix on page 34 for a reconciliation to GAAP measures.
June 2016 4
Leucadia Strategy and Overview
Leucadia Business Update
Jefferies recorded solid Equities and Fixed Income results in Q2
2016; Investment Banking backlog showing encouraging improvement
National Beef is benefiting from cyclical uplift – Q1 2016 pre-tax income of $21.4 million
and EBITDA of $44.9 million(1)
Our other businesses continue to perform well and, we believe, have significant upside value potential
FXCM’s business continues to recover and holds prospects for significant long-term value creation; mark-to-market GAAP income statement volatility will decline following the
2016 restructuring of Leucadia’s interest
Leucadia Asset Management provides the foundation of an asset management platform with long-term, growing fee
generation potential
(1) EBITDA is a non-GAAP measure. See Appendix on page 37 for a reconciliation to GAAP measures.
June 2016 5
A Unique and Diversified Financial Services and Merchant Banking Platform
Financial Services - Our historic sector; post-crisis opportunity
- Jefferies
Drive market share, margin expansion and earnings growth by growing Investment Banking, Equities and Fixed Income; Jefferies is delivering better results with lower risk and lower
volatility, with no meaningful loss of opportunity given changing competitive environment
Jefferies Finance and Jefferies LoanCore - maintain liquidity and risk
discipline; execute on the opportunity and momentum of our corporate and commercial real estate lending platforms over the medium-term
KCG Holdings - significant
interest in a leading global electronic market maker (>100% of cost recovered)
- Berkadia
3rd largest U.S. Primary and Master Servicer
Leader in multifamily lending in 2015
Become the best full-service mortgage banking firm in the industry
Build out geographic
coverage, products and capabilities to drive profitability and cash flow (>100% of cost recovered)
- FXCM
#1 retail foreign exchange broker by volume in Q4 2015
Opportunistic and well-structured
investment, with significant near and long-term value creation potential
Counter-cyclical performance relative to Jefferies’ core business
Amended agreements will support maximum values for assets sold, retain and motivate FXCM management and diminish volatility in reported results
- Leucadia Asset Management
Leverage Leucadia’s brand, Jefferies’ relationships and
Leucadia capital to own significant general partnership stakes in differentiated alternative asset management strategies (business model inherently avoids goodwill and acquisition costs)
June 2016
6
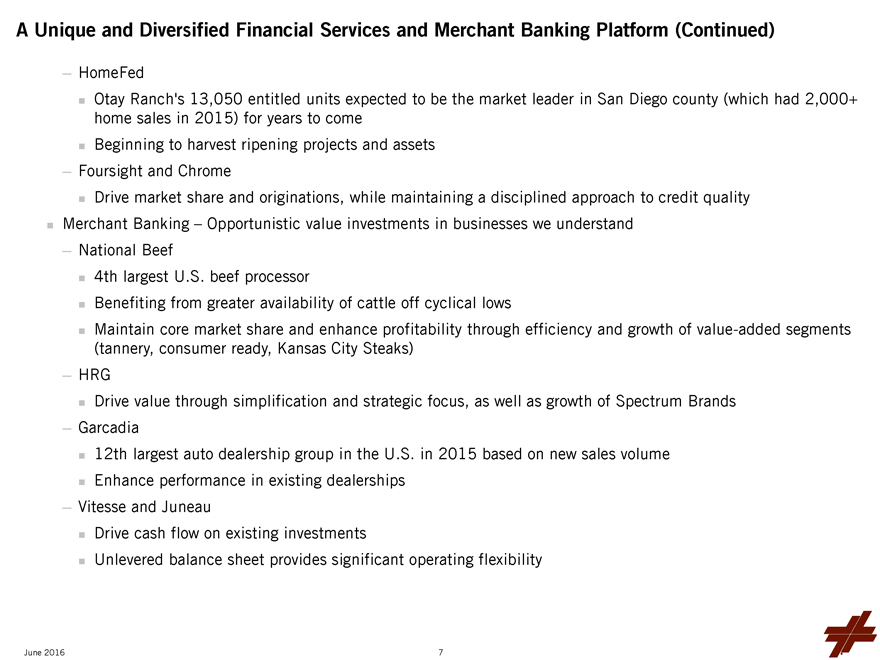
A Unique and Diversified Financial Services and Merchant Banking Platform (Continued)
- HomeFed
Otay Ranch’s 13,050 entitled units expected to be the market leader in San
Diego county (which had 2,000+ home sales in 2015) for years to come
Beginning to harvest ripening projects and assets
- Foursight and Chrome
Drive market share and originations, while maintaining a disciplined
approach to credit quality
Merchant Banking - Opportunistic value investments in businesses we understand
- National Beef
4th largest U.S. beef processor
Benefiting from greater availability of cattle off cyclical lows
Maintain core market share
and enhance profitability through efficiency and growth of value-added segments (tannery, consumer ready, Kansas City Steaks)
- HRG
Drive value through simplification and strategic focus, as well as growth of Spectrum Brands
-
Garcadia
12th largest auto dealership group in the U.S. in 2015 based on new sales volume
Enhance performance in existing dealerships
- Vitesse and Juneau
Drive cash flow on existing investments
Unlevered balance sheet provides significant operating
flexibility
June 2016
7
A Unique and Diversified Financial Services and Merchant Banking Platform (Continued)
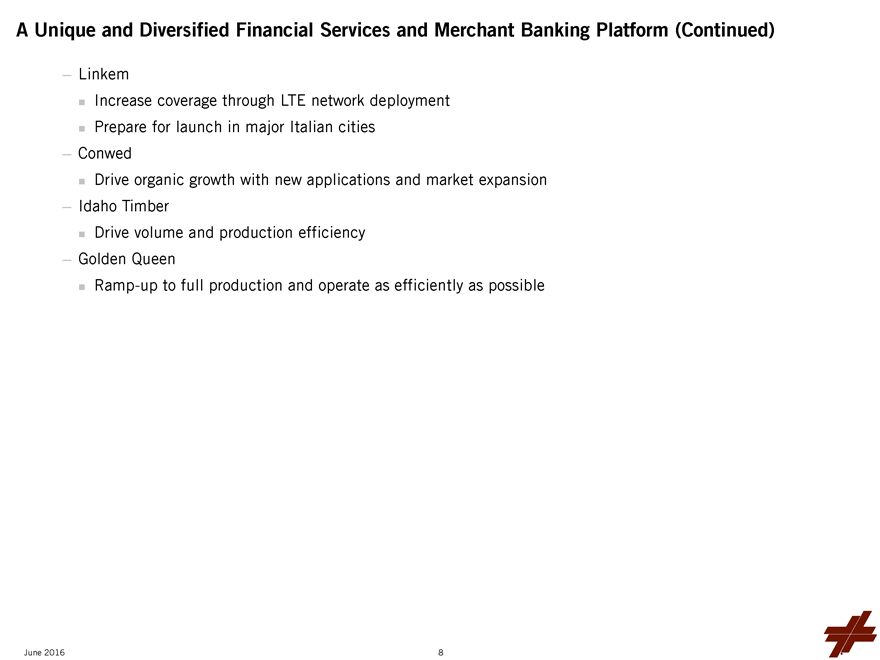
- Linkem
Increase coverage through LTE network deployment
Prepare for launch in major Italian cities
- Conwed
Drive organic growth with new applications and market expansion
- Idaho Timber
Drive volume and production efficiency
- Golden Queen
Ramp-up to full production and operate as efficiently as possible
June 2016
8

Jefferies Overview
June
2016
9
Jefferies Strategic
Update
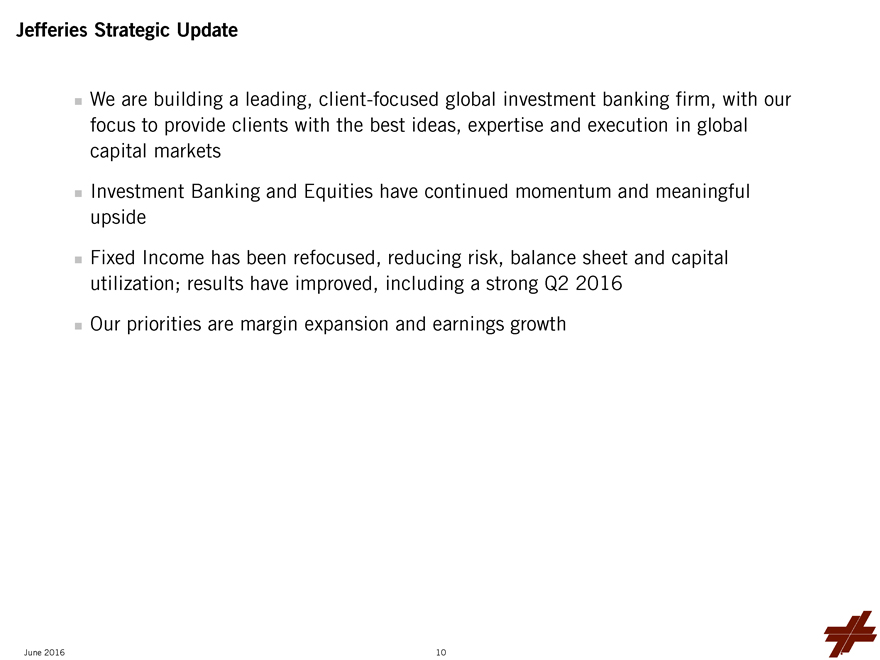
We are building a leading, client-focused global investment banking firm, with our focus to provide clients with the best ideas, expertise and execution in
global capital markets
Investment Banking and Equities have continued momentum and meaningful upside
Fixed Income has been refocused, reducing risk, balance sheet and capital utilization; results have improved, including a strong Q2 2016
Our priorities are margin expansion and earnings growth
June 2016
10
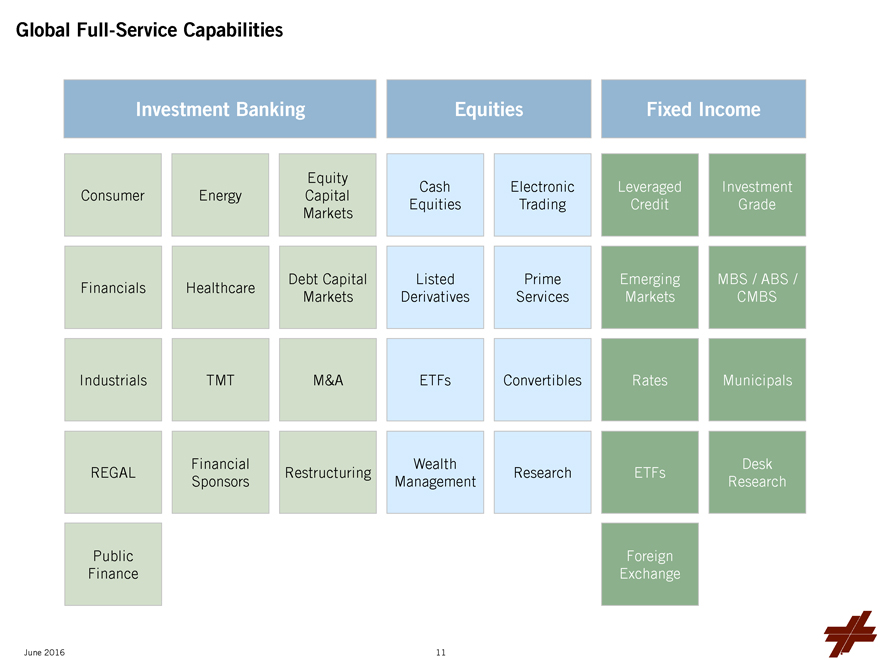
Global Full-Service Capabilities
Investment Banking
Consumer Energy Equity Capital Markets
Financials Healthcare Debt Capital Markets
Industrials TMT M&A
REGAL Financial Sponsors Restructuring
Public Finance
Equities
Cash Equities Electronic Trading
Listed Derivatives Prime Services
ETFs Convertibles
Wealth Management Research
Fixed Income
Leveraged Credit
Investment Grade
Emerging Markets
MBS / ABS / CMBS
Rates
Municipals
ETFs
Desk Research
Foreign Exchange
June 2016
11
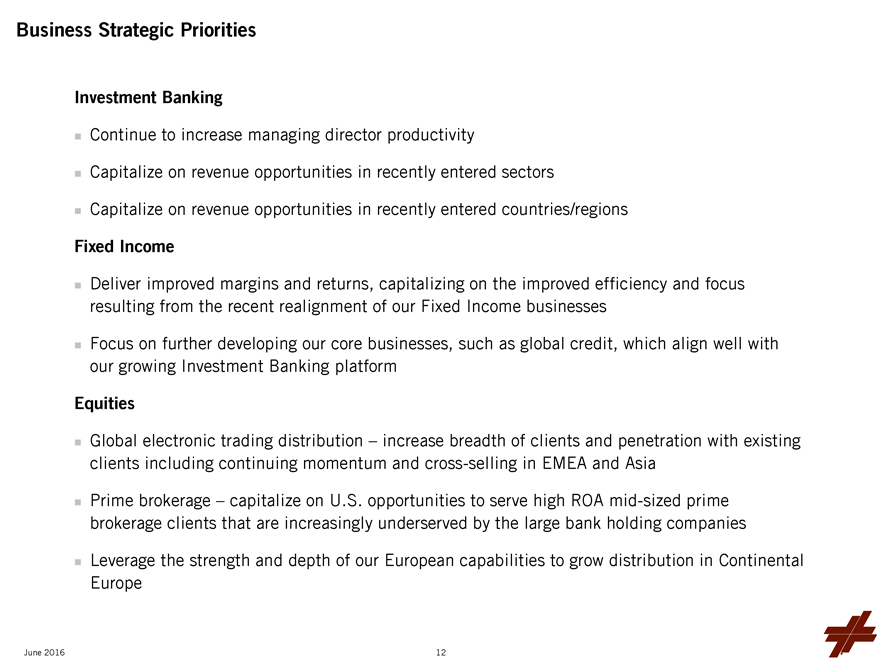
Business Strategic Priorities
Investment Banking
Continue to increase managing director productivity
Capitalize on revenue opportunities in recently entered sectors
Capitalize on revenue
opportunities in recently entered countries/regions
Fixed Income
Deliver
improved margins and returns, capitalizing on the improved efficiency and focus resulting from the recent realignment of our Fixed Income businesses
Focus on
further developing our core businesses, such as global credit, which align well with our growing Investment Banking platform
Equities
Global electronic trading distribution - increase breadth of clients and penetration with existing clients including continuing momentum and cross-selling in EMEA and Asia
Prime brokerage - capitalize on U.S. opportunities to serve high ROA mid-sized prime brokerage clients that are increasingly underserved by the large bank holding
companies
Leverage the strength and depth of our European capabilities to grow distribution in Continental Europe
June 2016
12
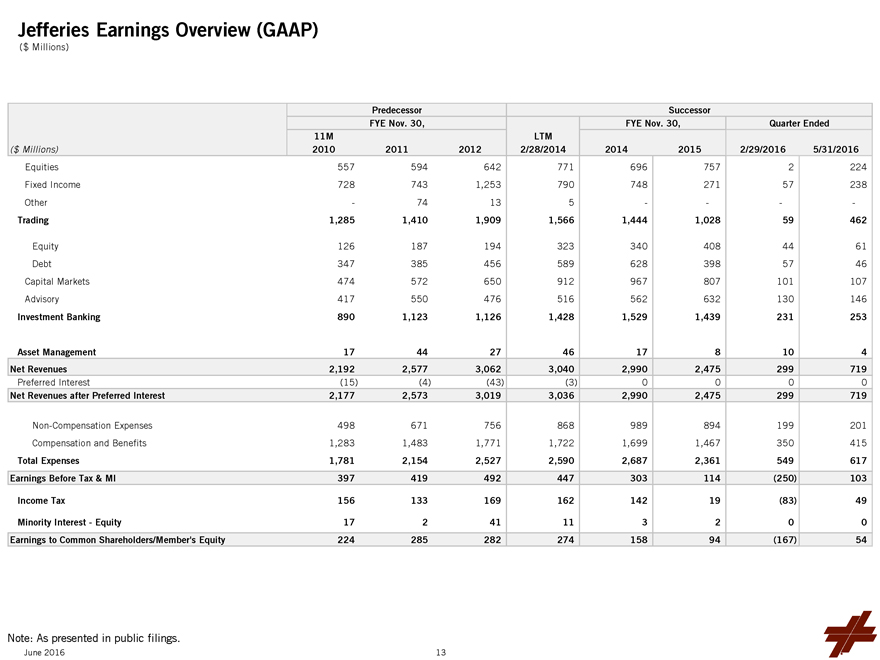
Jefferies Earnings Overview (GAAP)
($ Millions)
Predecessor Successor
FYE Nov. 30, FYE Nov. 30, Quarter Ended
($ Millions) 11M 2010 2011 2012 LTM 2/28/2014 2014
2015 2/29/2016 5/31/2016
Equities 557 594 642 771 696 757 2 224
Fixed Income
728 743 1,253 790 748 271 57 238
Other - 74 13 5 - - - -
Trading 1,285 1,410
1,909 1,566 1,444 1,028 59 462
Equity 126 187 194 323 340 408 44 61
Debt 347
385 456 589 628 398 57 46
Capital Markets 474 572 650 912 967 807 101 107
Advisory 417 550 476 516 562 632 130 146
Investment Banking 890 1,123 1,126
1,428 1,529 1,439 231 253
Asset Management 17 44 27 46 17 8 10 4
Net Revenues
2,192 2,577 3,062 3,040 2,990 2,475 299 719
Preferred Interest (15) (4) (43) (3) 0 0 0 0
Net Revenues after Preferred Interest 2,177 2,573 3,019 3,036 2,990 2,475 299 719
Non-Compensation Expenses 498 671 756 868 989 894 199 201
Compensation and
Benefits 1,283 1,483 1,771 1,722 1,699 1,467 350 415
Total Expenses 1,781 2,154 2,527 2,590 2,687 2,361 549 617
Earnings Before Tax & MI 397 419 492 447 303 114 (250) 103
Income Tax 156 133 169 162 142
19 (83) 49
Minority Interest - Equity 17 2 41 11 3 2 0 0
Earnings to Common
Shareholders/Member’s Equity 224 285 282 274 158 94 (167) 54
Note: As presented in public filings.
June 2016
13
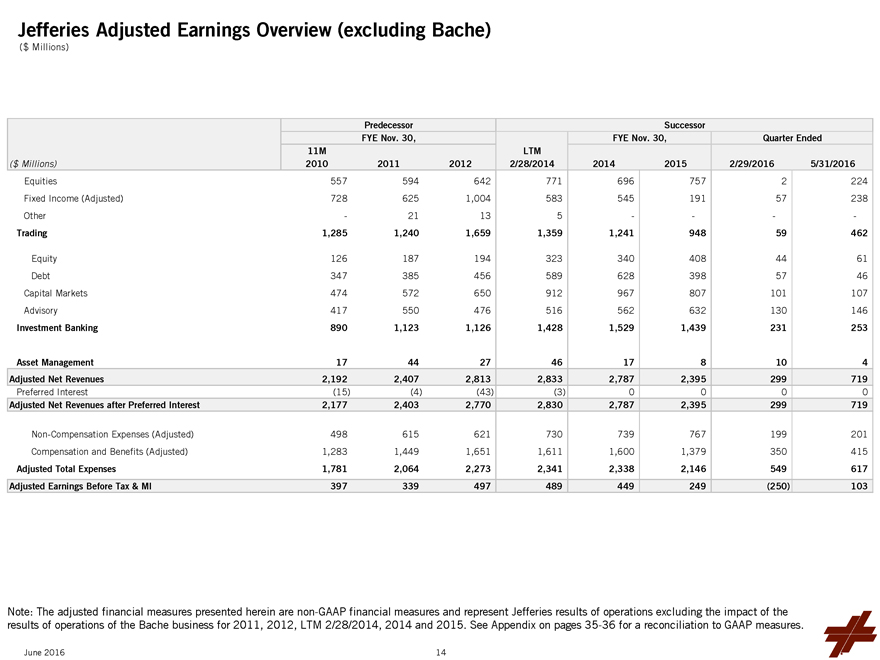
Jefferies Adjusted Earnings Overview (excluding Bache)
($ Millions)
Predecessor Successor
FYE Nov. 30, FYE Nov. 30, Quarter Ended
11M LTM
($ Millions) 2010 2011 2012 2/28/2014 2014 2015 2/29/2016 5/31/2016
Equities 557 594 642 771
696 757 2 224
Fixed Income (Adjusted) 728 625 1,004 583 545 191 57 238
Other
- 21 13 5 - - - -
Trading 1,285 1,240 1,659 1,359 1,241 948 59 462
Equity 126
187 194 323 340 408 44 61
Debt 347 385 456 589 628 398 57 46
Capital Markets
474 572 650 912 967 807 101 107
Advisory 417 550 476 516 562 632 130 146
Investment Banking 890 1,123 1,126 1,428 1,529 1,439 231 253
Asset Management
17 44 27 46 17 8 10 4
Adjusted Net Revenues 2,192 2,407 2,813 2,833 2,787 2,395 299 719
Preferred Interest (15) (4) (43) (3) 0 0 0 0
Adjusted Net Revenues after Preferred Interest
2,177 2,403 2,770 2,830 2,787 2,395 299 719
Non-Compensation Expenses (Adjusted) 498 615 621 730 739 767 199 201
Compensation and Benefits (Adjusted) 1,283 1,449 1,651 1,611 1,600 1,379 350 415
Adjusted
Total Expenses 1,781 2,064 2,273 2,341 2,338 2,146 549 617
Adjusted Earnings Before Tax & MI 397 339 497 489 449 249 (250) 103
Note: The adjusted financial measures presented herein are non-GAAP financial measures and represent Jefferies results of operations excluding the impact of the results of
operations of the Bache business for 2011, 2012, LTM 2/28/2014, 2014 and 2015. See Appendix on pages 35-36 for a reconciliation to GAAP measures.
June 2016 14
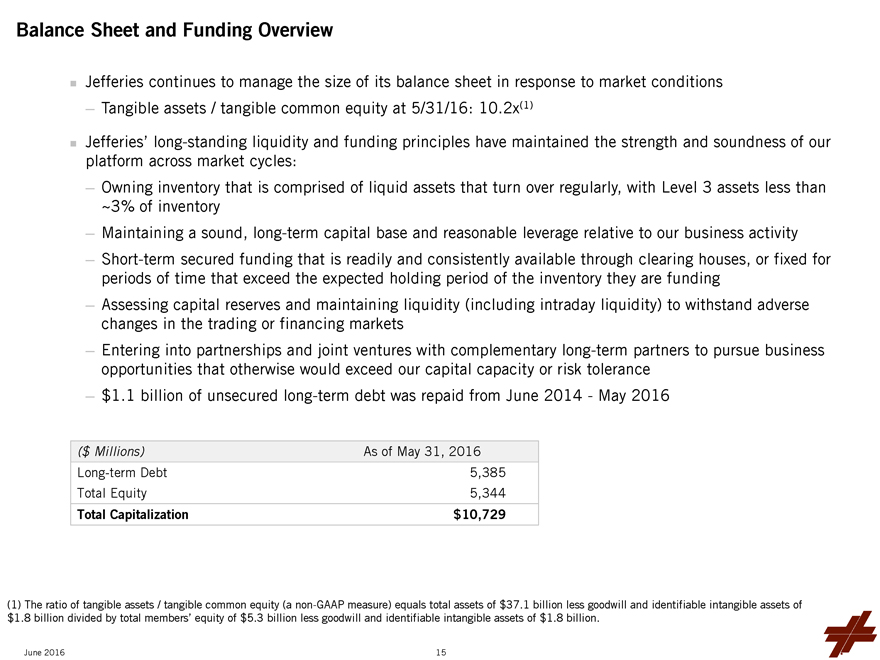
Balance Sheet and Funding Overview
Jefferies continues to manage the size of its balance sheet in response to market conditions
-
Tangible assets / tangible common equity at 5/31/16: 10.2x(1)
Jefferies’ long-standing liquidity and funding principles have maintained the strength and
soundness of our platform across market cycles:
- Owning inventory that is comprised of liquid assets that turn over regularly, with Level 3 assets less than ~3%
of inventory
- Maintaining a sound, long-term capital base and reasonable leverage relative to our business activity
- Short-term secured funding that is readily and consistently available through clearing houses, or fixed for periods of time that exceed the expected holding period of the
inventory they are funding
- Assessing capital reserves and maintaining liquidity (including intraday liquidity) to withstand adverse changes in the trading or
financing markets
- Entering into partnerships and joint ventures with complementary long-term partners to pursue business opportunities that otherwise would
exceed our capital capacity or risk tolerance
- $1.1 billion of unsecured long-term debt was repaid from June 2014 - May 2016
($ Millions) As of May 31, 2016
Long-term Debt 5,385
Total Equity 5,344
Total Capitalization $10,729
(1) The ratio of tangible assets / tangible common equity (a non-GAAP measure) equals total assets of $37.1 billion less goodwill and identifiable intangible assets of
$1.8 billion divided by total members’ equity of $5.3 billion less goodwill and identifiable intangible assets of $1.8 billion.
June 2016 15

Leucadia Investments Overview
June 2016 16
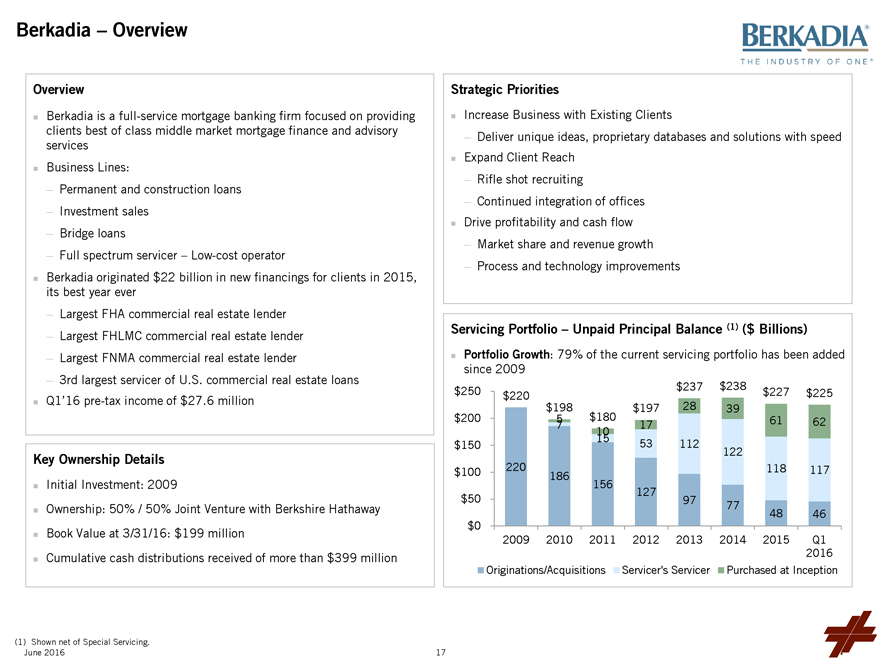
Berkadia - Overview
BERKADIA THE INDUSTRY OF ONE
Overview
Berkadia is a full-service mortgage banking firm focused on providing clients best of class middle market mortgage finance and advisory services
Business Lines:
- Permanent and construction loans
- Investment sales
- Bridge loans
- Full spectrum servicer - Low-cost operator
Berkadia originated $22 billion in new financings
for clients in 2015, its best year ever
- Largest FHA commercial real estate lender
- Largest FHLMC commercial real estate lender
- Largest FNMA commercial real estate lender
- 3rd largest servicer of U.S. commercial real estate loans
Q1’16
pre-tax income of $27.6 million
Key Ownership Details
Initial Investment:
2009
Ownership: 50% / 50% Joint Venture with Berkshire Hathaway
Book Value at
3/31/16: $199 million
Cumulative cash distributions received of more than $399 million
Strategic Priorities
Increase Business with Existing Clients
- Deliver unique ideas, proprietary databases and solutions with speed
Expand Client Reach
- Rifle shot recruiting
- Continued integration of offices
Drive profitability and cash flow
- Market share and revenue growth
- Process and technology improvements
Servicing Portfolio - Unpaid Principal Balance (1) ($
Billions)
Portfolio Growth: 79% of the current servicing portfolio has been added since 2009
$250 $200 $150 $100 $50 $0
$220 220
$198 5 7 186
$180 10 15 156
$197 17 53 127
$237 28 112 97
$238 39 122 77
$227 61 118 48
$225 62 117 46
2009 2010 2011 2012 2013 2014 2015 Q1 2016
Originations/Acquisitions Servicer’s Servicer Purchased at Inception
(1) Shown net of
Special Servicing.
June 2016 17
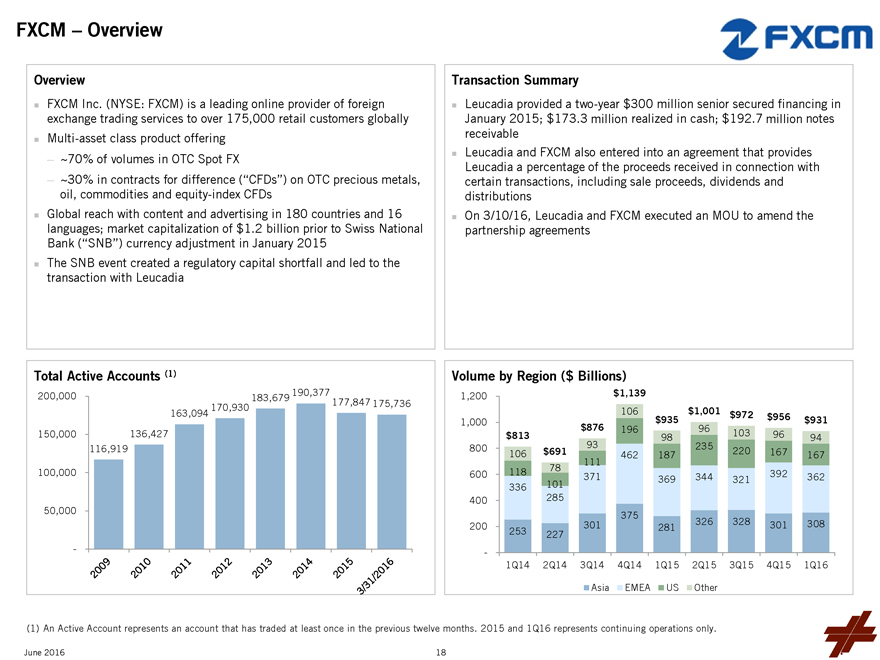
FXCM - Overview
FXCM
Overview
FXCM Inc. (NYSE: FXCM) is a leading online provider of foreign
exchange trading services to over 175,000 retail customers globally
Multi-asset class product offering
- ~70% of volumes in OTC Spot FX
- ~30% in contracts for difference (“CFDs”) on OTC
precious metals, oil, commodities and equity-index CFDs
Global reach with content and advertising in 180 countries and 16 languages; market capitalization of $1.2
billion prior to Swiss National
Bank (“SNB”) currency adjustment in January 2015
The SNB event created a regulatory capital shortfall and led to the transaction with Leucadia
Total Active Accounts (1)
200,000 150,000 100,000 50,000 -
116,919 136,427 163,094 170,930 183,679 190,377 177,847 175,736
2009 2010 2011 2012 2013 2014
2015 3/31/2016
Transaction Summary
Leucadia provided a two-year $300 million
senior secured financing in January 2015; $173.3 realized in cash; $192.7 notes receivable
Leucadia and FXCM also entered into an agreement that provides Leucadia
a percentage of the proceeds received in connection with certain transactions, including sale proceeds, dividends and distributions
On 3/10/16, Leucadia and FXCM
executed an MOU to amend the partnership agreements
Volume by Region ($ Billions)
1,200 1,000 800 600 400 200 -
$813 106 118 336 253
$691 78 101 285 227
$876 93 111 371 301
$1,139 106 196 462 375
$935 98 187 369 281
$1,001 96 235 344 326
$972 103 220 321 328
$956 96 167 392 301
$931 94 167 362 308
1Q14 2Q14 3Q14 4Q14 1Q15 2Q15 3Q15 4Q15 1Q16
Asia EMEA US Other
(1) An Active Account represents an account that has traded at least once in the previous twelve months. 2015 and 1Q16 represents continuing operations only.
June 2016 18
Leucadia Asset Management
Overview
Diversified alternative asset management platform - supporting and
developing focused funds managed by distinct management teams
Fee-generating assets, long-term stable cash flows, able to recycle capital
Goal of growing third party AUM, while earning a reasonable return on our capital
Compelling
edge - leverage Jefferies to source, and Leucadia to capitalize and syndicate
$452 million Leucadia book value in LAM products as of March 31, 2016, excluding $80
million of investments in marketable securities available for sale immediately; this does not reflect any potential value of the management companies executing these strategies
June 2016 19
Leucadia Asset Management (Continued)
Platforms and Strategies
Folger Hill Asset Management (Multi-Manager)
- Multi-manager discretionary long/short equity hedge fund platform; $873 million AUM
Topwater
Capital (Multi-Manager / First-loss)
- First-loss, scalable multi-manager and multi-strategy liquid securities fund; $818 million regulatory AUM
Strategic Investments Division (Quantitative Strategies)
- Systematic strategy with a
multi-quant approach across asset classes, geographies and time horizons; $1.1 billion AUM equivalent
Tenacis (Quantitative Strategies)
- Systematic macro fund encompassing equities, credit, FX, rates and volatility
CoreCommodity
Management (Commodity Strategies)
- Active strategies designed to provide enhanced commodity exposure; $4.8 billion AUM
Global Equity Events Opportunity Fund (Event-Driven Strategies)
- Event driven strategy
investing in merger arbitrage, relative value and stock loan arbitrage; $145 million AUM equivalent
54 Madison (Real Estate)
- Long-term, opportunistic real estate private equity fund providing equity capital for hotel, timeshare, resort, residential and specialty retail real estate development projects;
$500 million of fund commitments
Lake Hill
- Electronic trading of listed
options and futures across asset classes
Note: AUM figures as of Q1 2016 quarter end.
June 2016 20
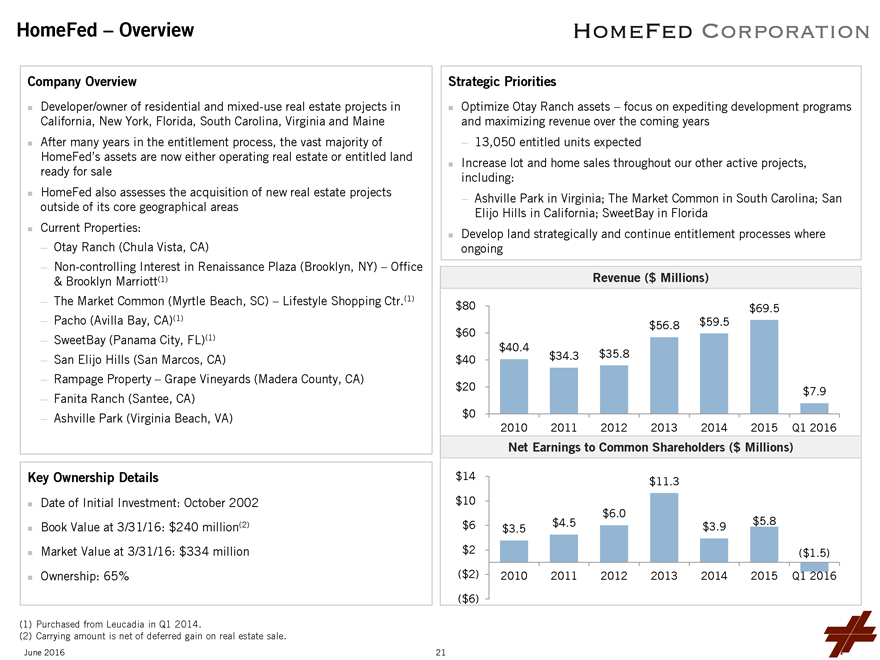
HomeFed - Overview
HOMEFED CORPORATION
Company Overview
Developer/owner of residential and mixed-use real estate projects in California, New York, Florida, South Carolina, Virginia and Maine
After many years in the entitlement process, the vast majority of HomeFed’s assets are now either operating real estate or entitled land ready for sale
HomeFed also assesses the acquisition of new real estate projects outside of its core geographical areas
Current Properties:
- Otay Ranch (Chula Vista, CA)
- Non-controlling Interest in Renaissance Plaza (Brooklyn, NY) - Office & Brooklyn Marriott(1)
- The Market Common (Myrtle Beach, SC) - Lifestyle Shopping Ctr.(1)
- Pacho (Avilla Bay,
CA)(1)
- SweetBay (Panama City, FL)(1)
- San Elijo Hills (San Marcos, CA)
- Rampage Property - Grape Vineyards (Madera County, CA)
- Fanita Ranch
(Santee, CA)
- Ashville Park (Virginia Beach, VA)
Key Ownership Details
Date of Initial Investment: October 2002
Book Value at 3/31/16: $240
million(2)
Market Value at 3/31/16: $334 million
Ownership: 65%
Strategic Priorities
Optimize Otay Ranch assets - focus on expediting development programs and
maximizing revenue over the coming years
- 13,050 entitled units expected
Increase lot and home sales throughout our other active projects, including:
- Ashville Park in Virginia; The Market Common in South Carolina; San Elijo Hills in California; SweetBay in Florida
Develop land strategically and continue entitlement processes where ongoing
Revenue ($
Millions)
$80 $60 $40 $20 $0
$40.4 $34.3 $35.8 $56.8 $59.5 $69.5 $7.9
2010 2011 2012 2013 2014 2015 Q1 2016
Net Earnings to Common Shareholders ($
Millions)
$14 $10 $6 $2 ($2) ($6)
$3.5 2010
$4.5 2011
$6.0 2012
$11.3 2013
$3.9 2014
$5.8 2015
($1.5) Q1 2016
(1) Purchased from Leucadia in Q1 2014.
(2) Carrying amount is net of deferred gain on real
estate sale.
June 2016 21
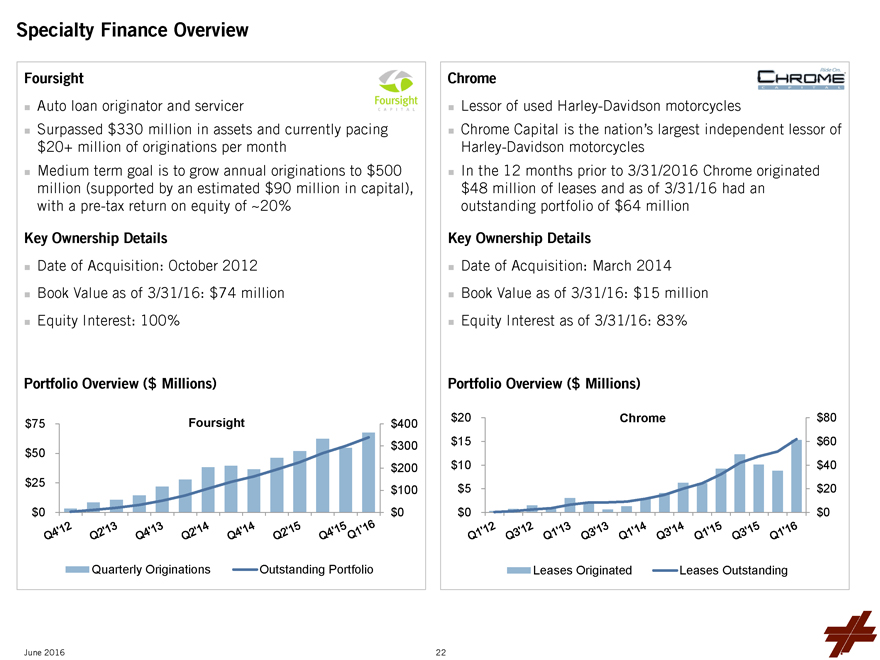
Specialty Finance Overview
Foursight
Auto loan originator and servicer
Surpassed $330 million in assets and currently pacing $20+ million of originations per month
Medium term goal is to grow annual originations to $500 million (supported by an estimated $90 million in capital), with a pre-tax return on equity of ~20%
Key Ownership Details
Date of Acquisition: October 2012
Book Value as of 3/31/16: $74 million
Equity Interest: 100%
Portfolio Overview ($ Millions)
$75 Foursight $400
$50 $300
$200
$25 $100
$0 $0
Q4’12 Q2’13 Q4’13 Q2’14 Q4’14 Q2’15 Q4’15 Q1’16
Quarterly Originations Outstanding Portfolio
Chrome
CHROME
Lessor of used Harley-Davidson motorcycles
Chrome Capital is the nation’s largest independent lessor of
Harley-Davidson motorcycles
In the 12 months prior to 3/31/2016 Chrome originated $48 million of leases and as of 3/31/16 had an outstanding portfolio of $64 million
Key Ownership Details
Date of Acquisition: March 2014
Book Value as of 3/31/16: $15 million
Equity Interest as of 3/31/16: 83%
Portfolio Overview ($ Millions)
$20 Chrome $80
$15 $60
$10 $40
$5 $20
$0 $0
Q1’12 Q3’12 Q1’13 Q3’13 Q1’14 Q3’14 Q1’15 Q3’15 Q1’16
Leases Originated Leases Outstanding
June 2016 22
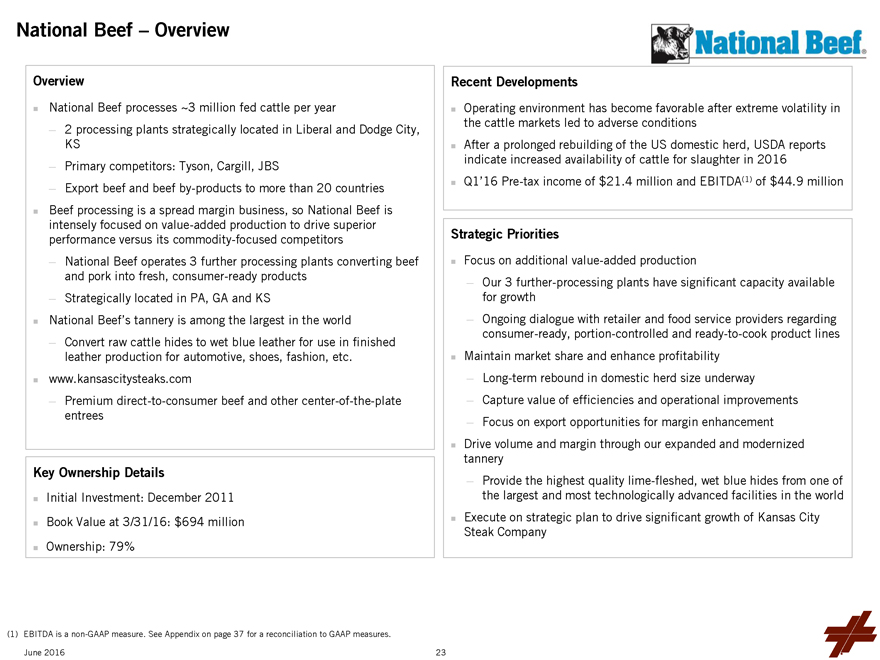
National Beef – Overview
National Beef
Overview
National Beef processes ~3 million fed cattle per year
— 2 processing plants strategically
located in Liberal and Dodge City, KS
— Primary competitors: Tyson, Cargill, JBS
— Export beef and beef by-products to more than 20 countries
Beef processing is a spread
margin business, so National Beef is intensely focused on value-added production to drive superior performance versus its commodity-focused competitors
—
National Beef operates 3 further processing plants converting beef and pork into fresh, consumer-ready products
— Strategically located in PA, GA and KS
National Beef’s tannery is among the largest in the world
— Convert
raw cattle hides to wet blue leather for use in finished leather production for automotive, shoes, fashion, etc.
www.kansascitysteaks.com
— Premium direct-to-consumer beef and other center-of-the-plate entrees
Key Ownership
Details
Initial Investment: December 2011
Book Value at 3/31/16: $694 million
Ownership: 79%
Recent Developments
Operating environment has become favorable after extreme volatility in the cattle markets led to adverse conditions
After a prolonged rebuilding of the US domestic herd, USDA reports indicate increased availability of cattle for slaughter in 2016
Q1’16 (1)
Pre-tax income of $21.4 million and EBITDA of $44.9 million
Strategic Priorities
Focus on additional value-added production
— Our 3 further-processing plants have significant capacity available for growth
—
Ongoing dialogue with retailer and food service providers regarding consumer-ready, portion-controlled and ready-to-cook product lines
Maintain market share and
enhance profitability
— Long-term rebound in domestic herd size underway
— Capture value of efficiencies and operational improvements
—
Focus on export opportunities for margin enhancement
Drive volume and margin through our expanded and modernized tannery
— Provide the highest quality lime-fleshed, wet blue hides from one of the largest and most technologically advanced facilities in the world
Execute on strategic plan to drive significant growth of Kansas City Steak Company
(1) EBITDA
is a non-GAAP measure. See Appendix on page 37 for a reconciliation to GAAP measures.
June 2016 23
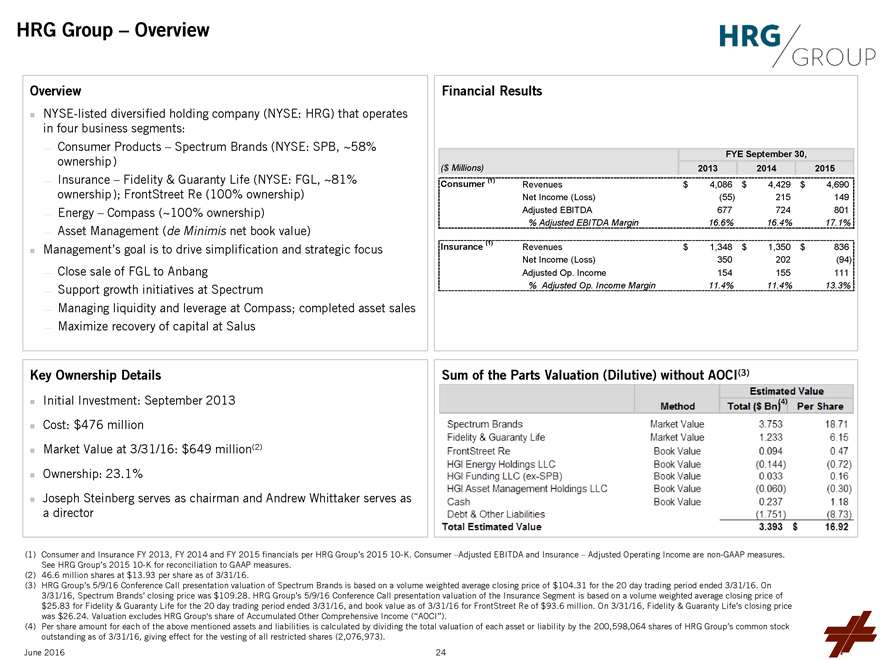
HRG Group – Overview
HRG GROUP
Overview
NYSE-listed diversified holding company (NYSE: HRG) that operates in four business segments:
— Consumer Products – Spectrum Brands (NYSE: SPB, ~58% ownership(1))
— Insurance – Fidelity & Guaranty Life (NYSE: FGL, ~81% ownership(1)); FrontStreet Re (100% ownership)
— Energy – Compass (~100% ownership)
— Asset Management (de Minimis net book
value)
Management’s goal is to drive simplification and strategic focus
— Close sale of FGL to Anbang
— Support growth initiatives at
Spectrum
Managing liquidity — and leverage at Compass; completed asset sales
— Maximize recovery of capital at Salus
Key Ownership Details
Initial Investment: September 2013
Cost: $476 million
Market Value at 3/31/16: $649 million(2)
Ownership: 23.1%
Joseph Steinberg serves as chairman and Andrew Whittaker serves as a director
Financial
Results
FYE September 30,
($ Millions) 2013 2014 2015
Consumer (1) Revenues $4,086 $4,429 $4,690
Net Income (Loss) (55) 215 149
Adjusted EBITDA 677 724 801
% Adjusted EBITDA Margin 16.6% 16.4% 17.1%
Insurance (1) Revenues $1,348 $1,350 $836
Net Income (Loss) 350 202 (94)
Adjusted Op. Income 154 155 111
% Adjusted Op. Income Margin 11.4% 11.4% 13.3%
Sum of the Parts Valuation (Dilutive) without AOCI(3)
Estimated Value
Method Total ($ Bn)(4) Per Share
Spectrum Brands Market Value 3.753 18.71
Fidelity & Guaranty Life Market Value 1.233 6.15
FrontStreet Re Book Value 0.094 0.47
HGI Energy Holdings LLC Book Value (0.144) (0.72)
HGI Funding LLC (ex-SPB)
Book Value 0.033 0.16
HGI Asset Management Holdings LLC Book Value (0.060) (0.30)
Cash Book Value 0.237 1.18
Debt & Other Liabilities (1.751) (8.73)
Total Estimated Value 3.393 $16.92
(1) Consumer and Insurance FY 2013, FY 2014 and FY 2015
financials per HRG Group’s 2015 10-K. Consumer –Adjusted EBITDA and Insurance – Adjusted Operating Income are non-GAAP measures. See HRG Group’s 2015 10-K for reconciliation to GAAP measures.
(2) 46.6 million shares at $13.93 per share as of 3/31/16.
(3) HRG Group’s 5/9/16
Conference Call presentation valuation of Spectrum Brands is based on a volume weighted average closing price of $104.31 for the 20 day trading period ended 3/31/16. On 3/31/16, Spectrum Brands’ closing price was $109.28. HRG Group’s
5/9/16 Conference Call presentation valuation of the Insurance Segment is based on a volume weighted average closing price of $25.83 for Fidelity & Guaranty Life for the 20 day trading period ended 3/31/16, and book value as of 3/31/16 for
FrontStreet Re of $93.6 million. On 3/31/16, Fidelity & Guaranty Life’s closing price was $26.24. Valuation excludes HRG Group’s share of Accumulated Other Comprehensive Income (“AOCI”).
(4) Per share amount for each of the above mentioned assets and liabilities is calculated by dividing the total valuation of each asset or liability by the 200,598,064 shares of
HRG Group’s common stock outstanding as of 3/31/16, giving effect for the vesting of all restricted shares (2,076,973).
June 2016 24
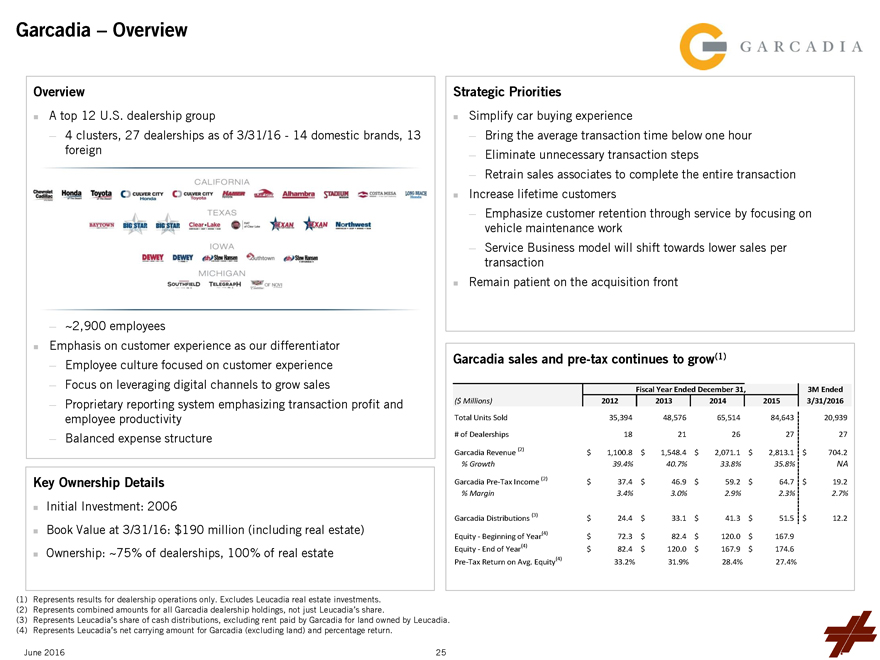
Garcadia – Overview
GARCADIA
Overview
A top 12 U.S. dealership group
— 4 clusters, 27 dealerships as of 3/31/16 - 14 domestic
brands, 13 foreign
— ~2,900 employees
Emphasis on customer experience as
our differentiator
— Employee culture focused on customer experience
— Focus on leveraging digital channels to grow sales
— Proprietary
reporting system emphasizing transaction profit and employee productivity
— Balanced expense structure
Key Ownership Details
Initial Investment: 2006
Book Value at 3/31/16: $190 million (including real estate)
Ownership: ~75% of dealerships,
100% of real estate
Strategic Priorities
Simplify car buying experience
— Bring the average transaction time below one hour
— Eliminate
unnecessary transaction steps
— Retrain sales associates to complete the entire transaction
Increase lifetime customers
— Emphasize customer retention through service by focusing on
vehicle maintenance work
— Service Business model will shift towards lower sales per transaction
Remain patient on the acquisition front
Garcadia sales and pre-tax continues to grow(1)
Fiscal Year Ended December 31, 3M Ended
($ Millions) 2012 2013 2014 2015
3/31/2016
Total Units Sold 35,394 48,576 65,514 84,643 20,939
# of
Dealerships 18 21 26 27 27
Garcadia Revenue (2) $1,100.8 $1,548.4 $2,071.1 $2,813.1 $704.2
% Growth 39.4% 40.7% 33.8% 35.8% NA
Garcadia Pre-Tax Income (2) $37.4 $46.9 $59.2 $64.7 $19.2
% Margin 3.4% 3.0% 2.9% 2.3% 2.7%
Garcadia Distributions (3) $24.4 $33.1
$41.3 $51.5 $12.2
Equity - Beginning of Year(4) $72.3 $82.4 $120.0 $167.9
Equity - End of Year(4) $82.4 $120.0 $167.9 $174.6
Pre-Tax Return on Avg.
Equity(4) 33.2% 31.9% 28.4% 27.4%
(1) Represents results for dealership operations only. Excludes Leucadia real estate investments.
(2) Represents combined amounts for all Garcadia dealership holdings, not just Leucadia’s share.
(3) Represents Leucadia’s share of cash distributions, excluding rent paid by Garcadia for land owned by Leucadia.
(4) Represents Leucadia’s net carrying amount for Garcadia (excluding land) and percentage return.
June 2016 25
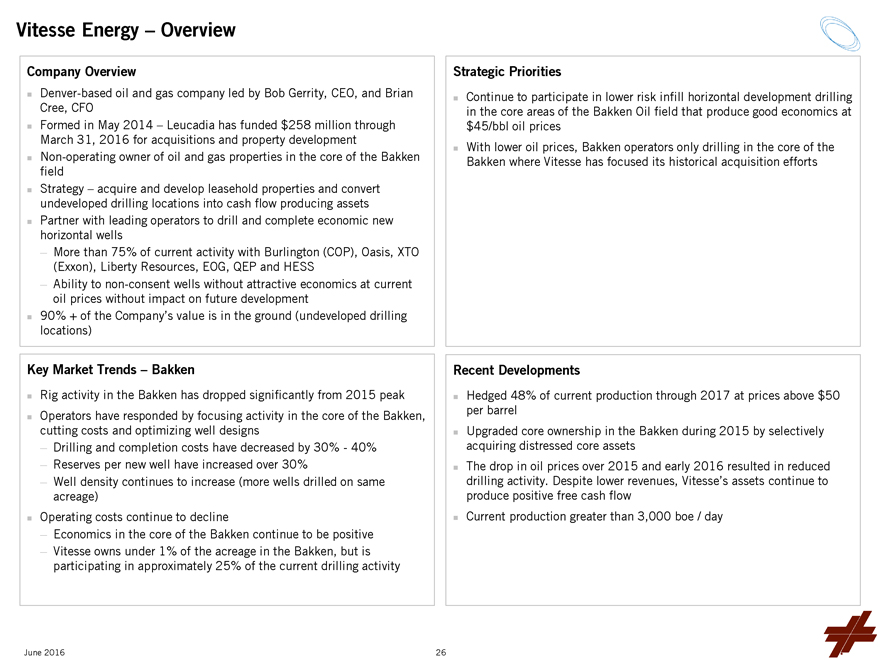
Vitesse Energy – Overview
Company Overview
Denver-based oil and gas company led by Bob Gerrity, CEO, and Brian Cree, CFO
Formed in May 2014 – Leucadia has funded $258 million through March 31, 2016 for acquisitions and property development
Non-operating owner of oil and gas properties in the core of the Bakken field
Strategy –
acquire and develop leasehold properties and convert undeveloped drilling locations into cash flow producing assets
Partner with leading operators to drill and
complete economic new horizontal wells
— More than 75% of current activity with Burlington (COP), Oasis, XTO (Exxon), Liberty Resources, EOG, QEP and HESS
— Ability to non-consent wells without attractive economics at current oil prices without impact on future development
90% + of the Company’s value is in the ground (undeveloped drilling locations)
Key Market
Trends – Bakken
Rig activity in the Bakken has dropped significantly from 2015 peak
Operators have responded by focusing activity in the core of the Bakken, cutting costs and optimizing well designs
— Drilling and completion costs have decreased by 30%—40%
— Reserves per new
well have increased over 30%
— Well density continues to increase (more wells drilled on same acreage)
Operating costs continue to decline
— Economics in the core of the Bakken continue to be
positive
— Vitesse owns under 1% of the acreage in the Bakken, but is participating in approximately 25% of the current drilling activity
Strategic Priorities
Continue to participate in lower risk infill horizontal development
drilling in the core areas of the Bakken Oil field that produce good economics at $45/bbl oil prices
With lower oil prices, Bakken operators only drilling in
the core of the Bakken where Vitesse has focused its historical acquisition efforts
Recent Developments
Hedged 48% of current production through 2017 at prices above $50 per barrel
Upgraded core
ownership in the Bakken during 2015 by selectively acquiring distressed core assets
The drop in oil prices over 2015 and early 2016 resulted in reduced drilling
activity. Despite lower revenues, Vitesse’s assets continue to produce positive free cash flow
Current production greater than 3,000 boe / day
June 2016 26
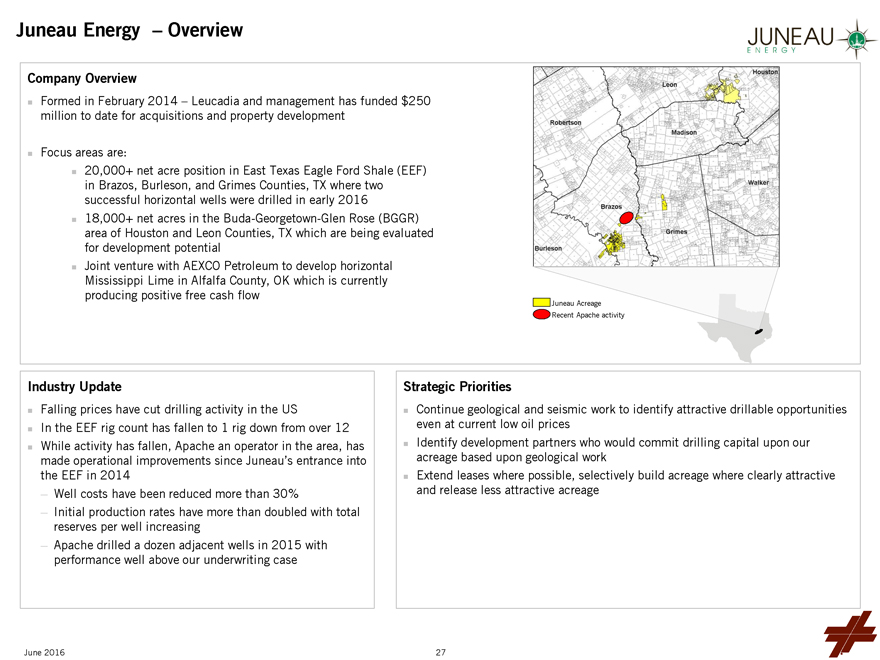
Juneau Energy – Overview
JUNEAU ENERGY
Company Overview
Formed in February 2014 – Leucadia and management has funded $250 million to date for acquisitions and property development
Focus areas are:
20,000+ net acre position in East Texas Eagle Ford Shale (EEF) in Brazos,
Burleson, and Grimes Counties, TX where two successful horizontal wells were drilled in early 2016
18,000+ net acres in the Buda-Georgetown-Glen Rose (BGGR) area
of Houston and Leon Counties, TX which are being evaluated for development potential
Joint venture with AEXCO Petroleum to develop horizontal Mississippi Lime in
Alfalfa County, OK which is currently producing positive free cash flow
Robertson
Leon
Houston
Madison
Walker
Grimes
Brazos
Burleson
Juneau Acreage
Recent Apache activity
Industry Update
Falling prices have cut drilling activity in the US
In the EEF rig count has
fallen to 1 rig down from over 12
While activity has fallen, Apache an operator in the area, has made operational improvements since Juneau’s entrance
into the EEF in 2014
— Well costs have been reduced more than 30%
—
Initial production rates have more than doubled with total reserves per well increasing
— Apache drilled a dozen adjacent wells in 2015 with performance well
above our underwriting case
Strategic Priorities
Continue geological and
seismic work to identify attractive drillable opportunities even at current low oil prices
Identify development partners who would commit drilling capital upon our
acreage based upon geological work
Extend leases where possible, selectively build acreage where clearly attractive and release less attractive acreage
June 2016 27
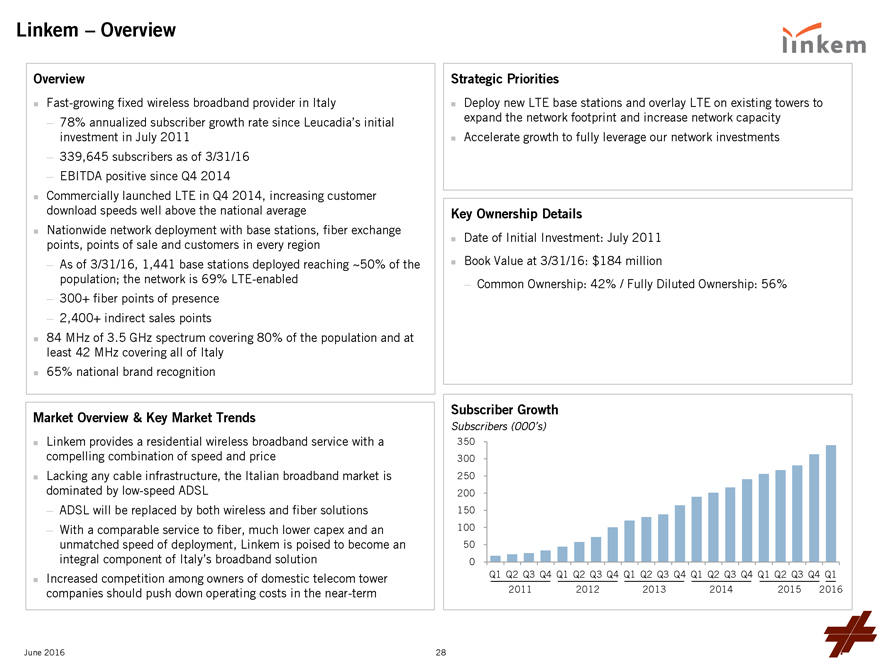
Linkem – Overview
linkem
Overview
Fast-growing fixed wireless broadband provider in Italy
— 78% annualized subscriber
growth rate since Leucadia’s initial investment in July 2011
— 339,645 subscribers as of 3/31/16
— EBITDA positive since Q4 2014
Commercially launched LTE in Q4 2014, increasing customer
download speeds well above the national average
Nationwide network deployment with base stations, fiber exchange points, points of sale and customers in every
region
— As of 3/31/16, 1,441 base stations deployed reaching ~50% of the population; the network is 69% LTE-enabled
— 300+ fiber points of presence
— 2,400+ indirect sales points
84 MHz of 3.5 GHz spectrum covering 80% of the population and at least 42 MHz covering all of Italy
65% national brand recognition
Market Overview & Key Market Trends
Linkem provides a residential wireless broadband service with a compelling combination of speed and price
Lacking any cable infrastructure, the Italian broadband market is dominated by low-speed ADSL
— ADSL will be replaced by both wireless and fiber solutions
— With
a comparable service to fiber, much lower capex and an unmatched speed of deployment, Linkem is poised to become an integral component of Italy’s broadband solution
Increased competition among owners of domestic telecom tower companies should push down operating costs in the near-term
Strategic Priorities
Deploy new LTE base stations and overlay LTE on existing towers to expand
the network footprint and increase network capacity
Accelerate growth to fully leverage our network investments
Key Ownership Details
Date of Initial Investment: July 2011
Book Value at 3/31/16: $184 million
— Common Ownership: 42% / Fully Diluted Ownership:
56%
Subscriber Growth
Subscribers (000’s)
350
300
250
200
150
100
50
0
Q1 Q2 Q3 Q4
Q1 Q2 Q3 Q4
Q1 Q2 Q3 Q4
Q1 Q2 Q3 Q4
Q1 Q2 Q3 Q4
Q1
2011 2012 2013 2014 2015 2016
June 2016 28
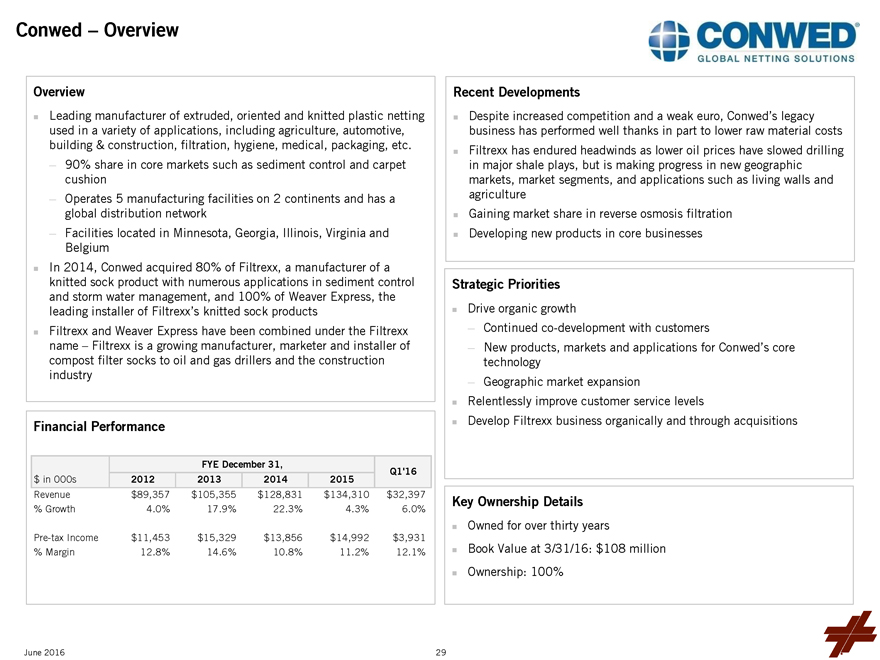
Conwed – Overview
CONWED
GLOBAL NETTING SOLUTIONS
Overview
Leading manufacturer of extruded, oriented and knitted plastic netting used in a
variety of applications, including agriculture, automotive, building & construction, filtration, hygiene, medical, packaging, etc.
— 90% share in core
markets such as sediment control and carpet cushion
— Operates 5 manufacturing facilities on 2 continents and has a global distribution network
— Facilities located in Minnesota, Georgia, Illinois, Virginia and Belgium
In 2014,
Conwed acquired 80% of Filtrexx, a manufacturer of a knitted sock product with numerous applications in sediment control and storm water management, and 100% of Weaver Express, the leading installer of Filtrexx’s knitted sock products
Filtrexx and Weaver Express have been combined under the Filtrexx name – Filtrexx is a growing manufacturer, marketer and installer of compost filter socks to
oil and gas drillers and the construction industry
Financial Performance
FYE
December 31, Q1’16
$ in 000s 2012 2013 2014 2015
Revenue $89,357
$105,355 $128,831 $134,310 $32,397
% Growth 4.0% 17.9% 22.3% 4.3% 6.0%
Pre-tax Income $11,453 $15,329 $13,856 $14,992 $3,931
% Margin 12.8% 14.6%
10.8% 11.2% 12.1%
Recent Developments
Despite increased competition and a
weak euro, Conwed’s legacy business has performed well thanks in part to lower raw material costs
Filtrexx has endured headwinds as lower oil prices have
slowed drilling in major shale plays, but is making progress in new geographic markets, market segments, and applications such as living walls and agriculture
Gaining market share in reverse osmosis filtration
Developing new products in
core businesses
Strategic Priorities
Drive organic growth
— Continued co-development with customers
— New products, markets and applications
for Conwed’s core technology
— Geographic market expansion
Relentlessly improve customer service levels
Develop Filtrexx business
organically and through acquisitions
Key Ownership Details
Owned for over
thirty years
Book Value at 3/31/16: $108 million
Ownership: 100%
June 2016 29
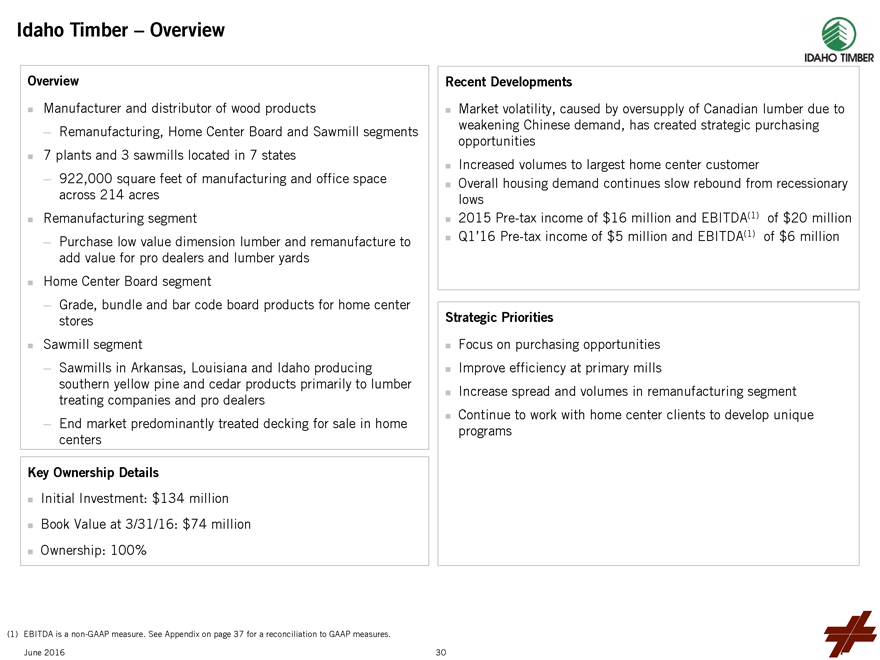
Idaho Timber - Overview
IDAHO TIMBER
Overview
Manufacturer and distributor of wood products
- Remanufacturing, Home Center Board and Sawmill
segments
7 plants and 3 sawmills located in 7 states
- 922,000 square feet of
manufacturing and office space across 214 acres
Remanufacturing segment
-
Purchase low value dimension lumber and remanufacture to add value for pro dealers and lumber yards
Home Center Board segment
- Grade, bundle and bar code board products for home center stores
Sawmill segment
- Sawmills in Arkansas, Louisiana and Idaho producing southern yellow pine and cedar products primarily to lumber treating companies and pro dealers
- End market predominantly treated decking for sale in home centers
Key Ownership Details
Initial Investment: $134 million
Book Value at 3/31/16: $74 million
Ownership: 100%
Recent Developments
Market volatility, caused by oversupply of Canadian lumber due to weakening Chinese demand, has created strategic purchasing opportunities
Increased volumes to largest home center customer
Overall housing demand continues slow rebound
from recessionary lows
2015 Pre-tax income of $16 million and EBITDA(1) of $20 million
Q1’16 Pre-tax income of $5 million and EBITDA(1) of $6 million
Strategic Priorities
Focus on purchasing opportunities
Improve efficiency at primary
mills
Increase spread and volumes in remanufacturing segment
Continue to work
with home center clients to develop unique programs
(1) EBITDA is a non-GAAP measure. See Appendix on page 37 for a reconciliation to GAAP measures.
June 2016
30
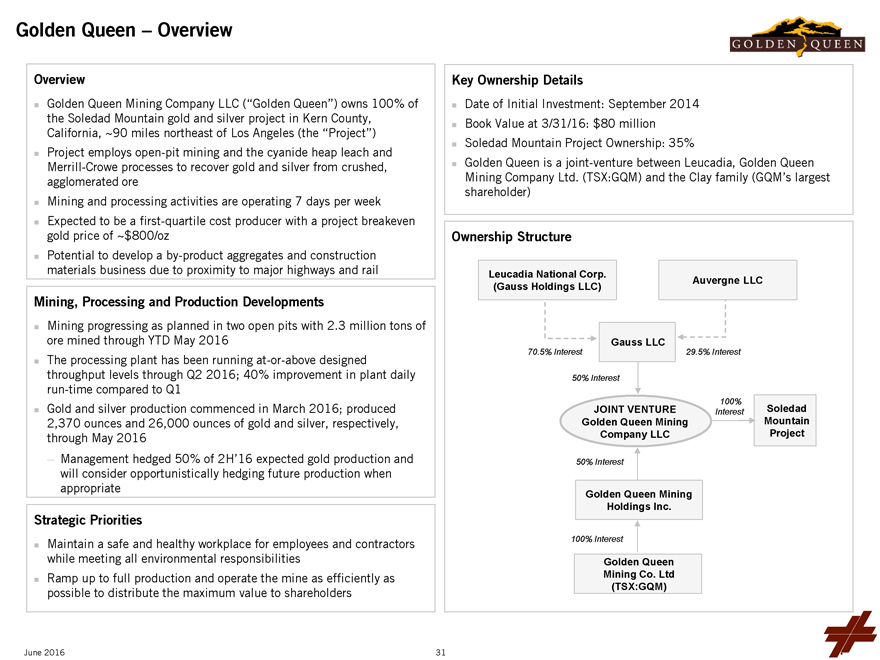
Golden Queen - Overview
Overview
Golden Queen Mining Company LLC (“Golden Queen”) owns 100%
of the Soledad Mountain gold and silver project in Kern County, California, ~90 miles northeast of Los Angeles (the “Project”)
Project employs open-pit
mining and the cyanide heap leach and Merrill-Crowe processes to recover gold and silver from crushed, agglomerated ore
Mining and processing activities are
operating 7 days per week
Expected to be a first-quartile cost producer with a project breakeven gold price of ~$800/oz
Potential to develop a by-product aggregates and construction materials business due to proximity to major highways and rail
Mining, Processing and Production Developments
Mining progressing as planned in two open pits
with 2.3 million tons of ore mined through YTD May 2016
The processing plant has been running at-or-above designed throughput levels through Q2 2016; 40%
improvement in plant daily run-time compared to Q1
Gold and silver production commenced in March 2016; produced 2,370 ounces and 26,000 ounces of gold and silver,
respectively, through May 2016
- Management hedged 50% of 2H’16 expected gold production and will consider opportunistically hedging future production when
appropriate
Strategic Priorities
Maintain a safe and healthy workplace for
employees and contractors while meeting all environmental responsibilities
Ramp up to full production and operate the mine as efficiently as possible to distribute
the maximum value to shareholders
Key Ownership Details
Date of Initial
Investment: September 2014
Book Value at 3/31/16: $80 million
Soledad
Mountain Project Ownership: 35%
Golden Queen is a joint-venture between Leucadia, Golden Queen Mining Company Ltd. (TSX:GQM) and the Clay family (GQM’s
largest shareholder)
Ownership Structure
Leucadia National Corp. (Gauss
Holdings LLC)
Auvergne LLC
Gauss LLC
70.5% Interest
29.5% Interest
50% Interest
JOINT VENTURE
Golden Queen Mining
Company LLC
100% Interest
Soledad Mountain Project
50% Interest
Golden Queen Mining Holdings Inc.
100% Interest
Golden Queen Mining Co. Ltd (TSX:GQM)
June 2016
31
Appendix
June 2016
32
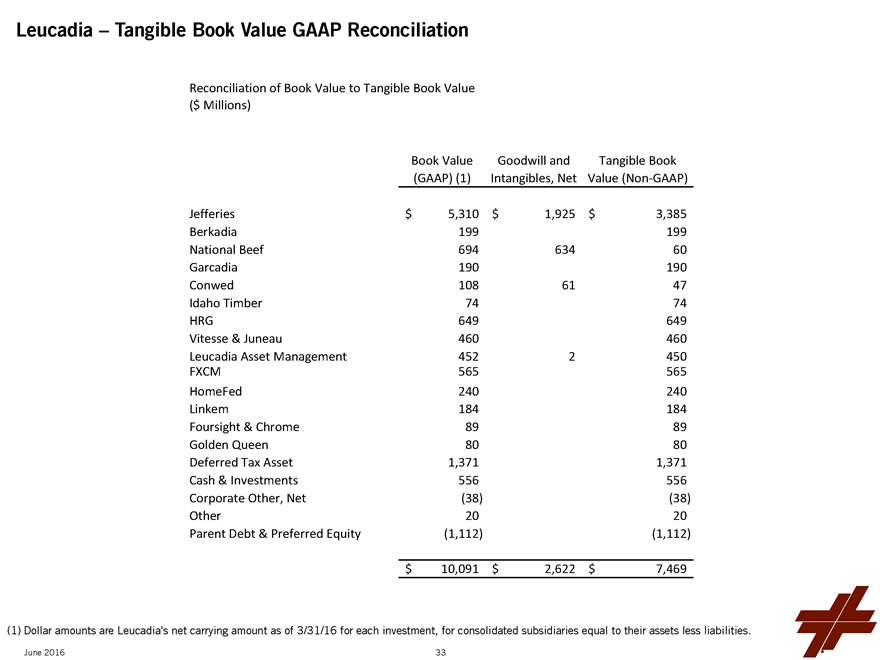
Leucadia - Tangible Book Value GAAP Reconciliation
Reconciliation of Book Value to Tangible Book Value
($ Millions)
Book Value (GAAP) (1)
Goodwill and Intangibles, Net
Tangible Book Value (Non-GAAP)
Jefferies $5,310 $1,925 $3,385
Berkadia 199 199
National Beef 694 634 60
Garcadia 190 190
Conwed 108 61 47
Idaho Timber 74 74
HRG 649 649
Vitesse & Juneau 460 460
Leucadia Asset Management 452 2 450
FXCM 565 565
HomeFed 240 240
Linkem 184 184
Foursight & Chrome 89 89
Golden Queen 80 80
Deferred Tax Asset 1,371 1,371
Cash & Investments 556 556
Corporate Other, Net (38) (38)
Other 20 20
Parent Debt & Preferred Equity (1,112) (1,112)
$10,091 $2,622 $7,469
(1) Dollar amounts are Leucadia’s net carrying amount as of 3/31/16
for each investment, for consolidated subsidiaries equal to their assets less liabilities.
June 2016
33
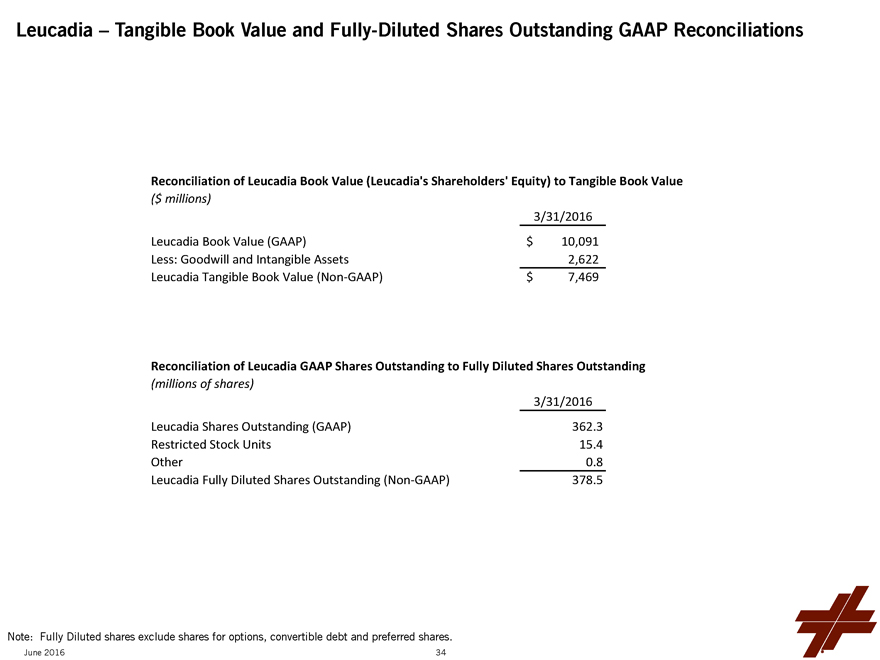
Leucadia - Tangible Book Value and Fully-Diluted Shares Outstanding GAAP Reconciliations
Reconciliation of Leucadia Book Value (Leucadia’s Shareholders’ Equity) to Tangible Book Value
($ millions)
3/31/2016
Leucadia Book Value (GAAP) $10,091
Less: Goodwill and Intangible Assets 2,622
Leucadia Tangible Book Value (Non-GAAP) $7,469
Reconciliation of Leucadia GAAP Shares
Outstanding to Fully Diluted Shares Outstanding
(millions of shares)
3/31/2016
Leucadia Shares Outstanding (GAAP) 362.3
Restricted Stock Units 15.4
Other 0.8
Leucadia Fully Diluted Shares Outstanding (Non-GAAP) 378.5
Note: Fully Diluted shares exclude
shares for options, convertible debt and preferred shares.
June 2016
34
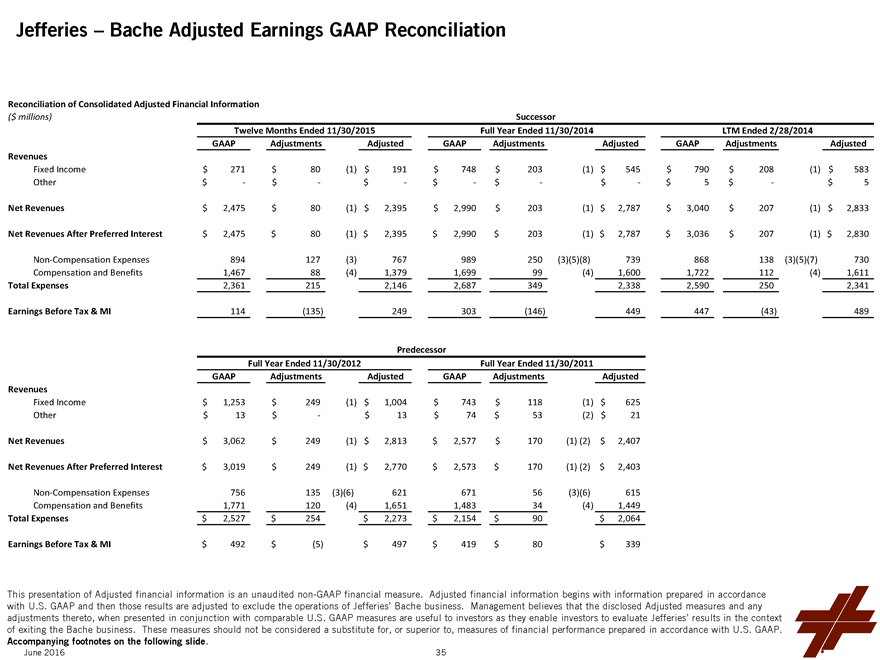
Jefferies - Bache Adjusted Earnings GAAP Reconciliation
Reconciliation of Consolidated Adjusted Financial Information
($ millions)
Successor
Twelve Months Ended 11/30/2015 Full Year Ended 11/30/2014 LTM Ended 2/28/2014
GAAP Adjustments Adjusted GAAP Adjustments Adjusted GAAP Adjustments Adjusted
Revenues
Fixed Income $ 271 $ 80 (1) $ 191 $ 748 $ 203 (1) $ 545 $ 790 $ 208
(1) $ 583
Other $ - $ - $ - $ - $ - $ - $ 5 $ - $ 5
Net Revenues $ 2,475 $ 80
(1) $ 2,395 $ 2,990 $ 203 (1) $ 2,787 $ 3,040 $ 207 (1) $ 2,833
Net Revenues After Preferred Interest $ 2,475 $ 80 (1) $ 2,395 $ 2,990 $ 203 (1) $ 2,787 $ 3,036 $
207 (1) $ 2,830
Non-Compensation Expenses 894 127 (3) 767 989 250 (3)(5)(8) 739 868 138 (3)(5)(7) 730
Compensation and Benefits 1,467 88 (4) 1,379 1,699 99 (4) 1,600 1,722 112 (4) 1,611
Total
Expenses 2,361 215 2,146 2,687 349 2,338 2,590 250 2,341
Earnings Before Tax & MI 114 (135) 249 303 (146) 449 447 (43) 489
Predecessor
Full Year Ended 11/30/2012 Full Year Ended 11/30/2011
GAAP Adjustments Adjusted GAAP Adjustments Adjusted Revenues
Fixed Income $ 1,253 $ 249 (1) $
1,004 $ 743 $ 118 (1) $ 625
Other $ 13 $ - $ 13 $ 74 $ 53 (2) $ 21
Net
Revenues $ 3,062 $ 249 (1) $ 2,813 $ 2,577 $ 170 (1)(2) $ 2,407
Net Revenues After Preferred Interest $ 3,019 $ 249 (1) $ 2,770 $ 2,573 $ 170 (1)(2) $ 2,403
Non-Compensation Expenses 756 135 (3)(6) 621 671 56 (3)(6) 615
Compensation
and Benefits 1,771 120 (4) 1,651 1,483 34 (4) 1,449
Total Expenses $ 2,527 $ 254 $ 2,273 $ 2,154 $ 90 $ 2,064
Earnings Before Tax & MI $ 492 $ (5) $ 497 $ 419 $ 80 $ 339
This presentation of Adjusted
financial information is an unaudited non-GAAP financial measure. Adjusted financial information begins with information prepared in accordance with U.S. GAAP and then those results are adjusted to exclude the operations of Jefferies’ Bache
business. Management believes that the disclosed Adjusted measures and any adjustments thereto, when presented in conjunction with comparable U.S. GAAP measures are useful to investors as they enable investors to evaluate Jefferies’ results in
the context of exiting the Bache business. These measures should not be considered a substitute for, or superior to, measures of financial performance prepared in accordance with U.S. GAAP.
Accompanying footnotes on the following slide.
June 2016 35
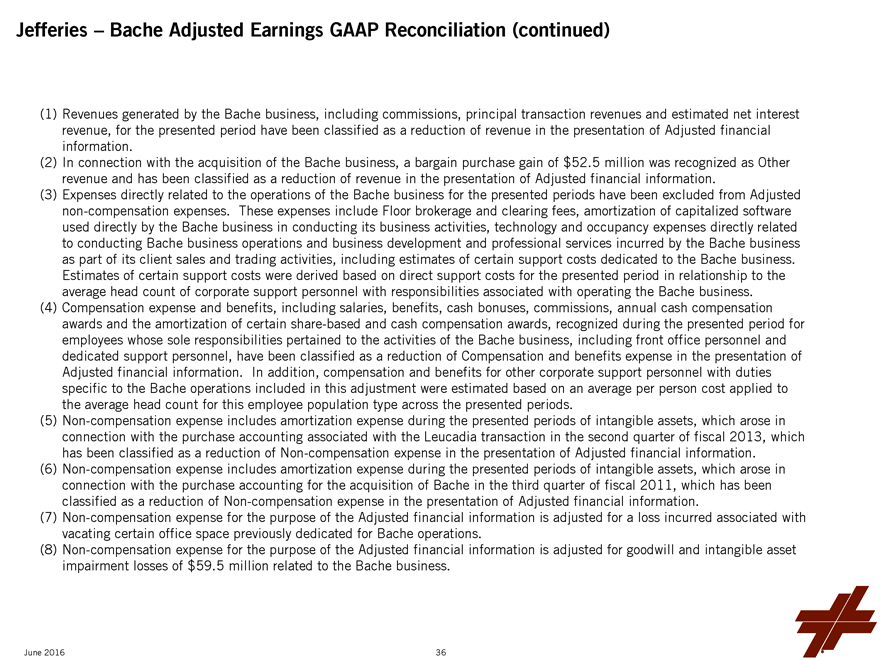
Jefferies - Bache Adjusted Earnings GAAP Reconciliation (continued)
(1) Revenues generated by the Bache business, including commissions, principal transaction revenues and estimated net interest revenue, for the presented period have been
classified as a reduction of revenue in the presentation of Adjusted financial information.
(2) In connection with the acquisition of the Bache business, a bargain
purchase gain of $52.5 million was recognized as Other revenue and has been classified as a reduction of revenue in the presentation of Adjusted financial information.
(3) Expenses directly related to the operations of the Bache business for the presented periods have been excluded from Adjusted non-compensation expenses. These expenses
include Floor brokerage and clearing fees, amortization of capitalized software used directly by the Bache business in conducting its business activities, technology and occupancy expenses directly related to conducting Bache business operations and
business development and professional services incurred by the Bache business as part of its client sales and trading activities, including estimates of certain support costs dedicated to the Bache business.
Estimates of certain support costs were derived based on direct support costs for the presented period in relationship to the average head count of corporate support personnel with
responsibilities associated with operating the Bache business.
(4) Compensation expense and benefits, including salaries, benefits, cash bonuses, commissions,
annual cash compensation awards and the amortization of certain share-based and cash compensation awards, recognized during the presented period for employees whose sole responsibilities pertained to the activities of the Bache business, including
front office personnel and dedicated support personnel, have been classified as a reduction of Compensation and benefits expense in the presentation of Adjusted financial information. In addition, compensation and benefits for other corporate
support personnel with duties specific to the Bache operations included in this adjustment were estimated based on an average per person cost applied to the average head count for this employee population type across the presented periods.
(5) Non-compensation expense includes amortization expense during the presented periods of intangible assets, which arose in connection with the purchase
accounting associated with the Leucadia transaction in the second quarter of fiscal 2013, which has been classified as a reduction of Non-compensation expense in the presentation of Adjusted financial information.
(6) Non-compensation expense includes amortization expense during the presented periods of intangible assets, which arose in connection with the purchase accounting for the
acquisition of Bache in the third quarter of fiscal 2011, which has been classified as a reduction of Non-compensation expense in the presentation of Adjusted financial information.
(7) Non-compensation expense for the purpose of the Adjusted financial information is adjusted for a loss incurred associated with vacating certain office space previously
dedicated for Bache operations.
(8) Non-compensation expense for the purpose of the Adjusted financial information is adjusted for goodwill and intangible asset
impairment losses of $59.5 million related to the Bache business.
June 2016
36
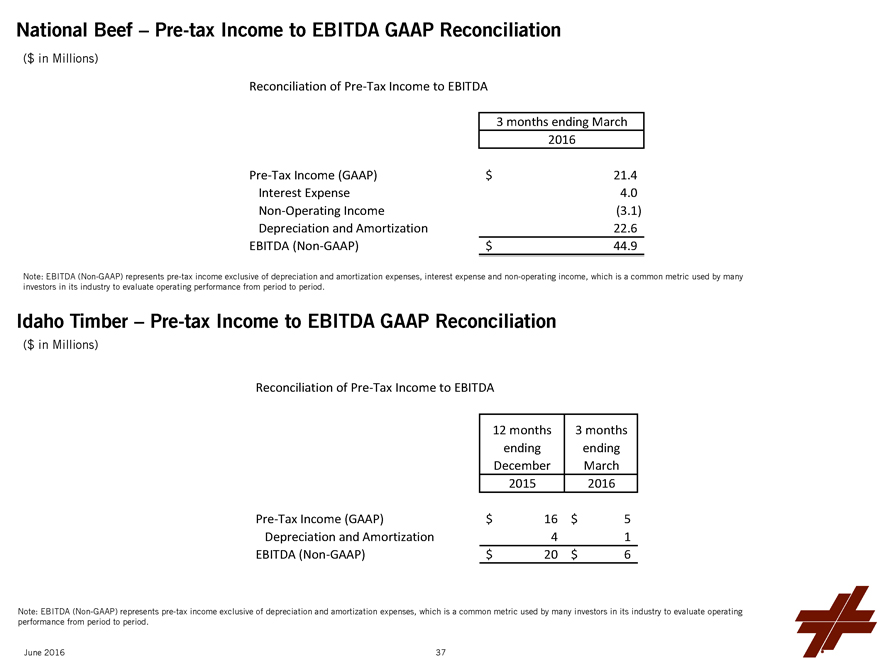
National Beef - Pre-tax Income to EBITDA GAAP Reconciliation
($ in Millions)
Reconciliation of Pre-Tax Income to EBITDA
3 months ending March
2016
Pre-Tax Income (GAAP) $21.4
Interest Expense 4.0
Non-Operating Income (3.1)
Depreciation and Amortization 22.6
EBITDA (Non-GAAP) $44.9
Note: EBITDA (Non-GAAP) represents pre-tax income exclusive of
depreciation and amortization expenses, interest expense and non-operating income, which is a common metric used by many investors in its industry to evaluate operating performance from period to period.
Idaho Timber - Pre-tax Income to EBITDA GAAP Reconciliation
($ in Millions)
Reconciliation of Pre-Tax Income to EBITDA
12 months ending December 2015
3 months ending March 2016
Pre-Tax Income (GAAP) $16 $5
Depreciation and Amortization 4 1
EBITDA (Non-GAAP) $20 $6
Note: EBITDA (Non-GAAP) represents pre-tax income exclusive of depreciation and amortization expenses, which is a common metric used by many investors in its industry to evaluate
operating performance from period to period.
June 2016
37