Attached files
| file | filename |
|---|---|
| 8-K - FORM 8-K - PUBLIC SERVICE ENTERPRISE GROUP INC | d215796d8k.htm |
 Forward-Looking Statements Certain of the matters discussed in this report about our and our subsidiaries' future performance, including, without
limitation, future revenues, earnings, strategies, prospects, consequences and all other statements that are not purely historical constitute “forward-looking statements” within the meaning
of the Private Securities Litigation Reform Act of 1995. Such forward-looking statements are subject to risks and uncertainties, which could cause actual results to differ materially from those anticipated. Such
statements are based on management's beliefs as well as assumptions made by and information currently available to management. When used herein, the words “anticipate,” “intend,” “estimate,” “believe,” “expect,” “plan,” “should,” “hypothetical,” “potential,” “forecast,” “project,” variations of such words and similar expressions are intended to identify forward-looking
statements. Factors that may cause actual results to differ are often presented with the forward- looking statements themselves. Other factors that could cause actual results to differ materially from those contemplated in any forward-looking statements made by us herein are discussed in filings we make with the United States Securities and Exchange Commission (SEC) including our Annual Report on Form
10-K and subsequent reports on Form 10-Q and Form 8-K and available on our website: http://www.pseg.com. These factors include, but are not limited to:
•
adverse changes in the demand for or ongoing low pricing of the
capacity and energy that we sell into wholesale electricity markets, • adverse changes in energy industry law, policies and regulations, including market structures and transmission
planning, •
any inability of our transmission and distribution businesses to
obtain adequate and timely rate relief and regulatory approvals from federal and state regulators, including prudency reviews and disallowances, • any deterioration in our credit quality or the credit quality of our counterparties,
•
changes in federal and state environmental regulations and
enforcement that could increase our costs or limit our operations, • adverse outcomes of any legal, regulatory or other proceeding, settlement, investigation or claim applicable to us and/or the energy industry, • changes in nuclear regulation and/or general developments in the nuclear power industry, including various impacts from
any accidents or incidents experienced at our facilities or by others in the industry, that could limit operations or increase the cost of our nuclear generating units,
•
actions or activities at one of our nuclear units located on a
multi-unit site that might adversely affect our ability to continue to operate that unit or other units located at the same site, • any inability to manage our energy obligations, available supply and risks,
•
delays or unforeseen cost escalations in our construction and
development activities, or the inability to recover the carrying amount of our assets, • availability of capital and credit at commercially reasonable terms and conditions and our ability to meet cash
needs, •
increases in competition in energy supply markets as well as for
transmission projects, •
changes in technology, such as distributed generation and micro
grids, and greater reliance on these technologies,
•
changes in customer behaviors, including increases in energy
efficiency, net-metering and demand response,
•
adverse performance of our decommissioning and defined benefit
plan trust fund investments and changes in funding requirements, • any equipment failures, accidents, severe weather events or other incidents that impact our ability to provide safe and
reliable service to our customers, and any inability to obtain sufficient insurance coverage or recover proceeds of insurance with respect to such events,
•
acts of terrorism, cybersecurity attacks or intrusions that
could adversely impact our businesses, •
delays in receipt of necessary permits and
approvals for our construction and development activities, • any inability to achieve, or continue to sustain, our expected levels of operating performance,
•
changes in the cost of, or interruption in the supply of, fuel
and other commodities necessary to the operation of our generating units, • an extended economic recession, • an inability to realize anticipated tax benefits or retain tax credits,
•
challenges associated with recruitment and/or retention of a
qualified workforce, and •
changes in the credit quality and the ability of lessees to meet
their obligations under our domestic leveraged leases. All of the forward-looking statements made in this report are qualified by these cautionary statements and we cannot
assure you that the results or developments anticipated by management will be realized or even if realized, will have the expected consequences to, or effects on, us or our business prospects,
financial condition or results of operations. Readers are cautioned not to place undue reliance on these forward-looking statements in making any investment decision. Forward-looking statements made in
this report apply only as of the date of this report. While we may elect to update forward-looking statements from time to time, we specifically disclaim any obligation to do so, even if internal
estimates change, unless otherwise required by applicable securities laws. The forward-looking statements contained in this report are intended to qualify for the safe harbor provisions of Section 27A of the Securities Act of 1933, as amended, and Section 21E of the Securities Exchange Act of 1934, as amended. EXHIBIT 99 2 |
 GAAP Disclaimer These materials and other financial releases can be found on the pseg.com website under
the investor tab, or at http://investor.pseg.com/
PSEG
presents
Operating
Earnings
in
addition
to
its
Income
from
Continuing
Operations/Net
Income
reported
in
accordance
with
accounting
principles
generally
accepted
in
the
United
States
(GAAP).
Operating
Earnings
is
a
non-
GAAP
financial
measure
that
differs
from
Income
from
Continuing
Operations/Net
Income.
Operating
Earnings
exclude
gains
or
losses
associated
with
Nuclear
Decommissioning
Trust
(NDT),
Mark-to-Market
(MTM)
accounting,
and
other
material
one-time
items.
PSEG presents Operating Earnings because management believes
that it is appropriate for investors to consider
results excluding these items in addition to the
results reported in accordance with GAAP. PSEG believes that the non-GAAP financial measure of Operating Earnings provides a consistent and comparable
measure of performance of its businesses to help shareholders
understand performance trends. The last two slides
in this presentation (Slides A and B) include a
list of items excluded from Income from Continuing Operations/Net Income to reconcile to Operating Earnings, with a reference to that slide
included on each of the slides where the non-GAAP
information appears. 3
|
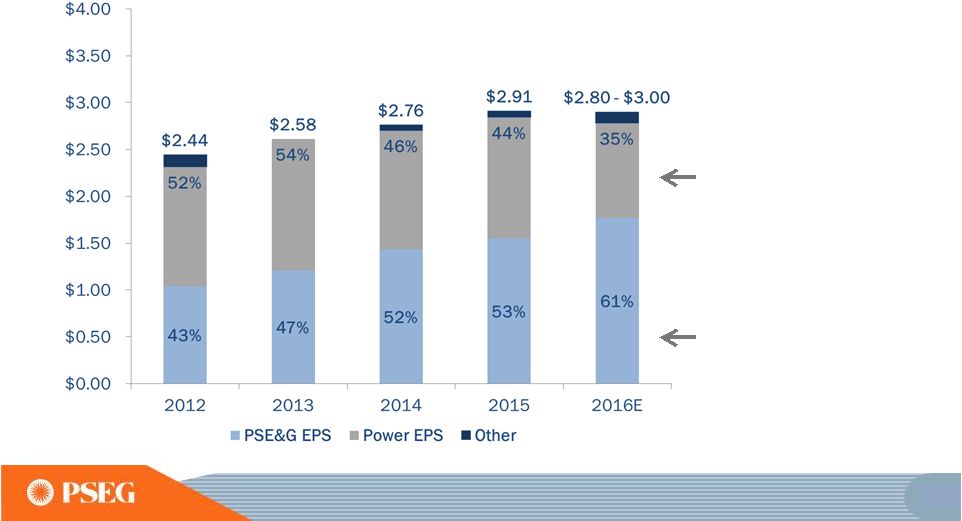 Operating Earnings Disciplined investment program and focus on operational excellence have supported growth Power’s diverse fuel mix and dispatch flexibility continue to generate strong earnings and free cash flow in low price environment PSE&G’s investment program has resulted in an increased contribution to PSEG’s earnings Operating Earnings* Contribution by Subsidiary *SEE SLIDE A FOR
ITEMS EXCLUDED FROM INCOME FROM CONTINUING OPERATIONS/NET INCOME TO RECONCILE TO OPERATING EARNINGS. E=ESTIMATE ** 2016 PERCENTS USE MIDPOINT OF 2016 OPERATING EARNINGS GUIDANCE.
**
**
14 |
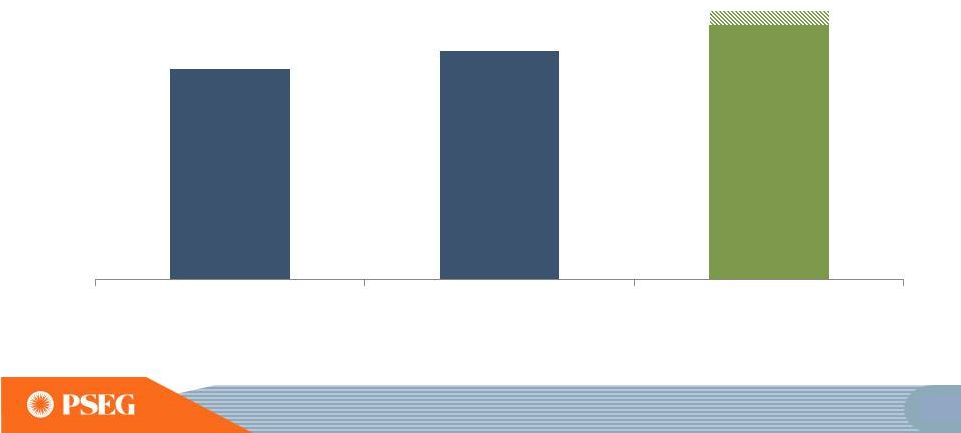 PSE&G’s 2016 operating earnings to benefit from investment programs and cost control E =ESTIMATE. $725 $787 2014 2015 2016 Guidance PSE&G Operating Earnings ($ Millions) $875 -- $925E 37 |
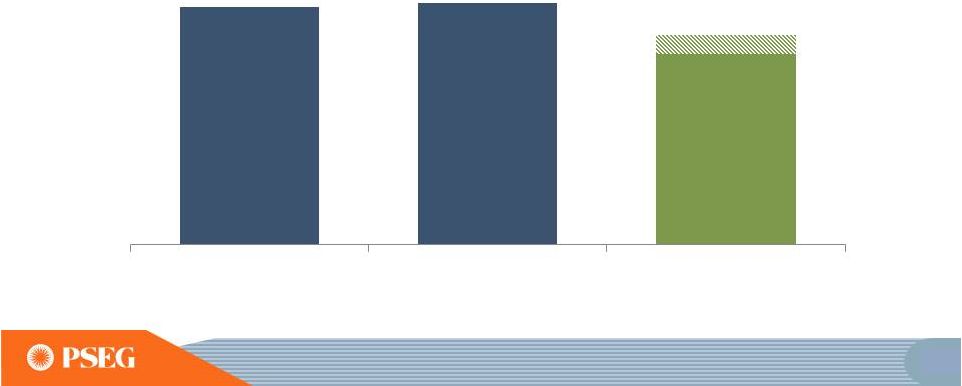 Power’s 2016 operating earnings incorporates impact from abnormally warm weather and retirement of capacity Power Operating Earnings* ($ Millions) *SEE SLIDE A FOR ITEMS EXCLUDED FROM NET INCOME TO RECONCILE TO OPERATING EARNINGS. E =
ESTIMATE. 2014
2015
2016 Guidance
$642
$653
$490 –
$540E
58 |
 PSEG Operating Earnings $ Millions (except EPS) 2012 2013 2014 2015 2016E Guidance PSE&G $528 $612 $725 $787 $875 - $925 PSEG Power $663 $710 $642 $653 $490 - $540 Enterprise/Other $45 ($13) $33 $36 $60 Operating Earnings* $1,236 $1,309 $1,400 $1,476 $1,425 - $1,525 Operating EPS* $2.44 $2.58 $2.76 $2.91 $2.80 - $3.00E % YOY Increase – PSE&G 15.9% 18.5% 8.6% 14.4% 1 % Regulated Earnings 43% 47% 52% 53% 61% 1 A higher regulated earnings mix due
to
growth in PSE&G earnings with a significant contribution from
Power *SEE SLIDE A FOR ITEMS EXCLUDED FROM INCOME
FROM CONTINUING OPERATIONS/NET INCOME TO RECONCILE
TO OPERATING EARNINGS. 1 -
BASED ON MID-POINT OF 2016 OPERATING EARNINGS
GUIDANCE. E =
ESTIMATE
77 |
 Strong financial position to support our business initiatives in 2016 and beyond 2016 and Beyond Earnings Continuing strong earnings trend in 2016 with guidance
of $2.80 to $3.00 per share
Investment
Deploying significant capital at PSE&G for projects with
contemporaneous returns
Pursuing Power projects that satisfy risk adjusted return
targets
Cash Flow and Credit
Metrics
Continuing strong internal cash flow aided by bonus
depreciation
Funding investment program without equity
issuance Dividends
Providing $0.08 per share dividend increase in 2016 with
opportunity for consistent and sustainable
growth 78 |
 PSEG Summary • 2015 earnings of $2.91 were at the upper end of our upwardly revised operating
earnings guidance of $2.85 -
$2.95 per share
• Forecast growth at PSE&G supports our 2016 guidance of $2.80 to $3.00 per share
• Forecast high single-digit rate base growth at PSE&G on five year basis from
2015 to 2020, driven by investment in transmission and approved
programs •
Power’s investment program and continued focus on
operational excellence with financial strength
delivers value in current price environment •
Strong Balance Sheet and Cash Flow support current capital
program and investment in new opportunities
without the need for equity •
Our indicative $0.08 dividend per share increase for 2016 is
consistent with our long history of returning cash
to the shareholder through the common dividend, with
opportunity for consistent and sustainable growth
90 |
 PSEG Financial Highlights Maintaining 2016 Operating Earnings* guidance of $2.80 - $3.00 per share Focused on maintaining operating efficiency and customer reliability PSE&G expected to contribute over 60% of 2016 Operating Earnings* PSEG Power: Salem Q2 refueling outage extended; testing of baffle bolts in reactor vessel complete, repair underway Infrastructure spend PSE&G • Capital spending on T&D for 2016 expected to be $3 billion • Recently filed with NJBPU to extend the Solar 4 All program with an additional $275 million
investment to develop 100 MW
dc of grid-connected, utility scale solar capacity Power has begun construction of its CCGT units in Maryland and New Jersey Financial position remains strong Strong operating cash flow at both businesses support dividend growth and fund capital spending program without the need to issue equity PSEG debt as a percentage of capitalization was 44% at March 31 Increased common dividend 5.1% to indicative annual rate of $1.64 per share Change in earnings mix supports opportunity for dividend growth * SEE SLIDE B FOR ITEMS EXCLUDED FROM NET INCOME TO RECONCILE TO OPERATING EARNINGS.
99 |
 Items Excluded from Income from Continuing Operations/Net Income to Reconcile to Operating Earnings PLEASE SEE PAGE 3 FOR AN EXPLANATION OF PSEG’S USE OF OPERATING EARNINGS AS A NON-GAAP FINANCIAL
MEASURE AND HOW IT DIFFERS FROM NET
INCOME. 2015
2014 2013 2012 2011 Earnings Impact ($ Millions) Operating Earnings 1,476 $ 1,400 $ 1,309 $ 1,236 $ 1,389 $ Gain (Loss) on Nuclear Decommissioning Trust (NDT) Fund Related Activity (PSEG Power) 8 68 40 52 50 Gain (Loss) on Mark-to-Market (MTM) (a) (PSEG Power) 93 66 (74) (10) 107 Lease Transaction Activity (PSEG Enterprise/Other) - - - 36 (173) Storm O&M (PSEG Power) 102 (16) (32) (39) - Gain (Loss) on Asset Sales and Impairments (PSEG Enterprise/Other)
- - - - 34 Income from Continuing Operations 1,679 $ 1,518 $ 1,243 $ 1,275 $ 1,407 $ Discontinued Operations - - - - 96 Net Income 1,679 $ 1,518 $ 1,243 $ 1,275 $ 1,503 $ Fully Diluted Average Shares Outstanding (in Millions) 508 508 508 507 507 Per Share Impact (Diluted) Operating Earnings 2.91 $ 2.76 $ 2.58 $ 2.44 $ 2.74 $ Gain (Loss) on NDT Fund Related Activity (PSEG Power) 0.01 0.13 0.08 0.10 0.10 Gain (Loss) on MTM (a) (PSEG Power) 0.18 0.13 (0.14) (0.02) 0.21 Lease Transaction Activity (PSEG Enterprise/Other) - - - 0.07 (0.34) Storm O&M (PSEG Power) 0.20 (0.03) (0.07) (0.08) - Gain (Loss) on Asset Sales and Impairments (PSEG Enterprise/Other) - - - - 0.06 Income from Continuing Operations 3.30 $ 2.99 $ 2.45 $ 2.51 $ 2.77 $ Discontinued Operations - - - - 0.19 Net Income 3.30 $ 2.99 $ 2.45 $ 2.51 $ 2.96 $ (Unaudited) For the Year Ended December 31, Reconciling Items, net of tax PUBLIC SERVICE ENTERPRISE GROUP INCORPORATED (a) Includes the financial impact from positions with forward delivery months.
A |