Attached files
| file | filename |
|---|---|
| 8-K - 8-K - Independence Contract Drilling, Inc. | d218649d8k.htm |
 Investor
Presentation June 27-28, 2016
www.icdrilling.com Exhibit 99.1 |
 Preliminary Matters 2 Various statements contained in this presentation, including those that express a belief, expectation or intention, as well as those that are not
statements of historical fact, are forward-looking statements. These forward-looking statements may include projections and estimates concerning the timing and success of specific projects and our future revenues, income and
capital spending. Our forward-looking statements are generally accompanied by words such as “estimate,” “project,” “predict,” “believe,” “expect,” “anticipate,”
“potential,” “plan,” “goal,” “will” or other words that convey the uncertainty of future events or outcomes. The forward-looking statements in this presentation speak
only as of the date of this presentation; we disclaim any obligation to update these
statements unless required by law, and we caution you not to rely on them unduly. We have based these forward-looking statements on our current expectations and assumptions about future events. While our management considers these expectations and assumptions to be reasonable, they are
inherently subject to significant business, economic, competitive, regulatory and other risks, contingencies and uncertainties, most of which are difficult to predict and many of which are beyond our control. These and other
important factors, including those discussed under “Risk Factors” and “Management’s Discussion and Analysis of Financial Condition and Results of Operations” included in the Company’s filings with the Securities and
Exchange Commission, including the Company’s Annual Report on Form 10-K, may cause our actual results, performance or achievements to differ materially from any future results, performance or achievements expressed or implied by these
forward-looking statements. These risks, contingencies and uncertainties include, but are not limited to, the following: our inability to implement our business and growth strategy; a sustained decrease in domestic spending by the oil and natural gas exploration and production industry;
decline in or substantial volatility of crude oil and natural gas commodity prices;
fluctuation of our operating results and volatility of our industry; inability to maintain or increase pricing on our contract drilling services; delays in construction or deliveries of our new land drilling rigs; the loss of our customer, financial distress or management changes of potential customers or failure to obtain contract renewals and additional
customer contracts for our drilling services; an increase in interest rates and deterioration in the credit markets; our inability to raise sufficient funds through debt financing and equity issuances needed to fund our planned rig construction
projects; our inability to comply with the financial and other covenants in debt agreements that we may enter into as a result of reduced revenues and
financial performance; a substantial reduction in borrowing base under our revolving credit facility as a result of a decline in the appraised value of our drilling
rigs; overcapacity and competition in our industry; unanticipated costs, delays and other difficulties in executing our long-term growth
strategy; the loss of key management personnel; new technology that may cause our drilling methods or equipment to become less competitive;
labor costs or shortages of skilled workers; the loss of or interruption in operations of one or more key vendors; the effect of operating hazards and severe weather on our rigs, facilities, business, operations and financial results, and limitations on our
insurance coverage; increased regulation of drilling in unconventional formations; the incurrence of significant costs and liabilities in the future resulting from our failure to comply with new or existing environmental
regulations or an accidental release of hazardous substances into the environment; the potential failure by us to establish and maintain effective internal control over financial reporting;
lack of operating history as a contract drilling company; and uncertainties associated with any registration statement, including financial statements, we may be required to file with the SEC.
All forward-looking statements are necessarily only estimates of future results, and
there can be no assurance that actual results will not differ materially from expectations, and, therefore, you are cautioned not to place undue reliance on such statements. Any forward-looking statements are qualified in their entirety by reference to the factors discussed throughout this
presentation. Further, any forward-looking statement speaks only as of the date on which it is made, and we undertake no obligation to update any forward-looking statement to reflect events or circumstances after the date on which the
statement is made or to reflect the occurrence of unanticipated events. EBITDA and Adjusted EBITDA are supplemental non-GAAP financial measures that are used by management and external users of the Company’s
financial statements, such as industry analysts, investors, lenders and rating agencies. The Company defines “EBITDA” as earnings (or loss) before interest, taxes, depreciation, and amortization, and it defines
“Adjusted EBITDA” as EBITDA before stock-based compensation, and non-cash asset impairments and gain (or loss) on asset disposition. EBITDA and Adjusted EBITDA are not measures of net income as determined by U.S. generally accepted
accounting principles (“GAAP”).
The Company’s management believes EBITDA and Adjusted EBITDA are useful because
such measures allow the Company and its stockholders to more effectively evaluate its operating performance and compare the results of its operations from period to period and against its peers without regard to its financing methods or capital structure. The Company excludes the
items listed below from net income (loss) in calculating EBITDA and Adjusted EBITDA because these amounts can vary substantially from company to company within the Company’s industry depending upon accounting methods and book
values of assets, capital structures and the method by which the assets were
acquired. EBITDA and Adjusted EBITDA should not be considered alternatives to, or more
meaningful than, net income (loss), the most closely comparable financial measure calculated in accordance with GAAP or as an indicator of the Company’s operating performance or liquidity. Certain items excluded from Adjusted EBITDA are significant components in understanding and
assessing a company’s financial performance, such as a company’s cost of capital and tax structure, as well as stock-based compensation and the historic costs of depreciable assets, none of which are components of Adjusted
EBITDA. The Company’s presentation of EBITDA and Adjusted EBITDA should not be construed as an inference that its results will be unaffected by unusual or non-recurring items. The Company’s computations of EBITDA and
Adjusted EBITDA may not be comparable to other similarly titled measures of other companies. |
 ICD
Rig Location 1.
A pad-optimal rig consists of four key drilling and two key moving attributes: 1,500
hp, bi-fuel capable, 7500psi high pressure mud systems, AC VFD drive, an omni-directional walking system and ability to undertake fast conventional rig moves safely. 2. Includes 12 200 Series ShaleDriller® rigs. Excludes two 100 Series non-walking rigs. One 100 Series rig converted to 200 Series
status at 3/31/16 and entered the marketed fleet 4/1/16 and commenced drilling operations June 2016. Final 100 Series rig scheduled for conversion when market conditions improve.
3. Market data as of 6/23/2016. Debt and cash balances as of 3/31/16, adjusted for recent equity offering.
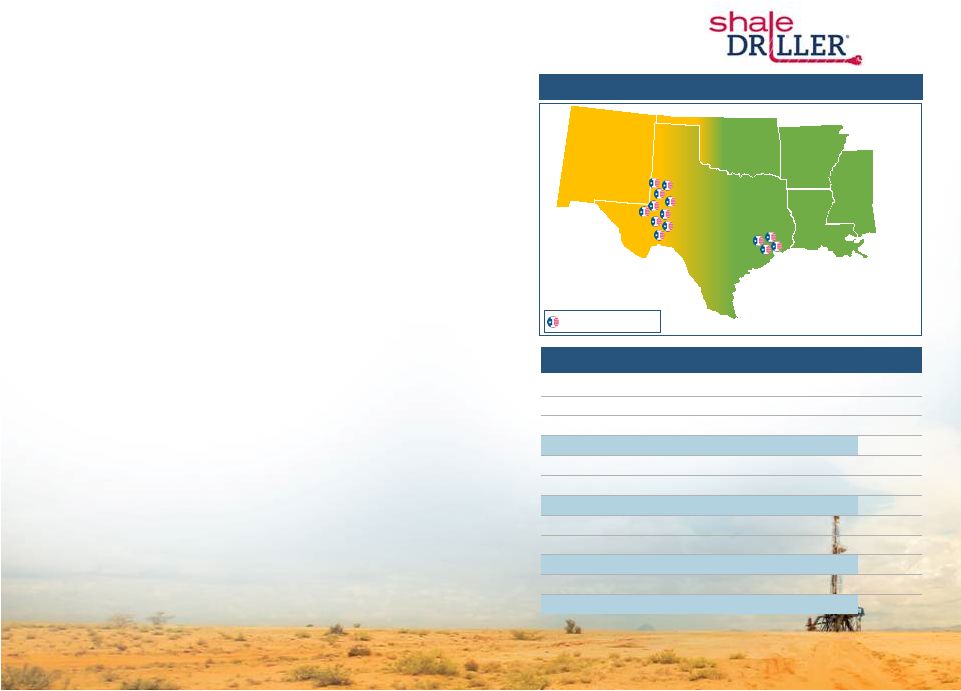
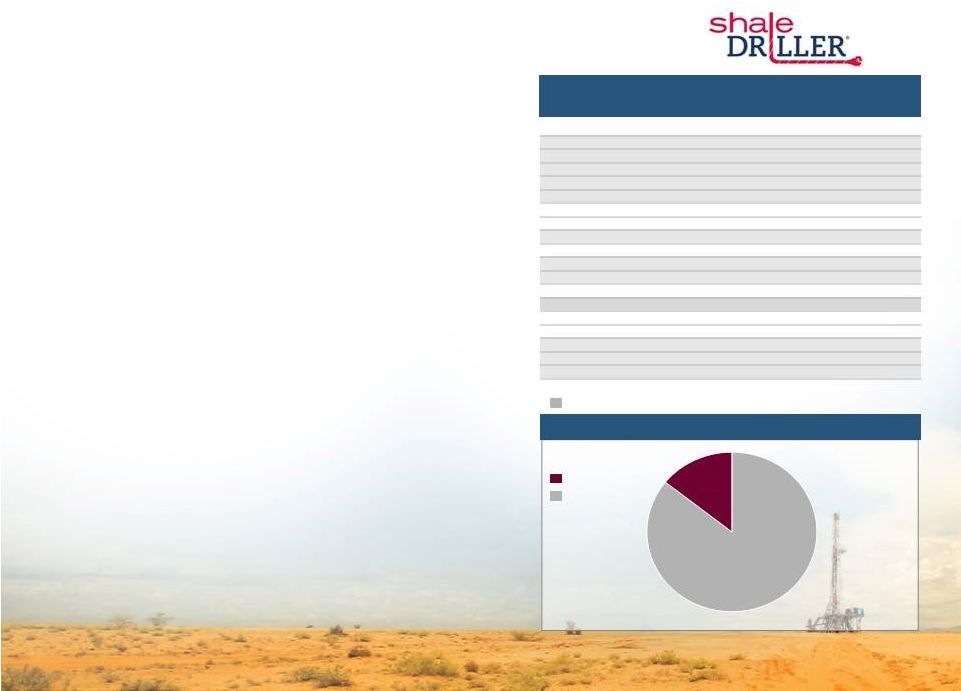
Corporate Snapshot Sector’s most technologically advanced land drilling rigs • Fleet composed of thirteen 200 Series ShaleDriller ® rigs and one 100 Series ShaleDriller rig Remaining 100 Series rig scheduled for conversion to 200 Series pad-optimal (1) status when market conditions improve • The speed, efficiency and safety offered by ICD’s rigs dramatically reduce
drilling times, thereby saving significant capex dollars for E&P
operators Established reputation for operational excellence and
safety •
Safety focused operations (SEMS II compliant)
• Average 200 Series ShaleDriller ® fleet age: ~2 years • Best-in-class operating stats: lateral length and uptime • Industry leading utilization: ~86% during 1Q’16 (2) • Established, experienced and well-known management team • Work with well-known customers who pay for quality Current Operational Footprint Current Capitalization & Liquidity (3) US$MM, unless otherwise noted Share Price ($/Share) 5.75 Share Outstanding (MM) 37.6 Equity Value 216.2 Long-term debt 19.7 Cash 7.4 Aggregate Value 243.3 Borrowing Base Unused Capacity 65.3 Cash 7.4 Total Current Liquidity 72.7 Book Value of Equity 276.5 Total Capitalization 296.2 3 Texas Oklahoma Arkansas Louisiana New Mexico Target Areas of Growth Texas, Louisiana, Oklahoma and New Mexico May 31, 2016 – |
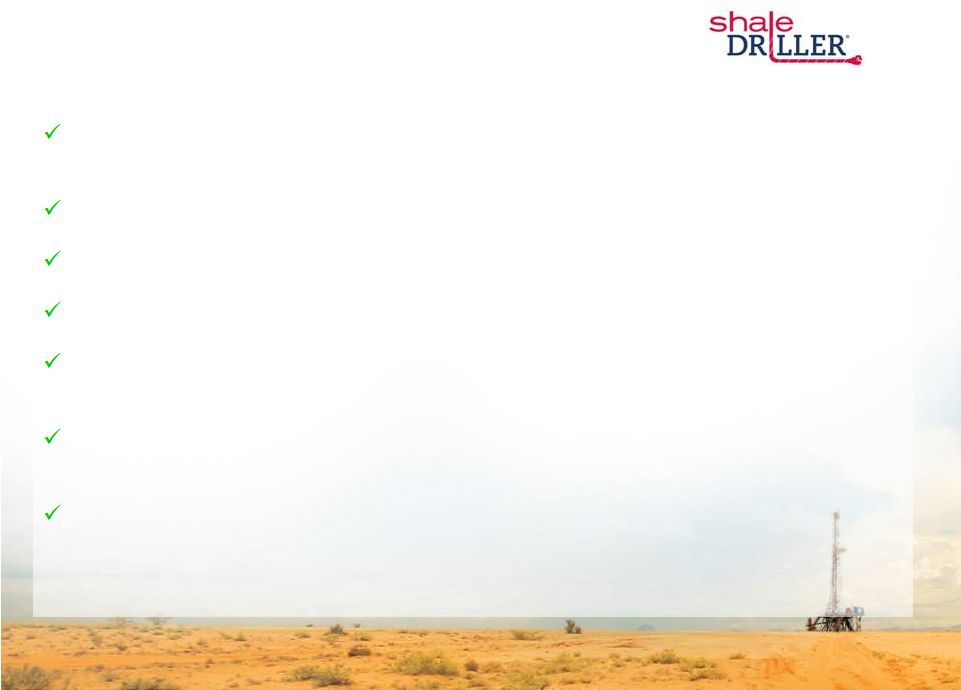
 • Increase in customer inquiry in past 45 days resulting in multiple opportunities for reactivation of idle rigs • Since 1Q’16 conference call: - Authorized additional purchases of $3.2 million for inventory items relating to adding 7,500psi
mud systems and other additions to meet requirements of new opportunities
- Mobilized Rig 217 (recently converted 100 Series rig) for drilling operations on multi-well (4+
wells) pad commencing June 2016
- Extended operations under term contract expiring in early May to early June ‘16. Contract
expired in June and ICD is actively marketing the rig
- Extended two existing spot market contracts for additional operations into middle of 3Q’16
- Net result is slight decrease in projected 2Q’16 revenue days compared to prior guidance
Market & Operational Update
4 |
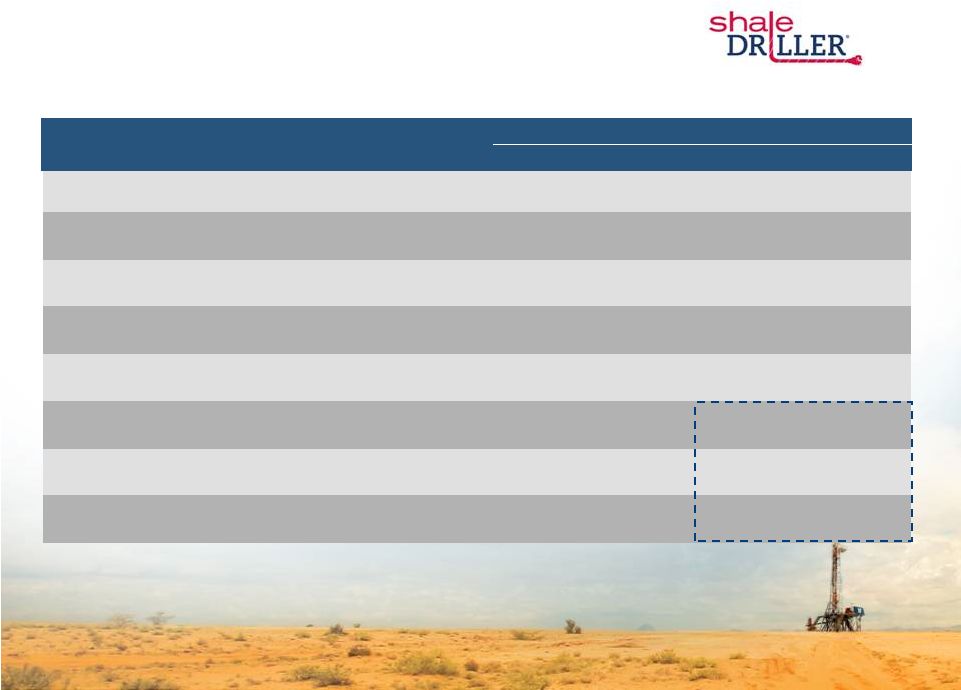
 ICD is a leader in the rig replacement cycle – pad-optimal rigs are critical in the progression of the U.S. unconventional drilling evolution With industry leading fleet utilization, ICD is a rig provider of choice By driving faster cycle times, ICD’s rigs bend the E&P cost curve down ICD’s standardized fleet supports lower capital intensity Modular construction gives ICD a low cost rig fleet and provides a compounding capital advantage ICD’s “Big Data” collection capability allows ICD to participate in the next
wave in drilling technology innovation
ICD’s rigs provide revenues and EBITDA with low maintenance capital
expenditures and tax burden
Key Differentiators Driving ICD’s
Compelling Value Proposition 5 |
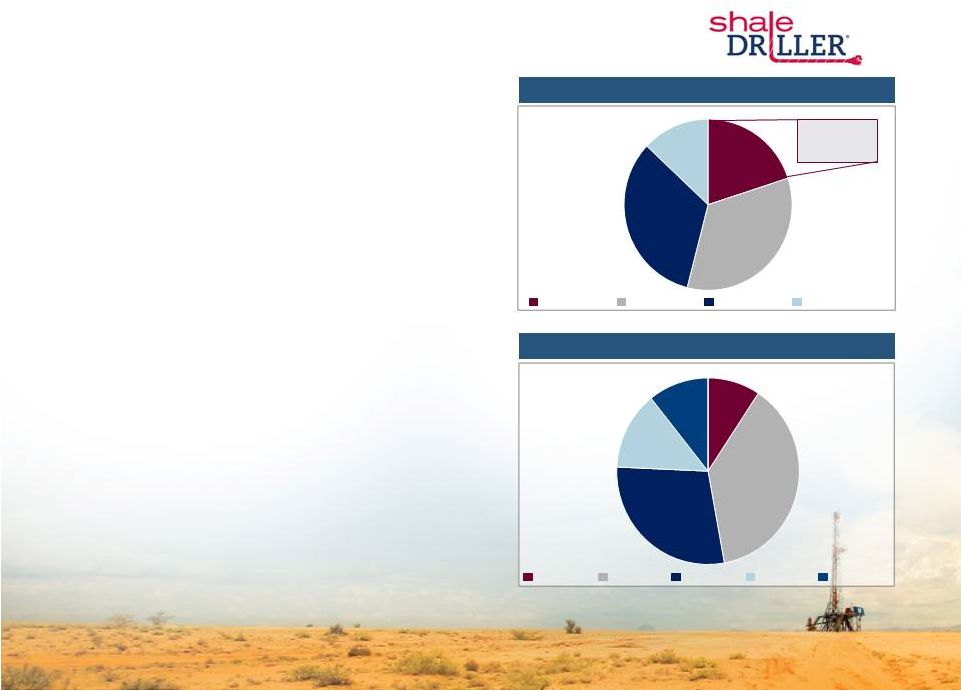 Competitor 4 Competitor 3 Competitor 2 Competitor 1 ICD (ShaleDriller®) Dissecting the New Land Drilling Industry 6 New Land Drilling Industry – Pad-Optimal Fleet (2) Land Drilling Industry – AC Rig Fleet (1) 1. Includes only 1,500 hp AC rigs 2. Includes ICD estimates for ICD and its four largest competitors. Excludes skidding rigs.
750 Rigs Pad-optimal Skidding Non-Moving Other Source: ICD, Competitor Investor Presentations, Competitor Websites As E&P operators continue the shift towards a wellbore manufacturing model, the focus will be on the rigs that consistently eliminate non-productive time and drive operating efficiencies • Pad-optimal rigs represent equipment that is best suited for wellbore manufacturing - Drill more wells per year and accelerates E&P operators’ production profiles and cash flows Market access to pad-optimal rigs is extremely limited, with only ~140 active today (2) • AC is no longer a differentiating technology - Of the ~750 1500hp AC rigs in the U.S., ICD estimates only ~20% of them have the equipment necessary to be pad-optimal ICD’s pad-optimal rigs eliminate non-productive time, drill longer laterals faster and for less cost, and materially reduce cycle times ~140 Rigs Source: Public Presentations New Land Drilling Industry 20% 34% 33% 13% 9% 38% 29% 13% 11% |
       High
Pressure Mud Pumps Pad-Optimal Rig Characteristics -
As Defined by E&P Operators
Omni-Directional Walking System
• Allows rig to move in any direction quickly between wellheads, rapidly and efficiently adjusts to
misaligned wellbores, walks over raised well heads and increases safety
• Superior to skidding systems which can only move to properly aligned wells in a straight line
• Self-leveling capabilities 1,500 hp Drawworks • Rigs powered with 1,500 hp drawworks are well suited to the majority of unconventional resource
formations • Ideally sized for drilling longer laterals while occupying a small footprint on the job site
Bi-Fuel Capabilities
• Operator can change between diesel or natural gas mix • Use of natural gas/diesel blend can result in major savings • Reduces carbon emissions • High pressure mud pumps allow for drilling mud to be pumped through extended horizontal laterals
• Necessary for drilling the long laterals required by complex horizontal drilling programs
7 Fast Moving • Specifically designed to reduce cycle times (reduces rig-move time between drilling locations)
• Designed to minimize truck loads (and times) required for moves between drilling sites; complete move
in 48 hours (4 daylight days or less)
AC Programmable • Uses a variable frequency drive that allows for precise computer control of key drilling parameters
during operations, providing accurate drilling through the wellbore
• AC rigs drill faster with less open hole time and superior wellbore geometry vs. mechanical or SCR rigs
• In today’s market, it is no longer a differentiating feature, it is a requirement |
 Value
Proposition of ICD’s ShaleDriller
® Rig • Mechanical and SCR rigs have shorter bit life, higher wellbore deviation and longer open hole times – they drill slower and with less precision than ICD’s ShaleDriller ® AC rigs – Cycle time reductions gained using ICD’s ShaleDriller® rigs bend the drilling cost curve down • Performance attributes like omni-directional walking, bi- fuel capable, 1,500 hp drawworks, high pressure mud systems, and fast moving capabilities are a rare combination – Only ~140 of these pad-optimal rigs are estimated to be active in the North American fleet – ICD’s rig fleet has these capabilities, allowing for operations on the largest pad drilling sites – even with misaligned wellbores and uneven pads As commodity prices rise, pad-optimal rigs will be in short supply (and high demand) while legacy rigs will continue to be a liability to drilling contractors without pure-play, high-spec fleets Pad Optimal ShaleDriller ® vs. Non-Pad-Optimal 8 Pad Optimal ShaleDriller ® vs. Legacy / SCR • Legacy AC rigs move slower and cannot accommodate complex pad drilling applications • Pad-optimal rigs provide: – Omni-directional walking – can move around complex pads efficiently – Ability to drill longer laterals – Long, accurate gauge wells – completable – Faster drilling times – Self leveling, with no additional equipment required – Able to adjust quickly to misaligned wellbores – Minimizes formation damage – Elimination of non-productive time and costs – Fastest moving between wells and pads Pad-optimal rigs provide the industry’s best value proposition, even at higher dayrates |
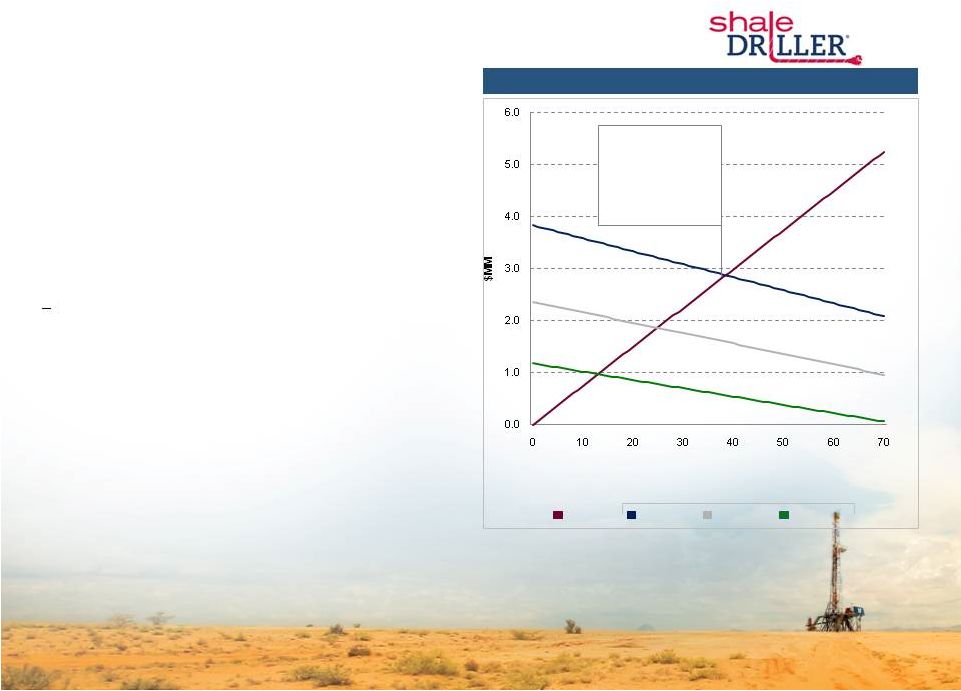 Cutting
only 39 days off a 295 day
drilling program justifies the incremental cost of a $25k/day pad- optimal rig $16,000 Dayrate $20,000 Dayrate $25,000 Dayrate Incremental Cost of a Pad-Optimal Rig (2) AFE Savings Examples of ICD Delivering Significant Value for E&P Operators Cutting Cycle Times - Illustrative Savings vs Legacy Rigs 1. Assumes $75,000 operator spread cost over 70 days 2. Based on $12,000 dayrate for legacy rig for a 295 day program; incremental cost calculated as Pad-Optimal Rig Cost * (295 –
Days Saved) – Legacy Rig Cost * 295 days 9 Case Study: Multi-Well Pad Drilling Program The industry’s unconventional resource development techniques are rapidly trending towards multi-well development • An operator drilling multi-well pads benefits from ICD’s pad-optimal technology (vs. 1 – 2 wells per pad), by reducing cycle times as the number of moves and move durations decline Non-pad-optimal rigs, with legacy skidding or slow walking systems, are effective on 1-2 wells per pad but cannot efficiently prosecute larger well pads that are rapidly becoming the industry norm today • Results in major cost savings for E&P operators • In an environment where total operator spread costs can approach $75,000/day on a wellsite, the incremental dayrate for a pad-optimal rig is marginal • In 2015, for a large E&P operator utilizing a pad drilling program, ICD cut 70 days and $5.3MM off their original AFE drilling budgets $5.3MM (1) Drilling Program Days Saved |
 Current or Recent ICD customers
High-Quality Customer Base
Source: Wall Street Consensus Estimates and Company Guidance as of April 7, 2016
ICD Customers Include Some of the Highest Quality,
Most Active Players in the Permian Basin
ICD has established a deep and high-quality customer base composed
of some of the most active players in the Permian Basin
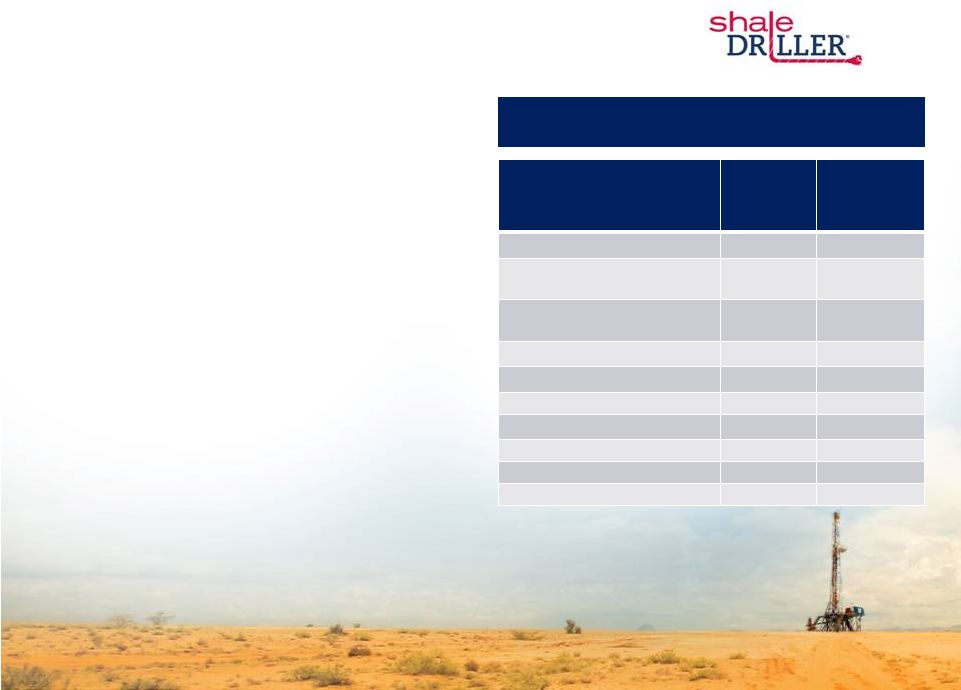
• ICD holds strong contract backlogs relative to peers in the land drilling industry – Backlog at 3/31/16: $57.4 million (1) – $23.5 million extends beyond 2016 – Additional rigs working on short-term contracts with durations less than six months • ICD’s fleet standardization provides several benefits for customers including consistent branding, predictability in performance and quick understanding of the rig’s capabilities • ICD is focused on strategically expanding its customer base – Target customers with significant investments and willingness to drill through industry cycles – Target operators who value safety and efficient operations – Focus on customers willing to enter into long-term contractual relationships 10 ICD Customer Base Breakdown (2) Publicly Traded Private 1. Backlog does not include potential reductions in rates for unscheduled standby during periods in which the rig is moving, on standby or incurring
maintenance and repair time in excess of contractually allowed downtime. In addition, ICD currently expects that several rigs under term contracts will realize revenue on a standby-without-crew basis, which preserves expected cash margins from the contract
but reduces overall top line revenue included in backlog. To the extent
that rigs under term contracts operate on a standby or standby-without-crew basis, top line revenues will be less than reported backlog from term contracts. 2.. As of 5/31/2016 86% 14% Company 2016E Total Capex ($MM) Anadarko Petroleum Corporation 2,800 Pioneer Natural Resources 2,000 Apache Corporation 1,600 Devon Energy 1,308 Concho Resources 1,200 SM Energy 705 Cimarex Energy 675 Newfield Exploration 650 QEP Resources 475 Parsley Energy 405 Laredo Petroleum 345 Diamondback Energy 313 Energen Energy 300 RSP Permian 230 Approach Resources 50 BOPCO N/A Elevation Resources N/A Silver Hill Energy N/A |
 Significant Pro Forma Financial Flexibility
Post-Offering 11 Cash and Cash equivalents 7.4 7.4 Long-Term Debt (2) 62.7 19.7 Total ICD Stockholders’ Equity 233.5 276.5 Total Capitalization 296.2 296.2 Undrawn Revolver (3) 22.3 65.3 Available Liquidity (4) 29.7 72.7 Net Debt / LTM Adj. EBITDA (5) 2.1x 0.5x Total Debt / Total Capitalization 21% 6.7% Actual ($MM) As of 3/31/2016 As Adjusted ($MM) (1) 1. Adjusted for receipt of net offering proceeds of approximately $43.0 million from equity offering completed 4/26/16.
2. Excludes capitalized vehicle leases. 3. Reflects credit facility aggregate commitments of $85MM. 4. Available Liquidity = Cash + Available Revolver Capacity. 5. LTM Adjusted EBITDA as of 3/31/2016 of $26.5MM. See appendix for reconciliation of non-GAAP financial items
|
 ICD Poised
to Restart Growth When Market Conditions Improve
Expect to generate free cash flow in 2016
• ICD generated free cash flow in 1Q’16 • ICD capital budget for the remainder of 2016 is approximately $10.7 million, including recently approved addition of $3.2 million relating to adding 7,500 psi mud systems and other additions to meet requirements of new opportunities ICD has already made significant investment towards its final 100 Series upgrade and next two newbuild ShaleDriller® rigs • @ 12/31/16, ICD estimates an additional $25 million required to complete these three capital projects. Following completion of these projects, ICD fleet would be comprised of 16 200 Series ShaleDriller® rigs • Three month time period to complete each project When market conditions improve, ICD is ideally positioned to complete the next three planned capital projects while still maintaining a very strong liquidity position 12 Financial Flexibility and Liquidity 1. Pro forma @ March 31, 2016 for recent equity offering. 2. Pro forma @ March 31, 2016 for recent equity offering adjusted to reflect remaining 2016 budgeted capex and remaining incremental capex on
next 3 capital projects. 3.
Estimated additional capital expenditures necessary to complete remaining rig conversion
and next two ShaleDriller® newbuilds. 4.
LTM Adjusted EBITDA as of 3/31/2016 of $26.5 MM, see appendix for reconciliation of
non-GAAP financial items $MM
Pro Forma (1) Pro Forma Adjusted for Incremental Capex (2) Cash @ 3/31/16 $7.4 $7.4 Plus: Revolving Credit Facility Capacity @ 3/31/16 85.0 85.0 Less: Outstanding Borrowings @ 3/31/16 (19.7) (19.7) Total Liquidity $72.7 $72.7 Less: Remaining 2016 capex (10.7) Incremental Growth capex (3) (25.0) Total Liquidity Adjusted (2) $72.7 $37.0 Net Debt / LTM Adj. EBITDA (4) 0.5x 1.7x Total Debt / Total Capitalization 6.7% 17.6% |
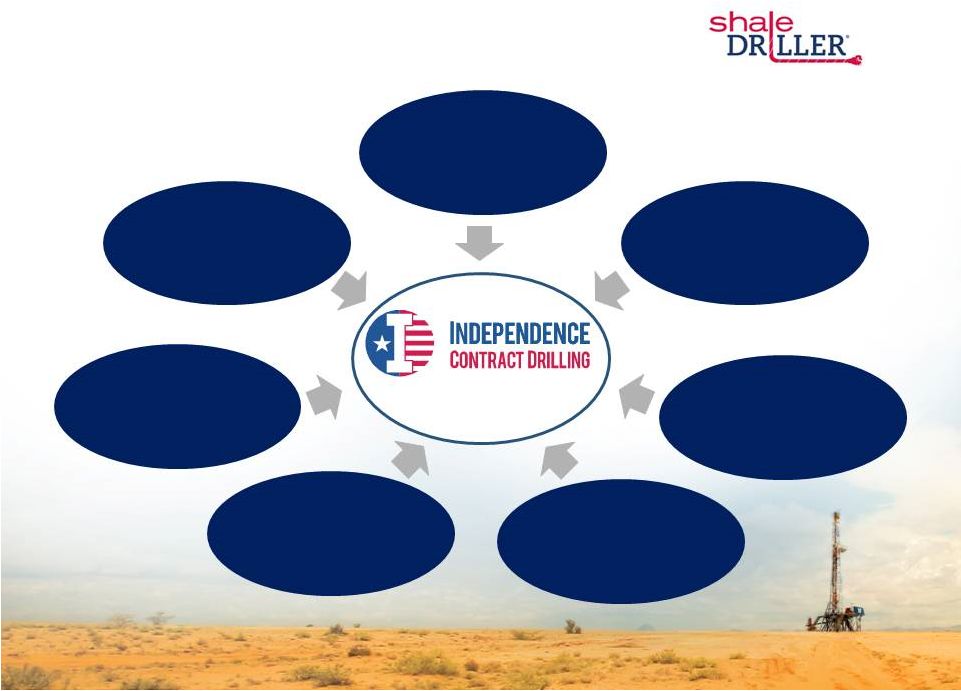 ICD
Provides a Differentiated Value Proposition to E&P
Operators 13
Land Drilling’s Only
Pure-Play, Pad-optimal,
Growth Story Large Operators are Leading Unconventional Resource Capture Major Secular Shift in Unconventional Development is Underway Ongoing Resource Play Development Driving a Rig Replacement Cycle Pad-optimal AC Drilling Rigs are in Short Supply Major Barriers to Entry Exist for New Contract Drillers Vertically Integrated Model Provides a Compounding Capital Advantage ShaleDriller ® Offers a Compelling Value Proposition to E&P Customers |
 Non-GAAP Financial Measures
14 Adjusted EBITDA is a supplemental non-GAAP financial measure that is used by management and external users of our financial statements, such
as industry analysts, investors, lenders and rating agencies. We define
"EBITDA" as earnings (or loss) before interest, taxes, depreciation, and amortization, and we define "Adjusted EBITDA" as EBITDA before stock-based compensation, non-cash asset impairments, gains or losses on disposition of assets and other non-operating items.
Adjusted EBITDA is not a measure of net income as determined by U.S.
generally accepted accounting principles ("GAAP"). Management
believes Adjusted EBITDA is useful because it allows our stockholders to more effectively evaluate our operating performance and compare the results of our operations from period to period and against our peers without regard to our financing methods or capital structure. We exclude the items listed above from
net income (loss) in calculating Adjusted EBITDA because these amounts
can vary substantially from company to company within our industry depending upon accounting methods and book values of assets, capital structures and the method by which the assets were acquired. Adjusted EBITDA should not be considered an alternative to, or more meaningful than,
net income (loss), the most closely comparable financial measure
calculated in accordance with GAAP or as an indicator of our operating performance or liquidity. Certain items excluded from Adjusted EBITDA are significant components in understanding and assessing a company's financial performance, such as a company's cost of capital and tax
structure, as well as stock-based compensation and the historic costs
of depreciable assets, none of which are components of Adjusted EBITDA. Our presentation of Adjusted EBITDA should not be construed as an inference that our results will be unaffected by unusual or non-recurring items. Our computations of Adjusted EBITDA may not be
comparable to other similarly titled measures of other companies.
The following table presents a reconciliation of Adjusted EBITDA to the
GAAP financial measure of net income for each of the periods indicated: March 31, 2016 March 31, 2015 December 31, 2015 (in thousands) Net (loss) income $
(414)
$
1,375
$
(5,226) Add back: Income tax expense (benefit) 4 (155) 61 Interest expense 977 312 1,363 Depreciation and amortization 5,825 4,289 6,058 EBITDA 6,392 5,821 2,256 Stock-based compensation 1,155 933 1,071 (Insurance recoveries) asset impairment, net - (841) 3,549 (Gain) loss on disposition of assets (125) 393 338 Adjusted EBITDA $
7,422
$
6,306
$
7,214 Three Months Ended (Unaudited) |
 15 |