Attached files
| file | filename |
|---|---|
| EX-32.2 - EXHIBIT 32.2 - SALON MEDIA GROUP INC | ex32-2.htm |
| EX-32.1 - EXHIBIT 32.1 - SALON MEDIA GROUP INC | ex32-1.htm |
| EX-31.2 - EXHIBIT 31.2 - SALON MEDIA GROUP INC | ex31-2.htm |
| EX-31.1 - EXHIBIT 31.1 - SALON MEDIA GROUP INC | ex31-1.htm |
| EX-23.1 - EXHIBIT 23.1 - SALON MEDIA GROUP INC | ex23-1.htm |
SECURITIES AND EXCHANGE COMMISSION
Washington, DC 20549
FORM 10-K
[X] ANNUAL REPORT PURSUANT TO SECTION 13 OR 15(d) OF THE SECURITIES EXCHANGE ACT OF 1934
For the fiscal year ended March 31, 2016
or
[ ] TRANSITION REPORT PURSUANT TO SECTION 13 OR 15(d) OF THE SECURITIES EXCHANGE ACT OF 1934
For the transition period from to
Commission file number 0-26395

SALON MEDIA GROUP, INC.
(Exact name of Registrant as specified in its charter)
|
Delaware |
94-3228750 |
|
(State of Incorporation) |
(IRS Employer Identification No.) |
870 Market Street
San Francisco, CA 94102
(Address of principal executive offices)
(415) 870-7566
(Registrant's telephone number, including area code)
Securities registered pursuant to Section 12(b) of the Act:
None
Securities registered pursuant to Section 12(g) of the Act:
Common Stock, $0.001 Par Value
(Title of Class)
Indicate by check mark if the registrant is a well-known seasoned issuer, as defined in Rule 405 of the Securities Act. Yes [ ] No [X]
Indicate by check mark if the registrant is not required to file reports pursuant to Section 13 or Section 15(d) of the Act. Yes [ ] No [X]
Indicate by check mark whether the Registrant (1) has filed all reports required to be filed by Sections 13 or 15(d) of the Securities Exchange Act of 1934 during the preceding 12 months (or for such shorter period that the Registrant was required to file such reports), and (2) has been subject to such filing requirements for the past 90 days. Yes [X] No [ ]
Indicate by check mark whether the registrant has submitted electronically and posted on its corporate Web site, if any, every Interactive Data File required to be submitted and posted pursuant to Rule 405 of Regulation S-T (§232.405 of this chapter) during the preceding 12 months (or for such shorter period that the registrant was required to submit and post such files). Yes [X] No [ ]
Indicate by check mark if disclosure of delinquent filers pursuant to Item 405 of Regulation S-K is not contained herein, and will not be contained, to the best of registrant’s knowledge, in definitive proxy or information statements incorporated by reference in Part III of this Form 10-K or any amendments to this Form 10-K. [ ]
Indicate by check mark whether the registrant is an accelerated filer as defined in Rule 12b-2 of the Act.
Large accelerated filer ☐ Accelerated filer ☐ Non-accelerated filer ☐ Smaller reporting company ☑
Indicate by check mark whether the registrant is a shell company (as defined by Exchange Act Rule 12b-2).Yes [ ] No [X]
The aggregate market value of the voting stock held by non-affiliates of the registrant was approximately $3,055,000 based on the closing sale price of the registrant’s Common Stock on June 1, 2016. Shares of Common Stock held by each then current executive officer and director and by each person who is known by the registrant to own 5% or more of the outstanding Common Stock have been excluded from this computation in that such persons may be deemed to have been affiliates of Salon Media Group, Inc. This determination of affiliate status is not a conclusive determination for other purposes.
The number of outstanding shares of the Registrant's Common Stock, par value $0.001 per share, on June 1, 2016 was 76,245,442 shares.
FORM 10-K
SALON MEDIA GROUP, INC.
INDEX
| Page | |||
|
PART I |
Number | ||
|
ITEM 1. |
Business |
3 |
|
|
ITEM 1A. |
Risk Factors |
12 |
|
|
ITEM 1B. |
Unresolved Staff Comments |
21 |
|
|
ITEM 2. |
Properties |
21 |
|
|
ITEM 3. |
Legal Proceedings |
21 |
|
|
ITEM 4. |
Mine Safety Disclosures |
21 |
|
|
PART II |
|||
|
ITEM 5. |
Market for Registrant’s Common Equity and Related Stockholder Matters, and Issuer Purchases of Equity Securities |
21 |
|
|
ITEM 6. |
Selected Financial Data |
22 |
|
|
ITEM 7. |
Management’s Discussion and Analysis of Financial Condition and Results of Operations |
23 |
|
|
ITEM 7A. |
Quantitative and Qualitative Disclosures about Market Risk |
31 |
|
|
ITEM 8. |
Financial Statements and Supplementary Data |
32 |
|
|
ITEM 9. |
Changes in and Disagreements with Accountants on Accounting and Financial Disclosures |
52 |
|
|
ITEM 9A. |
Controls and Procedures |
52 |
|
|
ITEM 9B. |
Other Information |
53 |
|
|
PART III |
|||
|
ITEM 10. |
Directors, Executive Officers and Corporate Governance |
54 |
|
|
ITEM 11. |
Executive Compensation |
57 |
|
|
ITEM 12. |
Security Ownership of Certain Beneficial Owners and Management and Related Stockholder Matters |
64 |
|
|
ITEM 13. |
Certain Relationships and Related Transactions, and Director Independence |
66 |
|
|
ITEM 14. |
Principal Accountant Fees and Services |
67 |
|
|
PART IV |
|||
|
ITEM 15. |
Exhibits, Financial Statement Schedules |
68 |
|
|
SIGNATURES |
70 | ||
PART I
This report contains “forward-looking statements” within the meaning of Section 27A of the Securities Act of 1933 and Section 21E of the Securities Exchange Act of 1934, as amended (the “Exchange Act”) that involve risks and uncertainties, including but not limited to statements regarding our strategy, plans, objectives, expectations, intentions, financial performance, cash-flow breakeven timing, financing, economic conditions, Internet advertising market performance, subscription service plans, social media and other non-web opportunities and revenue sources. Although Salon Media Group, Inc. (“Salon”, the “Company”, “we”, “our” or “our”) believes its plans, intentions and expectations reflected in such forward-looking statements are reasonable, it can give no assurance that such plans, intentions or expectations will be achieved. Salon’s actual results may differ significantly from those anticipated or implied in these forward-looking statements as a result of the factors set forth above and in Salon’s public filings. Salon assumes no obligation to update any forward-looking statements except as required by law.
Salon’s actual results may differ significantly from those anticipated or implied in these forward-looking statements as a result of the factors set forth in “Risk Factors.” “Management’s Discussion and Analysis of Financial Condition and Results of Operations” are elsewhere in this Annual Report. In this Annual Report, the words “anticipates,” “believes,” “expects,” “estimates,” “intends,” “future,” and similar expressions identify forward-looking statements. Readers are cautioned not to place undue reliance on these forward-looking statements, which speak only as of the date hereof.
ITEM 1. Business
OVERVIEW
Salon is an online news website committed to fearless journalism and to making the conversation smarter. Our award-winning journalism combines original investigative stories and provocative personal essays along with quick-take commentary and staff-written articles about politics, culture, entertainment, sustainability, innovation, technology and business.
Salon was originally incorporated in July 1995 in the State of California and reincorporated in Delaware in June 1999. In 1999, we had our initial public offering. In 2001, we adopted the name Salon Media Group, Inc. Our common stock is traded in the over-the-counter market and our stock symbol is SLNM.PK.
Highlights from Fiscal Year 2016
During the fiscal year ended March 31, 2016 (“fiscal year 2016”), we continued to execute our business strategy (see “Salon Strategy” below) to broaden our editorial coverage in order to attract a larger audience, which in turn should attract more advertising, and increase our revenues. Our focus on high quality editorial attracted a continued robust audience to our Website in fiscal year 2016, and we regularly reached new traffic milestones throughout the year. However, we faced increased competition from both new and larger websites for online advertising campaigns, while industry trends shifted toward increased use of agency and software-based approaches to buying online advertising. As a result, our direct ad sales have declined, and we have increasingly relied on third-party agencies to sell ads on our Website through programmatic advertising open marketplaces. The highlights of our fiscal year 2016 are listed below:
|
● |
Total revenue in the fiscal year 2016 increased 41% to $7.0 million. We have been working on strategies to better monetize our Website and increase advertising revenues. The digital advertising landscape has shifted considerably over the past year, and as advertisers have increasingly focused their attention on video and programmatic selling, we have increased our efforts in those areas. In fiscal year 2016, 67% of our advertising revenue was generated by programmatic selling, and 33% by our direct sales team which continues to focus mostly on high impact and higher cost-per-thousand-impression (“CPM”) video advertising. With the recent launch of Facebook’s ad sharing program, we will begin to monetize Salon content that is posted away from our website. We believe these strategies should help us to increase our revenues in fiscal year 2017. |
|
● |
Net loss for the fiscal year 2016 was $2.0 million, a 50% decrease from $3.9 million in the fiscal year ended March 31, 2015 (“fiscal year 2015”). The decrease in losses resulted from an increase in revenues and relatively stable operating expenses of $8.9 million for the corresponding periods. |
|
● |
The launch of our editorial video production department was a highlight of fiscal year 2016. In September 2015, we launched original video content focused on news, politics and entertainment. Our goal is to add high quality diversified content to our Website, and to attract premium video advertising that commands higher CPMs as compared to display advertising. More than 250 original videos were produced during the March quarter. A number of original videos went viral on Facebook: Patrice Waite’s story about Donald Trump contradicting himself about violence at his rallies garnered more than 14 million views on Facebook, Asha Parker’s mash up of Donald Trump and scenes from the Big Lebowski has been viewed more than 16 million times, and Janet Upadhye’s story about the political apathy of American youth got more than 40 million views. In total, more than 10 videos were viewed in excess of 1 million times, and many more were viewed more than 100,000 times. We will continue to assess and refine the video product based on user adoption. These videos complement Salon’s brand of fearless journalism that makes the conversation smarter, and are designed for maximum share-ability on social media sites. |
|
● |
We reached several new traffic milestones. Our peak monthly users for Salon.com (or, the “Website”) traffic in fiscal year 2016 was in June 2015 when we recorded 19.6 million users, as measured by Google Analytics. In total, the average number of monthly users in fiscal year 2016 was 16.6 million, compared to 16.9 million in fiscal year 2015, a decrease of 2%. Unique visitors as measured by comScore (U.S. desktop) reached a high of 5.2 million in June 2015 and for the fiscal year ended March 2016 averaged 4.1 million, a decrease of 8% compared to 4.5 million average in fiscal year 2015. The difference between the two sources is that comScore uses a panel-centric method for counting unique visitors in the U.S. market rather than the tagging technology used by Google to measure global users. |
|
● |
In August, Salon recognized the Writers Guild of America, East, Inc. (“WGAE”) as the collective bargaining representative of our non-supervisory editorial staff. We commenced collective bargaining with the WGAE in November 2015. |
|
● |
We were proud to be honored for our excellence in journalism during the fiscal year. Salon was an honoree for the 2016 Webby Awards for its Online Film & Video, Video Remixes and Mashups category, for our Donald Trump/Big Lebowski mashup. Lindsay Abrams was honored by the Audubon Society as one of its "Women Greening Journalism" at their annual Women in Conservation luncheon. Columnist Brittney Cooper was identified as part of the "emerging black intelligentsia" by The New Republic in September. Damon Tweedy's "Being Black Can Be Bad for Your Health" named as part of "The 13 Biggest Health Stories of 2015" by Healthline. We were also proud that Chauncey DeVega's piece on race, terrorism and the Planned Parenthood shooting was named among most essential writing by a person of color in 2015 by the HuffingtonPost. |
|
● |
Mobile users accounted for 61.8% of all users in March 2016, which is up slightly from 59.4% in December 2015 and 58.7% in March 2015. We continue to have a company-wide focus on our users’ mobile needs, especially quick and easy access to fast-loading content optimized for better readability on smaller screens. In the 2015 fiscal year, we redesigned our mobile applications (“apps”) and iteratively integrated native advertising solutions to better monetize them. |
|
● |
Social media continues to be a major source of referral traffic, at approximately 38.5% of Website visitors as of March 31, 2016, and a significant focus across the Company. We make regular updates to the Website to optimize content to be shared on social media with a special focus on our mobile platforms. In March 2016, we had approximately 881,000 Facebook “likes,” and 576,000 Twitter followers. |
|
● |
Our direct advertising team continued to focus on high value campaigns that incorporated custom creative applications, pre-roll video advertising and seamless video integrations. More than 75% of our advertising campaigns fell in two categories: branded consumer and entertainment. Major advertising clients in fiscal year 2016 included Amazon, Panera, Ally Bank, Cadillac, PBS, Audible, and Hulu, for which we created an interactive crossword and advent calendar to promote “Seinfeld.” which won an OMMA award for best integrated entertainment online campaign. |
|
● |
We continually work toward leaner, more efficient technological systems through automation, improved architecture and adoption of emerging best practices. Throughout the year, we made technological updates to our browser, tablet, mobile, app and watch platforms with a focus on video, mobile and advertising and ad blocking. |
Salon Strategy
In May 2016, we adopted a new strategy alongside the appointment of Jordan Hoffner as Chief Executive Officer. Our strategy focuses on improving monetization of our user base by innovating our ad technology in order to better match our highly educated and affluent users with advertisers. In the past few years, we have successfully grown our user base, which in fiscal year 2016 averaged 16.6 million users per month, and reached an all-time high of 19.6 million unique users in June 2015. Our number of users translates to our number of viewer impressions that can be sold to our advertisers, and offers opportunities to develop business relationships with companies that want access to our attractive user base. We currently sell our impressions to advertisers programmatically based on Run of Site private marketplaces, or at times, based on editorial content that falls in a particular vertical such as “Movies” or “Innovation.” The CPM is driven by market demand for our content, and the general demographics of our audience. Going forward, the CPM that we can charge our advertisers will increasingly be based on our ability to deliver highly targeted and defined users to our advertiser, and we expect to achieve higher CPMs as we can deliver more detailed information about our users.
Our strategy is predicated on the following core principles: (1) create high quality diversified content that meets our users’ and advertisers’ interests; (2) hire the best possible talent to create centers of excellence and (3) innovate to bring great products to our users and advertisers. Our focus on these core principals underpins our goal to continue to grow our user base, and to develop new strategies around Website monetization that will provide opportunity for future growth.
In fiscal year 2017, our goal is to continue our mission of creating fearless journalism and making the conversation smarter, while anticipating continued shifts in the online advertising market to better monetize our Website. To reach our goals, and to achieve profitability, we will push ahead in the following areas:
|
● |
Develop a broader mix of provocative content in addition to the core areas of news and politics, building off the original definition of a “salon” as a center of intellectual discussion |
|
● |
Deepen our editorial coverage by adopting a broader array of story telling methods, such as expanding our video content, and adding audio and other visual products, with a unwavering commitment to high quality content and fearless journalism |
|
● |
Integrate into our advertising approach a deeper focus on new advertising products that match our high quality user with appropriate advertisers using data and innovative ad products |
Develop a Broader Mix of Provocative Content
We target an educated, culturally engaged audience interested in original thinking and smart commentary. We pursue that audience by featuring a diverse array of voices and perspectives, and covering a wide range of topics including News, Politics, Business, Technology, Life, Entertainment, Sustainability and Innovation. Twenty-four hours a day, 365 days per year, Salon invites users to immerse themselves in thought-provoking content that impassions and empowers them to be the intellectual and cultural leaders of our time.
In fiscal year 2016, we continued to expand our breaking news coverage with a focus on politics ahead of the 2016 Presidential Election. Using data analytics in real-time, we can assess where our users’ interests are shifting, and respond by determining content, site layout and structure to best suit their needs in the moment. In fiscal year 2017, we intend to respond to users’ interests by hosting more dynamic content, such as video, slideshows and images, as well as by expanding into content areas such as business and lifestyle. We will expand into new content areas by reallocating internal resources, as well as continue to have content partnerships to diversify our content offerings across various verticals.
As we continue to focus our editorial to our users’ needs, we seek to grow unique visitors to our Website since the resulting page views serve as a platform for advertising impressions, a key driver of our revenue growth.
Develop Innovative, User-Oriented Products
We continually need fresh content and new ideas to attract readers to our Website. We plan to continue to focus on developing our audience through a combination of editorial enhancements, increased dynamic content and new user-focused functionalities and products. We are continually evaluating the needs of our users and trying to adjust and create new solutions to meet their needs.
Video is popular with our users, and as a result in fiscal year 2016 we launched Salon branded video content. The success of this launch has led us to explore ways to offer more video and integrate it more seamlessly into our Website. In fiscal year 2017, in order to achieve widespread video integration, we are expanding our video editorial team, exploring additional partnerships to gain access to premium video content, and implementing new technology to improve viewability. Video is in high demand with our advertisers. In fiscal year 2016, 85% of our direct advertisers incorporated video into their campaigns. We plan to monetize video through sale of advertising pre-roll via direct and programmatic advertising partnerships, and through syndication of our video content.
Web browsers and applications on mobile platforms are a significant area of audience growth and ad revenue in the online news industry, in particular as social media users have increasingly adopted usage on their mobile phones. Our users continue to move to mobile at record rates, and as of March 2016, mobile browsers accounted for 61.8%, of our unique visitors. Social media has also become a key driver of users for us, consistent with trends for other online news sites. Traffic from Facebook alone grew by over 32% since March 2014. The increase in Website traffic from social media was underpinned by the significant increases in the number of Facebook “likes” to more than 881,000, and monthly reach of more than 80 million (defined as a user who viewed or interacted with our content) on the Facebook platform in March 2016. In fiscal year 2017, we plan to continue our efforts to build our audience on social media, and place more emphasis on other emerging platforms, through a continuation of the strategies we have employed in the past two years.
In fiscal year 2017, we are working on a Website and advertising architecture redesign aimed at improving the user experience. As part of this effort, we will continue exploring new products that meet the immediate needs of our mobile users, building out new advertising products for video and mobile and improving our security and scaling capabilities.
A Deeper Focus on New Advertising Products that Match our User with Appropriate Advertisers
In order to expand our base of advertisers and increase our advertising revenues, we plan to integrate into our advertising approach a deeper focus on new advertising products that match our high quality user with appropriate advertisers using data and innovative ad products. This includes adding software and data capabilities to better understand our users and match their interests with advertisers more closely.
Path to Profitability
Although we reduced our losses in fiscal year 2016 compared to fiscal year 2015, we did not achieve our goal of profitability so will continue to make adjustments to our revenue model in order to increase advertising revenues. We have taken advantage of the shift in online advertising to programmatic marketplaces that are driven by software to purchase digital advertising space. In fiscal year 2016, our programmatic advertising revenues increased 59% compared to fiscal year 2015, and accounted for 67% of our advertising revenues as compared to 56% in fiscal year 2015. We will be re-architecting our programmatic platform to improve the match between advertisers and users, and will invest greater resources into this business area to optimize further our advertising capabilities. We believe the adjustments we are making to our advertising sales approach will allow further growth in programmatic advertising revenues in fiscal year 2017.
We continue to believe that our focus on excellence in our core editorial product can attract a high demographic audience and deliver value to our advertising clients. Our users consist of a global community that is demanding and engaged. They are considered influencers in public policy, culture, art, technology and fashion. Advertisers evaluate a website based on its scale (number of impressions), and the type of ads that are offered (high impact, such as video, sponsored content and content that may be otherwise tied to nearby ads, versus display only.) Advertisers typically seek to attract a specified demographic age, gender, socio-economic background, and education. We believe that improved information and targeting of our user profile will make our Website a more valuable media property for advertisers and retailers who are allocating marketing resources to target consumers online who have our demographic profile.
We work with our advertising clients to reach this attractive audience and tailor advertising to their needs. Through our direct sales team, we have increasingly focused our ad implementations on customized editorial content, mostly in a combination of written editorial, video and slideshows, that promote an advertiser’s brand and are shown on our Website as “sponsored.” As a result, nearly 90% of our advertising campaigns in fiscal year 2016 included high-impact rich media and sponsored content. In fiscal year 2017, we plan to continue to expand our custom ad integration, and broaden our sponsored content offerings, with a special focus on video and mobile products.
Due to an industry shift in advertising dollars toward programmatic and video advertising, our direct advertising declined 2% and programmatic advertising increased 59% leading to total advertising revenues increasing 33% in fiscal year 2016. At the same time, our production costs remained constant from a year ago, leading to decreased losses. To maintain this trend, we will continue to drive revenue growth as described above, while closely monitoring our operating expenses, and re-evaluate costs where we do not see clear productivity gains. As a result, we have discontinued spending in marketing that we felt was not generating sufficient revenue opportunity, streamlined our editorial workforce and made changes to the structure of our sales team. Given these changes, we anticipate that fiscal year 2017 will better align production costs with our revenue potential in an effort to reach profitability.
OUR BUSINESS
We target an educated, culturally engaged audience interested in original thinking and reporting on the day’s big stories. We pursue that audience by featuring a diverse array of voices and perspectives, and covering a wide range of topics including politics, race, religion, culture, entertainment, sustainability, innovation, technology and business.
Salon.com Website
|
News |
Breaking news fast – and what it means. Whether it's Charlie Hebdo, Ferguson, the Josh Duggar and Bill Cosby scandals, or debates over important foreign policy issues, we surround stories people want to talk about as they happen– with dedicated bloggers, extensive videos, and smart columnists who put important news into immediate context. | |
|
Politics |
Fearless, independent and sophisticated coverage of the most important stories from Washington and around the world, delivered by big-name veterans like Amanda Marcotte and Andrew O’Hehir, and the brightest new analysts on the Web (Heather Digby Parton, Simon Maloy, Ben Norton and more). Our political coverage starts early in the morning with our Opening Shot columns, and is updated all day with new pieces, all designed to drive the conversation – and keep our readers ahead of it. | |
|
Arts & Culture |
Our writers and critics are just as obsessed with "The Americans," "Girls,” “Game of Thrones," and the coolest and hottest new books and movies as our readers are. Our entertainment coverage is edgy, exhaustive and fast, and we are just as determined to get to the latest viral video first as we are to mine the intersections between culture and politics. Our writers include Andrew O’Hehir (film), Sonia Saraiya (TV), and Mary Beth Williams, Scott Timberg (pop culture). | |
|
Life |
Our popular life essays go in-depth on the most complicated and deeply personal topics – sex, parenting, family, relationships, religion, work and so many more – and are written both by famous writers like Anne Lamott and Jennifer Egan, as well as daring and interesting new voices. | |
|
Sustainability and Innovation |
We launched these verticals in 2013 and it immediately became one of our most well-read sections. Our sustainability and innovation verticals combine the personal and the political – issues of climate change, the future of energy, organic food, and the politicization of science all receive authoritative. The section also includes the “Dream City” column, about how we design cities of the future to meet the values of today, written by Henry Grabar. | |
|
Tech |
Salon Tech goes beyond just gadgets and gee-whiz stories to get at how technology is changing our lives and workplaces – in increasingly complicated ways. In addition to the staff writers and book excerpts from the hottest and newest titles, the section includes content from sites like The Daily Dot, staff aggregation and AP wires. | |
|
Business |
Combines coverage of labor and income inequality issues from our politics writers with high-quality regular contributors (Robert Reich, Jared Bernstein) and book excerpts, content partners (International Business Times, NewDeal 2.0), staff aggregation and AP wires. |
Revenue Sources
Advertising is our primary source of revenue. Internet advertising revenues accounted for 86% of revenues in fiscal year 2016. From June 2001 until June 2012, our other main source of revenue was from subscriptions. Due to a tepid response from users, new subscriptions and renewals were no longer accepted as of June 2012, and the wind down of our subscription service was completed in fiscal year 2015. Revenue from referring users to third party websites primarily accounted for the remainder 14% of revenues in fiscal year 2016.
Internet advertising is affected by broad economic conditions, like other forms of advertising, but overall it has continued its upward trend even through the Great Recession. According to the 2015 IAB Internet Advertising Revenue Report (the “IAB Study”) conducted by PricewaterhouseCoopers, the compound annual growth rate (“CAGR”) over the past ten years for Internet advertising in the United States was 17%, which has significantly outpaced the U.S. current dollar GDP growth of 3% over the same period. Furthermore, since 2010, Internet advertising growth was fueled by a 100% CAGR in mobile, compared to a 9% growth in non-mobile revenues. Internet advertising revenue in the United States totaled $59.6 billion in 2015, a 20.4% increase from $49.5 billion 2014. In the quarter ended December 2015, the sources for advertising revenues were non-mobile search (32%), mobile (including search, display and video formats) (40%), non-mobile display advertising (22%), classifieds (4%) and lead generation (2%). Notably, mobile advertising grew 77% in 2015, jumping to the largest ad format. Within the non-mobile display advertising segment, which accounts for a significant part of our revenues, banner ads accounted for 12%, digital video for 7%, rich media for 2% and sponsorship for 1% of advertising revenues.
The bulk of online advertising remains concentrated in a relatively small number of dominant Internet companies, with the top ten companies accounting for 75% of online advertising in the December 2015 quarter, and another 9% captured by the next tier of companies ranked 11th through 25th. Therefore, we believe our market opportunity falls roughly at 16% of the online advertising market, or $9.5 billion.
The primary factor in our ability to increase our advertising revenues in future periods is growth in our audience. Attracting more unique visitors to our Website is important because these users generate additional page views, and each page view becomes a potential platform for advertisements. Advertising comprises video, banners, rich media, and other interactive ads across our desktop, tablet, mobile browser and apps platforms. Advertisers pay for advertising based on a cost-per-thousand-impression (“CPM”), and different platforms attract different CPMs. CPMs for mobile have been less than for desktop. Videos and sponsored content on mobile devices continue to grow in popularity and can demand a higher CPM. We believe that continuing to add videos and sponsored content to our mobile platform and improving and optimizing the platform’s design will help increase revenues from our mobile platform.
Overall, monthly unique visitors to our Website have grown from 6.3 million in March 31, 2011, to 17.7 million in March 31, 2016, a cumulative growth rate of 181% over the past six fiscal years. Our full year average monthly unique visitors was 5.4 million, 6.4 million, 10.6 million, 11.2 million, 16.9 million and 16.6 million in fiscal years 2011, 2012, 2013, 2014, 2015 and 2016, respectively. This growth reflects an increase in content areas on our Website over the same period, as well as improved search engine optimization and social media outreach. The table below reflects unique monthly visitors to our Website from fiscal year 2011 through fiscal year 2016. Unique visitors in the period from March 2011 to May 2013 included traffic to an affiliated website that has since been shut down.
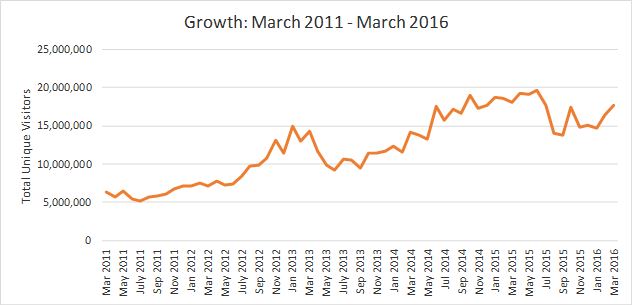 |
Source: Google Analytics
Sales and Marketing
As a media Website that competes against much larger websites, we have sought to distinguish ourselves in the marketplace by offering customized, innovative and integrated advertising products that appeal to users and seamlessly and organically incorporate our advertising clients and their objectives into our Website. Our content rich environment offers advertisers the opportunity to develop custom content programs, including video-rich implementations. Using a dedicated team of content producers, we collaborate closely with the advertiser to create original series, slideshows, infographics and more to bring brand content to users in an organic way. To ensure engagement, all content is available cross-platform and supported by our promotional platforms and social profiles.
We have also built a suite of ad products that includes, among others: our “homepage spotlight” that features custom content in-stream in our editorial news feed, advertiser-sponsored articles and content verticals, custom Website “skins” that can overlay an advertisement onto the background of our Website, “pushdowns” that temporarily move the editorial content below an ad while it is being served, video overlays and in-stream video modules, a multi-media content module and a social feed module. This variety of products has given our advertisers multiple options to speak to and engage with our influential audience.
Our sales office is located in New York, with six advertising sales and operations employees as of March 31, 2016, of which four actively solicit orders.
Product Development
We recognize that users come to the site for online news, reporting, opinion and an engaging, active community of writers, users and commenters. Users engage with the site through desktop computers, mobile phones and social networking platforms and other referral partners. To meet users’ rapidly evolving online media needs, we are continually innovating and developing our Website, mobile Website and social media presence – by adding new features, design updates and technologies that improve the user experience, speed and search engine optimization. We have developed an internal culture of innovation where the Edit, Technology and Sales teams collaborate on product development. In fiscal year 2013, Salon implemented its mobile application strategy with the launch of its responsive mobile browser site and release of Apple and Android mobile applications. In fiscal year 2014, we continued to optimize the mobile browser experience, deploying updates to improve load time, design and layout for small screens.
In fiscal year 2015 we continued to make technological updates to our browser, tablet and mobile platforms with a focus on video presentation, mobile, advertising technologies and analytics integrations. We continued to make updates to our site recirculation and integrated with messaging app platforms such as Whatsapp and Tango. We optimized the site content for social media platforms, mobile and search engine optimization. We increased our site security and stability, by adding internal tools that provide powerful new techniques for site management, troubleshooting, and internal analytics. We began the process of shifting our browser site to utilize an API that provides comprehensive data source for all platforms. For the debut of the Salon App for Apple Watch, we launched a user notification system that allows editors to send breaking news alerts to users on our Apple Watch, iPhone and Android apps, and other emerging platforms.
In fiscal year 2016, we worked on a Website redesign aimed at improving our users’ experience. As part of this effort, we continued building out new advertising products for video and mobile, expanding our social media integration, improving our security and scaling capabilities, and exploring new products that meet the immediate needs of our mobile users.
Competition
The bulk of online advertising remains concentrated in a relatively small number of dominant Internet companies, with the top ten companies accounting for 75% of online advertising in the December 2015 quarter, and another 9% captured by the next tier of companies ranked 11th through 25th. Therefore, we believe our market opportunity falls roughly at 16% of the online advertising market, or $9.5 billion. We compete for advertising revenues with numerous websites, including major portals such as Yahoo and AOL, major search engines such as Google and Bing, major social networks such as Facebook and Twitter, and other online large media publications such as Buzzfeed, The Huffington Post, New York Times, Washington Post, MSNBC and CNN.com. We also compete with many smaller news and politics-oriented Websites, such as Slate, Gawker, The Daily Beast, The Atlantic, Talking Points Memo, Politico and Mother Jones for staff, audience and advertising sales.
Infrastructure and Operations
We have created a flexible publishing structure that enables us to develop our content while responding quickly to news events and to take advantage of the ease of distribution provided by the Internet. Our content is deployed on our proprietary software platform and captured in a database for reuse in Web and other formats. The content on our Website has been structured to facilitate being found by search engines, a key driver in increasing traffic to our Website, and optimized for sharing on social networks. During the past three years, we have improved the look and feel of our Website to increase appeal to our audience and we will continue to ongoing changes to our Website.
Our Website is hosted on cloud-based virtual servers running open-source Linux operating systems and various open-source web and network software packages. Our top technical priority is the fast and reliable delivery of pages to our users. Our systems are designed to handle traffic growth and network failures by balancing the requests among several pools of servers across the globe that automatically scale to match traffic demands. We rely on multiple tiers of redundancy/failover and third-party Content Delivery Network to achieve our goal of 24 hours, seven-days-a-week Website uptime. Regular automated backups protect the integrity of our data. Our servers are continuously monitored by numerous third-party and open-source monitoring and alerting tools.
Proprietary Rights
Our success and ability to compete is dependent in part on the goodwill associated with our trademarks, trade names, service marks and other proprietary rights and on our ability to use U.S. laws to protect our intellectual property, including our original content, content provided by third parties, and content provided by columnists. We have a registered trademark on our Salon name and logo.
Employees
As of March 31, 2016, Salon has 50 full-time employees, and 3 part-time employees. We believe our relations with our employees are good. We started collective bargaining with our non-supervisory editorial employees in November 2015, and the results of this process are uncertain. Our future success is highly dependent on our ability to attract, hire, retain and motivate talented personnel.
ITEM 1A. Risk Factors
Salon’s business faces significant risks. The risks described below may not be the only risks Salon faces. Additional risks that are not yet known or that are currently immaterial may also impair its business operations or have a negative impact on its stock price. If any of the events or circumstances described in the following risks actually occurs, its business, financial condition or results of operations could suffer, and the trading price of its Common Stock could decline. The Risk Factors set forth below have not materially changed from those included in our Fiscal 2015 Annual Report.
Salon has historically lacked significant revenues and has a history of losses
We have a history of significant losses and expect to incur a loss from operations, based on accounting principles generally accepted in the United States of America, for our fiscal year ending March 31, 2017 and to be determined in future years. Even if we attain profitability, we may not be able to sustain or increase profitability on a quarterly or annual basis. If revenues grow more slowly than we anticipate or operating expenses exceed expectations, financial results will most likely be severely harmed and our ability to continue operations will be seriously jeopardized.
Burr Pilger Mayer, Inc., Salon’s independent registered public accounting firm for the fiscal years ended March 31, 2012 through 2016 included a “going-concern” audit opinion on the financial statements for each of those years. The audit opinions report substantial doubt about our ability to continue as a going concern, citing issues such as the history of losses and absence of current profitability. As a result of the “going-concern” opinions, our stock price and investment prospects have been and will continue to be adversely affected, thus limiting financing choices and raising concerns about the realization of value on assets and operations.
The Company has operated principally with the assistance of interest free advances from related parties. The financial statements do not include any adjustments relating to the recoverability and classification of asset amounts or the amounts and classification of liabilities that might be necessary should we be unable to continue as a going concern.
Salon’s projected cash flows may not meet expectations
We rely on cash projections to run our business and change such projections as new information is made available or events occur. The most significant component of our cash projections is cash to be generated from advertising sales. Forecasting advertising revenues and resulting cash receipts for an extended period of time is problematic due to the short duration of most advertising sales contracts. If projected cash inflows and outflows do not meet expectations, our ability to continue as a going concern may be adversely affected.
If we forecast or experience periods of limited, or diminishing cash resources, we may need to sell additional securities or borrow additional funds. There is no guarantee that we will be able to issue additional securities in future periods or borrow additional funds on commercially reasonable terms to meet our cash needs. Our ability to continue as a going concern will be adversely affected if we are unable to raise additional cash from sources we have relied upon in the past or new sources.
We have relied on related parties for significant investment capital
We have relied on cash infusions from related parties to fund operations for many years. The related parties are primarily John Warnock, Chairman of the Board of Salon, and William Hambrecht. William Hambrecht is a Director and the father of our former CEO and current Chief Financial Officer, Elizabeth Hambrecht. During the fiscal year ended March 31, 2016, Mr. Warnock made approximately $2.2 million in cash advances to fund our operations. Subsequent to March 31, 2016, Mr. Warnock provided an additional $350,000 to meet our working capital requirements.
Curtailment of cash investments and borrowing guarantees by related parties would detrimentally impact our cash availability and our ability to fund our operations.
We started collective bargaining with our non-supervisory editorial employees, and the results of this process are uncertain
On August 3, 2015, the Writers Guild of America, East, Inc. (“WGAE”) became the collective bargaining representative of Salon’s non-supervisory editorial employees. We commenced collective bargaining with the WGAE in November 2015. Should this collective bargaining process result in an agreement that would not permit us to obtain additional funding, there can be no assurance that we will be able to continue our current business.
Our principal stockholders exercise a controlling influence over our business affairs and may make business decisions with which non-principal stockholders disagree, which may affect the value of non-principal stockholders’ investments
Approximately 45% of our voting securities are controlled, directly or indirectly by our Chairman, John Warnock, and approximately 36% is controlled directly or indirectly by William Hambrecht, a Director and the father of our Chief Financial Officer. We remain dependent upon Mr. Warnock and Mr. Hambrecht for continued financial support while we seek external financing from potential investors in the form of additional indebtedness or through the sale of equity securities in a private placement. While all outstanding, unsecured, interest-free cash advances from Mr. Warnock and Mr. Hambrecht at February 28, 2013 were exchanged for Common Stock in the Company’s Recapitalization, details of which were described in Note 4 to the financial statements included in the 2015 Annual Report, Mr. Warnock has continued to make unsecured, interest-free, cash advances to cover our operating expenses. These advances are payable on demand, and are exchangeable into securities on the same terms as those to be issued in our next financing from non-related parties. We were advised by Mr. Warnock and Mr. Hambrecht that they executed a stock transaction that has the effect of equalizing their stock ownership. The corresponding Forms 4 and Form 8-K were filed with the SEC on November 24 and November 25, 2015, respectively.
Future sales of significant number of shares of our Common Stock by principal stockholders could cause our stock price to decline
Our directors and officers own approximately 65 million shares, or 83% in the aggregate, of our Common Stock. As our Common Stock is normally thinly traded, if our principal stockholders were to sell their shares of Common Stock, the per share price of our Common Stock could be adversely affected.
Our stock has been, and will likely continue to be, subjected to substantial price and volume fluctuations due to a number of factors, many of which will be beyond our control and which may prevent our stockholders from reselling Common Stock at a profit
The securities markets have recently experienced significant price and volume fluctuations. This market volatility, as well as general economic, market or political conditions, has reduced and may continue to reduce the market price of our Common Stock, regardless of our operating performance. In addition, our stock is thinly traded. Even a few transactions, whether in response to disappointment in our expected operating results or any other reason, could cause the market price of our Common Stock to decrease significantly.
Holders of our Series C Preferred Stock are entitled to potentially significant liquidation preferences of Salon’s assets over holders of our Common Stock in the event of a liquidation event
Holders of our Series C Preferred Stock (“Preferred Stock”) have liquidation preferences over holders of Common Stock of the first approximately $2.6 million in potential sales proceeds as of March 31, 2016, which includes the effect of undeclared dividends, if granted, of about $0.8 million. If a liquidation event were to occur, and Preferred Stock dividends were declared, the holders of Preferred Stock would be entitled to the first $2.6 million of cash distributions. If a liquidation event were to occur in excess of $2.6 million and if Preferred Stock dividends were to be declared, the holders of Preferred Stock would be entitled to receive a relatively larger distribution than the holders of Common Stock would be entitled to receive.
We depend on advertising sales for substantially all of our revenues, and our inability to maintain or increase advertising revenues would harm our business
Our ability to maintain or increase our advertising revenues depends upon many factors, including whether we will be able to:
|
● |
attract and maintain additional visitors to our Website and increase brand awareness; |
|
● |
sell and market our Website or other rich media advertisements; |
|
● |
maintain a significant number of sellable impressions generated from Website visitors available to advertisers; |
|
● |
increase the dollar amount of our advertising orders; |
|
● |
improve our Website’s technology for serving advertising; |
|
● |
handle temporary high volume traffic spikes to our Website; |
|
● |
measure accurately the number and demographic characteristics of our users; and |
|
● |
attract and retain key sales personnel. |
As more of our users access our Website using mobile devices rather than PCs, if we do not continue to grow our mobile users and revenue, our business will be adversely impacted.
Internet users increasingly use mobile devices rather than PCs to access the Internet. Over 50% of our monthly users are now visiting our Website on mobile devices. As mobile platforms encompass a larger share of our readers, our ability to grow advertising revenue is increasingly dependent on our ability to generate revenue from ads displayed on mobile devices. While we plan to continue to devote technology resources to support our mobile browser product, apps and advertising products, if our mobile browser product, apps, and advertising products for mobile devices do not attract and retain users and advertisers to generate mobile revenue, our operating and financial results will be adversely impacted. We are dependent upon our products operating on mobile operating systems we do not control. The mobile phone manufacturer and its operating systems might block access to our Website or make it hard for users to find our Website through their devices, or block certain ads or charge us for delivery of ads, all of which would harm our operations and suppress revenue potential.
Technologies and software applications could block our advertisements, which could harm our operating results.
Technologies and software applications have been developed for PC and mobile devices that can block or allow users to opt out of display advertising, delete or block cookies used to deliver advertising, or move advertising to less optimal placements to suppress view-ability. Most of our advertising revenue is derived from display or video advertisements on our Website. As a result, ad-blocking technologies or software could reduce the number of display or video advertisements
If we cannot increase referrals from social media platforms, our ability to attract new unique visitors and maintain the engagement of existing unique visitors could be adversely affected.
As the behavior of internet consumers continues to change, distribution of our content, products and services via traditional methods may become less effective, and new distribution strategies may need to be developed. Consumers are increasingly using social networking sites such as Facebook and Twitter, to communicate and to acquire and disseminate information. As consumers migrate towards social networks, we continue to build social elements into our content, products and services in order to make them available on social networks and to attract and engage consumers on our Website and mobile platforms. There is no guarantee that we will be able to successfully integrate our content with such social networking or other new consumer trends. Even if we are able to distribute our content, products and services effectively through social networking or other new or developing distribution channels, this does not assure that we will be able to attract new unique visitors.
Hackers may attempt to penetrate our security system and online security breaches could harm our business
Consumer and supplier confidence in our Website depends on maintaining strong security features. Experienced programmers or “hackers” have penetrated sectors of our systems, and we expect that these attempts will continue to occur from time to time. To our knowledge, there has been no outward harm to us or our users as a result of hacking attempts. Furthermore, Salon has engaged the services of a third-party web application security-testing company, which conducts regular comprehensive searches for any vulnerabilities that may exist, allowing us to address and fix any issues before they can be exploited. This minimizes the risk of damage; however, because a hacker who is able to penetrate network security could misappropriate proprietary information or cause interruptions in our products and services, we may have to expend significant capital and resources to protect against or to alleviate problems caused by hackers. Additionally, we may not have a timely remedy against a hacker who is able to penetrate our network security. Such security breaches could materially affect our operations, damage our reputation and expose us to risk of loss or litigation. In addition, the transmission of computer viruses resulting from hackers or otherwise could expose us to significant liability. Our insurance policies may not be adequate to reimburse us for losses caused by security breaches. We also face risks associated with security breaches affecting third parties with whom we have relationships.
We must promote the Salon brand to attract and retain users, advertisers and strategic partners
The success of the Salon brand depends largely on our ability to provide high quality content and services. If Internet users do not perceive our existing content and services to be of high quality, or if we introduce new content and services or enter into new business ventures that are not favorably perceived by users, we may not be successful in promoting and maintaining the Salon brand. Any change in the focus of our operations creates a risk of diluting our brand, confusing consumers and decreasing the value of our user base to advertisers. If we are unable to maintain or grow the Salon brand, our business would be severely harmed.
We must hire, integrate and/or retain qualified personnel to support our business plans
Our success significantly depends on key personnel. In addition, because our users must perceive the content of our Website as having been created by credible and notable sources, our success also depends on the name recognition and reputation of our editorial staff. Due to our history of losses, we may experience difficulty in hiring and retaining highly skilled employees with appropriate qualifications. We may be unable to retain our current key employees or attract, integrate or retain other qualified employees in the future. If we do not succeed in attracting new personnel or retaining and motivating our current personnel, our business would be harmed.
Our success depends on our key personnel, including our executive officers, and the loss of key personnel, including our Chief Executive Officer, could disrupt our business
Our success greatly depends on the continued contributions of our senior management and other key sales, marketing and operations personnel. While we have employment agreements with some key management, these employees may voluntarily terminate their employment at any time. We may not be able to successfully retain existing personnel or identify, hire and integrate new personnel. We do not have key person insurance policies in place for these employees.
We may expend significant resources to protect our intellectual property rights or to defend claims of infringement by third parties, and if we are not successful we may lose rights to use significant material or be required to pay significant fees
Our success and ability to compete are dependent on our proprietary content. We rely exclusively on copyright law to protect our content. While we actively take steps to protect our proprietary rights, these steps may not be adequate to prevent the infringement or misappropriation of our content, which could severely harm our business. We also license content from various freelance providers and other third-party content providers. While we attempt to ensure that such content may be freely licensed to us, other parties may assert claims of infringement against us relating to such content.
We may need to obtain licenses from others to refine, develop, market and deliver new services. We may not be able to obtain any such licenses on commercially reasonable terms or at all or rights granted pursuant to any licenses may not be valid and enforceable.
In April 1999, we acquired the Internet address www.salon.com. Because www.salon.com is the address of the main home page to our Website and incorporates Salon’s name, it is a vital part of our intellectual property assets. We do not have a registered trademark on the address, and therefore it may be difficult for us to prevent a third party from infringing on our intellectual property rights to the address. If we fail to adequately protect our rights to the Website address, or if a third party infringes our rights to the address, or otherwise dilutes the value of www.salon.com, our business could be harmed.
Our technology development efforts may not be successful in improving the functionality of our network, which could result in reduced traffic on our Website or reduced advertising revenues
We are constantly upgrading our technology to manage our Website. We create new products that we expect to launch on an ongoing basis. If these systems do not work as intended, or if we are unable to continue to develop these systems to keep up with the rapid evolution of technology for content delivery, our Website may not operate properly, which could harm our business. Additionally, software product design, development and enhancement involve creativity, expense and the use of new development tools and learning processes. Delays in software development processes are common, as are project failures, and either factor could harm our business. Moreover, complex software products such as our online publishing platform frequently contain undetected errors or shortcomings, and may fail to perform or scale as expected. Although we have tested and will continue to test our systems, errors or deficiencies may be found in these systems that could adversely impact our business.
We rely on third parties to provide the technologies necessary to deliver content, advertising and services to our users, and any change in the licensing terms, costs, availability, or acceptance of these formats and technologies could adversely affect our business
We rely on third parties to provide the technologies that we use to deliver content, advertising, and services to our users. There can be no assurance that these providers will continue to license their technologies or intellectual property to us on reasonable terms, or at all. Providers may change the fees they charge users or otherwise change their business models in a manner that slows the widespread acceptance of their technologies. In order for our services to be successful, there must be a large base of users of the technologies to deliver our content, advertising, and services. We have limited or no control over the availability or acceptance of those technologies, and any change in licensing terms, costs, availability, or user acceptance of these technologies could adversely affect our business.
We may be held liable for content or third party links on our Website or content distributed to third parties
As a publisher and distributor of content over the Internet, including links to third-party websites that may be accessible through our Website, or content that includes links or references to a third-party’s website, we face potential liability for defamation, negligence, copyright, patent or trademark infringement and other claims based on the nature, content or ownership of the material that is published on or distributed from our Website. These types of claims have been brought, sometimes successfully, against online services, websites and print publications in the past. Other claims may be based on errors or false or misleading information provided on linked websites, including information deemed to constitute professional advice such as legal, medical, financial or investment advice. Other claims may be based on links to sexually explicit websites. Although we carry general liability and media insurance, our insurance may not be adequate to indemnify us for all liabilities imposed. Any liability that is not covered by our insurance or is in excess of our insurance coverage could severely harm our financial condition and business. Implementing measures to reduce our exposure to these forms of liability may require us to spend substantial resources and limit the attractiveness of our service to users.
Our systems may fail due to natural disasters, telecommunications failures and other events, any of which would limit user traffic
Our Website “salon.com”, and content management system run on cloud computing hosted by Amazon Web Services, which are in a facility in Herndon, Virginia. Any disruption of Amazon’s cloud computing platform could result in a service outage. Fire, floods, earthquakes, power loss, telecommunications failures, break-ins, supplier failure to meet commitments, and similar events could damage these systems and cause interruptions in our services. Computer viruses, electronic break-ins or other similar disruptive problems could cause users to stop visiting our Website and could cause advertisers to terminate any agreements with us. In addition, we could lose advertising revenues during these interruptions and user satisfaction could be negatively impacted if the service is slow or unavailable. If any of these circumstances occurred, our business could be harmed. Our insurance policies may not adequately compensate us for losses that may occur due to any failures of or interruptions in our systems. We do not presently have a formal disaster recovery plan.
Our Website must accommodate a high volume of traffic and deliver frequently updated information. It is possible that we will experience systems failures in the future and that such failures could harm our business. In addition, our users depend on Internet service providers, online service providers and other website operators for access to our Website. Many of these providers and operators have experienced significant outages in the past, and could experience outages, delays and other difficulties due to system failures unrelated to our systems. Any of these system failures could harm our business.
Privacy concerns could impair our business
We have a policy against using personally identifiable information obtained from users of our Website and services without the user’s permission. In the past, the Federal Trade Commission has investigated companies that have used personally identifiable information without permission or in violation of a stated privacy policy. If we use personal information without permission or in violation of our policy, we may face potential liability for invasion of privacy for compiling and providing information to our corporate customers and electronic commerce merchants. In addition, legislative or regulatory requirements may heighten these concerns if businesses must notify Internet users that the data may be used by marketing entities to direct product promotion and advertising to the user. Other countries and political entities, such as the European Union, have adopted such legislation or regulatory requirements. The United States may adopt similar legislation or regulatory requirements in the future. If consumer privacy concerns are not adequately addressed, our business, financial condition and results of operations could be materially harmed.
Due to the volatility of the price of our Common Stock, we may be the target of securities litigation, which is costly and time-consuming to defend
The price of our Common Stock has experienced volatility in the past, and may continue to do so in the future. In the past, following volatility in the price of a company’s securities, securities holders have instituted class action litigation against such company. Many companies have been subjected to this type of litigation. If the market value of our Common Stock experiences adverse fluctuations and we become involved in this type of litigation, regardless of the merits or outcome, we could incur substantial legal costs and our management’s attention could be diverted, causing our business, financial condition and operating results to suffer. To date, we have not been subject to such litigation.
Our quarterly operating results are volatile and may adversely affect the price of our Common Stock
Our future revenues and operating results are likely to fluctuate significantly from quarter to quarter due to a number of factors, many of which are outside our control, and any of which could severely harm our business. These factors include:
|
● |
Our ability to attract and retain advertisers; |
|
● |
Our ability to attract and retain a large number of users; |
|
● |
Our ability to increase referrals from our social media presence; |
|
● |
The introduction of new websites, services or products by us or by our competitors; |
|
● |
Our ability to maximize our mobile presence; |
|
● |
The timing and uncertainty of our advertising sales cycles; |
|
● |
The mix of advertisements sold by us or our competitors; |
|
● |
Economic and business cycles; |
|
● |
Our ability to attract, integrate and retain qualified personnel; |
|
● |
Technical difficulties or system downtime affecting the Internet generally or the operation of our Website; and |
|
● |
The amount and timing of operating costs. |
Due to the factors noted above and the other risks discussed in this section and throughout this Annual Report, one should not rely on quarter-to-quarter comparisons of our results of operations as an indication of future performance. It is possible that some future periods’ results of operations may be below the expectations of public market analysts and investors. If this occurs, the price of our Common Stock may decline.
Provisions in Delaware law and our charter, stock option agreements and offer letters to executive officers may prevent or delay a change of control
We are subject to the Delaware anti-takeover laws regulating corporate takeovers. These anti-takeover laws prevent a Delaware corporation from engaging in a merger or sale of more than 10% of its assets with any stockholder, including all affiliates and associates of the stockholder, who owns 15% or more of the corporation’s outstanding voting stock, for three years following the date that the stockholder acquired 15% or more of the corporation’s assets unless:
|
● |
the board of directors approved the transaction in which the stockholder acquired 15% or more of the corporation’s assets; |
|
● |
after the transaction in which the stockholder acquired 15% or more of the corporation’s assets, the stockholder owned at least 85% of the corporation’s outstanding voting stock, excluding shares owned by directors, officers and employee stock plans in which employee participants do not have the right to determine confidentially whether shares held under the plan will be tendered in a tender or exchange offer; or |
|
● |
on or after such date, the merger or sale is approved by the board of directors and the holders of at least two-thirds of the outstanding voting stock that is not owned by the stockholder. |
A Delaware corporation may opt out of the Delaware anti-takeover laws if its certificate of incorporation or bylaws so provide. We have not opted out of the provisions of the anti-takeover laws. As such, these laws could prohibit or delay mergers or other takeovers or changes of control of Salon and may discourage attempts by other companies to acquire us.
Our certificate of incorporation and bylaws include a provision relating to special meetings of our shareholders that may deter or impede hostile takeovers or changes of control or management. Special meetings of stockholders may be called only by our board of directors pursuant to a resolution adopted by a majority of the total number of authorized directors (whether or not there exist any vacancies in previously authorized directorships at the time any such resolution is presented to the Board for adoption) or by the holders of not less than 10% of all of the shares entitled to cast votes at the meeting. This provision may have the effect of delaying or preventing a change of control.
In addition, employment agreements with certain executive officers provide for the payment of severance and acceleration of the vesting of options and restricted stock in the event of termination of the executive officer following a change of control of Salon. These provisions could have the effect of discouraging potential takeover attempts.
ITEM 1B. Unresolved Staff Comments
None.
ITEM 2. Properties
Salon leases 2,405 square feet of office space at 870 Market Street, San Francisco, California, where it has been headquartered since November 2012. The San Francisco office lease will expire in November 2017. Salon also leases 6,523 square feet of office space for its New York office at 132 West 31st Street, New York, New York through September 2019. Salon believes that its existing properties are in good condition and are suitable for the conduct of its business.
ITEM 3. Legal Proceedings
Salon is not a party to any pending legal proceedings that it believes will materially affect its financial condition or results of operations.
ITEM 4. Mine Safety Disclosures
Not applicable.
PART II
ITEM 5. Market for Registrant’s Common Equity, Related Stockholder Matters, and Issuer Purchases of Equity Securities
Information with respect to the quarterly high and low sales prices for Salon’s Common Stock, ticker symbol SLNM.PK, for its fiscal years 2016 and 2015, based on sales transactions reported by the OTC (Over-The-Counter) Bulletin Board is provided below:
|
Fiscal Year Ended |
Fiscal Year Ended |
|||||||||||||||
|
March 31, 2016 |
March 31, 2015 |
|||||||||||||||
|
For the quarter ended |
High |
Low |
High |
Low |
||||||||||||
|
June 30 |
$ | 0.16 | $ | 0.13 | $ | 0.25 | $ | 0.16 | ||||||||
|
September 30 |
0.20 | 0.13 | 0.40 | 0.16 | ||||||||||||
|
December 31 |
0.19 | 0.10 | 0.45 | 0.13 | ||||||||||||
|
March 31 |
$ | 0.16 | $ | 0.10 | $ | 0.20 | $ | 0.13 | ||||||||
Such over-the-counter market quotations reflect inter-dealer prices, without retail mark-up, mark-down or commission and may not necessarily represent actual transactions.
There were 76 top stockholders of record of Salon Common Stock as of June 1, 2016. This number was derived from Salon’s stockholder records, and does not include beneficial owners of Salon’s voting Common Stock whose shares are held in the names of various dealers, clearing agencies, banks, brokers and other fiduciaries. The closing price of Salon’s Common Stock on June 1, 2016 was $0.24 per share.
Salon has never declared or paid any cash dividends on its capital stock and does not expect to pay any cash dividends in the foreseeable future.
Salon has never repurchased any of its equity securities.
Equity Compensation Plan Information
The following table provides information about Salon’s Common Stock that may be issued upon the exercise of options and rights under all of Salon’s existing equity compensation plans as of March 31, 2016, including the Salon Media Group, Inc. 2004 Stock Plan and the Salon Media Group, Inc. 2014 Stock Incentive Plan.
|
Plan category |
Number of securities to |
Weighted-average |
Number of securities |
|||||||||
|
be issued upon exercise |
exercise price of |
remaining available for |
||||||||||
|
of outstanding options |
outstanding options |
future issuance under |
||||||||||
|
and rights |
and rights |
equity compensation |
||||||||||
|
plans, excluding |
||||||||||||
|
securities reflected in |
||||||||||||
|
column (a) |
||||||||||||
|
(a) |
(b) |
(c) |
||||||||||
|
Equity compensation plans approved by security holders |
7,241,623 | $ | 0.15 | 8,446,840 | ||||||||
|
Equity compensation plans not approved by security holders |
None |
N/A |
None |
|||||||||
|
Total |
7,241,623 | $ | 0.15 | 8,446,840 | ||||||||
Equity Compensation Plans Not Approved by Security Holders
None.
ITEM 6. Selected Financial Data
|
Amounts in thousands, except per share amounts |
||||||||||||||||||||
|
Year Ended March 31, |
2016 |
2015 |
2014 |
2013 |
2012 |
|||||||||||||||
|
Net revenues |
$ | 6,959 | $ | 4,946 | $ | 6,004 | $ | 3,641 | $ | 3,477 | ||||||||||
|
Gain from discontinued operations |
$ | - | $ | - | $ | - | $ | 233 | $ | 60 | ||||||||||
|
Net loss |
$ | (1,960 | ) | $ | (3,940 | ) | $ | (2,186 | ) | $ | (3,936 | ) | $ | (4,098 | ) | |||||
|
Basic and diluted net loss per share |
$ | (0.03 | ) | $ | (0.05 | ) | $ | (0.03 | ) | $ | (0.72 | ) | $ | (1.25 | ) | |||||
|
Weighted average common shares outstanding used in computing per share amounts (thousands) |
76,245 | 76,245 | 73,923 | 5,443 | 3,283 | |||||||||||||||
|
Cash and cash equivalents |
$ | 189 | $ | 229 | $ | 119 | $ | 96 | $ | 130 | ||||||||||
|
Total assets |
$ | 2,034 | $ | 1,605 | $ | 2,033 | $ | 1,299 | $ | 1,557 | ||||||||||
|
Total long-term liabilities |
$ | 69 | $ | 73 | $ | 2 | $ | 12 | $ | 123 | ||||||||||
ITEM 7. Management’s Discussion and Analysis of Financial Condition and Results of Operations
Overview
Salon is an online media company and a unique voice in the Internet landscape. Our award-winning journalism combines original investigative stories and provocative personal essays along with quick-take commentary and staff-written articles about politics, technology, culture and entertainment. In our editorial product we balance two crucial missions: (1) providing original and provocative content on topics that the mainstream media overlook, and (2) filtering through the media chatter and clutter to help readers find the stories that matter.
Sources of Revenue
Most of Salon’s net revenues are derived from advertising from the sale of promotional space on its Website. The sale of promotional space is generally for less than ninety days in duration. The primary factor in our ability to increase our advertising revenues in future periods is growth in our audience. Attracting more unique visitors to our Website is important because these returning users generate additional page views, and each page view becomes a potential platform for advertisements. Advertising comprises banners, video, rich media and other interactive ads. Advertisers pay for advertising based on a cost-per-thousand-impression (“CPM”). CPM varies by platform and CPMs for mobile have been less than for desktop, however in the recent quarter they have been increasing. Videos and sponsored content on mobile devices continue to grow in popularity and can demand a higher CPM. We believe that continuing to add videos and sponsored content to our mobile platform and improving and optimizing the platform’s design will help increase revenues from our mobile platform.
In addition, Salon generates revenue from referring users to third party websites. For fiscal year 2016, referral fees totaled $0.94 million, a 141% increase from $0.39 million in fiscal year 2015. We also generated nominal revenue from the licensing of content that previously appeared in Salon.
Our total net revenue and the sources thereof for the years ended March 31, 2016, 2015 and 2014 were as follows (in thousands):
|
Year Ended March 31, |
|||||||||||||||||||||||||
|
2016 |
2015 |
2014 |
|||||||||||||||||||||||
|
Amount |
% |
Amount |
% |
Amount |
% |
||||||||||||||||||||
|
Advertising |
$ | 5,988 | 86 | % | $ | 4,518 | 91 | % | $ | 5,534 | 92 | % | |||||||||||||
|
Subscription Program |
7 |
<1% |
12 |
<1% |
27 |
<1% |
|||||||||||||||||||
|
All Other |
964 | 13 | % | 416 | 8 | % | 443 | 7 | % | ||||||||||||||||
|
Total |
$ | 6,959 | 100 | % | $ | 4,946 | 100 | % | $ | 6,004 | 100 | % | |||||||||||||
Operating Expenses
Production and content expenses consist primarily of salaries and related expenses for Salon’s editorial and production staff, payments to freelance writers and artists, bandwidth costs associated with serving pages on our Website and ad serving costs.
Sales and marketing expenses consist primarily of salaries, commissions and related personnel costs, travel, and other costs associated with Salon’s sales force and our business development efforts. It also includes marketing promotions.
Technology expenses consist primarily of salaries and related personnel costs associated with the development, testing and enhancement of our software to manage our Website, as well as to support our marketing and sales efforts.
General and administrative expenses consist primarily of salaries and related personnel costs, accounting and legal fees, rents, and other fees associated with operating a publicly traded company. Certain shared overhead expenses are allocated to other departments.
Critical Accounting Policies
The preparation of financial statements in conformity with GAAP requires Salon to utilize accounting policies and make estimates and assumptions that affect our reported amounts. Salon’s significant accounting policies are described in Note 2 to the financial statements included elsewhere in this Annual Report. We believe accounting policies and estimates related to revenue recognition and accounting for debt and equity are the most critical to our financial statements. Future results may differ from current estimates if different assumptions or conditions were to prevail.
Stock Based Compensation
Salon recognizes the fair value of stock awards on a straight-line basis over the requisite service period of the award, which is the standard vesting term of four years.
Salon recognized stock-based compensation expense of $302,000, $285,000 and $134,000 during the years ended March 31, 2016, 2015 and 2014, respectively. As of March 31, 2016, Salon had an aggregate of $211,000 of stock-based compensation remaining to be amortized to expense over the remaining requisite service period of the underlying awards. Salon currently expects this stock-based compensation balance to be amortized as follows: $87,000 during fiscal year 2017; $78,000 during fiscal year 2018; $45,000 during fiscal year 2019; and $1,000 during fiscal year 2020. The expected amortization reflects only outstanding stock option awards as of March 31, 2016. We expect to continue to issue stock-based awards to our employees in future periods.
The full impact of stock-based compensation in the future is dependent upon, among other things, the timing of when Salon hires additional employees, the effect of new long-term incentive strategies involving stock-based awards in order to continue to attract and retain employees, the total number of stock-based awards granted, the fair value of the stock awards at the time of grant and the tax benefit that Salon may or may not receive from stock-based expenses. Additionally, stock-based compensation requires the use of an option-pricing model to determine the fair value of stock option awards. This determination of fair value is affected by Salon’s stock price as well as assumptions regarding a number of highly complex and subjective variables. These variables include, but are not limited to, Salon’s expected stock price volatility over the term of the awards.
Liquidity
Salon has incurred significant net losses and negative cash flows from operations since its inception. As of March 31, 2016, Salon had an accumulated deficit of $124.6 million. These losses have been funded primarily through the issuance of Common Stock from Salon’s initial public offering in June 1999, issuances of Preferred Stock, bank debt, the issuance of convertible notes payable and other advances from related parties.
Burr Pilger Mayer, Inc., Salon’s independent registered public accounting firm for the years ended March 31, 2016, 2015 and 2014 has included a paragraph in their report indicating that substantial doubt exists as to Salon’s ability to continue as a going concern because of Salon’s recurring operating losses, negative cash flow and accumulated deficit.
Income Taxes
Salon has not recorded a provision for federal or state income taxes since inception due to recurring operating losses. As of March 31, 2016, Salon had net operating loss carryforwards of $89.8 million for federal income tax purposes that begin to expire in March 2019, and $20.1 million for California income tax purposes. As Salon has been incurring tax losses, $0.9 million of California net operating loss carryforwards expired as of March 31, 2016, and if Salon were to incur a tax loss for the fiscal year ending March 31, 2017, an additional $1.3 million of California net operating loss carryforwards will expire. Utilization of Salon’s net operating loss carryforwards may be subject to a substantial annual limitation due to ownership change limitations provided by the Internal Revenue Code and similar California State provisions. Such an annual limitation could result in the expiration of the net operating loss carryforwards before utilization. A valuation allowance has been established and, accordingly, no benefit has been recognized for such operating losses and other deferred tax assets. The net valuation allowance increased $0.4 million during the year ended March 31, 2016 to $32.7 million. Salon believes that, based on a number of factors, the availability of objective evidence creates sufficient uncertainty regarding the realization of the deferred tax assets such that a full valuation allowance has been recorded. These factors include Salon’s history of net losses since inception and expected near-term future losses.
Revenue Recognition
Salon recognizes revenues once persuasive evidence of an arrangement exists, delivery has occurred, the fee is fixed or determinable and collectibility is reasonably assured. Revenues are recognized ratably over the period which Salon’s obligations are fulfilled. Payments received before Salon’s obligations are fulfilled are classified as “deferred revenue” in Salon’s balance sheets.
Advertising revenues, derived from the sale of promotional space on its Website, comprised 86%, 91% and 92% of Salon’s net revenues for the fiscal years ended March 31, 2016, 2015 and 2014 respectively. The duration of the advertisements are generally short term, usually less than ninety days. Revenues derived from such arrangements are recognized during the period the advertising space is provided. Salon’s obligations typically include a guaranteed minimum number of impressions. To the extent minimum guaranteed amounts are not achieved, Salon defers recognition of the corresponding revenue until the remaining guaranteed amounts are provided, if mutually agreeable to the advertiser. If these “make good” impressions are not agreeable to the advertiser, no further revenue is recognized.
Results of Operations
Fiscal Years Ended March 31, 2016 and 2015
Net Revenues
Salon’s net revenue from continuing operations increased 41% to $7.0 million for the fiscal year ended March 31, 2016 from $4.9 million for the fiscal year ended March 31, 2015, primarily due to a significant increase in programmatic advertising revenue and referral fees.
Advertising revenues increased 33% to $6.0 million for the fiscal year ended March 31, 2016 from $4.5 million for the fiscal year ended March 31, 2015, primarily due to an increase in programmatic advertising which grew 60% to $4.0 million for the fiscal year ended March 31, 2016 from $2.5 million for the fiscal year ended March 31, 2015. Direct advertising sales for the fiscal year ended March 31, 2016 remained constant at approximately $2.0 million from a year ago.
A primary factor in our ability to increase advertising revenues in future periods is growth in our audience. Attracting more unique visitors to our Website is important because these users generate additional page views, and each page view becomes a potential platform for serving advertisements. Advertisers pay for advertising based on a cost-per-thousand-impression, and different platforms attract different costs-per-thousand impressions. Due to various factors, including concerted efforts to make Salon’s content more accessible to users, a better optimized Website to facilitate appearance in search engine results, and increasing the quantity of content, the annual average number of monthly unique Website visitors during fiscal year ended March 31, 2016 remained constant from a year ago at approximately 17 million. Aiding the continued growth in unique visitors to Salon’s Website is the migration of users to the Internet from print newspapers.
All other sources of revenue were approximately $1.0 million for the fiscal year ended March 31, 2016 and $0.4 million for the fiscal year ended March 31, 2015. This $0.6 million increase was mainly attributed to a growth of approximately 150% in referral fees revenue during the fiscal year ended March 31, 2016.
Production and Content Expenses
Production and content expenses for the fiscal year ended March 31, 2016 remained constant at $3.9 million from a year ago.
Sales and Marketing Expenses
Sales and marketing expenses decreased 6% to $1.7 million during the fiscal year ended March 31, 2016 compared to $1.8 million for the fiscal year ended March 31, 2015. This 6% net decrease was primarily attributed to savings from the elimination of social media advertising spend.
Information Technology Support Expenses
Information technology support expenses increased 8% to approximately $1.4 million during the fiscal year ended March 31, 2016 compared to $1.3 million in the fiscal year ended March 31. 2015. The increase was primarily attributed to departmental personnel changes.
General and Administrative Expenses
General and administrative expenses increased 3% to approximately $1.9 million during the fiscal year ended March 31, 2016 compared to $1.8 million in the fiscal year ended March 31, 2015. The increase was primarily attributed to departmental personnel changes.
Interest Expense
Interest expense remained constant at approximately $0.04 million during the fiscal years ended March 31, 2016 and 2015.
Fiscal Years Ended March 31, 2015 and 2014
Net Revenues
Salon’s net revenue from continuing operations decreased 18% to $4.9 million for the fiscal year ended March 31, 2015 from $6.0 million for the fiscal year ended March 31, 2014, primarily due to a decline in direct sales advertising and referral fees.
Advertising revenues decreased 18% to $4.5 million for the fiscal year ended March 31, 2015 from $5.5 million for the fiscal year ended March 31, 2014, primarily due to a decline in direct sales which decreased 38% to $2.0 million for the fiscal year ended March 31, 2015 from $3.2 million for the fiscal year ended March 31, 2014.
A primary factor in our ability to increase advertising revenues in future periods is growth in our audience. Attracting more unique visitors to our Website is important because these users generate additional page views, and each page view becomes a potential platform for serving advertisements. Advertisers pay for advertising based on a cost-per-thousand-impression, and different platforms attract different costs-per-thousand impressions. Due to various factors, including concerted efforts to make Salon’s content more accessible to users, a better optimized Website to facilitate appearance in search engine results, and increasing the quantity of content, the average number of monthly unique Website visitors grew by 52% during the fiscal year ended March 31, 2015, to approximately 17 million. Aiding the continued growth in unique visitors to Salon’s Website is the migration of users to the Internet from print newspapers.
All other sources of revenue were approximately $0.4 million for the fiscal year ended March 31, 2015 and $0.5 million for the fiscal year ended March 31, 2014. This $0.1 million decrease was mainly attributed to a decline in referral fees revenue during the fiscal year ended March 31, 2015.
Production and Content Expenses
Production and content expenses increased 14% to $3.9 million for the fiscal year ended March 31, 2015 from $3.4 million for the fiscal year ended March 31, 2014. The 14% increase was primarily attributed to increased ad serving costs and new media software subscriptions.
Sales and Marketing Expenses
Sales and marketing expenses decreased 7% to $1.8 million during the fiscal year ended March 31, 2015 compared to $1.9 million in the fiscal year ended March 31, 2014. The 7% decrease was primarily attributed to reduced sales commissions from direct sales decline.
Information Technology Support Expenses
Information technology support expenses decreased 13% to approximately $1.3 million during the fiscal year ended March 31, 2015 compared to $1.5 million in the fiscal year ended March 31. 2014. The 13% decrease was primarily attributed to savings from departmental personnel changes.
General and Administrative Expenses
General and administrative expenses increased 41% to approximately $1.8 million during the fiscal year ended March 31, 2015 compared to $1.3 million in the fiscal year ended March 31, 2014. The 41% increase was primarily attributed to higher new office rents, personnel costs and stock-based compensation expense.
Interest Expense
Interest expense remained flat at approximately $0.04 million during the fiscal years ended March 31, 2015 and 2014.
Liquidity and Capital Resources
Net cash used in operations was $2.2 million for the fiscal year ended March 31, 2016, $2.9 million for the fiscal year ended March 31, 2015 and $2.6 million for the fiscal year ended March 31, 2014. The principal use of cash during the fiscal years ended March 31, 2016, 2015 and 2014 was to meet the Company’s operating deficits.
Net cash used in investing activities was immaterial for each of the fiscal years ended March 31, 2016, 2015 and 2014 and was used primarily to fund the acquisition of computer equipment and leasehold improvements to our New York office.
Net cash provided from financing activities was $2.2 million, $3.0 million and $2.6 million in short-term advances from related parties for the fiscal years ended March 31, 2016, 2015 and 2014 respectively.
Indemnification of Officers and Directors
Salon, as permitted under Delaware law and in accordance with its Bylaws, indemnifies its officers and directors for certain events or occurrences, subject to certain limits, while the officer is or was serving at Salon’s request in such capacity. The term of the indemnification period is for the officer's, or director's lifetime. The maximum amount of potential future indemnification is unlimited; however, Salon maintains a Director and Officer Insurance Policy that limits Salon's exposure and enables Salon to recover a portion of any future amounts paid. As a result of the insurance policy coverage, Salon believes the fair value of these indemnification agreements is minimal.
Contractual Obligations
As of March 31, 2016, Salon has no outstanding convertible notes and capital leases and does not anticipate entering into similar debt instruments during its year ending March 31, 2017. The following summarizes Salon’s contractual obligations as of March 31, 2016, and the effect these contractual obligations are expected to have on Salon’s liquidity and cash flows in future periods (in thousands):
|
Payments Due By Period |
||||||||||||||||||||
|
Total |
1 Year or less |
1 - 3 Years |
3 - 5 Years |
More than 5 Years |
||||||||||||||||
|
Operating leases |
$ | 1,302 | $ | 411 | $ | 722 | $ | 169 | $ | - | ||||||||||
|
Short-term borrowing |
1,000 | 1,000 | - | - | - | |||||||||||||||
|
Short-term borrowing interest |
335 | 335 | - | - | - | |||||||||||||||
|
Related party advances |
7,991 | 7,991 | - | - | - | |||||||||||||||
|
Total |
$ | 10,628 | $ | 9,737 | $ | 722 | $ | 169 | $ | - | ||||||||||
Capital requirements
Salon has a history of significant losses and expects to incur a net loss from operations for its year ending March 31, 2017. Because of past losses, an anticipated loss next year and a history of negative cash flows from operations, Salon’s independent registered public accounting firm for the years ended March 31, 2016, 2015 and 2014 have included a paragraph in its reports indicating substantial doubt as to Salon’s ability to continue as a going concern. During the last three years, Salon has relied on cash from related party advances to meet its cash requirements.
Based on current cash projections, which contemplate a smaller operating loss and take into account $0.4 million in related party advances received subsequent to year end, Salon estimates it will require approximately $1.0 to $1.5 million in additional funding to meet operating needs. Operating costs in fiscal year 2016 were stable compared to fiscal year 2015. Subsequent to the end of fiscal year 2016, we took steps to reduce our operating expenses by reducing headcount and not rehiring positions in which we had attrition, and ending certain non-core contracts. However, if planned revenues are less than expected, then we will not meet our operating targets and the projected cash shortfall may be higher. Salon is in discussions with potential investors, including related parties, to obtain additional funding. There can be no assurance that the Company will be able to raise additional funds on commercially reasonable terms, if at all.
Off-Balance Sheet Arrangements
Salon has no off-balance sheet arrangements.
Recent Accounting Pronouncements
In April 2015, the Financial Accounting Standards Board ("FASB") issued Accounting Standards Update ("ASU") 2015-03 as part of its initiative to reduce complexity in accounting standards (Simplification Initiative.) This ASU requires entities to present debt issuance costs related to a recognized debt liability as a direct deduction from the carrying amount of that debt liability. For public business entities, the standard is effective for the fiscal years beginning after December 15, 2015, and interim periods within those fiscal years. Early adoption is permitted. An entity should apply the new guidance on a retrospective basis. This guidance however does not address presentation or subsequent measurement of debt issuance costs related to line-of-credit arrangements. The Company is currently evaluating the impact of this new guidance and does not believe adoption will have a material impact on its financial statements.
In April 2015, the FASB issued ASU 2015-05 as part of its Simplification Initiative. This ASU adds guidance to help entities evaluate the accounting for fees paid by a customer in a cloud computing arrangement, whether it includes the sale or license of software. The guidance will not change generally accepted accounting principles for a customer’s accounting for service contracts. For public entities, the standard is effective for annual periods, including interim periods within those annual periods, beginning after December 15, 2015. Early adoption is permitted. An entity can elect to adopt the standard either (1) prospectively to all arrangements entered into or materially modified after the effective date or (2) retrospectively. The Company is currently evaluating the impact of this new guidance and does not believe adoption will have a material impact on its financial statements.
In August 2015, the FASB issued ASU 2015-15 to amend paragraphs contained in ASU 2015-03. Given the absence of authoritative guidance within ASU 2015-03 for debt issuance costs related to line-of-credit arrangements, the SEC staff would not object to an entity deferring and presenting debt issuance costs as an asset and subsequent amortizing the deferred debt issuance costs ratably over the life of the line-of-credit arrangement regardless of whether there are any outstanding borrowings. The Company is currently evaluating the impact of this new guidance and does not believe adoption will have a material impact on its financial statements.
In November 2015, the FASB issued ASU 2015-17 to simplify the presentation of deferred income taxes, requiring that deferred tax liabilities and assets be classified as noncurrent in a classified statement of financial position. The amendments in this ASU apply to all entities that present a classified statement of financial position. This ASU is effective for financial statements issued for annual periods beginning after December 15, 2016, and interim periods within those annual periods. Earlier application is permitted for all entities as of the beginning of an interim or annual reporting period. The Company is currently evaluating the impact of this new guidance and does not believe adoption will have a material impact on its financial statements.
In February 2016, the FASB issued ASU 2016-02 to increase transparency and comparability among organizations by recognizing lease assets and lease liabilities on the balance sheet and disclosing key information about leasing arrangements. The amendments in this ASU are effective for fiscal years beginning after December 15, 2018, including interim periods within those fiscal years. Early adoption is permitted. The Company is currently evaluating the impact of this new guidance and does not believe adoption will have a material impact on its financial statements.
In March 2016, the FASB issued ASU 2016-09 as part of its Simplification Initiative. The objective of the Simplification Initiative is to identify, evaluate, and improve areas of generally accepted accounting principles for which cost and complexity can be reduced while maintaining or improving the usefulness of the information provided to users of financial statements. The areas for simplification in this ASU involve several aspects of the accounting for share-based payment transactions, including the income tax consequences, classification of awards as either equity or liabilities, and classification on the statement of cash flows. The amendments in this ASU affect all entities that issue share-based payment awards to their employees and are effective for annual periods beginning after December 15, 2016, and interim periods within those annual periods. The Company is currently evaluating the impact of this new guidance and does not believe adoption will have a material impact on its financial statements.
ITEM 7A. Quantitative and Qualitative Disclosures About Market Risk
Salon maintains all of its cash in immediately available cash deposits at its bank. These funds are not subject to market risk and no interest is paid on such funds. In May 2007, Salon entered into a credit agreement with Deutsche Bank Securities, Inc. that allows Salon to borrow up to $1.0 million, plus accrued interest, at a rate of prime less 0.25% which will subject Salon to interest rate risk. The line of credit has been fully drawn as of March 31, 2016 and is guaranteed by Salon’s Chairman. Rates remained at a constant level throughout most of fiscal year 2016. Salon feels that the impact of the risk of future rate increases will not have a material impact. As Salon conducts all of its business in the United States, Salon is not subject to foreign exchange risk.
ITEM 8. Financial Statements and Supplementary Data
Page
|
Report of Independent Registered Public Accounting Firm |
33 |
|
Balance Sheets as of March 31, 2016 and 2015 |
34 |
|
Statements of Operations for the years ended March 31, 2016, 2015 and 2014 |
35 |
|
| |
|
Statements of Stockholders’ Deficit for the years ended March 31, 2016, 2015 and 2014 |
36 |
|
| |
|
Statements of Cash Flows for the years ended March 31, 2016, 2015 and 2014 |
37 |
|
| |
|
Notes to Financial Statements |
38 |
Report Of Independent Registered Public Accounting Firm
To the Board of Directors and Stockholders
Salon Media Group, Inc.
We have audited the accompanying balance sheets of Salon Media Group, Inc. (“the Company”) as of March 31, 2016 and 2015, and the related statements of operations, stockholders’ deficit and cash flows for each of the three years in the period ended March 31, 2016. These financial statements are the responsibility of the Company’s management. Our responsibility is to express an opinion on these financial statements based on our audits.
We conducted our audits in accordance with the standards of the Public Company Accounting Oversight Board (United States). Those standards require that we plan and perform the audit to obtain reasonable assurance about whether the financial statements are free of material misstatement. The Company is not required to have, nor have we been engaged to perform an audit of the Company’s internal control over financial reporting. Our audits included consideration of internal control over financial reporting as a basis for designing audit procedures that are appropriate in the circumstances, but not for the purpose of expressing an opinion on the effectiveness of the Company's internal control over financial reporting. Accordingly, we express no such opinion. An audit includes examining, on a test basis, evidence supporting the amounts and disclosures in the financial statements. An audit also includes assessing the accounting principles used and significant estimates made by management, as well as evaluating the overall financial statement presentation. We believe that our audits provide a reasonable basis for our opinion.
In our opinion, the financial statements referred to above present fairly, in all material respects, the financial position of Salon Media Group, Inc. as of March 31, 2016 and 2015, and the results of its operations and its cash flows for each of the three years in the period ended March 31, 2016 in conformity with accounting principles generally accepted in the United States of America.
The accompanying financial statements have been prepared assuming that the Company will continue as a going concern. As discussed in Note 2 to the financial statements, the Company has suffered recurring losses and negative cash flows from operations and has an accumulated deficit of $124.6 million as of March 31, 2016. These conditions raise substantial doubt about its ability to continue as a going concern. Management’s plans regarding these matters are also described in Note 2. The financial statements do not include any adjustments that might result from the outcome of this uncertainty.
/s/ Burr Pilger Mayer, Inc.
San Francisco, California
June 24, 2016
SALON MEDIA GROUP, INC.
BALANCE SHEETS
(in thousands, except share and per share amounts)
|
March 31, |
||||||||
|
2016 |
2015 |
|||||||
|
Assets |
||||||||
|
Current assets: |
||||||||
|
Cash |
$ | 189 | $ | 229 | ||||
|
Accounts receivable, net of allowance of $20 and $55 |
1,348 | 874 | ||||||
|
Prepaid expenses and other current assets |
127 | 141 | ||||||
|
Total current assets |
1,664 | 1,244 | ||||||
|
Property and equipment, net |
69 | 60 | ||||||
|
Other assets, principally deposits |
301 | 301 | ||||||
|
Total assets |
$ | 2,034 | $ | 1,605 | ||||
|
Liabilities and Stockholders’ Deficit |
||||||||
|
Current liabilities: |
||||||||
|
Short-term borrowings |
$ | 1,000 | $ | 1,000 | ||||
|
Advances from related parties |
7,991 | 5,826 | ||||||
|
Accounts payable and accrued liabilities |
1,257 | 1,331 | ||||||
|
Total current liabilities |
10,248 | 8,157 | ||||||
|
Deferred rent |
69 | 73 | ||||||
|
Total liabilities |
10,317 | 8,230 | ||||||
|
Commitments and contingencies (Note 8) |
||||||||
|
Stockholders’ deficit: |
||||||||
|
Preferred stock, $0.001 par value, 5,000,000 shares authorized, 1,075 shares issued and outstanding as of March 31, 2016 and 2015 (liquidation value of $2,564 as of March 31, 2016) |
- | - | ||||||
|
Common stock, $0.001 par value, 150,000,000 shares authorized, 76,245,442 shares issued and outstanding as of March 31, 2016 and 2015 |
76 | 76 | ||||||
|
Additional paid-in capital |
116,192 | 115,890 | ||||||
|
Accumulated deficit |
(124,551 | ) | (122,591 | ) | ||||
|
Total stockholders’ deficit |
(8,283 | ) | (6,625 | ) | ||||
|
Total liabilities and stockholders’ deficit |
$ | 2,034 | $ | 1,605 | ||||
See accompanying notes to financial statements.
SALON MEDIA GROUP, INC.
STATEMENTS OF OPERATIONS
(in thousands, except per share data)
|
Year Ended March 31, |
||||||||||||
|
2016 |
2015 |
2014 |
||||||||||
|
Net revenues |
$ | 6,959 | $ | 4,946 | $ | 6,004 | ||||||
|
Operating expenses: |
||||||||||||
|
Production and content |
3,927 | 3,942 | 3,447 | |||||||||
|
Sales and marketing |
1,672 | 1,783 | 1,917 | |||||||||
|
Information technology support |
1,417 | 1,309 | 1,505 | |||||||||
|
General and administrative |
1,862 | 1,813 | 1,284 | |||||||||
|
Total operating expenses |
8,878 | 8,847 | 8,153 | |||||||||
|
Loss from operations |
(1,919 | ) | (3,901 | ) | (2,149 | ) | ||||||
|
Interest expense, net |
(41 | ) | (39 | ) | (37 | ) | ||||||
|
Net loss |
$ | (1,960 | ) | $ | (3,940 | ) | $ | (2,186 | ) | |||
|
Basic and diluted net loss per share |
$ | (0.03 | ) | $ | (0.05 | ) | $ | (0.03 | ) | |||
|
Weighted average shares used in computing basic and diluted net loss per share |
76,245 | 76,245 | 73,923 | |||||||||
See accompanying notes to financial statements.
SALON MEDIA GROUP, INC.
STATEMENTS OF STOCKHOLDERS’ DEFICIT
(in thousands, except preferred stock shares)
| Preferred | Common |
Additional |
Total |
|||||||||||||||||||||||||
| Stock |
Stock |
Paid-In |
Accumulated |
Stockholders’ |
||||||||||||||||||||||||
|
Shares |
Amount |
Shares |
Amount |
Capital |
(Deficit) |
Deficit |
||||||||||||||||||||||
|
Balance, March 31, 2013 |
8,141 | $ | - | 29,573 | $ | 30 | $ | 106,408 | $ | (116,465 | ) | $ | (10,027 | ) | ||||||||||||||
|
Shares converted from preferred stock |
(7,066 | ) | - | 20,556 | 20 | (20 | ) | - | - | |||||||||||||||||||
|
Shares converted from accrued liabilities |
- | - | 339 | - | 118 | - | 118 | |||||||||||||||||||||
|
Shares converted from related party advances |
- | - | 25,689 | 26 | 8,965 | - | 8,991 | |||||||||||||||||||||
|
Shares from options exercise |
- | - | 88 | - | - | - | - | |||||||||||||||||||||
|
Stock-based compensation |
- | - | - | - | 134 | - | 134 | |||||||||||||||||||||
|
Net loss |
- | - | - | - | - | (2,186 | ) | (2,186 | ) | |||||||||||||||||||
|
Balance, March 31, 2014 |
1,075 | - | 76,245 | 76 | 115,605 | (118,651 | ) | (2,970 | ) | |||||||||||||||||||
|
Stock-based compensation |
- | - | - | - | 285 | - | 285 | |||||||||||||||||||||
|
Net loss |
- | - | - | - | - | (3,940 | ) | (3,940 | ) | |||||||||||||||||||
|
Balance, March 31, 2015 |
1,075 | - | 76,245 | 76 | 115,890 | (122,591 | ) | (6,625 | ) | |||||||||||||||||||
|
Stock-based compensation |
- | - | - | - | 302 | - | 302 | |||||||||||||||||||||
|
Net loss |
- | - | - | - | - | (1,960 | ) | (1,960 | ) | |||||||||||||||||||
|
Balance, March 31, 2016 |
1,075 | $ | - | 76,245 | $ | 76 | $ | 116,192 | $ | (124,551 | ) | $ | (8,283 | ) | ||||||||||||||
See accompanying notes to financial statements.
SALON MEDIA GROUP, INC.
STATEMENTS OF CASH FLOWS
(in thousands)
|
Year Ended March 31, |
||||||||||||
|
2016 |
2015 |
2014 |
||||||||||
|
Cash flows from operating activities: |
||||||||||||
|
Net loss |
$ | (1,960 | ) | $ | (3,940 | ) | $ | (2,186 | ) | |||
|
Adjustments to reconcile net loss to net cash used in operating activities: |
||||||||||||
|
Loss from retirement of assets, net |
- | - | 9 | |||||||||
|
Bad debt expense and change in allowance for doubtful accounts |
35 | 14 | 9 | |||||||||
|
Stock-based compensation |
302 | 285 | 134 | |||||||||
|
Depreciation |
34 | 35 | 36 | |||||||||
|
Changes in assets and liabilities: |
||||||||||||
|
Accounts receivable |
(509 | ) | 587 | (764 | ) | |||||||
|
Prepaid expenses and other assets |
14 | (57 | ) | 40 | ||||||||
|
Accounts payable, accrued liabilities and deferred rent |
(78 | ) | 192 | 190 | ||||||||
|
Deferred revenue |
- | - | (15 | ) | ||||||||
|
Net cash used in operating activities |
(2,162 | ) | (2,884 | ) | (2,547 | ) | ||||||
|
Cash flows from investing activities: |
||||||||||||
|
Purchase of property and equipment |
(43 | ) | (41 | ) | (41 | ) | ||||||
|
Purchase of intangible assets |
- | - | - | |||||||||
|
Proceeds from asset sales |
- | - | - | |||||||||
| Net cash used in investing activities | (43 | ) | (41 | ) | (41 | ) | ||||||
|
Cash flows from financing activities: |
||||||||||||
|
Proceeds from short-term borrowings and advances |
2,165 | 3,035 | 2,611 | |||||||||
|
Net cash provided by financing activities |
2,165 | 3,035 | 2,611 | |||||||||
|
Net increase (decrease) in cash and cash equivalents |
(40 | ) | 110 | 23 | ||||||||
|
Cash, beginning of year |
229 | 119 | 96 | |||||||||
|
Cash, end of year |
$ | 189 | $ | 229 | $ | 119 | ||||||
|
Supplemental schedule of non-cash investing and financing activities: |
||||||||||||
|
Conversion of accounts payable, preferred stock, convertible debts and unsecured advances to common stock |
$ | - | $ | - | $ | 9,109 | ||||||
See accompanying notes to financial statements.
SALON MEDIA GROUP, INC.
NOTES TO FINANCIAL STATEMENTS
(amounts in thousands, except share and per share data)
Note 1. The Company
Salon Media Group, Inc. (“Salon” or “the Company”) is an Internet media company that produces a content Website with various subject-specific sections. Salon was originally incorporated in July 1995 in the State of California and reincorporated in Delaware in June 1999. Salon operates in one business segment.
Note 2. Summary of Significant Accounting Policies
Basis of presentation
These financial statements contemplate the realization of assets and the satisfaction of liabilities in the normal course of business. Salon has incurred losses and negative cash flows from operations since inception and has an accumulated deficit as of March 31, 2016 of $124,551. In addition, Salon expects to incur a net loss from operations for its year ending March 31, 2017. During the last three years, Salon has relied on cash from related-party advances to meet its cash requirements. Based on current cash projections, which contemplate a smaller operating loss and take into account $0.4 million in related party advances received subsequent to year end, Salon estimates it will require between $1.0 to $1.5 million in additional funding to meet operating needs. Operating costs in fiscal year 2016 were stable compared to fiscal year 2015. Subsequent to the end of fiscal year 2016, we took steps to reduce our operating expenses by reducing headcount and not rehiring positions in which we had attrition, and ending certain non-core contracts. However, if planned revenues are less than expected, then we will not meet our operating targets and our projected cash shortfall may be higher. Salon is in discussions with potential investors, including related parties, to obtain additional funding. There can be no assurance that the Company will be able to raise additional funds on commercially reasonable terms, if at all. These conditions raise substantial doubt about the Company’s ability to continue as a going concern. These financial statements do not include any adjustments that might be necessary if the Company is unable to continue as a going concern.
Segment and enterprise-wide reporting
Salon discloses segment enterprise-wide information in accordance with Accounting Standards Codification (ASC) 280, Segment Reporting. Based upon definitions contained within ASC 280, management has determined that Salon operates in one segment. In addition, substantially all revenues are in the United States, and all of the long-lived assets are located within the United States.
SALON MEDIA GROUP, INC.
NOTES TO FINANCIAL STATEMENTS
(amounts in thousands, except share and per share data)
Use of estimates
The preparation of financial statements in conformity with accounting principles generally accepted in the United States of America requires management to make estimates and assumptions that affect the reported amounts of assets and liabilities and disclosure of contingent assets and liabilities at the date of the financial statements and the reported amounts of revenue and expenses during the reporting period. Actual results could differ from those estimates.
Cash and cash equivalents
Cash and cash equivalents consist of cash on deposit with banks and investments that are readily convertible into cash and have original maturities of three months or less. There were no cash equivalents as of March 31, 2016 and 2015.
Accounts receivable, net
Accounts receivable are stated net of doubtful accounts. Salon estimates the collectibility of the accounts receivable balance and maintains allowances for estimated losses. Salon analyzes accounts receivable, historical bad debts, receivable aging, customer credit-worthiness, and current economic trends when evaluating the adequacy of the allowance for doubtful accounts.
Property and equipment, net
Property and equipment are recorded at cost. Maintenance, repairs and minor renewals are expensed as incurred. Depreciation is provided on a straight-line basis over the useful lives of the asset, principally three years for computer hardware and software, and five years for furniture and office equipment. Amortization of leasehold improvements is provided on a straight-line basis over the useful life of the asset or the term of the lease, whichever is shorter. When property and equipment is retired or otherwise disposed of, the cost and accumulated depreciation and amortization are relieved from the accounts and the net gain or loss is included in the determination of income or loss.
Software development costs
Information technology support expenses to develop new product offerings for internal use, such as Open Salon, are capitalized as software development costs and amortized over the expected useful live. As of March 31, 2015, Open Salon was closed and its total capitalized costs were fully amortized. No other amounts were capitalized in fiscal years 2010 through 2016.
Revenue recognition
Salon’s revenues are primarily from the sale of advertising space on its Website. Salon recognizes revenue once persuasive evidence of an arrangement exists, delivery has occurred, the fee is fixed or determinable and collectibility is reasonably assured. Revenues are recognized ratably in the period over which Salon’s obligations are fulfilled. Payments received before Salon’s obligations are fulfilled are classified as “Deferred revenue” in Salon’s balance sheets.
SALON MEDIA GROUP, INC.
NOTES TO FINANCIAL STATEMENTS
(amounts in thousands, except share and per share data)
Advertisement sales agreements are generally short-term agreements, usually less than ninety days. Revenues derived from such arrangements are recognized during the period the advertising space is provided, as long as no significant obligations remain at the end of the period. Salon’s obligations may include the guarantee of a minimum number of times that an advertisement appears in a page viewed by a visitor to Salon’s Website. To the extent the minimum guaranteed amounts are not delivered, Salon defers recognition of the corresponding revenue until the remaining guaranteed amounts are achieved, if mutually agreeable with an advertiser. If these “make good” impressions are not agreeable to an advertiser, no further revenue is recognized.
Comprehensive loss
Comprehensive loss is defined as the change in equity of a business enterprise during a period from non-owner sources. There were no differences between the net loss for the years ended March 31, 2016, 2015 and 2014 and comprehensive loss for those periods.
Stock-based compensation
Stock-based compensation cost is measured at the grant date based on the fair value of the award and is recognized as expense over the requisite service period, which is the vesting period. Salon uses the Black-Scholes option-pricing model to determine the fair-value of stock-based awards. Salon recognizes compensation cost related to options granted on a straight-line basis over the applicable vesting period.
Net loss per share
Basic net loss per share is computed using the weighted-average number of shares of common stock outstanding during the period. Diluted net loss per share is computed using the weighted-average number of common and common stock equivalents outstanding during the period, as follows:
|
Year Ended March 31, |
||||||||||||
|
2016 |
2015 |
2014 |
||||||||||
|
Numerator: |
||||||||||||
|
Net loss |
$ | (1,960 | ) | $ | (3,940 | ) | $ | (2,186 | ) | |||
|
Denominator: |
||||||||||||
|
Weighted average shares used in computing basic and diluted net loss per share |
76,245,000 | 76,245,000 | 73,923,000 | |||||||||
|
Basic and diluted net loss per share |
$ | (0.03 | ) | $ | (0.05 | ) | $ | (0.03 | ) | |||
|
Antidilutive securities including options, warrants and convertible debts and preferred stock not included in net loss per share calculation |
8,338,000 | 9,198,000 | 7,105,000 | |||||||||
SALON MEDIA GROUP, INC.
NOTES TO FINANCIAL STATEMENTS
(amounts in thousands, except share and per share data)
Financial instruments
The carrying amounts of Salon’s financial instruments, including cash, accounts receivable, and accounts payable and accrued liabilities, approximate fair value because of their short maturities. The fair value of advances is less than book value, but due to many factors, fair value is undeterminable at this time.
Income taxes
Salon recognizes deferred taxes using the asset and liability method of accounting for income taxes. Under the asset and liability method, deferred income taxes are recognized for differences between the financial statement and tax basis of assets and liabilities at enacted statutory tax rates in effect for the years in which the differences are expected to reverse. The effect on deferred taxes of a change in tax rates is recognized in income in the period that includes the enactment date. Valuation allowances are established when necessary to reduce deferred tax assets to the amounts expected to be realized.
Concentrations of credit risk
Financial instruments that potentially subject Salon to concentrations of credit risk consist principally of trade accounts receivable. Salon performs ongoing credit evaluations of its customers, but does not require collateral. Salon provides an allowance for credit losses that it periodically adjusts to reflect management’s expectations of future losses. Five customers accounted for approximately 17%, 14%, 12%, 11% and 10% of trade accounts receivable as of March 31, 2016. Two customers accounted for approximately 20% and 19% of trade accounts receivable as of March 31, 2015. Two customers accounted for approximately 26% and 13% of net revenue for year ended March 31, 2016. One customer accounted for approximately 23% of net revenue for year ended March 31, 2015. One customer accounted for approximately 11% of net revenue for year ended as of March 31, 2014.
Recent accounting pronouncements
In April 2015, the Financial Accounting Standards Board ("FASB") issued Accounting Standards Update ("ASU") 2015-03 as part of its initiative to reduce complexity in accounting standards (Simplification Initiative.) This ASU requires entities to present debt issuance costs related to a recognized debt liability as a direct deduction from the carrying amount of that debt liability. For public business entities, the standard is effective for the fiscal years beginning after December 15, 2015, and interim periods within those fiscal years. Early adoption is permitted. An entity should apply the new guidance on a retrospective basis. This guidance however does not address presentation or subsequent measurement of debt issuance costs related to line-of-credit arrangements. The Company is currently evaluating the impact of this new guidance and does not believe adoption will have a material impact on its financial statements.
In April 2015, the FASB issued ASU 2015-05 as part of its Simplification Initiative. This ASU adds guidance to help entities evaluate the accounting for fees paid by a customer in a cloud computing arrangement, whether it includes the sale or license of software. The guidance will not change generally accepted accounting principles for a customer’s accounting for service contracts. For public entities, the standard is effective for annual periods, including interim periods within those annual periods, beginning after December 15, 2015. Early adoption is permitted. An entity can elect to adopt the standard either (1) prospectively to all arrangements entered into or materially modified after the effective date or (2) retrospectively. The Company is currently evaluating the impact of this new guidance and does not believe adoption will have a material impact on its financial statements.
In August 2015, the FASB issued ASU 2015-15 to amend paragraphs contained in ASU 2015-03. Given the absence of authoritative guidance within ASU 2015-03 for debt issuance costs related to line-of-credit arrangements, the SEC staff would not object to an entity deferring and presenting debt issuance costs as an asset and subsequent amortizing the deferred debt issuance costs ratably over the life of the line-of-credit arrangement regardless of whether there are any outstanding borrowings. The Company is currently evaluating the impact of this new guidance and does not believe adoption will have a material impact on its financial statements.
In November 2015, the FASB issued ASU 2015-17 to simplify the presentation of deferred income taxes, requiring that deferred tax liabilities and assets be classified as noncurrent in a classified statement of financial position. The amendments in this ASU apply to all entities that present a classified statement of financial position. This ASU is effective for financial statements issued for annual periods beginning after December 15, 2016, and interim periods within those annual periods. Earlier application is permitted for all entities as of the beginning of an interim or annual reporting period. The Company is currently evaluating the impact of this new guidance and does not believe adoption will have a material impact on its financial statements.
In February 2016, the FASB issued ASU 2016-02 to increase transparency and comparability among organizations by recognizing lease assets and lease liabilities on the balance sheet and disclosing key information about leasing arrangements. The amendments in this ASU are effective for fiscal years beginning after December 15, 2018, including interim periods within those fiscal years. Early adoption is permitted. The Company is currently evaluating the impact of this new guidance and does not believe adoption will have a material impact on its financial statements.
In March 2016, the FASB issued ASU 2016-09 as part of its Simplification Initiative. The objective of the Simplification Initiative is to identify, evaluate, and improve areas of generally accepted accounting principles for which cost and complexity can be reduced while maintaining or improving the usefulness of the information provided to users of financial statements. The areas for simplification in this ASU involve several aspects of the accounting for share-based payment transactions, including the income tax consequences, classification of awards as either equity or liabilities, and classification on the statement of cash flows. The amendments in this ASU affect all entities that issue share-based payment awards to their employees and are effective for annual periods beginning after December 15, 2016, and interim periods within those annual periods. The Company is currently evaluating the impact of this new guidance and does not believe adoption will have a material impact on its financial statements.
Reclassifications
Certain reclassifications, not affecting previously reported net loss, have been made to the previously issued financial statements to conform to the current period presentation.
SALON MEDIA GROUP, INC.
NOTES TO FINANCIAL STATEMENTS
(amounts in thousands, except share and per share data)
Note 3. Property and Equipment
|
March 31, |
||||||||
|
2016 |
2015 |
|||||||
|
Property and equipment, net |
||||||||
|
Computer hardware and software |
$ | 1,153 | $ | 1,269 | ||||
|
Leasehold improvements |
15 | 15 | ||||||
|
Furniture and office equipment |
126 | 297 | ||||||
| 1,294 | 1,581 | |||||||
|
Less accumulated depreciation |
(1,225 | ) | (1,521 | ) | ||||
| $ | 69 | $ | 60 | |||||
Depreciation expense for the years ended March 31, 2016, 2015 and 2014 was $34, $35 and $36 respectively.
Note 4. Borrowing Agreements
Short-term borrowings
In May 2007, Salon entered into a borrowing agreement with Deutsche Bank Securities, Inc. that allows Salon to borrow up to $1,000, plus accrued interest, at a rate of prime less 0.25%. The agreement is guaranteed in its entirety by Salon’s Chairman. The line of credit has been fully drawn as of March 31, 2016 and 2015. Salon and its Chairman have agreed to lift previously agreed restrictions on the timing of borrowing to permit borrowing to continue under the agreement with the guarantee of the Chairman. Deutsche Bank Securities may demand repayment of amounts borrowed at any time. Additionally, the Chairman may also choose to terminate his guarantee, which would trigger a demand for repayment. As of March 31, 2016 and 2015, accrued interest on bank debt totaled $335 and $294, respectively. During the fiscal years ended March 31, 2016 and 2015, the weighted average interest rate on the Company’s short-term borrowings remained constant at 3.5%.
Convertible notes payable
As of March 31, 2016 and 2015, Salon had no outstanding convertible notes and does not anticipate entering into similar debt instruments during its year ending March 31, 2017.
Advances from Related Parties
As of March 31, 2016, the Company had received $8,000 in unsecured, interest-free cash advances from the Company’s Chairman. As of March 31, 2015, the Company had received $5,800 in unsecured, interest-free cash advances from the Company’s Chairman. Subsequent to the fiscal year ended March 31, 2016, the Company’s Chairman advanced an additional $350 to be used for working capital. This debt is payable on demand, and is exchangeable into securities to be issued in the next financing raised by the Company from non-related parties.
SALON MEDIA GROUP, INC.
NOTES TO FINANCIAL STATEMENTS
(amounts in thousands, except share and per share data)
Note 5. Accounts Payable and Accrued Liabilities
|
March 31, |
||||||||
|
2016 |
2015 |
|||||||
|
Accounts payable and accrued liabilities |
||||||||
|
Accounts payable |
$ | 393 | $ | 437 | ||||
|
Salaries and wages payable |
449 | 396 | ||||||
|
Accrued services |
14 | 29 | ||||||
|
Accrued interest |
335 | 294 | ||||||
|
Other accrued expenses |
66 | 175 | ||||||
| $ | 1,257 | $ | 1,331 | |||||
Note 6. 401(k) Savings Plan
Salon’s 401(k) Savings Plan (the “401(k) Plan”) is a defined contribution retirement plan intended to qualify under Sections 401(a) and 401(k) of the Internal Revenue Code. All full-time employees of Salon are eligible to participate in the 401(k) Plan pursuant to its terms. Participants may contribute from 1% to 20% of compensation, subject to statutory limitations. Employer matching contributions are discretionary based on a certain percentage of a participant’s contributions as determined by management of Salon. Salon has not made any discretionary matching contributions to the 401(k) Plan through March 31, 2016.
Note 7. Employee Stock Option Plan
Salon has two stock option plans approved by stockholders: the Salon Media Group, Inc. 2004 Stock Plan (“the 2004 Plan”) that was approved by Salon’s stockholders in November 2004 and the Salon Media Group, Inc. 2014 Stock Incentive Plan (“the 2014 Plan”) that was approved by Salon’s stockholders in March 2014. The 2004 Plan and the 2014 Plan, each with an effective term of ten years following its approval by the stockholders of the Company, allow the issuance of incentive and non-statutory options to employees and non-employees of Salon.
In October 2005, Salon’s stockholders approved an amendment to the 2004 Plan to increase the maximum number of shares of common stock that may be issued under the plan by 800,000 to 2,300,000 shares. In October 2007, Salon’s stockholders approved another amendment to the 2004 Plan to increase the maximum number of shares of common stock that may be issued under the plan by 875,000 to a total of 3,175,000 shares and to allow for grants of restricted stock awards. In May 2009, Salon’s Board of Directors further approved an amendment to the 2004 Plan to increase the maximum number of shares of Common Stock that may be issued under the plan by 4,500,000 to 7,675,000 shares. The 2004 Plan expired in November 2014 after which no further options are allowed to be granted.
Under the 2014 Plan, the maximum aggregate number of shares which may be issued is 10,000,000 shares, plus an annual increase to be added on the first business day of the Company’s fiscal year beginning in 2015 equal to 1% of the number of shares outstanding as of such date or a lesser number of shares determined by the administrator.
SALON MEDIA GROUP, INC.
NOTES FINANCIAL STATEMENTS
(amounts in thousands, except share and per share data)
Under the 2004 Plan and the 2014 Plan, incentive and nonqualified stock options may be granted to officers, employees, directors and consultants of Salon. Options generally vest over periods of four years. Options generally become exercisable as to 25% of the option shares one year from the date of grant and then ratably over the following 36 months (1/48 per month). The exercise price of options is determined by the Board of Directors and is equal to the fair market value of the stock on the grant date. Generally, Salon’s options expire, if not exercised, ten years after the date of grant.
Salon may grant restricted stock awards to officers that typically vest over an approximate four year period. Restricted stock awards are considered outstanding at the time of grant, as the stock award holders are entitled to dividends and voting rights.
Salon has granted options pursuant to plans not approved by stockholders. These grants included an option to purchase 25,000 shares of common stock issued in December 2006 and an option to purchase 50,000 shares of common stock issued in June 2006, both granted to Salon’s then Senior Vice President – Publisher, and an option to purchase 50,000 shares of common stock issued in February 2005 to Salon’s former Chairman. The 75,000 options granted to the then Senior Vice President – Publisher have been forfeited following the departure of the executive.
As of March 31, 2016, Salon has 10,762,000 shares authorized to be issued under the 2014 Plan of which approximately 8,447,000 shares remain available for future grant.
Stock based compensation expense recognized for the years ended March 31, 2016, 2015 and 2014 was $302, $285 and $134, which consisted of stock-based compensation expense related to stock options.
As of March 31, 2016, the aggregate stock compensation remaining to be amortized to expenses was $211. Salon expects this stock-based compensation balance to be amortized as follows: $87 during fiscal year 2017; $78 during fiscal year 2018; $45 during fiscal year 2019 and $1 during fiscal year 2020. The expected amortization reflects only outstanding stock option awards as of March 31, 2016.
No amounts were recorded relating to excess tax benefits from the exercise of stock-based compensation awards during the year ended March 31, 2016, 2015 and 2014 and as a result there were no differences in net cash used in operating and financing activities.
The fair value of each option grant was estimated on the date of grant using the Black-Scholes option-pricing model with the following assumptions and fair value per share:
|
Year Ended March 31, |
||||||||||||||||||
|
2016 |
2015 |
2014 |
||||||||||||||||
|
Risk-free interest rates |
1.10 | – | 1.30% | 0.12 | – | 1.25% | 1.00 | – | 1.10% | |||||||||
|
Expected lives (in years) |
4 | 4 | 4 | |||||||||||||||
|
Expected volatility |
217 | – | 388% | 354 | – | 425% | 442 | – | 461% | |||||||||
|
Dividend yield |
0.0% | 0.0% | 0.0% | |||||||||||||||
SALON MEDIA GROUP, INC.
NOTES FINANCIAL STATEMENTS
(amounts in thousands, except share and per share data)
The expected term of the options of four years represents the estimated period of time until exercise and is based on historical experience of similar awards, including the contractual terms, vesting schedules and expectations of future employee behavior. Expected stock price volatility is based on historical volatility of Salon’s stock over the expected term. The risk-free interest rate is based on the implied yield available on U.S. Treasury securities with a term equivalent to the vesting period of the stock options, or four years. Salon has not paid dividends in the past.
The following table summarizes activity under Salon’s plans for the years ended March 31, 2014, 2015 and 2016:
|
Outstanding Stock Options |
Weighted Average Exercise Price |
Weighted Average Remaining Contractual Life (Years) |
Aggregate Intrinsic Value |
|||||||||||||
|
Outstanding as of March 31, 2013 |
3,551,000 | $ | 0.13 | 7.2 | $ | 521 | ||||||||||
|
Granted |
3,762,000 | $ | 0.13 | |||||||||||||
|
Exercised |
(88,000 | ) | $ | 0.01 | ||||||||||||
|
Expired or forfeited |
(1,217,000 | ) | $ | 0.29 | ||||||||||||
|
Outstanding as of March 31, 2014 |
6,008,000 | $ | 0.13 | 7.8 | $ | 383 | ||||||||||
|
Granted |
2,388,000 | $ | 0.24 | |||||||||||||
|
Expired or forfeited |
(295,000 | ) | $ | 0.27 | ||||||||||||
|
Outstanding as of March 31, 2015 |
8,101,000 | $ | 0.16 | 7.8 | $ | 328 | ||||||||||
|
Granted |
95,000 | $ | 0.17 | |||||||||||||
|
Expired or forfeited |
(954,000 | ) | $ | 0.26 | ||||||||||||
|
Outstanding as of March 31, 2016 |
7,242,000 | $ | 0.15 | 7.3 | $ | 124 | ||||||||||
|
Exercisable as of March 31, 2016 |
5,974,000 | $ | 0.13 | 7.1 | $ | 121 | ||||||||||
|
Vested and expected to vest as of March 31, 2016 |
7,020,000 | $ | 0.15 | 7.3 | $ | 124 | ||||||||||
SALON MEDIA GROUP, INC.
NOTES FINANCIAL STATEMENTS
(amounts in thousands, except share and per share data)
The following table summarizes information about stock options outstanding as of March 31, 2016:
|
Options Outstanding |
Options Exercisable |
|||||||||||||||||||||
|
Weighted |
||||||||||||||||||||||
|
Average |
Weighted |
Weighted |
||||||||||||||||||||
|
Number of |
Remaining |
Average |
Number of |
Average |
||||||||||||||||||
|
Range of |
Shares |
Contractual |
Exercise |
Shares |
Exercise |
|||||||||||||||||
|
Exercise Prices |
Outstanding |
Life (Years) |
Price |
Exercisable |
Price |
|||||||||||||||||
|
$0.01 |
- | $0.01 | 1,322,000 | 6.3 | $ | 0.01 | 1,293,000 | $ | 0.01 | |||||||||||||
|
$0.05 |
- | $0.06 | 106,000 | 6.1 | $ | 0.05 | 100,000 | $ | 0.05 | |||||||||||||
|
$0.10 |
- | $0.13 | 3,285,000 | 7.0 | $ | 0.13 | 3,092,000 | $ | 0.13 | |||||||||||||
|
$0.16 |
- | $0.24 | 2,405,000 | 8.5 | $ | 0.24 | 1,373,000 | $ | 0.24 | |||||||||||||
|
$0.25 |
- | $0.35 | 110,000 | 3.1 | $ | 0.33 | 102,000 | $ | 0.34 | |||||||||||||
|
$0.45 |
- | $0.45 | 14,000 | 5.6 | $ | 0.45 | 14,000 | $ | 0.45 | |||||||||||||
| 7,242,000 | 7.3 | $ | 0.15 | 5,974,000 | $ | 0.13 | ||||||||||||||||
The weighted average grant date fair value per share of the stock option awards granted in the years ended March 31, 2016, 2015 and 2014 was $0.16, $0.24, and $0.13, respectively. The weighted average fair value of options vested during the years ended March 31, 2016, 2015 and 2014 was $0.18, $0.12 and $0.08 per share, respectively.
The total intrinsic value of options exercised during the years ended March 31, 2016, 2015 and 2014 were nil. No options were exercised during the years ended March 31, 2016 and 2015. A total of 88,000 options were exercised during the year ended March 31, 2014.
SALON MEDIA GROUP, INC.
NOTES TO FINANCIAL STATEMENTS
(amounts in thousands, except share and per share data)
Note 8. Commitments and Contingencies
Salon has an operating lease agreement for its San Francisco, California office headquarters that will expire in November 2017. In addition, Salon has an operating lease agreement for its office space in New York, New York that will expire in September 2019. Operating lease for its office in Manhattan Beach, California was terminated in January 2015.
Rent expense under operating lease agreements was $410, $412 and $197 for the years ended March 31, 2016, 2015 and 2014 respectively.
Total future minimum payments under operating leases, short-term borrowing and convertible notes in effect as of March 31, 2016 are as follows:
|
Payments Due By Period |
||||||||||||||||||||
|
Total |
Year 1 |
Year 2 |
Year 3 |
Year 4 |
||||||||||||||||
|
Operating leases |
$ | 1,302 | $ | 411 | $ | 389 | $ | 333 | $ | 169 | ||||||||||
|
Short-term borrowing |
1,000 | 1,000 | - | - | - | |||||||||||||||
|
Short-term borrowing interest |
335 | 335 | - | - | - | |||||||||||||||
|
Related party advances |
7,991 | 7,991 | - | - | - | |||||||||||||||
|
Total |
$ | 10,628 | $ | 9,737 | $ | 389 | $ | 333 | $ | 169 | ||||||||||
Salon, as permitted under Delaware law and in accordance with its Bylaws, indemnifies its officers and directors for certain events or occurrences, subject to certain limits, while the officer is or was serving at Salon’s request in such capacity. The term of the indemnification period is for the officer’s or director’s lifetime. The maximum amount of potential future indemnification is unlimited; however, Salon does have a Director and Officer Insurance Policy that limits Salon’s exposure and enables Salon to recover a portion of any future amounts paid. As a result of the insurance policy coverage, Salon believes the fair value of these indemnification agreements is minimal.
Salon has entered into an employment agreement with a certain key executive under which severance payments in the aggregate amount of approximately $40 would become due and payable in the event of her termination for other than cause or as a result of a change in control. As disclosed in Note 11, the agreement terms are now effective and Salon anticipates payments to be made in fiscal year 2017.
SALON MEDIA GROUP, INC.
NOTES TO FINANCIAL STATEMENTS
(amounts in thousands, except share and per share data)
Note 9. Income Taxes
Salon has not recorded a provision or benefit for federal or state income taxes for any period since inception due to incurred operating losses. As of March 31, 2016, Salon has net operating loss carry-forwards of $89,800 and $20,100 for federal and California state purposes, respectively, available to reduce future taxable income, if any. During the fiscal year ended March 31, 2016, none of the federal and $964 of the California net operating loss carry-forwards expired, with the balance expiring over time thereafter if not utilized beforehand. The federal net operating loss carry-forwards begin to expire on March 31, 2019 if not utilized beforehand.
As of March 31, 2016, Salon has research and development credit carry-forward of $9 for California income tax purposes. The research and development credit carry-forward for federal income tax purposes expired on March 31, 2012, and the California credits carry forward indefinitely.
The Tax Reform Act of 1986 limits the use of net operating loss and tax credit carry-forwards in certain situations where changes occur in the stock ownership of a company. In the event Salon has incurred a change in ownership, utilization of the carry-forwards could be significantly restricted.
Temporary differences and other sources of deferred tax assets that give rise to significant portions of deferred tax assets and liabilities are as follows:
|
March 31, |
||||||||
|
2016 |
2015 |
|||||||
|
Net operating losses |
$ | 32,181 | $ | 31,760 | ||||
|
Other |
550 | 522 | ||||||
|
Total deferred tax assets |
32,731 | 32,282 | ||||||
|
Valuation allowance |
(32,731 | ) | (32,282 | ) | ||||
|
Net deferred tax asset |
$ | - | $ | - | ||||
Due to the uncertainty of realizing the benefits attributable to the aforementioned deferred tax assets, Salon has provided a valuation allowance against the net deferred tax assets. The difference between Salon’s effective income tax rate and the federal statutory (34%) rate is as follows:
|
Year Ended March 31, |
||||||||||||
|
2016 |
2015 |
2014 |
||||||||||
|
Statutory tax benefit |
$ | (666 | ) | $ | (1,339 | ) | $ | (741 | ) | |||
|
State taxes, net of federal benefit |
140 | 238 | (58 | ) | ||||||||
|
Permanent differences |
76 | 55 | 114 | |||||||||
|
Other |
- | - | 46 | |||||||||
|
Total |
(450 | ) | (1,046 | ) | (731 | ) | ||||||
|
Change in valuation allowance |
450 | 1,046 | 731 | |||||||||
| $ | - | $ | - | $ | - | |||||||
SALON MEDIA GROUP, INC.
NOTES TO FINANCIAL STATEMENTS
(amounts in thousands, except share and per share data)
The Company is subject to U.S. federal income tax as well as to income tax in multiple state jurisdictions. Federal income tax returns of the Company are subject to IRS examination for all years given losses reported on returns.
As of March 31, 2016, there were no uncertain tax positions. Management does not anticipate any future adjustments in the next twelve months which would result in a material change to its tax position. For the years ended March 31, 2016, 2015 and 2014, the Company did not have any interest and penalties.
Note 10. Preferred Stock
On March 1, 2013, Salon completed the Recapitalization in which all of its convertible notes, related party advances and certain accrued consulting fees (aggregating $15,700, including interest on the convertible notes through February 28, 2013) and substantially all shares of its convertible Preferred Stock were exchanged for an aggregate of approximately 72.9 million shares of Common Stock at a price of $0.35 per share. Of the approximately 72.9 million shares of Common Stock, approximately 26.3 million shares were issued on March 1, 2013. The remaining 46.6 million shares were issued immediately upon stockholder approval of an amendment to the Company’s Restated Certificate of Incorporation increasing in the Company’s total authorized Common Stock from 30 million to 150 million shares on April 18, 2013 and the filing of such amendment with the Delaware Secretary of State on the same day. The amendment to the Company’s Restated Certificate of Incorporation increasing the Common shares was previously adopted by Salon’s Board on February 1, 2013.
Following the above transactions and the 20:1 reverse stock split of November 15, 2006, the conversion rate and Common equivalent shares of Salon’s Preferred Stock is as follows as of March 31, 2016:
|
Per share |
Common |
|||||||||||||||||
|
Shares |
Purchase |
Conversion |
Equivalent |
|||||||||||||||
|
Preferred Stock |
Outstanding |
Price |
Rate |
Shares |
||||||||||||||
|
Series C |
1,075 | $ | 800 | 0.785 | 1,096,676 | |||||||||||||
|
Total |
1,075 | 1,096,676 | ||||||||||||||||
The Series C Preferred Stock conversion rate is subject to a downward adjustment anti-dilution provision under certain circumstances related to subsequent Salon stock issuances. As of March 31, 2016, no dividend has been declared to the holders of Preferred Stock.
If, after initial preferential liquidation payments to the holders of Series C Preferred Stock, any assets remain available for distribution, such assets are to be distributed ratably among the holders of Common Stock and Preferred Stock, based on the shares of Common Stock then held by them and issuable upon conversion of the shares of Preferred Stock then held by them, until aggregate distributions per share reach $2,400 for the holders of Series C Preferred Stock. Salon has currently outstanding 1,075 shares of Series C Preferred Stock.
SALON MEDIA GROUP, INC.
NOTES TO FINANCIAL STATEMENTS
(amounts in thousands, except share and per share data)
If, after payment has been made to the holders of Common Stock and holders of Preferred Stock mentioned above, any assets remain available for distribution, such assets are to be distributed ratably among the holders of Common Stock and the holders of Series C Preferred Stock, based on the number of shares of Common Stock then held by them and issuable upon conversion of the Series C Preferred Stock then held by them. Based on available information, Salon estimates that the Series C Preferred Stock would account for approximately 1% of outstanding shares on an as converted basis.
The holders of Preferred Stock are entitled to vote together with the holders of Salon’s Common Stock as though part of that class, and are entitled to vote on all matters and to that number of votes equal to the largest number of whole shares of Common Stock into which the shares of Preferred Stock could be converted. Preferred stockholders as a group own approximately 6% of the outstanding shares of Common Stock and Common Stock issuable upon conversion of the shares of Preferred Stock, all with voting rights.
The aggregate liquidation preferences of all Preferred Stock holders shall include a set price for each share plus an amount equal to all accumulated and accrued dividends, whether or not declared.
Neither the Series C Preferred Stock nor the underlying shares of Common Stock have been registered for sale under the Securities Act of 1933, as amended, and may not be offered or sold in the United States absent registration under such act or an applicable exemption from registration requirements.
Note 11. Subsequent Events
Effective as of May 23, 2016, the Company appointed Jordan Hoffner, 46, as its Chief Executive Officer, replacing Cynthia Jeffers who has been Chief Executive Officer since 2012. Mr. Hoffner was most recently Chief Executive Officer of Federated Media, a subsidiary of Media General (NYSE MEG). Prior to joining Federated Media in 2014, Mr. Hoffner was President, Digital, of digital entertainment content studio, Electus LLC, a subsidiary of IAC Corp (Nasdaq IACI). Prior to Electus, Mr. Hoffner was Director, Partnerships at Youtube, a subsidiary of Google (Nasdaq GOOG), from 2006 to 2009. Prior to Youtube, Mr. Hoffner worked at NBC in various capacities including writer, television producer and business development executive from 1994 to 2006.
Effective as of June 8, 2016, Dave Daley has resigned from his position as Editor-in-Chief. We have initiated the process of searching for his successor.
Subsequent to year end, the Company has received $350 in unsecured, interest-free cash advances from the Company’s Chairman. This debt is exchangeable into securities to be issued in the next financing raised by the Company from non-related parties.
ITEM 9. Changes in and Disagreements with Accountants on Accounting and Financial Disclosures
None.
ITEM 9A. Controls and Procedures
Disclosure Controls and Procedures
Our management, with the participation of our Chief Executive Officer and Chief Financial Officer, conducted an evaluation of the effectiveness of our disclosure controls and procedures as of the end of the period covered by this Annual Report (March 31, 2016), as is defined in Rule 13a-15(e) promulgated under the Securities Exchange Act of 1934, as amended. Our disclosure controls and procedures are intended to ensure that the information we are required to disclose in the reports that we file or submit under the Securities Exchange Act of 1934 is (i) recorded, processed, summarized and reported within the time periods specified in the Securities and Exchange Commission's rules and forms and (ii) accumulated and communicated to our management, including the Chief Executive Officer and Chief Financial Officer, as the principal executive and financial officers, respectively, to allow timely decisions regarding required disclosures.
Based on that evaluation, our Chief Executive Officer and Chief Financial Officer concluded that, as of the end of the period covered by this Annual Report, our disclosure controls and procedures were effective.
Our management has concluded that the financial statements included in this Form 10-K present fairly, in all material respects our financial position, results of operations and cash flows for the periods presented in conformity with generally accepted accounting principles.
It should be noted that any system of controls, however well designed and operated, can provide only reasonable, and not absolute, assurance that the objectives of the system will be met. In addition, the design of any control system is based in part upon certain assumptions about the likelihood of future events.
Management’s Annual Report on Internal Control Over Financial Reporting
Our management is responsible for establishing and maintaining adequate internal control over financial reporting, as defined in Exchange Act Rule 13a-15(f). Our internal control over financial reporting is designed to provide reasonable assurance regarding the reliability of financial reporting and the preparation of financial statements for external purposes in accordance with generally accepted accounting principles.
Under the supervision and with the participation of our management, including our Chief Executive Officer and Chief Financial Officer, we conducted an evaluation of the effectiveness of our internal control over financial reporting based on the guidelines as set forth in Securities and Exchange Commission Release no. 33-8810, Commission Guidance Regarding Management’s Report on Internal Control Over Financial Reporting Under Section 13(a) or 15(d) of the Securities Exchange Act of 1934. Based on our evaluation, our management concluded that our internal control over financial reporting was effective as of March 31, 2016.
This annual report does not include an audit or attestation report of our registered public accounting firm regarding our internal control over financial reporting. Our management’s report was not subject to audit or attestation by our registered public accounting firm pursuant to rules of the SEC that permit us to provide only management’s report in this annual report.
Because of its inherent limitations, internal control over financial reporting may not prevent or detect misstatements. It should be noted that any system of controls, however well designed and operated, can provide only reasonable, and not absolute, assurance that the objectives of the system will be met. In addition, the design of any control system is based in part upon certain assumptions about the likelihood of future events. Also, projections of any evaluation of effectiveness to future periods are subject to the risk that controls may become inadequate because of changes in conditions, or that the degree of compliance with the policies or procedures may deteriorate.
Changes in Internal Control Over Financial Reporting
During the most recent fiscal quarter, there have not been any significant changes in our internal controls over financial reporting or in other factors that have materially affected, or are reasonably likely to materially affect, our internal controls over financial reporting.
ITEM 9B. Other Information
None.
PART III
ITEM 10. Directors, Executive Officers and Corporate Governance
Salon’s executive officers and directors as of June 1, 2016 are as follows:
|
Name |
Age |
Position | ||
|
Jordan Hoffner |
46 |
Chief Executive Officer and Director | ||
|
Elizabeth Hambrecht(4) |
52 |
Chief Financial Officer | ||
|
David Daley |
45 |
Editor-in-Chief | ||
|
Matthew Sussberg |
39 |
Vice President Sales | ||
|
Deepak Desai (1,3) |
57 |
Director | ||
|
William Hambrecht |
80 |
Director | ||
|
George Hirsch(1) |
81 |
Director | ||
|
James Rosenfield (2) |
86 |
Director | ||
|
John Warnock(2) |
75 |
Chairman of the Board and Director |
|
(1) |
Member of Audit Committee |
|
(2) |
Member of Compensation Committee |
|
(3) |
Audit Committee financial expert |
|
(4) |
Elizabeth is the daughter of William Hambrecht |
Jordan Hoffner was appointed Chief Executive Officer effective May 23, 2016. Mr. Hoffner is a 25-year media industry veteran and pioneer in digital media who was most recently Chief Executive Officer of Federated Media, a subsidiary of Media General (NYSE MEG). Prior to joining Federated Media in 2014, Mr. Hoffner was President, Digital, of entertainment content studio Electus LLC, a subsidiary of IAC Corp (Nasdaq IACI). Prior to Electus, from 2006 to 2009, Mr. Hoffner was Director, Partnerships at YouTube, a subsidiary of Google (Nasdaq GOOG). Prior to Youtube, Mr. Hoffner worked at NBC in various capacities including writer, producer, business development executive and general manager from 1994 to 2006.
Elizabeth Hambrecht was appointed Chief Financial Officer on November 11, 2014. Since July 2, 2013, Ms. Hambrecht served as our Interim Chief Financial Officer and Corporate Secretary. Ms. Hambrecht previously served as a director of the Company from 2003 to 2012, as well as Chief Executive Officer from September 2008 until May 2009. She also previously served as the Company’s Chief Executive Officer from February 2005 until September 2007 and was the Company’s President from October 2003 until September 2007. From May 2003 through February 2005 she also served as the Company’s Chief Financial Officer and Secretary. From 1999 to March 2003, she was co-founder and Director of Asiacontent.com, an online media company focused on Asian markets. From 1997 to 2000 she was co-founder, Chief Financial Officer and Director of Boom.com, a Hong Kong-based online stock trading company. From 1992 to 1995 she was Executive Director at Goldman Sachs (Hong Kong) Ltd. From 1987 to 1992 she was Assistant Director at Barings Securities (Hong Kong) Ltd. Ms. Hambrecht holds a B.A. in History from Vassar College. She currently is a member of the Board of Trustees of the San Francisco Friends School and has previously been a member of the Board of Trustees for KQED, a public broadcast company for Northern California.
David Daley was appointed Editor-in-Chief on August 15, 2013. Mr. Daley began his employment with the Company in July 2011 as Senior Culture Editor, was promoted in March 2012 to Executive Editor, and on June 5, 2013, became Interim Editor-In-Chief. He previously served for five years at the Louisville Courier-Journal as both the Lifestyles Manager and Editor-In-Chief of the weekly Velocity newspaper. Prior to the Louisville Courier-Journal, Mr. Daley served as Features Editor for one year at Details Magazine, and as Politics/Culture Reporter and Arts Editor at the Hartford Courant and (Westchester, NY) Journal News. Mr. Daley’s holds a Master’s degree in Journalism from the University of North Carolina at Chapel Hill and a Bachelor’s degree in Political Science from Boston College.
Matthew Sussberg was appointed Vice President Sales in April 2012. He joined Salon from Us Weekly, a division of Wenner Media, where he served as Digital Advertising Manager from March 2010 through April 2012. Mr. Sussberg also served as a Senior Account Director at The Huffington Post from February 2006 through March 2010, where he helped grow annual sales. Mr. Sussberg holds a B.A. from the University of Wisconsin.
Deepak Desai has served as a Director of Salon since September 2004. He is currently Founder and Chief Executive Officer at Ardor Learning, which he founded in December 2014. Mr. Desai served as the Chief Strategy Officer at Universal HealthCare Group Inc, from May 2011 to February 2013. Mr. Desai joined GlobalEnglish Corporation in June 2002 as its Chief Financial Officer and from December 2005 to January 2011 he served as its President and Chief Executive Officer. From August 1999 to June 2001, Mr. Desai was the Chief Financial Officer of Asiacontent.com Ltd. From July 1987 to July 1999, Mr. Desai held various positions with Time Warner, Inc., including General Manager and Chief Financial Officer with Time Life Asia, Associate Business Manager, Financial Manager and Assistant Business Manager with Time Inc. and Senior Auditor with Time Warner Inc. Mr. Desai is a Certified Public Accountant, received a Bachelor of Commerce in Accounting from the University of Mumbai, India and an M.B.A. with a Finance emphasis from the Wharton School of Business of the University of Pennsylvania.
William Hambrecht has served as a Director of Salon since February 2012. Mr. Hambrecht founded the San Francisco-based financial services firm WR Hambrecht + Co in 1998. Prior to WR Hambrecht + Co, he co-founded and led Hambrecht & Quist, which specialized in investing in Silicon Valley companies. Mr. Hambrecht has served as a director for numerous private and public corporations. He is also the Founder of the United Football League, a new professional outdoor football league, which premiered in October 2009. In October 2006, Mr. Hambrecht was inducted into the American Academy of Arts and Sciences. He also was appointed to the board of the Presidio Trust by President Barack Obama in 2010. Mr. Hambrecht graduated from Princeton University in 1957.
George Hirsch has served as a Director of Salon since April 2003. Mr. Hirsch is the Chairman of the Board of the New York Road Runners. From 1978 to 1987, he was the founding publisher and president of The Runner magazine at which time it was merged into Runner's World. From 1987 until his retirement in 2004, he held various positions with Rodale, Inc., including Worldwide Publisher of Runner’s World, Publishing Director of Men’s Health, and Director of International Magazines. In 1973, he was founding publisher of New Times magazine and served as its President through 1979. In 1967, he was the founding publisher of New York magazine and served as its President through 1971. From 1962 through 1967, he held various positions with Time Inc. Mr. Hirsch holds a M.B.A. from the Harvard University and a B.A. in History from Princeton University.
James H. Rosenfield has served as a Director of Salon since April 1998. Mr. Rosenfield has been the President of JHR & Associates, a media-consulting firm, since 1998. From 1994 to 1998, Mr. Rosenfield was Managing Director at the investment-banking firm of Veronis Suhler & Associates. From 1987 to 1994, he was Chairman and Chief Executive Officer of John Blair Communications, Inc., a television sales and syndication company. From 1965 to 1985, Mr. Rosenfield held various executive positions at CBS Corporation, a television broadcasting and media company, including Executive Vice President of the Broadcast Group. Mr. Rosenfield holds a B.A. in English from Dartmouth College.
John Warnock has served as a Director of Salon since August 2001 and was appointed Chairman of the Board in December 2006. He was a founder of Adobe Systems and has been its Chairman of the Board since April 1989. Since September 1997, he has shared the position of Adobe Chairman of the Board with Charles M. Geschke. Dr. Warnock served as Chief Executive Officer of Adobe from 1982 through December 2000. Dr. Warnock received a Ph.D. in Electrical Engineering from the University of Utah. Mr. Warnock served as a Director for Knight Ridder, Inc., a publisher of news and information in digital and hard copy formats, until its sale in June 2006.
Code of Conduct
Salon has adopted a Code of Conduct and Policy Regarding Reporting of Possible Violations (the “Code of Conduct”). The Code of Conduct can be found at Salon’s Website at www.salon.com/about/ir.
Section 16(a) Beneficial Ownership Reporting Compliance
Section 16(a) of the Securities Exchange Act of 1934 requires the Company’s executive officers, directors and persons who beneficially own more than 10% of the Company’s Common Stock to file initial reports of ownership and reports of changes in ownership with the Securities and Exchange Commission (“SEC”). Such persons are required by SEC regulations to furnish the Company with copies of all Section 16(a) forms filed by such persons.
Based solely on Salon’s review of such forms furnished to us and written representations from certain reporting persons, we believe that all filing requirements applicable to our executive officers, directors and more than 10% stockholders were complied with.
Audit Committee
The Audit Committee reviews, acts on and reports to the Board of Directors with respect to various auditing and accounting matters, including the adequacy of the Company’s financial reporting and disclosure controls and processes, the adequacy of the Company’s internal control policies, the selection of the Company’s independent registered public accounting firm, the scope of the annual audits, fees to be paid to the Company’s independent registered public accounting firm, the performance of the Company’s independent registered public accounting firm and the accounting practices of the Company. The Audit Committee operates under a charter that is available on our website at www.salon.com/about/ir.
During the fiscal year ended March 31, 2016, the members of our Audit Committee were Messrs. Hirsch and Desai, both of whom the Board has determined are independent directors. The Board has further determined that Mr. Desai is an audit committee financial expert within the meaning of applicable SEC rules; it based this determination on Mr. Desai’s education and experience.
ITEM 11. Executive Compensation
Executive Compensation
The following table shows, for the fiscal year ended March 31, 2016, the compensation of Salon’s (i) principal executive officer; (ii) principal financial officer; and (iii) the two most highly compensated executive officers, collectively the “Named Executive Officers”:
Summary Compensation Table
|
Non-Equity |
|||||||||||||||||||||
|
Option |
Incentive Plan |
||||||||||||||||||||
|
Name and Principal Position |
Year |
Salary ($) |
Bonus ($) |
Awards ($) (1) |
Compensation ($) |
Total ($) |
|||||||||||||||
|
Cynthia Jeffers (2) |
2016 |
225,000 | 137,000 | 102,796 | - | 464,796 | |||||||||||||||
|
Former Chief Executive Officer |
2015 |
225,000 | - | 170,752 | - | 395,752 | |||||||||||||||
|
Elizabeth Hambrecht (3) |
2016 |
100,720 | - | 77,590 | - | 178,311 | |||||||||||||||
|
Chief Financial Officer |
2015 |
100,720 | - | 41,368 | - | 142,088 | |||||||||||||||
|
David Daley (4) |
2016 |
155,000 | - | 19,549 | - | 174,549 | |||||||||||||||
|
Former Editor-in-Chief |
2015 |
150,120 | - | 6,608 | - | 156,728 | |||||||||||||||
|
Matthew Sussberg (5) |
2016 |
215,000 | 119,501 | 2,049 | - | 336,550 | |||||||||||||||
|
Vice President Sales |
2015 |
215,317 | 56,680 | 1,229 | - | 273,226 | |||||||||||||||
|
1. |
The amounts shown are the compensation costs recognized by Salon in fiscal years 2016 and 2015 for options awards, as determined pursuant to ASC 718 Compensation – Stock Compensation, excluding any estimates of future forfeitures. For a discussion of the assumptions used to calculate the value of the option awards, see Note 7 of the Notes to the Financial Statements. |
|
2. |
Ms. Jeffers was appointed Chief Executive Officer effective May 29, 2012 at a base annual salary of $225,000. |
|
3. |
Ms. Hambrecht was appointed Chief Financial Officer on November 11, 2014. Since July 2, 2013, Ms. Hambrecht has served as Interim Chief Financial Officer. Ms. Hambrecht has an annual salary of $100,000. |
|
4. |
Mr. Daley was appointed Editor-in-Chief on August 15, 2013 with an annual salary of $150,000. |
|
5. |
Mr. Sussberg was appointed Vice President of Sales in April 2012 with a base annual salary of $215,000. |
Grants of Plan-Based Awards in Fiscal Year 2016
No equity awards were granted during the 2016 fiscal year to the Named Executive Officers.
Outstanding Equity Awards at Fiscal 2016 Year-End
The following table sets forth the outstanding equity awards for each Named Executive Officer as of March 31, 2016.
OUTSTANDING EQUITY AWARDS AT FISCAL YEAR END
|
Option Awards | ||||||||||||||||||
|
Equity Incentive |
||||||||||||||||||
|
Number of |
Number of |
Plan Awards: |
||||||||||||||||
|
Securities |
Securities |
Number of |
||||||||||||||||
|
Underlying |
Underlying |
Securities |
||||||||||||||||
|
Unexercised |
Unexercised |
Underlying |
Option |
Option |
||||||||||||||
|
Options |
Options |
Unexercised |
Exercise |
Expiration |
||||||||||||||
|
Name |
Exercisable |
Unexercisable |
Unearned Options |
Price ($) |
Date |
|||||||||||||
|
Cynthia Jeffers (1) |
1,056,478 | - | 0.01 |
07/25/2022 |
||||||||||||||
| 2,805,186 | 165,011 | 0.13 |
07/02/2023 |
|||||||||||||||
| 50,000 | 100,000 | 0.24 |
11/07/2024 |
|||||||||||||||
|
Elizabeth Hambrecht (2) |
5,192 | 4,778 | 0.20 |
02/11/2024 |
||||||||||||||
| 523,333 | 386,667 | 0.24 |
11/07/2024 |
|||||||||||||||
|
David Daley |
6,900 | - | 1 | 0.45 |
10/20/2021 |
|||||||||||||
| 10,000 | - | 0.05 |
02/09/2022 |
|||||||||||||||
| 8,125 | 1,875 | 0.06 |
12/20/2022 |
|||||||||||||||
| 116,666 | 233,334 | 0.24 |
11/07/2024 |
|||||||||||||||
|
Matthew Sussberg |
233,333 | 29,167 | 0.01 |
07/25/2022 |
||||||||||||||
| 7,166 | 14,334 | 0.24 |
11/07/2024 |
|||||||||||||||
|
(1) |
Ms. Jeffers was granted an option to purchase up to 1,056,478 shares of the Company’s Common Stock on July 25, 2012, which vests as follows: 1/24 of 528,239 of the option shares vest monthly and, simultaneously, 1/36 of 528,239 of the option shares vest monthly, subject, in each case, to Ms. Jeffers’ continuous employment. Ms. Jeffers was also granted an option to purchase 2,970,197 shares of the Company’s Common Stock on July 2, 2013, which vests as follows: 1/24 of 1,485,099 of the option shares vest monthly and, simultaneously, 1/36 of 1,485,098 of the option shares vest monthly, subject, in each case, to Ms. Jeffers’ continuous employment services. In addition, Ms. Jeffers was granted an option to purchase 150,000 shares of Company’s Common Stock on November 7, 2014, which vests as follows: 1/4 of 150,000 of the option shares vest one year after grant date and 1/36 of 150,000 of the option shares vest monthly, subject , in each case, to Ms. Jeffers’ continuous employment services. At the end of each quarter in which the Company reaches a cash flow surplus, Ms. Jeffers will also be entitled to receive an additional stock option to purchase up to 105,648 shares of the Company’s Common Stock, which additional stock options, in each case, will be fully vested on the date of grant and will have an exercise price per share equal to the fair market value of the Company’s Common Stock as of the date of grant. |
|
(2) |
Ms. Hambrecht was granted an option to purchase 330,000 shares of Company’s Common Stock on November 7, 2014, which vests as follows: 1/12 of 330,000 of the option shares vest monthly, subject to Ms. Hambrecht’s continuous employment. Upon termination of service, all 330,000 option shares will immediately vest. Ms. Hambrecht was also granted an option to purchase 580,000 shares of Company’s Common Stock on November 7, 2014, which vests as follows: 1/4 of 580,000 of the option shares vest one year after grant date and 1/36 of 580,000 of the option shares vest monthly, subject, in each case, to Ms. Hambrecht’s continuous employment services. |
Option Exercises during Fiscal Year 2016
During the year ended March 31, 2016, no stock options were exercised.
401(k) Savings Plan and Other Benefits
Salon has a 401(k) savings plan for its employees that allows for matching contributions and profit sharing. Due to limited cash, Salon has never made matching or profit sharing contributions and has no intention to do so in the 2017 fiscal year. Salon does not have a deferred compensation plan for any employee. None of Salon’s executive officers is covered by a pension plan or other similar benefit plan that provides for payments or other benefits at, following, or in conjunction with retirement.
Nonqualified Deferred Compensation
Salon does not have any nonqualified deferred compensation plan.
Potential Payments Upon Termination or Change in Control
Salon’s employment agreement with Ms. Jeffers provides for certain benefits in the event of a termination of service following a change in control of Salon. Under the agreement, Ms. Jeffers may be terminated with or without cause, provided that, except in the case of death or disability, if Ms. Jeffers is terminated by the Company without cause, or if Ms. Jeffers terminates her employment arrangement for good reason (each defined in the employment agreement), and provided that Ms. Jeffers executes and delivers a full general release of all known and unknown claims, Ms. Jeffers will be entitled to a severance payment in an amount equal to two months of her then current base salary; and, if Ms. Jeffers is covered under the Company’s group health plan at the time of such a termination, the Company will reimburse her for any COBRA premiums thereafter paid, subject to certain limitations.
Compensation of Directors
The following table details the total compensation paid to Salon’s non-employee directors for its 2016 fiscal year. The amounts shown are the compensation costs recognized by Salon in fiscal year 2016 for option awards, as determined pursuant to ASC 718, excluding any estimates of future forfeitures. For a discussion of the assumptions used to calculate the value of the option awards, see Note 7 of Notes to the Financial Statements.
|
Fees Earned |
||||||||||||
|
or Paid in |
Option |
|||||||||||
|
Name |
Cash |
Awards (1,2) |
Total |
|||||||||
|
Deepak Desai |
- | $ | 14,229 | $ | 14,229 | |||||||
|
William Hambrecht |
- | $ | 14,229 | $ | 14,229 | |||||||
|
George Hirsch |
- | $ | 14,229 | $ | 14,229 | |||||||
|
James Rosenfield |
- | $ | 14,229 | $ | 14,229 | |||||||
|
John Warnock |
- | $ | 14,229 | $ | 14,229 | |||||||
|
(1) |
On November 7, 2014, each Director received an option to purchase 100,000 shares of Common Stock. The grant date fair value of each stock option award was $24,000. The exercise price per share for the grants to all of the Directors was $0.24. Each stock option grant vests over a twelve month period and will immediately vest if Director leaves the company prior to end of such period. |
|
(2) |
On February 11, 2014, each Director received an option to purchase 10,000 shares of Common Stock. The grant date fair value of each stock option award was $2,000. The exercise price per share for the grants to all of the Directors was $0.20. Each stock option grant is subject to a standard vesting over a forty-eight month period. |
Compensation Committee Interlocks and Insider Participation
None of Salon’s executive officers has served as a member of the compensation committee or board of directors of any other entity that has an executive officer serving as a member of Salon’s Board of Directors.
Compensation Discussion and Analysis
The Compensation Committee has responsibility for setting the overall compensation strategy for Salon and aligning it to Salon’s business goals. This includes determining the compensation of the Chief Executive Officer and other Named Executive Officers and ensuring that Salon’s compensation program is fair, reasonable and competitive. The Compensation Committee makes recommendations to the Board on equity compensation with the Board having ultimate authority in making equity grants.
Objectives and Challenges of Salon’s Compensation Program
Salon’s executive compensation program is designed to attract, retain and motivate outstanding executive officers capable of leading Salon to fulfill its business objectives, and to establish an appropriate link between executive compensation and achievement of Salon’s strategic and financial performance goals that include attaining profitability, generating sufficient cash to fund operations, and ultimately, enhancing stockholder value.
Cash constraints have hampered Salon in attracting new executives. Due to insufficient cash, Salon has only been able to offer its Chief Executive Officer, its Editor-in-Chief, and its Chief Financial Officer only a competitive base annual salary and until this past fiscal year, has not been able to implement a non-equity incentive compensation plan, or award meaningful annual cash bonuses to these executives. As a consequence, Salon has had to rely on stock option and restricted stock awards in lieu of cash compensation for these officers. Salon has also had to rely on offering substantial equity awards to entice prospective new executives to join Salon. Besides cash constraints, Salon faces challenges in hiring and retaining executives due to a relatively small pool of available executive talent in its industry, and because it competes with more established media companies and better funded upstarts. Salon has experienced difficulties in finding and retaining suitable executives to lead its sales and technology efforts, positions in high demand. As Salon’s brand recognition has increased, so has the demand for its trained talent.
Role of Compensation Committee and Outside Consultants
The Compensation Committee of the Board of Directors oversees and administers Salon’s executive compensation program in accordance with the Compensation Committee Charter. The Compensation Committee meets on an as-needed basis to: (1) adjust and review executive salaries; (2) award executive bonuses; (3) approve offers to prospective new executive officers; (4) recommend equity grants for executive officers to the Board of Directors; and (5) set non-equity incentive compensation for other key management employees, in conjunction and based upon the recommendation of the executive team. Due to budgetary constraints, Salon has not utilized the services of outside compensation consultants. Once Salon’s operations generate sufficient cash to meet operating needs, the Compensation Committee may retain the services of outside consultants to review executive salaries for appropriateness and to formulate incentive plans for the Named Executive Officers.
Elements of Compensation
Salon provides its executive officers with a compensation package consisting of base salary, commissions for its sales executives, and benefit plan participation generally available to other employees. Beginning in fiscal year 2009, bonus plans were generally offered to named executives. In setting total compensation, the Compensation Committee considers individual and company performance, as well as current and projected cash balances. In determining the compensation for an executive who has been with Salon for a substantial amount of time, the Compensation Committee will consider what it might cost to hire that executive’s replacement, the effect on attaining revenue and profitability goals, and the effect on the well-being of Salon’s Website.
Base Salary. Salaries for Salon’s executive officers are initially set based on negotiation with the individual executive officers at the time of recruitment and with reference to salaries for comparable positions in the industry for individuals of similar education and background. Salon also considers the individual’s experience, reputation in his or her industry and expected contributions to Salon. Base salary is continuously evaluated to ensure it is competitive and may be adjusted from time to time if Salon believes that it is no longer competitive, to match changes to an individual’s job performance or duties, or to retain an executive. Cost of living salary adjustments may also be granted to executive officers on an ad hoc basis. In each case, Salon takes into account the results achieved by the executive, his or her future potential, scope of responsibilities and experience, competitive salary practices, the potential impediment in reaching profitability if the executive were to leave Salon, and cash projections. Salon has not utilized benchmarks or compensation studies in determining salary levels, but may do so in the future.
Bonuses and Non-Equity Incentive Plan Compensation. Certain named executives are eligible for a cash bonus. Due to limited cash, historically no meaningful cash bonuses have been granted in the past to Salon’s Chief Executive Officer, Chief Financial Officer, or Editor-in-Chief. In fiscal year 2014, because the Company achieved specified revenue targets, we paid cash bonuses of $100,000 to Ms. Jeffers, the Company’s Chief Executive Officer and $119,759 to Mr. Sussberg, the Company’s Vice President Sales. Mr. Daley did not receive a cash bonus. In fiscal year 2015, we paid a cash bonus of $56,680 to Mr. Sussberg. In fiscal year 2016, we paid a cash bonus of $137,000 to Ms. Jeffers and $119,501 to Mr. Sussberg.
In order to align corporate goals and provide incentives for its named executive officers, it is anticipated that the Compensation Committee will approve bonus plans for fiscal year 2017 consistent with those implemented in fiscal year 2016, which will specify operating and profitability targets that should increase the enterprise value of the Company.
All bonus plans and non-equity incentive plans are approved by Salon’s Compensation Committee upon consultation with the Chief Executive Officer and Chief Financial Officer.
Stock Options. Salon grants stock options to newly hired executives at the next regularly scheduled meeting of the Board of Directors, and thereafter to align the executives’ interests with those of its stockholders and as incentives to remain with Salon. Salon believes that options to purchase its Common Stock, priced at the market price on the date of grant, are the best tool to motivate executives to build stockholder value. In addition, stock options have been an appealing form of compensation to Salon because they require no cash outlay. However, these grants affect Salon’s results of operations as they require Salon to record non-cash stock-based compensation. As options are not transferable, they have no value to the executive unless the price of the stock increases after the grant. Because these options typically vest over a four-year period, they are an incentive for executives to build Salon’s value over time and encourage executives to remain in the long-term employment with Salon.
The goals of Salon’s option grant guidelines are to ensure that future grants are competitive from a grant value perspective and that option usage is consistent with option pool forecasts.
During fiscal year 2007, the Board of Directors of Salon adopted a policy that options are to be granted only at regularly scheduled meetings of the Board. The proximity of any awards to an earnings announcement or other market events is coincidental. The exercise price of the options is the closing price of Salon’s Common Stock on the date of the grant and the grant date is the date that the Board approves the grant. All new hires are awarded options and Salon’s Compensation Committee makes recommendations to the Board of options grants to be made to executive officers.
The number of stock options Salon granted to executives has varied widely and irregularly. During fiscal year 2016, no options were granted to the Named Executive Officers. During fiscal year 2015, the Board granted options to acquire 150,000 shares to Ms. Jeffers, 910,000 shares to Ms. Hambrecht, 350,000 shares to Mr. Daley and 21,500 shares to Mr. Sussberg. During fiscal year 2014, the Board granted options to acquire 2,970,197 shares to Ms. Jeffers and 9,970 shares to Ms. Hambrecht.
The Salon Media Group, Inc. 2004 Stock Plan expired on November 17, 2014 and no additional options may be issued under this Plan.
Our Board of Directors adopted the 2014 Stock Incentive Plan (the “2014 Plan”) on January 21, 2014 and also approved a resolution on June 12, 2014 to amend the 2014 Plan to comply with certain California Code of Regulations and Internal Revenue Service regulations. The 2014 Plan provides for the grant of incentive stock options to our employees and any parent and subsidiary corporations’ employees, and for the grant of non-qualified stock options, stock appreciation rights, restricted stock, restricted stock units and dividend equivalent rights to our employees, directors and consultants and our parent and subsidiary corporations’ employees, directors and consultants. As of March 31, 2016, Salon’s 2014 Plan allows for the future granting of approximately 8,447,000 shares of Common Stock.
Restricted Stock. The Company’s 2014 Plan allows for the grant of restricted stock awards. It is contemplated that such awards will vest over a period of four years and be subject to accelerated vesting in the event that the holder is terminated for reasons other than cause, or if a change in control event were to occur. Salon feels that the issuance of restricted stock will be a valuable incentive tool for its executives as this type of equity award will have immediate value upon vesting with no cash outlay by the Company.
There was no issuance of restricted stock during fiscal year ended March 31, 2016.
Perquisites. Salon does not offer any perquisites to its executive officers.
Retirement and Other Benefits. Salon has a 401(k) savings plan for its employees that allows for matching contributions and profit sharing. Due to limited cash, Salon has never made matching or profit sharing contributions and has no intention to do so in the 2016 fiscal year. Salon does not have a deferred compensation plan for any employee.
Named Executive Officer Cash Compensation
Cynthia Jeffers, who served as former Chief Executive Officer from May 30, 2012 until replaced by Mr. Jordan Hoffner effective May 23, 2016, is entitled to a base salary of $225,000 per annum. Prior to her appointment, Ms. Jeffers was serving as Chief Technology Officer at a base salary of $200,000 per annum. As described above, Ms. Jeffers received a $137,000 cash bonus in fiscal year 2016.
Elizabeth Hambrecht, who was appointed Chief Financial Officer on November 11, 2014, is entitled to a base salary of $100,000 per annum. Prior to her appointment, Ms. Hambrecht served as Interim Chief Financial Officer and Secretary since July 2, 2013.
David Daley, who was promoted to Editor-in-Chief in August 2013, has a base salary of $150,000 per annum.
Matthew Sussberg joined Salon in April 2012, as Vice President Sales, has a base annual salary of $215,000 per annum. As described above, Mr. Sussberg received a cash bonus of $119,501 in fiscal year 2016.
Deductibility of Executive Compensation
Section 162(m) of the Internal Revenue Code limits deductions for executive compensation in excess of $1 million except for certain compensation which qualifies for a performance-based exception. Certain types of compensation in excess of $1 million are deductible by a company if performance criteria are specified in detail and are contingent on stockholder approval of the compensation arrangement. As Salon has been unable to award bonuses and other forms of non-equity incentive compensation to any of its Named Executive Officers due to limited cash, the $1 million limitation has not been a factor for Salon. In the future, Salon and the Compensation Committee will endeavor to structure executive compensation plans to achieve maximum deductibility under Section 162(m) with minimal effects on flexibility and corporate objectives.
Accounting for Stock-Based Compensation
Salon has expensed stock option grants and restricted stock under ASC 718 which requires companies to include the fair value of equity compensation as a compensation expense in their income statements.
COMPENSATION COMMITTEE REPORT
The Compensation Committee of Salon has reviewed and discussed the Compensation Discussion and Analysis required by Item 402(b) of Regulation S-K with management and, based on such review and discussions, the Compensation Committee recommended to the Board that the Compensation Discussion and Analysis be included in this Annual Report on Form 10-K.
THE COMPENSATION COMMITTEE
James Rosenfield
John Warnock
ITEM 12. Security Ownership of Certain Beneficial Owners and Management and Related Stockholder Matters
Equity Compensation Plan Information
Information regarding Equity Compensation Plans may be found in Part II, Item 5, commencing on page 22 of this Annual Report on Form 10-K.
Security Ownership of Certain Beneficial Owners and Management
The following table sets forth information regarding the beneficial ownership of Common Stock and Common Stock equivalents of Salon as of June 1, 2016 (a) by each stockholder who is known by Salon to be the beneficial owner of more than 5% of the outstanding Common Stock and Common Stock equivalents or the combined total voting power of all classes of capital stock of Salon on a fully diluted, as converted basis, (b) by each director and nominee, (c) each executive officer named in the Summary Compensation Table, and (d) by all executive officers and directors of Salon as a group.
|
Amount and |
||||||||
|
Nature of |
||||||||
|
Beneficial |
Percent |
|||||||
|
Name and Address of Beneficial Owner (1) |
Ownership (2) |
of Class (3) |
||||||
|
Shea Ventures LLC (4) |
4,474,597 | 5.80 | % | |||||
|
Executive Officers and Directors |
||||||||
|
John Warnock (5) |
35,047,281 | 45.90 | % | |||||
|
William R. Hambrecht (6) |
27,598,773 | 36.15 | % | |||||
|
Cynthia Jeffers (7) |
4,089,174 | 5.09 | % | |||||
|
Elizabeth Hambrecht (8) |
2,543,009 | 3.31 | % | |||||
|
Matthew Sussberg (9) |
358,958 | 0.47 | % | |||||
|
David Daley (10) |
171,690 | 0.22 | % | |||||
|
George Hirsch (11) |
120,273 | 0.16 | % | |||||
|
James Rosenfield (12) |
119,541 | 0.16 | % | |||||
|
Deepak Desai (13) |
119,541 | 0.16 | % | |||||
|
All executive officers and directors as a group (9 persons) |
70,168,240 | 85.64 | % | |||||
|
(1) |
The address for all beneficial owners is c/o Salon Media Group, Inc., 870 Market Street, San Francisco, CA 94102. |
|
(2) |
Unless otherwise noted, the persons named in the table above have sole voting and investment power with respect to all shares of Common Stock and Common Stock equivalents shown as beneficially owned by them, subject to community property laws where applicable and to the information contained in the footnotes to this table. |
|
(3) |
Calculated on the basis of 76,245,442 shares of Common Stock outstanding as of June 1, 2016, shares of Common Stock underlying options exercisable within 60 days of June 1, 2016 and shares of Common Stock that a stockholder has the right to acquire upon conversion of shares of Series C Preferred Stock. |
|
(4) |
Consists of 3,632,962 shares of Common Stock held by the stockholder and 841,635 shares of Common Stock that the stockholder has the right to acquire upon conversion of 825 shares of Series C Preferred Stock. Includes 2,103,126 shares of Common Stock of two trusts, as well as 130,581 shares of Common Stock that one trust has the right to acquire upon conversion of 128 shares of Series C Preferred Stock. Edmund Shea is the Manager of the stockholders and a Trustee of the trusts, and is also a Director of Ironstone Group, Inc. described in footnote (6). |
|
(5) |
Consists of 34,931,240 shares of Common Stock held by the Chairman of the Board of Salon. Includes 116,041 shares subject to options that may be exercised within 60 days of June 1, 2016. |
|
(6) |
Mr. Hambrecht has an ownership interest in WR Hambrecht + Co., LLC and WR Hambrecht + Co., Inc. (together the “Hambrecht Entities”) and is the Chairman and Chief Executive Officer of those entities. The Hambrecht Entities own 27,492,732 shares of Common Stock. Elizabeth Hambrecht, Chief Financial Officer, has a pecuniary ownership interest in the Hambrecht Entities. Mr. Hambrecht individually owns 27,492,732 shares of Common Stock. Includes ownership by The Sarah and William Hambrecht Foundation of 1,136,005 shares of Common Stock. William Hambrecht and Elizabeth Hambrecht are Directors and have voting rights in the Sarah and William Hambrecht Foundation. Includes ownership by HAMCO Capital Corporation, consisting of 527,068 shares of Common Stock. Mr. Hambrecht and Ms. Hambrecht both have an ownership interest in HAMCO Capital. Includes ownership by Ironstone Group, Inc., consisting of 2,006,827 shares of Common Stock. Mr. Hambrecht has an ownership interest in Ironstone Group, Inc. Mr. Hambrecht and Ms. Hambrecht disclaim beneficial ownership of the shares of Salon’s Common Stock held directly by the Hambrecht Entities, HAMCO Capital and Ironstone, other than their proportionate ownership interest. Also includes 106,041 shares subject to options that may be exercised within 60 days of June 1, 2016. |
|
(7) |
Includes 4,089,174 shares subject to options that may be exercised within 60 days of June 1, 2016. |
|
(8) |
Ms. Hambrecht has an ownership interest in the Eu Revocable Trust, consisting of 1,965,320 Common shares and 577,689 shares subject to options that may be exercised within 60 days of June 1, 2016. |
|
(9) |
Consists of 87,500 shares of Common Stock acquired through the exercise of options and 271,458 shares subject to options that may be exercised within 60 days of June 1, 2016. |
|
(10) |
Includes 171,690 shares subject to options that may be exercised within 60 days of June 1, 2016. |
|
(11) |
Consists of 732 shares of Common Stock held by the Director and 119,541 shares subject to options that may be exercised within 60 days of June 1, 2016. |
|
(12) |
Includes 119,541 shares subject to options that may be exercised within 60 days of June 1, 2016. |
|
(13) |
Includes 119,541 shares subject to options that may be exercised within 60 days of June 1, 2016. |
Series C Preferred Stock
The following table sets forth information regarding the beneficial ownership of Salon’s Series C Preferred Stock as of June 1, 2016 by each stockholder who is known by Salon to be the beneficial owner of more than 5% of the outstanding shares of Series C Preferred Stock.
|
Amount and |
||||||||
|
Nature of |
||||||||
|
Beneficial |
Percent |
|||||||
|
Name and Address of Beneficial Owner (1) |
Ownership |
of Class |
||||||
|
Shea Ventures LLC |
697 | 64.8 | % | |||||
|
Wenner Media LLC |
250 | 23.3 | % | |||||
|
E&M RP Trust (Descendant’s Trust u/a Tenth) |
128 | 11.9 | % | |||||
ITEM 13. Certain Relationships and Related Transactions, and Director Independence
In May 2007, Salon entered into a line of credit with Deutsche Bank Securities, Inc. for borrowings of up to $1 million plus accrued interest. This agreement is guaranteed in its entirety by John Warnock, Salon’s Chairman. As of March 31, 2016 and March 31, 2015, the line was fully drawn. Accrued interest thereon is $335,000.
From April 2008 through October 2011 the Company sold $2.6 million of convertible promissory notes. The notes had a four year maturity, bore interest at a fixed rate of 7.5% per annum, payable annually in cash or in kind, and were convertible into Common Stock at the rate of $1.68 per share. Mr. Warnock and Mr. Hambrecht each purchased notes in the amount of $1.6 million. The maturity date was extended to October 31, 2012.
From May 2009 through May 2011, Salon issued to another investor convertible promissory interest notes in exchange for loans with a principal amount of $0.7 million. The notes bore an interest rate of 7.50 percent per annum, payable annually, in cash or in kind, and matured on March 31, 2012 (as extended to October 31, 2012).
For all of the convertible notes described above with original maturity dates of March 31, 2012 and October 31, 2012, the Company and each of the lenders agreed to extend the maturity dates therein to March 31, 2013.
On March 1, 2013, Salon entered into a Purchase Agreement with certain affiliates in connection with the Recapitalization, pursuant to all of Salon’s convertible notes, related party advances and certain accrued consulting fees (aggregating $15.7 million, including interest on the convertible notes through February 28, 2013) and substantially all shares of its convertible Preferred Stock were exchanged for an aggregate of 72.9 million shares of Common Stock at a price of $0.35 per share. Of this 72.9 million shares of Common Stock, 26 million shares were issued on March 1, 2013. The remaining 47 million shares were issued immediately upon stockholder approval of an amendment to the Company’s Restated Certificate of Incorporation increasing in the Company’s total authorized Common shares on April 18, 2013 and the filing of such amendment with the Delaware Secretary of State on the same day. As a result of the Recapitalization, as of March 31, 2013, Salon has no outstanding convertible notes and aggregate advances by Mr. Warnock and Mr. Hambrecht were $7,641,000 and $1,530,000 respectively. Upon the increase in the Company’s authorized shares of Common Stock and the issuance of the remaining 47 million shares to complete the Recapitalization on April 18, 2013, aggregate advances by Mr. Warnock and Mr. Hambrecht were $320,000 and nil.
During fiscal 2016, Mr. Warnock provided working capital in the form of unsecured, interest free cash advances amounting to $2,165,000. As of March 31, 2016, aggregate advances by Mr. Warnock and Mr. Hambrecht were $5,078,000 and $2,913,000, respectively. Salon was advised by Mr. Warnock and Mr. Hambrecht that they executed a stock transaction that has the effect of equalizing their stock ownership and has filed a corresponding Form 8-K with the SEC on November 25, 2015. The respective Form 4 for Mr. Warnock and Mr. Hambrecht was filed with the SEC on November 24, 2015 indicating responsibility for cash advances equal to $2,913,000 was assumed by Mr. Hambrecht.
Subsequent to March 31, 2016, Mr. Warnock provided an additional $350,000 to meet Salon’s working capital requirements. These unsecured, interest-free advances are exchangeable into securities to be issued in the next financing raised by the Company from non-related parties.
Policies with Respect to Review, Approval or Ratification of Transactions with Related Persons
Salon has primarily relied on cash infusion from related persons to meet cash operating needs from the year ended March 31, 2003 through the year ended March 31, 2016. During this period of inadequate cash, the Board of Directors approved related person transactions after full disclosure of the interests of related parties. Subsequent to March 31, 2007, Salon’s Audit Committee separately, or in conjunction with the full Board, excluding those related parties involved in such transactions reviewed, approved and/or ratified all related party transactions, as the Audit Committee is empowered to do under Salon's Audit Committee Charter.
Salon has disclosed in filings with the Securities and Exchange Commission (SEC) all related party transactions. The SEC defines a related party transaction to include any transaction, arrangement or relationship in which Salon is a participant and in which any of the following persons has or will have a direct or indirect material interest:
|
● |
An executive officer, director or director nominee of Salon; |
|
● |
Any person who is known to be the beneficial owner of more than 5% of Salon’s common stock; |
|
● |
Any person who is an immediate family member of an executive officer, director or director nominee of Salon or beneficial owner of more than 5% of Salon’s common stock; |
|
● |
Any firm, corporation or other entity in which any of the foregoing persons is employed or is a partner or principal or in a similar position or in which such person, together with any other of the foregoing, has a 5% or greater beneficial interest. |
ITEM 14. Principal Accountant Fees and Services
Burr Pilger Mayer, Inc. is Salon’s independent registered public accounting firm. The aggregate audit fees billed by Burr Pilger Mayer, Inc. for the year ended March 31, 2015 were approximately $133,000 and for the year ended March 31, 2016 are estimated to be approximately $110,000. In addition, corporate tax filing fees for the year ended March 31, 2015 were approximately $19,000. The aggregate corporate tax filing fees for the year ended March 31, 2016 are estimated to be approximately $9,000. Fiscal year 2009 was the first year Burr Pilger Mayer, Inc. was engaged to perform corporate tax filing services. Except for corporate tax filing services, Burr Pilger Mayer, Inc. did not perform any services for which Salon incurred fees for non-audit related fees, or other fees.
During the year ended March 31, 2016, all audit and tax fees were pre-approved by the Audit Committee. The Audit Committee has adopted a policy that it must pre-approve all fees for audit services, tax services and other services.
PART IV
ITEM 15. Exhibits, Financial Statement Schedules
|
1. |
Financial Statements |
The information concerning Salon’s financial statements and the Report of Burr Pilger Mayer, Inc., Salon’s Independent Auditors required by this item are incorporated by reference herein to the section of this Report in Item 8, entitled “Financial Statements and Supplementary Data.”
|
2. |
Financial Statement Schedules |
None.
|
3. |
Exhibits |
The following Exhibits are filed as part of, or incorporated by reference into, this Report.
|
Exhibit |
|
|
Number |
Description of Document |
|
3.1(1) |
Restated Certificate of Incorporation of the Registrant, filed with the Secretary of State of the Delaware on March 13, 2014 |
|
3.2(2) |
Restated Bylaws of Salon, as amended through March 13, 2014. |
|
10.1(3) |
Salon Media Group, Inc. 2004 Stock Plan. |
|
10.2(3) |
Form of the Salon Media Group, Inc. Notice of Grant of Stock Option and Stock Option Agreement. |
|
10.3(4) |
Employment Agreement with David Talbot dated July 22, 2011. |
|
10.4(5) |
Separation Agreement between Norman Blashka and Salon Media Group, Inc. entered into on June 4, 2012. |
|
10.5(6) |
Employment Agreement with Cynthia Jeffers, dated December 3, 2012. |
|
10.6(7) |
Employment Agreement with Elizabeth Hambrecht, dated July 7, 2013. |
|
10.7(8) |
Asset Sale Agreement between the Well Group, Inc. and Salon Media Group, Inc. entered into on September 20, 2012. |
|
10.8(9) |
Form of Purchase Agreement, dated as of March 1, 2013 |
|
10.9(9) |
Voting Agreement, dated as of February 28, 2013 |
|
10.10(10) |
2014 Stock Incentive Plan |
|
10.11(11) |
Office Lease between 132 West 31st Street Building Investors II, LLC and Salon Media Group, Inc., dated April 16, 2014 |
|
23.1 |
Consent of Burr Pilger Mayer, Inc., Independent Registered Public Accounting Firm. |
|
31.1 |
Certification of Jordan Hoffner, Chief Executive Officer of the Registrant pursuant to Section 302, as adopted pursuant to the Sarbanes-Oxley Act of 2002. |
|
31.2 |
Certification of Elizabeth Hambrecht, Chief Financial Officer of the Registrant pursuant to Section 302, as adopted pursuant to the Sarbanes-Oxley Act of 2002. |
|
32.1 |
Certification of Jordan Hoffner, Chief Executive Officer of the Registrant pursuant to Section 906, as adopted pursuant to the Sarbanes-Oxley Act of 2002. |
|
32.2 |
Certification of Elizabeth Hambrecht, Chief Financial Officer of the Registrant pursuant to Section 906, as adopted pursuant to the Sarbanes-Oxley Act of 2002. |
|
101.INS** |
XBRL Instance | ||
|
101.SCH** |
XBRL Taxonomy Extension Schema | ||
|
101.CAL** |
XBRL Taxonomy Extension Calculation | ||
|
101.DEF** |
XBRL Taxonomy Extension Definition | ||
|
101.LAB** |
XBRL Taxonomy Extension Labels | ||
|
101.PRE** |
XBRL Taxonomy Extension Presentation | ||
|
** XBRL information is furnished and not filed or a part of a registration statement or prospectus for purposes of sections 11 or 12 of the Securities Act of 1933, as amended, is deemed not filed for purposes of section 18 of the Securities Exchange Act of 1934, as amended, and otherwise is not subject to liability under these sections | |||
|
Footnote |
Footnote Description | ||
|
1 |
Incorporated by reference to Exhibit 99.1 to the Registrant’s Current Report on Form 8-K filed on March 13, 2014. | ||
|
2 |
Incorporated by reference to Exhibit 99.2 to the Registrant’s Current Report on Form 8-K filed on March 13, 2014. | ||
|
3 |
Incorporated by reference to the exhibits filed with Salon’s Annual Report on Form 10-K for the fiscal year ended March 31, 2005, filed on June 29, 2005. | ||
|
4 |
Incorporated by reference to the exhibits filed with Salon’s Current Report on Form 8-K filed on July 27, 2011. | ||
|
5 |
` |
Incorporated by reference to the exhibits filed with Salon’s Current Report on Form 8-K filed on June 4, 2012. | |
|
6 |
Incorporated by reference to the exhibits filed with Salon’s Current Report on Form 8-K filed December 10, 2012. | ||
|
7 |
Incorporated by reference to the exhibits filed with Salon’s Current Report on Form 8-K filed July 7, 2013. | ||
|
8 |
Incorporated by reference to the exhibits filed with Salon’s Quarterly Report on Form 10-Q filed November 14, 2012. | ||
|
9 |
Incorporated by reference to the exhibits filed with Salon’s Current Report on Form 8-K filed March 7, 2013. | ||
|
10 |
Incorporated by reference to Exhibit 99.3 to the Registrant’s Current Report on Form 8-K filed on March 13, 2014. | ||
|
11 |
Incorporated by reference to the exhibits filed with Salon’s Current Report on Form 8-K filed May 14, 2014. | ||
|
12 |
Incorporated by reference to the exhibit filed with Salon’s Registration Statement report on Form S-1/A filed on May 27, 1999. | ||
SIGNATURES
Pursuant to the requirements of Section 13 or 15(d) of the Securities and Exchange Act of 1934, the registrant has duly caused this report to be signed on its behalf by the undersigned, thereunto duly authorized.
SALON MEDIA GROUP, INC.
By: /s/ Jordan Hoffner
Jordan Hoffner
Chief Executive Officer
Date: June 24, 2016
Pursuant to the requirements of the Securities Exchange Act of 1934, this report has been signed below by the following persons on behalf of the registrant and in the capacities and on the dates indicated.
|
Signature |
Title |
Date | ||
|
/s/ Jordan Hoffner |
Chief Executive Officer and Director (Principal Executive Officer) |
June 24, 2016 | ||
|
Jordan Hoffner |
||||
|
/s/ Elizabeth Hambrecht |
Chief Financial Officer (Principal Financial and Accounting Officer) |
June 24, 2016 | ||
|
Elizabeth Hambrecht |
||||
|
/s/ Deepak Desai |
Director |
June 24, 2016 | ||
|
Deepak Desai |
||||
|
/s/ William Hambrecht |
Director |
June 24, 2016 | ||
|
William Hambrecht |
||||
|
/s/ George Hirsch |
Director |
June 24, 2016 | ||
|
George Hirsch |
||||
|
/s/ James H. Rosenfield |
Director |
June 24, 2016 | ||
|
James H. Rosenfield |
||||
|
/s/ John Warnock |
Chairman of the Board, Director |
June 24, 2016 | ||
|
John Warnock |
70