Attached files
| file | filename |
|---|---|
| 8-K - FORM 8-K - Federal Home Loan Bank of New York | d215941d8k.htm |

Strong Performance for Members, Well-Positioned for the Future Meeting with Stockholders June 23, 2016 Exhibit 99.1

“Advances Bank” strategy Strong performance record for customers and shareholders Conservatively positioned balance sheet FHLBank System’s financial results continue to improve since the financial crisis Key Messages

FHLBNY Is the Third Largest FHLBank Ranked by Advances Total Advances ($ Billions) Change in Advances: 2Q07 vs 1Q16 Data as of 3/31/2016

Core Mission Assets Are the Foundation of our Balance Sheet Balance Sheet by Type of Assets Note: Data as of 3/31/2016; ranked by Core Mission Assets (Advances plus MPF)

FHLBNY’s Member Base and Borrowers Are Diverse Total Advances (Par) = $88.7 B Top Borrowers Member Type Data as of March 31, 2016 Our New Jersey members held $14 billion in advances at quarter-end

The FHLBNY’s Financial Performance Has Been Strong Notes: All $ millions. *Dividends paid during calendar period. FHLBNY - Financial Results Highlights March 31, December 31, December 31, December 31, 2016 2015 2014 2013 Period End Balances Advances $89,482 $93,874 $98,797 $90,765 MBS Investments 14,338 14,065 13,552 13,373 Mortgage Loans 2,565 2,524 2,129 1,928 Total Assets 119,941 123,248 132,825 128,333 Consolidated Obligations 111,791 114,576 123,580 119,146 Retained Earnings 1,292 1,270 1083 999 Capital Stock 5,360 5,585 5,580 5,571 Results Net Interest Income $127 $554 $444 $421 Operating Expenses 25 103 86 83 Net Income 83 415 315 305 Dividend Rate* 4.65% 4.22% 4.19% 4.12%

HLBNY’s Expense Management Has Been Prudent Operating Expenses as a % of Average Total Assets – FY2015 Note: Operating expenses include compensation, benefits and other expenses, excluding FHFA and OF assessments.

Our Dividends Have Been Reliable and Exceeded Market Reference Rates FHLBNY Dividend History

FHLBNY Dividends Have Been the Highest Among the FHLBanks

Our Strategic Objectives Balance: Achieving Returns, Managing Risk, Enabling Growth and Managing for the Long-term Provide value to the membership through relevant, mission-oriented products and services and appropriate risk adjusted returns on capital stock 2. Protect the par value of member stock from risk and uncertainties and work to ensure the System’s long-term viability 3. Support the growth of the co-operative by pursuing business relationships with members/ prospects and pursuing community investment/outreach opportunities 4. Prepare for future operating environments by enhancing opportunities for employees 5. Adopt technical design strategies that optimize cost, efficiency and resiliency Strategic Plan 2016–2018: Strategic Objectives

The Theme for our Strategy is “Evolve From a Strong Base” Our Current Position is Strong “Core mission” focused balance sheet Strong earnings generation capability Diversified membership, advances demand & local economy Strong investor demand for FHLBank debt Threats/Opportunities to Watch Global economic conditions & member margins Debt market liquidity and FHLBank funding spreads Other wholesale funding sources New regulations Member mergers

FHLBank Balance Sheets Are Scalable to Meet Member Liquidity Needs FHLBank System Advances Balances

System Advances Have Grown Nicely in Recent Years FHLB System Change in Advance Balances

System Financial Performance Has Improved Considerably Since the Financial Crisis FHLBank System Net Income: 2001- 1Q 2016 ($Millions) FHLBank System ROE: 2001- 1Q 2016 Note: Results include gains on PLMBS litigation settlements :$348mm in1Q 2016, $688mm in 2015, $134mm in 2014.

Since the Crisis, System Retained Earnings Have Grown 4x While Assets Have Declined 30% FHLBank System: Retained Earnings Growth Notes: URE = Unrestricted Retained Earnings. RRE = Restricted Retained Earnings. Retained earnings and capital stock are defined on a regulatory basis.

All FHLBanks Exceed Minimum Capital Requirements FHLBanks Capital-to-Assets Ratio As of March 31, 2016

Questions?
BUSINESS UPDATE
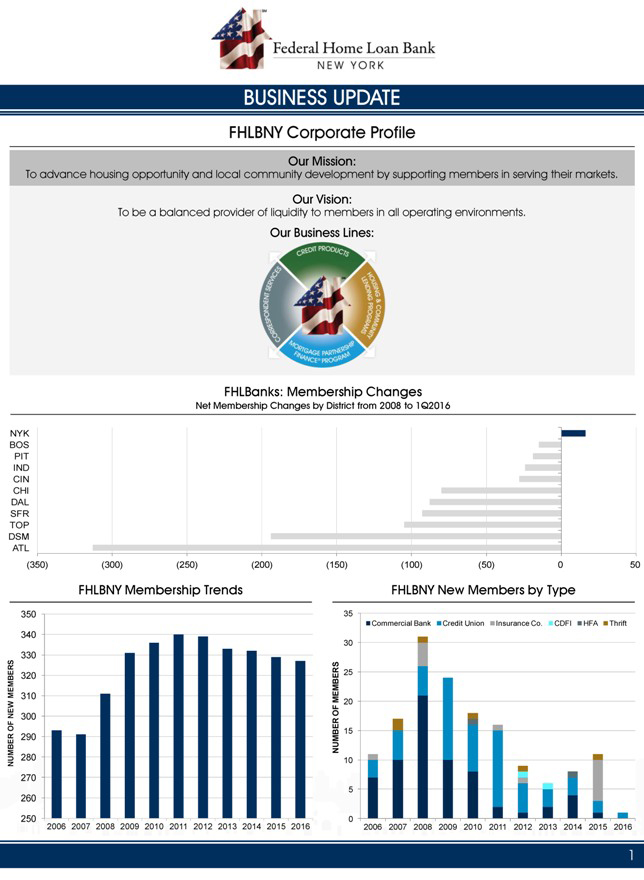
FHLBNY Corporate Profile
Our Mission:
To advance housing opportunity and local community development
by supporting members in serving their markets.
Our Vision:
To be a balanced
provider of liquidity to members in all operating environments.
Our Business Lines:
FHLBanks: Membership Changes
Net Membership Changes by District from 2008 to 1Q2016
NYK BOS PIT IND CIN CHI DAL SFR TOP DSM ATL
(350) (300) (250) (200) (150)
(100) (50) 0 50 FHLBNY Membership Trends FHLBNY New Members by Type 350 35
Commercial Bank Credit Union Insurance Co. CDFI HFA Thrift 340 30 330 S MEMBER 320 ERS
25 310 MEMB F 20 O NEW 300 OF 290 BER 15 NU M NUMBER 280 10 270 5 260
250 2006 2007 2008 2009 2010 2011 2012 2013 2014 2015 2016 0 2006 2007 2008 2009 2010 2011
2012 2013 2014 2015 2016
1
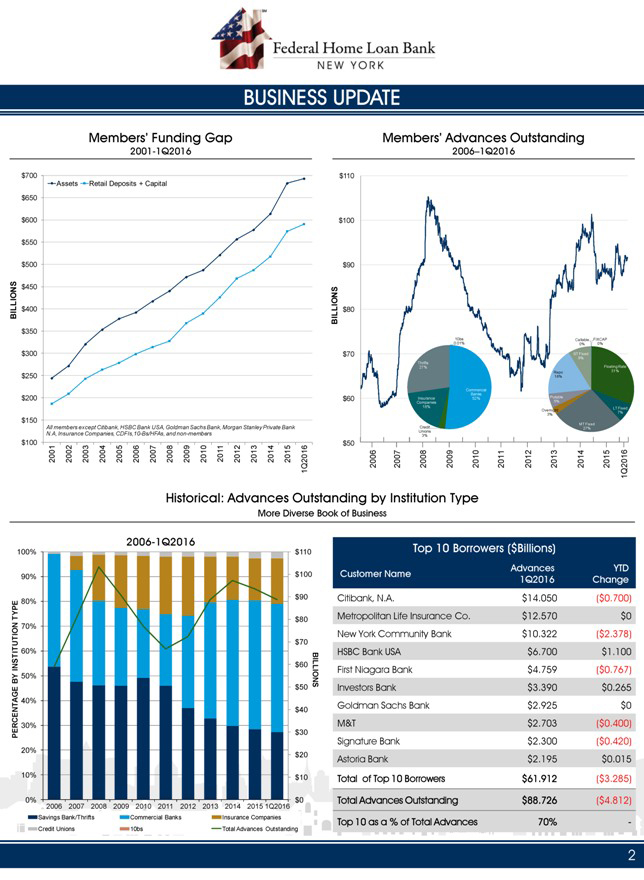
BUSINESS UPDATE Members’ Funding Gap
2001-1Q2016 $700 Assets Retail Deposits + Capital $650 $600 $550 $500 ION S $450 IL L $400 B $350 $300 $250 $200 $150
All members except Citibank, HSBC Bank USA, Goldman Sachs Bank, Morgan Stanley Private Bank N.A, Insurance Companies, CDFIs,10-Bs/HFAs, and non-members
$100 2001 2002 2003 2004 2005 2006 2007 2008 2009 2010 2011 2012 2013 2014 2015 1Q2016
Members’ Advances Outstanding
2006–1Q2016 $110 $100 $90 LLIONS $80
B I 10bs Callable FIXCAP 0.01% 0% 0% $70 ST Fixed 9%
Thrifts Floating Rate 27% 31% Repo 18% Commercial Banks Putable
$60 Insurance 52% 5% Companies 18% Overnight LT Fixed 7% 3% Credit MT Fixed Unions 27% 3% $50
20062007 2008 20092010201120122013 2014 20151Q2016
Historical: Advances
Outstanding by Institution Type
More Diverse Book of Business 2006-1Q2016 100% $110 90% $100 $90 TYPE 80% N 70% $80 O TUTI $70 I 60% NST $60 I BY 50% $50 BILLIONS
40% $40
PERCENTAGE 30% $30 20% $20 10% $10 0% 2006 2007 2008 2009 2010 2011 2012 2013 2014 2015 1Q2016 $0
Savings Bank/Thrifts Commercial Banks Insurance Companies Credit Unions 10bs Total Advances Outstanding
Top 10 Borrowers ($Billions)
Advances YTD Customer Name 1Q2016 Change
Citibank, N.A. $14.050 ($0.700) Metropolitan Life Insurance Co. $12.570 $0 New York Community Bank $10.322 ($2.378) HSBC Bank USA $6.700 $1.100 First Niagara Bank $4.759 ($0.767)
Investors Bank $3.390 $0.265 Goldman Sachs Bank $2.925 $0 M&T $2.703 ($0.400) Signature Bank $2.300 ($0.420) Astoria Bank $2.195 $0.015 Total of Top 10 Borrowers $61.912 ($3.285)
Total Advances Outstanding $88.726 ($4.812) Top 10 as a % of Total Advances 70% -
2
BUSINESS UPDATE
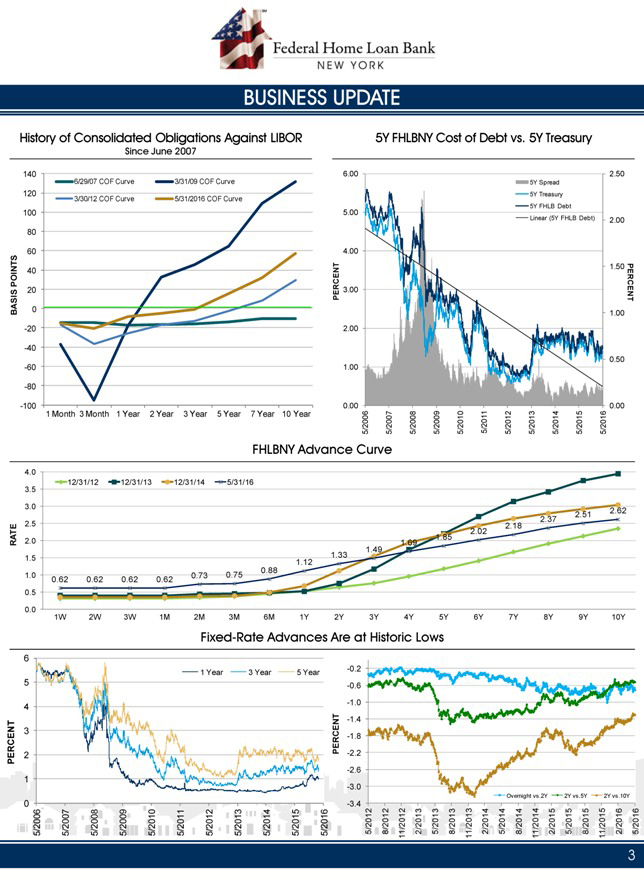
History of Consolidated
Obligations Against LIBOR Since June 2007 140 6/29/07 COF Curve 3/31/09 COF Curve 120
3/30/12 COF Curve 5/31/2016 COF Curve 100 80 60 N TS 40 POI SIS 20 B A 0 -20
-40 -60 -80
-100 1 Month 3 Month 1 Year 2 Year 3 Year 5 Year 7 Year 10 Year 5Y FHLBNY Cost of Debt vs. 5Y Treasury 6.00 2.50
5Y Spread 5Y Treasury 5.00 5Y FHLB Debt Linear (5Y FHLB Debt) 2.00 4.00 N T 1.50 C E PER E R 3.00 CE N P T 1.00 2.00 0.50 1.00
0.00 0.00 /2007 /2009 /2010 5/201 1 /2012 /2013 /2014 /2015 /2016 5/2006 5 5/2008 5 5 5 5 5 5 5
FHLBNY Advance Curve
4.0 3.5 12/31/12 12/31/13 12/31/14 5/31/16 3.0 2.62 2.51
2.37 2.5 2.02 2.18 TE
A 1.85 R 2.0 1.69 1.49 1.5 1.12 1.33 0.88 1.0 0.73 0.75 0.62 0.62 0.62 0.62 0.5
0.0 1W 2W 3W 1M 2M 3M 6M 1Y 2Y 3Y 4Y 5Y 6Y 7Y 8Y 9Y 10Y
Fixed-Rate Advances Are at Historic
Lows
PERCENT
0 1 2 3 4 5 6 5/2006 5/2007 5/2008 5/2009 5/2010 5/2011 5/20121
Year 5/2013
3
BUSINESS UPDATE
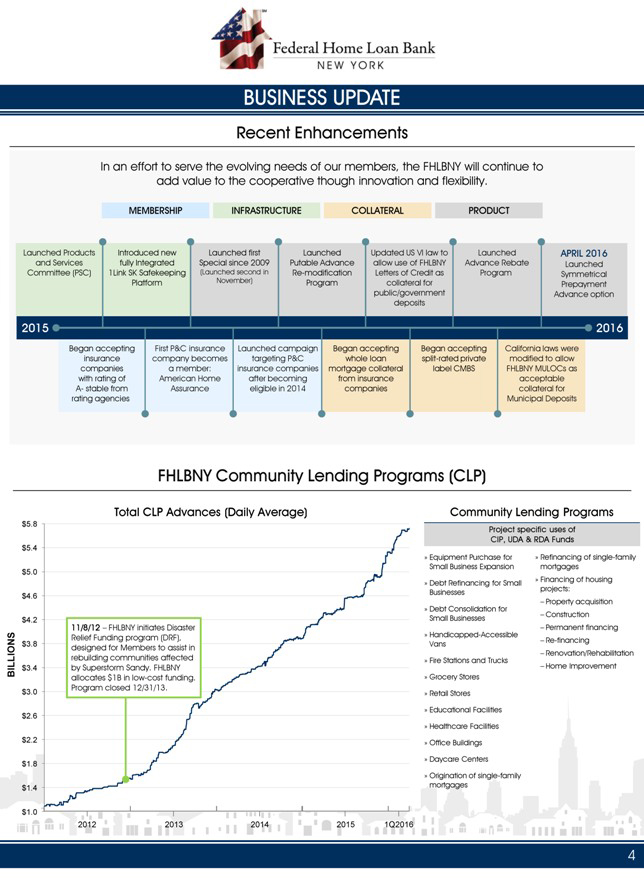
Recent Enhancements
In an effort to serve the evolving needs of our members, the FHLBNY will continue to add value to the cooperative though innovation and flexibility.
MEMBERSHIP INFRASTRUCTURE COLLATERAL PRODUCT
Launched Products Introduced new Launched first
Launched Updated US VI law to Launched APRIL 2016 and Services fully Integrated Special since 2009 Putable Advance allow use of FHLBNY Advance Rebate Launched Committee (PSC) 1Link SK Safekeeping (Launched second in Re-modification Letters of Credit
as Program Symmetrical Platform November) Program collateral for Prepayment public/government deposits Advance option 2015 2016
Began accepting First P&C
insurance Launched campaign Began accepting Began accepting California laws were insurance company becomes targeting P&C whole loan split-rated private modified to allow companies a member: insurance companies mortgage collateral label CMBS
FHLBNY MULOCs as with rating of American Home after becoming from insurance acceptable A- stable from Assurance eligible in 2014 companies collateral for rating agencies Municipal Deposits FHLBNY Community Lending Programs (CLP) Total CLP Advances
(Daily Average) Community Lending Programs $5.8 Project specific uses of CIP, UDA & RDA Funds $5.4 Equipment Purchase for Refinancing of single-family Small Business Expansion mortgages $5.0
Financing of housing Debt Refinancing for Small $4.6 Businesses projects:
Debt Consolidation
for – Property acquisition Small Businesses – Construction $4.2 11/8/12 – FHLBNY initiates Disaster – Permanent financing S Relief Funding program (DRF), Handicapped-Accessible Vans – Re-financing $3.8 designed for Members
to assist in ION – Renovation/Rehabilitation L rebuilding communities affected Fire Stations and Trucks BIL $3.4 by Superstorm Sandy. FHLBNY – Home Improvement allocates $1B in low-cost funding. Grocery Stores Program closed 12/31/13. $3.0
Retail Stores Educational Facilities $2.6 Healthcare Facilities $2.2 Office Buildings Daycare Centers $1.8 Origination of single-family $1.4 mortgages $1.0 2012
2013 2014 2015 1Q2016