Attached files
| file | filename |
|---|---|
| EX-99.2 - EX-99.2 - Centennial Resource Development, Inc. | d191056dex992.htm |
| EX-99.1 - EX-99.1 - Centennial Resource Development, Inc. | d191056dex991.htm |
| EX-23.3 - EX-23.3 - Centennial Resource Development, Inc. | d191056dex233.htm |
| EX-23.2 - EX-23.2 - Centennial Resource Development, Inc. | d191056dex232.htm |
| EX-23.1 - EX-23.1 - Centennial Resource Development, Inc. | d191056dex231.htm |
| EX-10.2 - EX-10.2 - Centennial Resource Development, Inc. | d191056dex102.htm |
| EX-10.1 - EX-10.1 - Centennial Resource Development, Inc. | d191056dex101.htm |
| EX-3.3 - EX-3.3 - Centennial Resource Development, Inc. | d191056dex33.htm |
| EX-3.1 - EX-3.1 - Centennial Resource Development, Inc. | d191056dex31.htm |
Table of Contents
As filed with the Securities and Exchange Commission on June 22, 2016
Registration No. 333-
UNITED STATES
SECURITIES AND EXCHANGE COMMISSION
Washington, D.C. 20549
Form S-1
REGISTRATION STATEMENT
UNDER
THE SECURITIES ACT OF 1933
Centennial Resource Development, Inc.
(Exact name of registrant as specified in its charter)
| Delaware | 1311 | 47-2040396 | ||
| (State or other jurisdiction of incorporation or organization) |
(Primary Standard Industrial Classification Code Number) |
(IRS Employer Identification Number) |
1401 17th Street, Suite 1000
Denver, CO 80202
(720) 441-5515
(Address, including zip code, and telephone number, including area code, of registrant’s principal executive offices)
George S. Glyphis
Chief Financial Officer
1401 17th Street, Suite 1000
Denver, CO 80202
(720) 441-5515
(Name, address, including zip code, and telephone number, including area code, of agent for service)
Copies to:
| Douglas E. McWilliams Christopher G. Schmitt Vinson & Elkins L.L.P. 1001 Fannin Street, Suite 2500 Houston, Texas 77002 (713) 758-2222 |
Gerald M. Spedale Andrew J. Ericksen Baker Botts L.L.P. One Shell Plaza 901 Louisiana St. Houston, Texas 77002 (713) 229-1234 |
Approximate date of commencement of proposed sale of the securities to the public: As soon as practicable after the effective date of this Registration Statement.
If any of the securities being registered on this Form are to be offered on a delayed or continuous basis pursuant to Rule 415 under the Securities Act of 1933, check the following box: ¨
If this Form is filed to register additional securities for an offering pursuant to Rule 462(b) under the Securities Act, check the following box and list the Securities Act registration statement number of the earlier effective registration statement for the same offering. ¨
If this Form is a post-effective amendment filed pursuant to Rule 462(c) under the Securities Act, check the following box and list the Securities Act registration statement number of the earlier effective registration statement for the same offering. ¨
If this Form is a post-effective amendment filed pursuant to Rule 462(d) under the Securities Act, check the following box and list the Securities Act registration statement number of the earlier effective registration statement for the same offering. ¨
Indicate by check mark whether the registrant is a large accelerated filer, an accelerated filer, a non-accelerated filer, or a smaller reporting company. See the definitions of “large accelerated filer,” “accelerated filer” and “smaller reporting company” in Rule 12b-2 of the Exchange Act.
| Large accelerated filer | ¨ | Accelerated filer | ¨ | |||
| Non-accelerated filer | þ (Do not check if a smaller reporting company) | Smaller reporting company | ¨ | |||
CALCULATION OF REGISTRATION FEE
|
| ||||
| Title of Each Class of Securities to be Registered |
Proposed Maximum Aggregate Offering Price(1)(2) |
Amount of Registration Fee | ||
| Common Stock, par value $0.01 per share |
$100,000,000 | $10,070 | ||
|
| ||||
|
| ||||
| (1) | Includes shares issuable upon exercise of the underwriters’ over-allotment option. |
| (2) | Estimated solely for the purpose of calculating the registration fee pursuant to Rule 457(o) under the Securities Act of 1933, as amended. |
The registrant hereby amends this Registration Statement on such date or dates as may be necessary to delay its effective date until the registrant shall file a further amendment that specifically states that this Registration Statement shall thereafter become effective in accordance with Section 8(a) of the Securities Act of 1933, as amended, or until this Registration Statement shall become effective on such date as the Securities and Exchange Commission, acting pursuant to said Section 8(a), may determine.
Table of Contents
The information in this prospectus is not complete and may be changed. The securities described herein may not be sold until the registration statement filed with the Securities and Exchange Commission is effective. This prospectus is not an offer to sell these securities, and it is not soliciting an offer to buy these securities, in any state or jurisdiction where the offer or sale is not permitted.
SUBJECT TO COMPLETION, DATED JUNE 22, 2016
Shares

Centennial Resource Development, Inc.
Common stock
This is the initial public offering of our common stock. We are selling shares of common stock, and the selling stockholders are selling shares of common stock. The selling stockholders are deemed under federal securities laws to be underwriters with respect to the shares of common stock they are offering hereby and any shares of common stock that they may sell pursuant to the underwriters’ option to purchase additional shares of our common stock. We will not receive any proceeds from the shares of common stock sold by the selling stockholders.
Prior to this offering, there has been no public market for our common stock. The initial public offering price of the common stock is expected to be between $ and $ per share. We have applied to list our common stock on the NASDAQ Global Select Market under the symbol “CDEV.”
To the extent that the underwriters sell more than shares of common stock, the underwriters have the option to purchase up to an additional shares from the selling stockholders at the public offering price less the underwriting discount and commissions.
We are an “emerging growth company” as that term is used in the Jumpstart Our Business Startups Act of 2012, and as such, we have elected to take advantage of certain reduced public company reporting requirements for this prospectus and future filings. See “Risk Factors” and “Prospectus Summary—Emerging Growth Company.”
Investing in our common stock involves risks. See “Risk Factors” on page 21.
| Price to Public |
Underwriting Discounts and Commissions |
Proceeds to Issuer |
Proceeds to Selling Stockholders | |||||
| Per Share |
$ | $ | $ | $ | ||||
| Total |
$ | $ | $ | $ |
Delivery of the shares of common stock will be made on or about , 2016.
Neither the Securities and Exchange Commission nor any state securities commission has approved or disapproved of these securities or determined if this prospectus is truthful or complete. Any representation to the contrary is a criminal offense.
| Credit Suisse | Barclays |
The date of this prospectus is , 2016.
Table of Contents
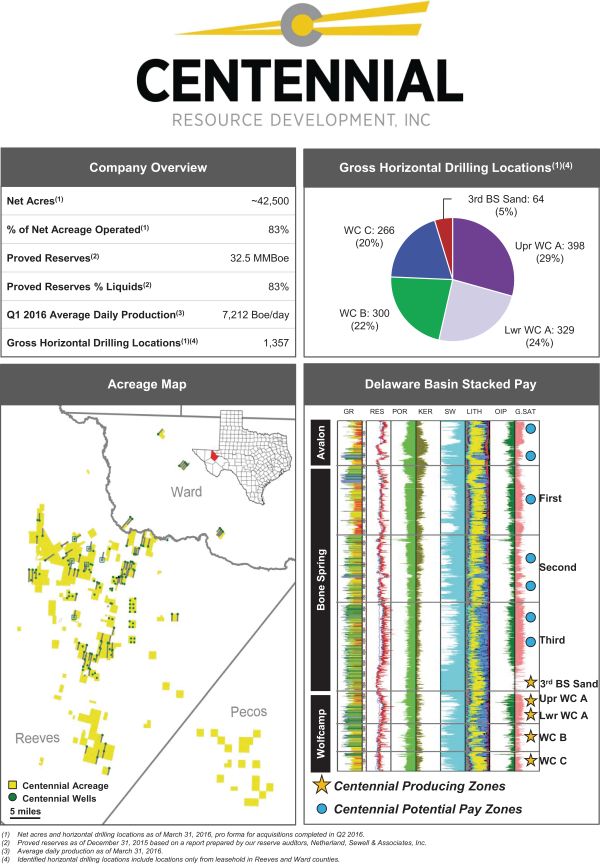
Table of Contents
| 1 | ||||
| 21 | ||||
| 49 | ||||
| 51 | ||||
| 52 | ||||
| 53 | ||||
| 55 | ||||
| SELECTED HISTORICAL CONSOLIDATED AND COMBINED FINANCIAL DATA |
57 | |||
| MANAGEMENT’S DISCUSSION AND ANALYSIS OF FINANCIAL CONDITION AND RESULTS OF OPERATIONS |
60 | |||
| 84 | ||||
| 111 | ||||
| 116 | ||||
| 127 | ||||
| 131 | ||||
| 134 | ||||
| 138 | ||||
| 143 | ||||
| MATERIAL U.S. FEDERAL INCOME TAX CONSIDERATIONS FOR NON-U.S. HOLDERS |
145 | |||
| 149 | ||||
| 155 | ||||
| 155 | ||||
| 155 | ||||
| F-1 | ||||
| A-1 |
You should rely only on the information contained in this prospectus and any free writing prospectus prepared by us or on behalf of us or the information to which we have referred you. Neither we, the selling stockholders nor the underwriters have authorized anyone to provide you with information different from that contained in this prospectus and any free writing prospectus. We take no responsibility for, and can provide no assurance as to the reliability of, any other information that others may give you. We, the selling stockholders and the underwriters are offering to sell shares of common stock and seeking offers to buy shares of common stock only in jurisdictions where offers and sales are permitted. The information in this prospectus is accurate only as of the date of this prospectus, regardless of the time of delivery of this prospectus or any sale of the common stock. Our business, financial condition, results of operations and prospects may have changed since that date.
This prospectus contains forward-looking statements that are subject to a number of risks and uncertainties, many of which are beyond our control. See “Risk Factors” and “Cautionary Statement Regarding Forward-Looking Statements.”
Until , 2016 (25 days after commencement of this offering), all dealers that effect transactions in our common stock, whether or not participating in this offering, may be required to deliver a prospectus. This is in addition to the dealer’s obligation to deliver a prospectus when acting as an underwriter and with respect to unsold allotments or subscriptions.
i
Table of Contents
Industry and Market Data
The market data and certain other statistical information used throughout this prospectus are based on independent industry publications, government publications and other published independent sources. Although we believe these third-party sources are reliable as of their respective dates, neither we, the selling stockholders nor the underwriters have independently verified the accuracy or completeness of this information. Some data is also based on our good faith estimates. The industry in which we operate is subject to a high degree of uncertainty and risk due to a variety of factors, including those described in the section entitled “Risk Factors.” These and other factors could cause results to differ materially from those expressed in these publications.
Trademarks and Trade Names
We own or have rights to various trademarks, service marks and trade names that we use in connection with the operation of our business. This prospectus may also contain trademarks, service marks and trade names of third parties, which are the property of their respective owners. Our use or display of third parties’ trademarks, service marks, trade names or products in this prospectus is not intended to, and does not imply, a relationship with us or an endorsement or sponsorship by or of us. Solely for convenience, the trademarks, service marks and trade names referred to in this prospectus may appear without the ®, TM or SM symbols, but such references are not intended to indicate, in any way, that we will not assert, to the fullest extent under applicable law, our rights or the right of the applicable licensor to these trademarks, service marks and trade names.
ii
Table of Contents
This summary highlights information contained elsewhere in this prospectus. You should read the entire prospectus carefully, including the information under the headings “Risk Factors,” “Cautionary Statement Regarding Forward-Looking Statements” and “Management’s Discussion and Analysis of Financial Condition and Results of Operations” and the historical financial statements and the notes to those financial statements appearing elsewhere in this prospectus. The information presented in this prospectus assumes (i) an initial public offering price of $ per share (the midpoint of the price range set forth on the cover of this prospectus) and (ii) unless otherwise indicated, that the underwriters do not exercise their option to purchase additional shares of common stock.
On October 15, 2014, Centennial Resource Production, LLC (“Centennial OpCo”), an independent oil and natural gas company formed on August 30, 2012, acquired all of the oil and natural gas properties and certain other assets of Celero Energy Company, LP (“Celero”) in exchange for interests in Centennial OpCo, which is referred to in this prospectus as the “Combination.” Prior to the closing of this offering, we will complete a corporate reorganization pursuant to which all of the interests in Centennial OpCo, including Celero’s interests, will be contributed to Centennial Resource Development, Inc., a Delaware corporation and the issuer of common stock in this offering, in exchange for shares of common stock in Centennial Resource Development, Inc. Except as expressly stated or the context otherwise requires, our financial, reserve and operating information in this prospectus gives effect to the Combination, and the terms “we,” “us” and “our” refer, prior to the corporate reorganization, to the consolidated and combined financial, reserve and operating information of Centennial OpCo and Celero, and, after the corporate reorganization, to Centennial Resource Development, Inc. and its subsidiaries. Please read “Recent and Formation Transactions.”
This prospectus includes certain terms commonly used in the oil and natural gas industry, which are defined elsewhere in this prospectus in the “Glossary of Oil and Natural Gas Terms.”
Our Company
Business Overview
We are an independent oil and natural gas company focused on the development and acquisition of unconventional oil and associated liquids-rich natural gas reserves in the Permian Basin. Our assets are concentrated in the Delaware Basin, a sub-basin of the Permian Basin. Our properties consist of large, contiguous acreage blocks in Reeves, Ward and Pecos counties in West Texas.
As of June 15, 2016, our portfolio included 61 operated producing horizontal wells. Our horizontal wells span an area approximately 45 miles long by 20 miles wide where we have established commercial production in five distinct zones: the 3rd Bone Spring Sandstone, Upper Wolfcamp A, Lower Wolfcamp A, Wolfcamp B and Wolfcamp C. As a result, we have broadly appraised our acreage across various geographic areas and stratigraphic zones, which we expect will allow us to efficiently develop our drilling inventory with a focus on maximizing returns to our stockholders. In addition, we believe our acreage may be prospective for the 2nd and 3rd Bone Spring shales and Avalon Shale, where other operators have experienced drilling success near our acreage.
We have leased or acquired approximately 42,500 net acres, approximately 83% of which we operate, as of June 15, 2016. Our acreage is predominantly located in the southern portion of the Delaware Basin, where production and reserves typically contain a higher percentage of oil and natural gas liquids and a correspondingly lower percentage of natural gas compared to the northern portion of the Delaware Basin. After temporarily suspending drilling activity at the end of March 2016 to preserve capital, we added one horizontal rig in June
1
Table of Contents
2016 and expect to add a second horizontal rig in the fourth quarter of 2016. During 2015, we operated, on average, one rig and placed 13 horizontal wells on production. Our development drilling plan is comprised exclusively of horizontal drilling with an ongoing focus on reducing drilling times, optimizing completions and reducing costs.
The Permian Basin is an attractive operating area due to its extensive original oil-in-place, favorable operating environment, multiple horizontal zones, high oil and liquids-rich natural gas content, well-developed network of oilfield service providers, long-lived reserves with relatively consistent reservoir quality and historically high drilling success rates. According to the Energy Information Administration of the U.S. Department of Energy (the “EIA”), the Permian Basin is the most prolific oil producing area in the United States, accounting for 23% and 20% of total U.S. crude oil production during the twelve-month periods ended April 30, 2016 and April 30, 2015, respectively.
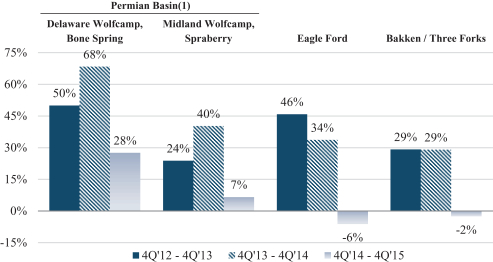
Over the past decade, the Delaware Basin has experienced significant horizontal drilling. According to Baker Hughes, three of the top six Permian Basin counties by horizontal rig count are located in the Delaware Basin. Reeves County, where the majority of our acreage is located, had the second most horizontal rigs of any U.S. county as of June 17, 2016, with 21 rigs as of such date. As a result of this horizontal drilling, the Delaware Basin is the only region in the United States that has experienced sustained fourth quarter-to-fourth quarter production growth rates greater than 25% for the past three years, as illustrated in the chart below.
| Year-Over-Year Production Growth for Major Oil Basins and Plays |
| Production (MMBoe) |
| Permian Basin(1) | Eagle Ford | Bakken /Three Forks |
||||||||||||||
| Delaware Wolfcamp, Bone Spring |
Midland Wolfcamp, Spraberry |
|||||||||||||||
| Fourth Quarter 2012 |
22.5 | 49.6 | 112.5 | 78.2 | ||||||||||||
| Fourth Quarter 2013 |
33.8 | 61.4 | 164.0 | 101.0 | ||||||||||||
| Fourth Quarter 2014 |
56.9 | 86.1 | 219.2 | 130.3 | ||||||||||||
| Fourth Quarter 2015 |
72.6 | 91.8 | 205.9 | 127.1 | ||||||||||||
| (1) | Does not include production in the Permian Basin beyond the Midland and Delaware Basins. |
Source: IHS Performance Evaluator as of April 2016.
2
Table of Contents
Based on recent well results and significant decreases in drilling and completion costs, we believe the Delaware Basin represents one of the most attractive operating regions in the United States. As illustrated in the chart below, according to data from IHS Performance Evaluator, in 2012, 2013, 2014 and 2015, wells in the Delaware Basin had a higher average three-month cumulative initial production per 1,000 feet of lateral section than wells in the Midland Basin, another sub-basin of the Permian Basin. These results are driven primarily by the over-pressured nature of the Bone Spring and Wolfcamp reservoirs in the Delaware Basin, which enhances the deliverability of horizontal wells. We believe these results indicate the Wolfcamp and the Bone Spring formations in the Delaware Basin generate greater implied EURs per 1,000 feet of lateral length as compared to the Spraberry and Wolfcamp zones in the Midland Basin.
| Horizontal Well Results—Delaware Basin versus Midland Basin |
Average per well 3 month cumulative initial production
(MBoe per 1,000 feet of lateral length)
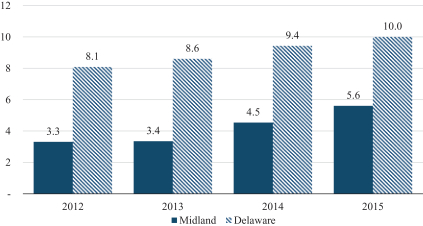
Note: Delaware Basin includes horizontal wells from Wolfcamp and Bone Spring producing formations and Midland Basin includes wells from Wolfcamp and Spraberry producing formations. Reflects a 6:1 gas - oil equivalent conversion ratio.
Source: IHS Performance Evaluator as of April 2016.
We were formed by an affiliate of Natural Gas Partners (“NGP”), a family of energy-focused private equity investments funds. Our goal is to build a premier development and acquisition company focused on horizontal drilling in the Delaware Basin. Our key management and technical team members average approximately 28 years of experience and have successfully led development operations in prolific oil basins in the Continental United States, including horizontal development in the Permian, Bakken and Niobrara plays. This expertise and technical acumen have been applied to the horizontal drilling and multi-stage completions on our properties, resulting in drilling success and continuous operating improvements across multiple zones.
We have assembled a multi-year inventory of horizontal drilling projects. As of June 15, 2016, we had identified 1,357 gross horizontal drilling locations in the 3rd Bone Spring Sandstone, Upper Wolfcamp A, Lower Wolfcamp A, Wolfcamp B and Wolfcamp C zones across our Delaware Basin acreage based on spacing of four wells per 640-acre section in the 3rd Bone Spring Sandstone and five to six wells per 640-acre section in the Wolfcamp zones. Our drilling inventory includes 366 extended lateral locations of either 9,500 or 7,500 lateral feet. Our near-term drilling program is focused on both the Upper and Lower Wolfcamp A zones, but we also
3
Table of Contents
intend to drill locations in the 3rd Bone Spring Sandstone, Wolfcamp B and Wolfcamp C zones. Based on our and other operators’ well results and our analysis of geologic and engineering data, we believe the 2nd and 3rd Bone Spring shales and Avalon Shale may also be prospective across our acreage, and we may integrate these zones into our future drilling program as they become further delineated. The following table provides a summary of our gross horizontal drilling locations by zone as of June 15, 2016.
Gross Identified Horizontal Drilling Locations(1)(2)
| Total | ||||
| Zones: |
||||
| 3rd Bone Spring Sandstone |
64 | |||
| Upper Wolfcamp A |
398 | |||
| Lower Wolfcamp A |
329 | |||
| Wolfcamp B |
300 | |||
| Wolfcamp C |
266 | |||
|
|
|
|||
| Total Horizontal Locations(3)(4) |
1,357 | |||
|
|
|
|||
| (1) | Our total identified horizontal drilling locations include 51 locations associated with proved undeveloped reserves as of December 31, 2015. We have estimated our drilling locations based on well spacing assumptions and upon the evaluation of our horizontal drilling results and those of other operators in our area, combined with our interpretation of available geologic and engineering data. In particular, we have analyzed and interpreted well results and other data acquired through our participation in the drilling of vertical wells that have penetrated our horizontal zones. In addition, to evaluate the prospectivity of our horizontal acreage, we have performed open-hole and mud log evaluations, core analysis and drill cuttings analysis. See “Business—Our Properties.” The drilling locations that we actually drill will depend on the availability of capital, regulatory approvals, commodity prices, costs, actual drilling results and other factors. Any drilling activities we are able to conduct on these identified locations may not be successful and may not result in our ability to add additional proved reserves to our existing proved reserves. See “Risk Factors—Risks Related to Our Business—Drilling for and producing oil and natural gas are high risk activities with many uncertainties that could adversely affect our business, financial condition or results of operations.” Further, to the extent the drilling locations are associated with acreage that expires, we would lose our right to develop the related locations. See “Risk Factors—Risks Related to Our Business—Our identified drilling locations are scheduled out over many years, making them susceptible to uncertainties that could materially alter the occurrence or timing of their drilling. In addition, we may not be able to raise the substantial amount of capital that would be necessary to drill such locations.” |
| (2) | Our horizontal drilling location count implies 880-foot spacing with five to six wells per 640-acre section in the Wolfcamp zones and 1,320-foot spacing with four wells per 640-acre section in the 3rd Bone Spring Sandstone, in each case, consisting primarily of single-section (i.e., approximately 4,500-foot) laterals. |
| (3) | 674 of our 1,357 horizontal drilling locations are on acreage that we operate. We have an approximate 82% average working interest in our operated acreage. |
| (4) | We have included undeveloped horizontal locations only on our leasehold in Reeves and Ward counties. |
We believe that development drilling of our 1,357 gross horizontal locations, with an increasing focus on drilling extended lateral wells as well as potential downspacing, will allow us to grow our production and reserves. In addition, we believe our large acreage blocks allow us to optimize our horizontal development program to maximize our resource recovery and our returns. We also intend to grow our production and reserves through acquisitions that meet our strategic and financial objectives. Furthermore, we believe our operational efficiency is enhanced by a third-party gas gathering system and cryogenic processing plant, which were built specifically for the area where the majority of our acreage is located, and our operated saltwater disposal system.
4
Table of Contents
In addition, a third-party crude gathering system, which is expected to be operational in the third quarter of 2016 and which will transport the majority of our crude oil to market at a lower cost than we have experienced historically, will provide additional efficiencies.
We experienced a significant decrease in our drilling and completion costs during 2015, which has continued into 2016. This trend has been driven by efficiency improvements in the field, including reduced drilling days, the modification of well designs and reduction or elimination of unnecessary costs. Additionally, overall service costs have declined as a result of reduced industry demand. For the three months ended March 31, 2016, the spud-to-rig release for our three single-section horizontal wells was approximately 22 days compared to 28 days and 46 days for all single-section horizontal wells we drilled in 2015 and 2014, respectively. We expect that further optimization in the field (including the increased drilling of longer laterals, pad drilling, the use of shared facilities and zipper fracs), reduced rig rates and lower service costs will improve our well economics.
Our 2016 capital budget for drilling, completion and recompletion activities and facilities costs is approximately $87 million, excluding leasing and other acquisitions. We expect to allocate approximately $72 million of our 2016 capital budget for the drilling and completion of operated wells and $8 million for our participation in the drilling and completion of non-operated wells. For 2016, we have budgeted $25 million for leasing. In the three months ended March 31, 2016, we incurred capital costs of approximately $16.5 million, excluding leasing and acquisition costs.
Because we operate approximately 83% of our net acreage, the amount and timing of these capital expenditures are largely subject to our discretion. We believe our approximate 82% average working interest in our operated acreage provides us with flexibility to manage our drilling program and optimize our returns and profitability. We could choose to defer a portion of our planned capital expenditures depending on a variety of factors, including the success of our drilling activities; prevailing and anticipated prices for oil, natural gas and NGLs; the availability of necessary equipment, infrastructure and capital; the receipt and timing of required regulatory permits and approvals; drilling, completion and acquisition costs; and the level of participation by other working interest owners. We have an approximate 15% working interest in our non-operated acreage.
For the three months ended March 31, 2016, our average net daily production was 7,212 Boe/d (approximately 71.7% oil, 17.7% natural gas and 10.6% NGLs). The following table provides summary information regarding our proved reserves as of December 31, 2015, based on a reserve report prepared by Netherland, Sewell & Associates, Inc. (“NSAI”), our independent petroleum engineer. Of our proved reserves, approximately 40% were classified as proved developed producing (“PDP”). Proved undeveloped reserves (“PUDs”) included in this estimate are from 52 horizontal well locations across three zones.
| Estimated Total Proved Reserves | ||||||||||||
| Oil (MMBbls) |
NGLs |
Natural Gas |
Total (MMBoe) |
% Oil |
% Liquids(1) |
% Developed | ||||||
| 23.2 |
3.9 | 32.4 | 32.5 | 71 | 83 | 40 | ||||||
| (1) | Includes oil and NGLs. |
Business Strategies
Our primary business objective is to increase stockholder value through the following strategies:
| • | Grow production, cash flow and reserves by developing our extensive Delaware Basin drilling inventory. Our horizontal drilling expertise and technical acumen have enabled us to successfully drill horizontal wells across the areal extent of our acreage while targeting multiple horizontal zones. We have identified an inventory of 1,357 horizontal drilling locations across five zones, which we believe can be expanded via downspacing or the de-risking of other stacked pay zones accessible on our leasehold. After |
5
Table of Contents
| temporarily suspending drilling activity at the end of March 2016 to preserve capital, we added one horizontal drilling rig in June 2016 and expect to add a second horizontal rig in the fourth quarter of 2016. Our recent drilling activity has focused on both the Upper and Lower Wolfcamp A zones. We also plan to target the 3rd Bone Spring Sandstone, Wolfcamp B and Wolfcamp C zones in our future drilling program. We will continue to closely monitor operators with active leases on adjoining properties, or offset operators, as they delineate adjoining acreage and zones, providing us further data to optimize our development plan over time. We believe this strategy will allow us to significantly grow our production, cash flow and reserves while efficiently allocating capital to maximize the value of our resource base. |
| • | Maximize returns by optimizing drilling and completion techniques and improving operating efficiency. We believe completion design combined with cost reductions are the biggest drivers within our control affecting field-level economics. Additionally, we believe that drilling extended laterals of 7,500 or 9,500 feet will enhance our field level economics, and we are optimizing our land position, through swaps and acquisitions, to maximize our extended lateral inventory. We seek to optimize our wellbore economics and consequently increase net asset value through a methodical and continuous focus on drilling efficiency, wellbore accuracy, completion design and execution. We have also improved our completion techniques by increasing the amount of proppant used, reducing gel weight and increasing the slickwater component of total fluid pumped. We closely monitor offset operators to learn from their operational results and apply best practices to our own drilling plan to enhance returns. |
| • | Maintain a high degree of operational control. We seek to maintain operational control of our properties in order to better execute on our strategy of enhancing returns through operating improvements and cost efficiencies. As the operator of approximately 83% of our net acreage, we are able to manage (i) the timing and level of our capital spending, (ii) our development drilling strategies and (iii) our operating costs. We believe this flexibility to manage our drilling program allows us to optimize our returns and profitability. |
| • | Leverage extensive acquisition and Delaware Basin experience to evaluate and execute accretive opportunities. Our executive and core technical team has an average of approximately 28 years of industry experience. Our team has significant experience in successfully evaluating and executing acquisition opportunities and an extensive track record of building businesses in resource plays. Furthermore, we believe our ability to understand the geology, geophysics and reservoir parameters of the rock formations in the Delaware Basin will allow us to make prudent future acquisition decisions in order to grow our resource base and maximize stockholder value. Finally, we have developed working relationships with many operators in the Delaware Basin that we believe represent potential acquisition or partnership opportunities and also provide insight into operational best practices. |
| • | Preserve financial flexibility to pursue organic and external growth opportunities. We carefully manage our liquidity and leverage levels by continuously monitoring cash flow, capital spending and debt capacity. We intend to maintain modest leverage levels to preserve operational and strategic flexibility as well as access to the capital markets. We expect to fund our growth with cash flow from operations, availability under our revolving credit facility and capital markets offerings when appropriate. We intend to allocate capital in a disciplined manner and proactively manage our cost structure to achieve our business objectives. We expect to maintain an active hedging program that seeks to reduce our exposure to commodity price volatility and protect our cash flow. |
Our Competitive Strengths
We believe that the following strengths will help us achieve our business goals:
| • | Attractively positioned in the oil-rich core of the Southern Delaware Basin. Substantially all of our current leasehold acreage is located in the oil-rich southern portion of the Delaware Basin in Reeves, Ward and Pecos counties. The majority of our properties are in Reeves County, which is the second most active county in the United States in horizontal drilling with 21 horizontal rigs running as of June 17, |
6
Table of Contents
| 2016. We believe our multi-year, oil-weighted inventory of horizontal drilling locations provides attractive growth and return opportunities. As of December 31, 2015, our estimated reserves consisted of approximately 71% oil, 12% NGLs and 17% natural gas. The extensive original oil-in-place and other favorable geologic characteristics of the Southern Delaware Basin, along with the established vertical well control present across our acreage, give us a high degree of confidence in our current inventory of horizontal drilling locations. Further, our acreage is in close proximity to extensive infrastructure with long-term transportation agreements in place, which facilitates development. A crude gathering system, which is expected to be operational in the third quarter of 2016, will transport the majority of our crude oil to market at a lower cost than we have experienced historically. For gas gathering and processing, the majority of our gas is processed at a cryogenic plant that is centrally located in our area of operations. As a result of the existing infrastructure, the Permian Basin has historically realized attractive differentials compared to other top U.S. basins. |
| • | Large horizontal drilling inventory across multiple pay zones. We have identified 1,357 undeveloped horizontal drilling locations in five zones across our acreage position in Reeves and Ward counties. Our horizontal drilling inventory includes 366 extended lateral locations that we believe will generate superior economic returns relative to single-section laterals. Based upon our current operated drilling inventory and anticipated development pace, we believe we have over ten years of drilling inventory. In addition, we believe we may be able to identify additional horizontal locations as we conduct future downspacing pilots. Of the initial 1,357 identified horizontal drilling locations, 64 are in the 3rd Bone Spring Sandstone, 398 are in the Upper Wolfcamp A, 329 are in the Lower Wolfcamp A, 300 are in the Wolfcamp B and 266 are in the Wolfcamp C. Future development results achieved by us and offset operators may allow us to expand our location inventory in these intervals to other parts of our leasehold. Furthermore, the 2nd and 3rd Bone Spring shales, which are thought to be geologically analogous to the Middle and Lower Spraberry shales in the Midland Basin, and the Avalon Shale may provide additional future opportunities as offset operators prove up and reduce development risk in those zones. |
| • | Our acreage has been delineated across multiple zones. Our 61 operated horizontal wells span an area approximately 45 miles long by 20 miles wide where we have established commercial production in five distinct zones: the 3rd Bone Spring Sandstone, Upper Wolfcamp A, Lower Wolfcamp A, Wolfcamp B and Wolfcamp C. As a result, we have broadly appraised our acreage across various geographic areas and stratigraphic zones, which we expect will allow us to efficiently develop our drilling inventory with a focus on maximizing returns to our stockholders. In addition, offset operators have continued to successfully drill horizontal wells across our five targeted zones in close proximity to our leasehold, further delineating our acreage position. This delineation of the surrounding acreage by offset operators combined with the consistent performance of our wells provides us with substantial data to make development decisions. |
| • | Proven horizontal drilling expertise and technical acumen in the Delaware Basin. We believe our horizontal drilling experience targeting multiple pay zones in the Delaware Basin provides us with a competitive advantage. Over the past two years, we have substantially reduced drilling days for our Wolfcamp horizontal wells. For the three months ended March 31, 2016, the average spud-to-rig release for our three single-section horizontal wells was 22 days, as compared to 28 days and 46 days for all single-section horizontal wells we drilled in 2015 and 2014, respectively. We expect drilling efficiencies to continue and have continually modified our completion design to optimize the performance of our wells. Furthermore, our technical team has extensive experience developing resources using horizontal drilling in the Permian, Bakken and Niobrara plays over the last decade and has leveraged this experience to enhance the development of our Delaware Basin acreage. |
| • | High degree of operational control. Our significant operational control allows us to execute our development program, with a focus on the timing and allocation of capital expenditures and application of the optimal drilling and completion techniques to efficiently develop our resource base. We believe this flexibility allows us to efficiently develop our current acreage and adjust drilling and completion activity |
7
Table of Contents
| opportunistically for the prevailing commodity price environment. In addition, we believe communication and data exchange with offset operators will reduce the risks associated with drilling the multiple horizontal zones of our acreage. We also believe our significant level of operational control will enable us to implement drilling and completion optimization strategies, such as pad drilling, continued reduction of spud-to-rig release days and tailored completion designs. As of June 15, 2016, approximately 75% of our net acreage in Reeves and Ward counties was either held by production or under continuous drilling provisions. We believe the substantial majority of our operated net acreage in Reeves and Ward counties will be held by production or under continuous drilling provisions by the end of 2017. |
| • | Experienced and incentivized management team. With an average of 28 years of industry experience, our senior management team has a proven track record of building and running successful businesses focused on the development and acquisition of oil and natural gas properties. We believe our team’s experience and expertise in horizontal drilling and completions in unconventional formations across multiple resource plays provides us with a distinct competitive advantage. Additionally, our management team has a significant economic interest in us, which provides a meaningful incentive to increase the value of our business for the benefit of all stockholders. |
| • | Conservatively capitalized balance sheet and strong liquidity profile. After giving effect to this offering and the use of proceeds therefrom, we expect to have no outstanding debt and approximately $ million of cash on the balance sheet. We believe the approximately $ million of availability under our revolving credit facility, cash on hand and cash flow from operations will provide us with sufficient liquidity to execute on our current capital program. |
Formation Transactions
Centennial OpCo. Centennial OpCo (Centennial Resource Production, LLC, formerly named Atlantic Energy Holdings, LLC) is an independent oil and natural gas company formed on August 30, 2012 by its management members, third-party investors and an affiliate of NGP. Centennial OpCo commenced operations following the acquisition of working interests in oil and natural gas properties located in Reeves, Ward and Pecos counties in West Texas, targeting the Delaware Basin portion of the Permian Basin. At the time of that acquisition, Celero also owned a working interest in the majority of these same properties.
Subsequently, in April 2014, NGP contributed its membership interests in Centennial OpCo to Centennial Resource Development, LLC (“Centennial HoldCo”), which was formed by NGP and current members of our management. Centennial HoldCo is a holding company with no independent operations apart from its ownership interests in Centennial OpCo. By August 2014, all of the other members of Centennial OpCo (including its management members) had sold their membership interests in Centennial OpCo to Centennial OpCo or Centennial HoldCo for cash. As a result of these transactions, Centennial OpCo became a wholly-owned subsidiary of Centennial HoldCo.
Celero. Celero is an independent oil and natural gas company that was formed in 2006 to focus on the development and acquisition of oil and natural gas properties in Texas and New Mexico, primarily in the Permian Basin in West Texas. Celero was formed by its general partner, Celero Energy Management, LLC, its management team and NGP. Prior to the Combination, Celero owned non-operated interests in oil and natural gas properties in the Delaware Basin in which Centennial OpCo also has a working interest and substantially all of which were operated by Centennial OpCo.
The Combination. On October 15, 2014, Celero conveyed substantially all of its oil and natural gas properties and other assets to Centennial OpCo in exchange for membership interests in Centennial OpCo. Immediately following the completion of the Combination, Centennial HoldCo owned approximately 72% of Centennial OpCo, and Celero owned the remaining 28%.
8
Table of Contents
Subsequent Capital Raising Activities. In 2015, Centennial OpCo issued additional membership interests to Centennial HoldCo and NGP Centennial Follow-On LLC, a Delaware limited liability company controlled by NGP but the economic interests in which are owned by unaffiliated third party investors and management (“Follow-On”), in exchange for capital contributions. As a result of such capital contributions, Centennial HoldCo, Celero and Follow-On own an approximate 61.1%, 21.2% and 17.6% membership interest in Centennial OpCo, respectively.
Our Corporate Reorganization. Pursuant to the terms of certain reorganization transactions that will be completed prior to the closing of this offering, through a series of steps, we will acquire, directly or indirectly all of the interests in Centennial OpCo currently owned by each of Centennial HoldCo, Celero and Follow-On, in exchange for shares, shares and shares, respectively, of our common stock. As a result of these transactions, we will directly and indirectly wholly own Centennial OpCo. Promptly following the consummation of this offering, Follow-On intends to distribute its shares of our common stock and any cash received in respect of our common stock that it sells in this offering to its members on a pro-rata basis.
Recent Events
Reeves County Leasehold Acquisitions
In June 2016, we closed an acquisition of acreage that is contiguous to our existing acreage position, and in May 2016, we closed a leasehold acquisition in close proximity to our operating area (together, the “Recent Acquisitions”). These assets are comprised primarily of operated acreage, and we believe they increase our inventory of extended laterals. The Recent Acquisitions added approximately 2,400 net acres and 250 Boe/d of production. Thus far in 2016, we have spent approximately $44 million on acquisitions.
Borrowing Base Reaffirmation
The borrowing base under our revolving credit facility depends on, among other things, projected revenues from, and asset values of, the oil and natural gas properties securing our loan. Our borrowing base was $140 million as of March 31, 2016 and was reaffirmed on April 29, 2016. Our next scheduled borrowing base redetermination is expected in the fall of 2016.
Crude Gathering Agreement
In the first quarter of 2016, we entered into a crude gathering and transportation agreement with Oryx Southern Delaware Oil Gathering and Transport LLC, a private midstream company, pursuant to which it will build and operate a crude gathering system that will transport the majority of our crude production to market. The system, which is currently under construction and expected to be operational in the third quarter of 2016, will transport our crude oil to market at a lower cost than we have experienced historically. Under the agreement, we dedicated the majority of our operated acreage but have no volume commitments to the system.
Our Ownership and Organizational Structure
Following our corporate reorganization, our existing investors (the “Existing Investors”) will consist of the following:
| Number of Shares Owned Before this Offering |
Shares to be Offered in this Offering |
Number of Shares Owned After this Offering | ||||
| Existing Investor Name: |
||||||
| Centennial Resource Development, LLC(1) |
||||||
| Celero Energy Company, LP(1) |
||||||
| NGP Centennial Follow-On LLC(2) |
||||||
|
|
|
| ||||
| Total |
||||||
|
|
|
|
9
Table of Contents
| (1) | In connection with this offering, we will enter into a voting agreement with Centennial HoldCo and Celero pursuant to which, among other things, Celero has agreed to vote its shares of our common stock as directed by Centennial HoldCo. See “Certain Relationships and Related Party Transactions—Voting Agreement.” |
| (2) | As part of the reorganization transactions that will be completed prior to the closing of this offering, Follow-On will be recapitalized into a single class of equity with each member of Follow-On, including holders of the Follow-On incentive units, receiving a fixed percentage interest in Follow-On based on the distribution provisions contained in Follow-On’s limited liability company agreement and the implied equity value of Follow-On immediately prior to this offering, based on the aggregate number of shares of our common stock to be issued to Follow-On in connection with our corporate reorganization and the initial public offering price of our common stock in this offering. Promptly following the consummation of this offering, Follow-On intends to distribute all of its shares of our common stock and any cash received in respect of shares of our common stock it sells in this offering to its members on a pro-rata basis and then dissolve. See footnote (5) in “Principal and Selling Stockholders” for information regarding Follow-On’s members who are officers or directors of the Company or are expected to beneficially own more than 5% of our outstanding common stock after this offering. |
Ownership Structure After Giving Effect to Our Corporate Reorganization and This Offering
The following diagram indicates our ownership structure after giving effect to our corporate reorganization and this offering (assuming that the underwriters’ option to purchase additional shares is not exercised).
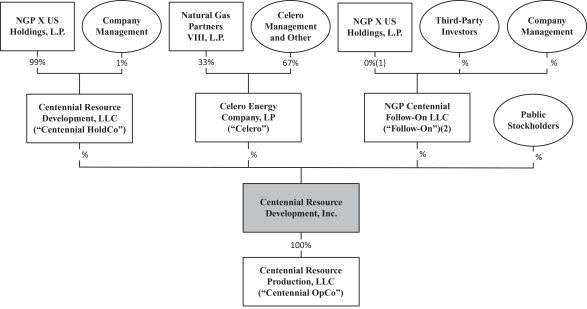
| (1) | NGP X US Holdings, L.P. serves as the managing member of Follow-On and does not own any economic interest in Follow-On. |
| (2) | As part of the reorganization transactions that will be completed prior to the closing of this offering, Follow-On will be recapitalized into a single class of equity with each member of Follow-On, including holders of the Follow-On incentive units, receiving a fixed percentage interest in Follow-On based on the distribution provisions contained in Follow-On’s limited liability company agreement and the implied equity value of Follow-On immediately prior to this offering, based on the aggregate number of shares of our common stock to be issued to Follow-On in connection with our corporate reorganization and the initial public offering price of our common stock in this offering. Promptly following the consummation of this offering, |
10
Table of Contents
| Follow-On intends to distribute all of its shares of our common stock and any cash received in respect of shares of our common stock it sells in this offering to its members on a pro-rata basis and then dissolve. See footnote (5) in “Principal and Selling Stockholders” for information regarding Follow-On’s members who are officers or directors of the Company or are expected to beneficially own more than 5% of our outstanding common stock after this offering. |
Risk Factors
Investing in our common stock involves risks that include the speculative nature of oil and natural gas development and production, competition, volatile oil, natural gas and NGL prices and other material factors. You should read carefully the section of this prospectus entitled “Risk Factors” for an explanation of these risks before investing in our common stock. In particular, the following considerations may offset our competitive strengths or have a negative effect on our strategy or operating activities, which could cause a decrease in the price of our common stock and a loss of all or part of your investment:
| • | Oil, natural gas and NGL prices are volatile. A sustained decline in oil, natural gas and NGL prices could adversely affect our business, financial condition and results of operations and our ability to meet our capital expenditure obligations and financial commitments. |
| • | Our development and acquisition projects require substantial capital that we may be unable to obtain, which could lead to a decline in our ability to access or grow production and reserves. |
| • | Our estimated reserves are based on many assumptions that may turn out to be inaccurate. Any material inaccuracies in these reserve estimates or underlying assumptions will materially affect the quantities and present values of our reserves. |
| • | Our producing properties are located in the Delaware Basin, a sub-basin of the Permian Basin, in West Texas, making us vulnerable to risks associated with a concentration of operations in a single geographic area. |
| • | Development of our PUDs may take longer and may require higher levels of capital expenditures than we currently anticipate. Therefore, our estimated PUDs may not be ultimately developed or produced. |
| • | If commodity prices decrease to a level such that our future undiscounted cash flows from our properties are less than their carrying value, we may be required to take write-downs of the carrying values of our properties. |
| • | Our future cash flows and results of operations are highly dependent on our ability to find, develop or acquire additional oil and natural gas reserves. |
| • | We depend upon several significant purchasers for the sale of most of our oil, natural gas and NGL production. The loss of one or more of these purchasers could adversely affect our revenues in the short-term. |
| • | Our operations are subject to operational hazards for which we may not be adequately insured. |
| • | Our business is difficult to evaluate because we have a limited operating history, and we are susceptible to the potential difficulties associated with rapid growth and expansion. |
| • | Our operations are subject to various governmental regulations that require compliance that can be burdensome and expensive and adversely affect the feasibility of conducting our operations. |
| • | Any failure by us to comply with applicable environmental laws and regulations, including those relating to hydraulic fracturing, could result in governmental authorities taking actions that adversely affect our operations and financial condition. |
11
Table of Contents
| • | NGP, through Centennial HoldCo and Celero, will hold approximately % of our common stock after this offering, assuming no exercise of the underwriters’ option to purchase additional shares of our common stock, and their interests may conflict with yours. |
| • | We expect to be a “controlled company” within the meaning of the rules of the NASDAQ Global Select Market (the “NASDAQ”) and, as a result, will qualify for, and intend to rely on, exemptions from certain corporate governance requirements. |
Emerging Growth Company
We are an “emerging growth company” as defined in the Jumpstart Our Business Startups Act (the “JOBS Act”). For as long as we are an emerging growth company, unlike public companies that are not emerging growth companies under the JOBS Act, we will not be required to:
| • | provide an auditor’s attestation report on management’s assessment of the effectiveness of our system of internal control over financial reporting pursuant to Section 404(b) of the Sarbanes-Oxley Act of 2002; |
| • | provide more than two years of audited financial statements and related management’s discussion and analysis of financial condition and results of operations; |
| • | comply with any new requirements adopted by the Public Company Accounting Oversight Board (the “PCAOB”) requiring mandatory audit firm rotation or a supplement to the auditor’s report in which the auditor would be required to provide additional information about the audit and the financial statements of the issuer; |
| • | provide certain disclosures regarding executive compensation required of larger public companies or hold stockholder advisory votes on the executive compensation required by the Dodd-Frank Wall Street Reform and Consumer Protection Act (the “Dodd-Frank Act”); or |
| • | obtain stockholder approval of any golden parachute payments not previously approved. |
We will cease to be an emerging growth company upon the earliest of:
| • | the last day of the fiscal year in which we have $1.0 billion or more in annual revenues; |
| • | the date on which we become a “large accelerated filer” (the fiscal year-end on which the total market value of our common equity securities held by non-affiliates is $700 million or more as of June 30); |
| • | the date on which we issue more than $1.0 billion of non-convertible debt over a three-year period; or |
| • | the last day of the fiscal year following the fifth anniversary of our initial public offering. |
In addition, Section 107 of the JOBS Act provides that an emerging growth company can take advantage of the extended transition period provided in Section 7(a)(2)(B) of the Securities Act of 1933, as amended (the “Securities Act”), for complying with new or revised accounting standards, but we hereby irrevocably opt out of the extended transition period and, as a result, we will adopt new or revised accounting standards on the relevant dates in which adoption of such standards is required for other public companies.
Principal Executive Offices and Internet Address
Our principal executive offices are located at 1401 17th Street, Suite 1000, Denver, Colorado 80202, and our telephone number at that address is (720) 441-5515. We lease additional office space in Midland, Texas.
Our website address is . We expect to make our periodic reports and other information filed with or furnished to the Securities and Exchange Commission (the “SEC”), available free of charge through our website as soon as reasonably practicable after those reports and other information are electronically filed with or furnished to the SEC. Information on our website or any other website is not incorporated by reference into, and does not constitute a part of, this prospectus.
12
Table of Contents
The Offering
| Issuer |
Centennial Resource Development, Inc. |
| Common stock offered by us |
shares. |
| Common stock offered by the selling stockholders |
shares (or shares, if the underwriters exercise in full their option to purchase additional shares). |
| Common stock outstanding after this offering |
shares. |
| Option to purchase additional shares |
The selling stockholders have granted the underwriters a 30-day option to purchase up to an aggregate of additional shares of our common stock to the extent the underwriters sell more than shares of common stock in this offering. |
| Use of proceeds |
We expect to receive approximately $ million of net proceeds, based upon the assumed initial public offering price of $ per share (the midpoint of the price range set forth on the cover page of this prospectus), after deducting underwriting discounts and estimated offering expenses payable by us. Each $1.00 increase (decrease) in the public offering price would increase (decrease) our net proceeds by approximately $ million. |
| We intend to use a portion of the net proceeds from this offering to fully repay our $65.0 million term loan and the outstanding indebtedness under our revolving credit facility and the remaining net proceeds for general corporate purposes, including to fund our 2016, 2017 and 2018 capital expenditures. As June 30, 2016, we had $ million of outstanding borrowings under our revolving credit facility. We will not receive any proceeds from the sale of shares by the selling stockholders. Please read “Use of Proceeds.” |
| Dividend policy |
We do not anticipate paying any cash dividends on our common stock. In addition, our credit agreement places certain restrictions on our ability to pay cash dividends. Please read “Dividend Policy.” |
| Directed share program |
The underwriters have reserved for sale at the initial public offering price up to % of the common stock being offered by this prospectus for sale to our employees, executive officers, directors, business associates and related persons who have expressed an interest in purchasing common stock in this offering. We do not know if these persons will choose to purchase all or any portion of these reserved shares, but any purchases they do make will reduce the number of shares available to the general public. Please read “Underwriting.” |
13
Table of Contents
| Listing and trading symbol |
We have applied to list our common stock on the NASDAQ under the symbol “CDEV.” |
| Risk factors |
You should carefully read and consider the information set forth under the heading “Risk Factors” and all other information set forth in this prospectus before deciding to invest in our common stock. |
The information above does not include shares of common stock reserved for issuance pursuant to the 2016 Long Term Incentive Plan (as defined in “Executive Compensation—2016 Long Term Incentive Plan”).
14
Table of Contents
Summary Historical Financial Data
Centennial Resource Development, Inc. was formed as a holding company in October 2014 and has not had any operations since its formation. Accordingly, Centennial Resource Development, Inc. does not have historical financial operating results. The following table shows summary historical consolidated and combined financial data, for the periods and as of the dates indicated, of Centennial Resource Development, Inc.‘s accounting predecessor. For all periods ending on or prior to and all dates as of or prior to the consummation of the Combination on October 15, 2014, the accounting predecessor reflects the combined results of Centennial OpCo and Celero, and for all periods and dates subsequent to October 15, 2014, the accounting predecessor reflects the results of Centennial OpCo. Due to the factors described in “Management’s Discussion and Analysis of Financial Condition and Results of Operations—Factors Affecting the Comparability of Our Results of Operations to the Historical Results of Operations of Our Predecessor,” our future results of operations will not be comparable to the historical results of our predecessor. For more information regarding our predecessor, see “Management’s Discussion and Analysis of Financial Condition and Results of Operations—Our Predecessor and Centennial Resource Development, Inc.”
The summary historical consolidated and combined financial data of our predecessor as of and for the years ended December 31, 2015 and 2014 were derived from the audited historical consolidated and combined financial statements of our predecessor included elsewhere in this prospectus. The summary historical interim consolidated financial data of our predecessor as of March 31, 2016 and for the three months ended March 31, 2016 and 2015 were derived from the unaudited interim condensed consolidated financial statements of our predecessor included elsewhere in this prospectus.
15
Table of Contents
Our historical results are not necessarily indicative of future operating results. You should read the following table in conjunction with “Use of Proceeds,” “Capitalization,” “Management’s Discussion and Analysis of Financial Condition and Results of Operations,” “Recent and Formation Transactions,” the historical consolidated and combined financial statements of our predecessor and accompanying notes included elsewhere in this prospectus.
| Our Predecessor | ||||||||||||||||
| Three Months Ended March 31, |
Year Ended December 31, |
|||||||||||||||
| 2016 | 2015 | 2015 | 2014 | |||||||||||||
| (Unaudited) | ||||||||||||||||
| (In thousands, except per share data) | ||||||||||||||||
| Statement of Operations Data: |
||||||||||||||||
| Revenues: |
||||||||||||||||
| Oil sales |
$ | 13,226 | $ | 21,066 | $ | 77,643 | $ | 114,955 | ||||||||
| Natural gas sales |
1,313 | 1,963 | 7,965 | 9,670 | ||||||||||||
| NGL sales |
582 | 1,387 | 4,852 | 7,200 | ||||||||||||
|
|
|
|
|
|
|
|
|
|||||||||
| Total revenues |
15,121 | 24,416 | 90,460 | 131,825 | ||||||||||||
|
|
|
|
|
|
|
|
|
|||||||||
| Operating expenses: |
||||||||||||||||
| Lease operating expenses |
4,042 | 6,497 | 21,173 | 17,690 | ||||||||||||
| Severance and ad valorem taxes |
844 | 1,193 | 5,021 | 6,875 | ||||||||||||
| Transportation, processing, gathering and other operating expenses |
1,130 | 1,283 | 5,732 | 4,772 | ||||||||||||
| Depreciation, depletion, amortization and accretion of asset retirement obligations |
21,303 | 23,230 | 90,084 | 69,110 | ||||||||||||
| Abandonment expense and impairment of unproved properties |
— | — | 7,619 | 20,025 | ||||||||||||
| Exploration |
— | — | 84 | — | ||||||||||||
| Contract termination and rig stacking |
— | 1,540 | 2,387 | — | ||||||||||||
| General and administrative expenses |
2,536 | 2,913 | 14,206 | 31,694 | ||||||||||||
|
|
|
|
|
|
|
|
|
|||||||||
| Total operating expenses |
29,855 | 36,656 | 146,306 | 150,166 | ||||||||||||
|
|
|
|
|
|
|
|
|
|||||||||
| Loss (gain) on sale of oil and natural gas properties |
4 | (2,675 | ) | (2,439 | ) | 2,096 | ||||||||||
|
|
|
|
|
|
|
|
|
|||||||||
| Total operating loss |
(14,738 | ) | (9,565 | ) | (53,407 | ) | (20,437 | ) | ||||||||
|
|
|
|
|
|
|
|
|
|||||||||
| Other income (expense): |
||||||||||||||||
| Interest expense |
(1,641 | ) | (1,526 | ) | (6,266 | ) | (2,475 | ) | ||||||||
| Gain on derivatives instruments |
1,918 | 5,154 | 20,756 | 41,943 | ||||||||||||
| Other income |
— | — | 20 | 281 | ||||||||||||
|
|
|
|
|
|
|
|
|
|||||||||
| Total other income |
277 | 3,628 | 14,510 | 39,749 | ||||||||||||
|
|
|
|
|
|
|
|
|
|||||||||
| (Loss) income before taxes |
(14,461 | ) | (5,937 | ) | (38,897 | ) | 19,312 | |||||||||
| Income tax benefit (expense) |
— | — | 572 | (1,524 | ) | |||||||||||
|
|
|
|
|
|
|
|
|
|||||||||
| Net (loss) income |
(14,461 | ) | (5,937 | ) | (38,325 | ) | 17,788 | |||||||||
| Less: Net loss attributable to noncontrolling interest |
— | — | — | (2 | ) | |||||||||||
|
|
|
|
|
|
|
|
|
|||||||||
| Net (loss) income |
$ | (14,461 | ) | $ | (5,937 | ) | $ | (38,325 | ) | $ | 17,790 | |||||
|
|
|
|
|
|
|
|
|
|||||||||
| Pro Forma Per Share Data (Unaudited)(1): |
||||||||||||||||
| Net loss per common share: |
||||||||||||||||
| Basic and diluted |
$ | $ | ||||||||||||||
| Weighted average common shares outstanding: |
||||||||||||||||
| Basic and diluted |
||||||||||||||||
| Cash Flow Data: |
||||||||||||||||
| Net cash provided by operating activities |
$ | 18,552 | $ | 27,632 | $ | 68,882 | $ | 97,248 | ||||||||
| Net cash used in investing activities |
(22,419 | ) | (79,006 | ) | (198,635 | ) | (163,380 | ) | ||||||||
| Net cash provided by financing activities |
2,197 | 38,913 | 118,504 | 36,966 | ||||||||||||
| Other Financial Data: |
||||||||||||||||
| Adjusted EBITDAX(2) |
$ | 15,198 | $ | 22,259 | $ | 82,279 | $ | 88,108 | ||||||||
16
Table of Contents
| (1) | The net loss per common share and weighted average common shares outstanding reflect the estimated number of shares of common stock we expect to have outstanding upon the completion of the corporate reorganization described under “Recent and Formation Transactions—Formation Transactions—Our Corporate Reorganization” and this offering. The pro forma per share data also reflects additional pro forma income tax benefit of $5.1 million and $13.6 million for the three months ended March 31, 2016 and the year ended December 31, 2015 associated with the income tax effects of the corporate reorganization described under “Recent and Formation Transactions—Formation Transactions—Our Corporate Reorganization” or this offering. Centennial Resource Development, Inc. is a Subchapter C corporation (“C-corp”) under the Internal Revenue Code of 1986, as amended (the “Code”), and as a result, will be subject to U.S. federal, state and local income taxes. Although our predecessor was subject to franchise tax in the State of Texas, it generally passed through its taxable income to its owners for other income tax purposes and thus was not subject to U.S. federal income taxes or other state or local income taxes. |
| (2) | Adjusted EBITDAX is a non-GAAP financial measure. For a definition of Adjusted EBITDAX and a reconciliation of Adjusted EBITDAX to net income, see “—Non-GAAP Financial Measure” below. |
| Our Predecessor | ||||||||||||
| March 31, 2016 |
December 31, | |||||||||||
| 2015 | 2014 | |||||||||||
| (Unaudited) | ||||||||||||
| (In thousands) | ||||||||||||
| Balance Sheet Data: |
||||||||||||
| Cash and cash equivalents |
$ | 98 | $ | 1,768 | $ | 13,017 | ||||||
| Other current assets |
22,153 | 32,377 | 54,329 | |||||||||
|
|
|
|
|
|
|
|||||||
| Total current assets |
22,251 | 34,145 | 67,346 | |||||||||
|
|
|
|
|
|
|
|||||||
| Total property and equipment, net |
579,863 | 578,787 | 540,624 | |||||||||
| Other long-term assets |
2,953 | 3,363 | 7,799 | |||||||||
|
|
|
|
|
|
|
|||||||
| Total assets |
$ | 605,067 | $ | 616,295 | $ | 615,769 | ||||||
|
|
|
|
|
|
|
|||||||
| Current liabilities |
$ | 22,146 | $ | 22,133 | $ | 103,512 | ||||||
| Revolving credit facility |
77,000 | 74,000 | 65,000 | |||||||||
| Term loan, net of unamortized financing costs |
64,687 | 64,649 | 64,568 | |||||||||
| Other long-term liabilities |
4,831 | 4,649 | 4,757 | |||||||||
|
|
|
|
|
|
|
|||||||
| Total liabilities |
168,664 | 165,431 | 237,837 | |||||||||
| Owners’ equity |
436,403 | 450,864 | 377,932 | |||||||||
|
|
|
|
|
|
|
|||||||
| Total liabilities and owners’ equity |
$ | 605,067 | $ | 616,295 | $ | 615,769 | ||||||
|
|
|
|
|
|
|
|||||||
Non-GAAP Financial Measure
Adjusted EBITDAX is a supplemental non-GAAP financial measure that is used by management and external users of our financial statements, such as industry analysts, investors, lenders and rating agencies. We define Adjusted EBITDAX as net income (loss) before interest expense, income taxes, depreciation, depletion and amortization and accretion of asset retirement obligations, abandonment expense and impairment of unproved properties, (gains) losses on derivatives excluding net cash receipts (payments) on settled derivatives, non-cash equity based compensation, gains and losses from the sale of assets and other non-cash and non-recurring operating items. Adjusted EBITDAX is not a measure of net income as determined by United States generally accepted accounting principles (“GAAP”).
Management believes Adjusted EBITDAX is useful because it allows them to more effectively evaluate our operating performance and compare the results of our operations from period to period and against our peers without regard to our financing methods or capital structure. We exclude the items listed above from net income in arriving at Adjusted EBITDAX because these amounts can vary substantially from company to company within our industry depending upon accounting methods and book values of assets, capital structures and the method by which the assets were acquired. Adjusted EBITDAX should not be considered as an alternative to, or more meaningful than, net income as determined in accordance with GAAP or as an indicator of our operating performance or liquidity. Certain items excluded from Adjusted EBITDAX are significant components in
17
Table of Contents
understanding and assessing a company’s financial performance, such as a company’s cost of capital and tax structure, as well as the historic costs of depreciable assets, none of which are components of Adjusted EBITDAX. Our presentation of Adjusted EBITDAX should not be construed as an inference that our results will be unaffected by unusual or non-recurring items. Our computations of Adjusted EBITDAX may not be comparable to other similarly titled measures of other companies.
The following table presents a reconciliation of Adjusted EBITDAX to net income, our most directly comparable financial measure calculated and presented in accordance with GAAP.
| Our Predecessor | ||||||||||||||||
| Three Months Ended March 31, |
Year Ended December 31, |
|||||||||||||||
| 2016 | 2015 | 2015 | 2014 | |||||||||||||
| (In thousands) | ||||||||||||||||
| Adjusted EBITDAX reconciliation to net income: |
||||||||||||||||
| Net (loss) income |
$ | (14,461 | ) | $ | (5,937 | ) | $ | (38,325 | ) | $ | 17,790 | |||||
| Interest expense |
1,641 | 1,526 | 6,266 | 2,475 | ||||||||||||
| Income tax (benefit) expense |
— | — | (572 | ) | 1,524 | |||||||||||
| Depreciation, depletion and amortization and accretion of asset retirement obligations |
21,303 | 23,230 | 90,084 | 69,110 | ||||||||||||
| Abandonment expense and impairment of unproved properties |
— | — | 7,619 | 20,025 | ||||||||||||
| Gain on derivatives |
(1,918 | ) | (5,154 | ) | (20,756 | ) | (41,943 | ) | ||||||||
| Net cash receipts on settled derivatives |
8,629 | 9,729 | 36,430 | 4,611 | ||||||||||||
| Non-cash equity based compensation |
— | — | — | 12,420 | ||||||||||||
| Contract termination and rig stacking |
— | 1,540 | 2,387 | — | ||||||||||||
| Write-off of deferred offering costs(1) |
— | — | 1,585 | |||||||||||||
| Loss (gain) on sale of assets |
4 | (2,675 | ) | (2,439 | ) | 2,096 | ||||||||||
|
|
|
|
|
|
|
|
|
|||||||||
| Adjusted EBITDAX |
$ | 15,198 | $ | 22,259 | $ | 82,279 | $ | 88,108 | ||||||||
|
|
|
|
|
|
|
|
|
|||||||||
| (1) | During the year ended December 31, 2015, we delayed the timing of this offering and, as a result, deferred offering costs of $1.6 million were charged against earnings. |
18
Table of Contents
Summary Historical Reserve and Operating Data
The following tables present, for the periods and as of the dates indicated, summary data with respect to our estimated net proved oil and natural gas reserves and operating data.
The reserve estimates attributable to our properties as of December 31, 2015 presented in the table below are based on a reserve report prepared by NSAI, our independent petroleum engineer. All of these reserve estimates were prepared in accordance with the SEC’s rules regarding oil and natural gas reserve reporting that are currently in effect. The following tables also contain summary unaudited information regarding production and sales of oil, natural gas and NGLs with respect to such properties.
Please read “Management’s Discussion and Analysis of Financial Condition and Results of Operations” and “Business—Oil and Natural Gas Data—Proved Reserves” in evaluating the material presented below.
| As of December 31, 2015(1) |
||||
| Proved Reserves: |
||||
| Oil (MBbls) |
23,199 | |||
| Natural gas (MMcf) |
32,442 | |||
| NGLs (MBbls) |
3,851 | |||
|
|
|
|||
| Total proved reserves (MBoe) |
32,457 | |||
| Proved Developed Reserves: |
||||
| Oil (MBbls) |
9,347 | |||
| Natural gas (MMcf) |
12,711 | |||
| NGLs (MBbls) |
1,603 | |||
|
|
|
|||
| Total proved developed reserves (MBoe) |
13,068 | |||
| Proved developed reserves as a percentage of total proved reserves |
40 | % | ||
| Proved Undeveloped Reserves: |
||||
| Oil (MBbls) |
13,852 | |||
| Natural gas (MMcf) |
19,731 | |||
| NGLs (MBbls) |
2,248 | |||
|
|
|
|||
| Total proved undeveloped reserves (MBoe) |
19,389 | |||
| Oil and Natural Gas Prices: |
||||
| Oil—WTI posted price per Bbl |
$ | 46.79 | ||
| Natural gas—Henry Hub spot price per MMBtu |
$ | 2.59 | ||
| (1) | Our estimated net proved reserves were determined using average first-day-of-the-month prices for the prior 12 months in accordance with SEC guidance. For oil and NGL volumes, the average West Texas Intermediate posted price of $46.79 per barrel as of December 31, 2015 was adjusted for quality, transportation fees and a regional price differential. For gas volumes, the average Henry Hub spot price of $2.59 per MMBtu as of December 31, 2015 was adjusted for energy content, transportation fees and a regional price differential. All prices are held constant throughout the lives of the properties. The average adjusted product prices weighted by production over the remaining lives of the properties are $41.85 per barrel of oil, $13.94 per barrel of NGL and $1.71 per Mcf of gas as of December 31, 2015. |
19
Table of Contents
| Our Predecessor | ||||||||
| Three Months Ended March 31, 2016 |
Year Ended December 31, 2015 |
|||||||
| Production and Operating Data: |
||||||||
| Net Production Volumes(1): |
||||||||
| Oil (MBbls) |
470 | 1,830 | ||||||
| Natural gas (MMcf) |
698 | 3,058 | ||||||
| NGLs (MBbls) |
70 | 331 | ||||||
|
|
|
|
|
|||||
| Total (MBoe) |
656 | 2,671 | ||||||
|
|
|
|
|
|||||
| Average net daily production (Boe/d) |
7,212 | 7,317 | ||||||
| Average Sales Prices: |
||||||||
| Oil (per Bbl) (excluding impact of cash settled derivatives) |
$ | 28.14 | $ | 42.43 | ||||
| Oil (per Bbl) (after impact of cash settled derivatives) |
46.50 | 61.61 | ||||||
| Natural gas (per Mcf) (excluding impact of cash settled derivatives) |
1.88 | 2.60 | ||||||
| Natural gas (per Mcf) (after impact of cash settled derivatives) |
1.88 | 3.04 | ||||||
| NGLs (per Bbl) |
8.31 | 14.66 | ||||||
|
|
|
|
|
|||||
| Total (per Boe) (excluding impact of cash settled derivatives) |
23.05 | 33.87 | ||||||
| Total (per Boe) (after impact of cash settled derivatives) |
36.20 | 47.51 | ||||||
| Average Unit Costs per Boe: |
||||||||
| Lease operating expenses |
$ | 6.16 | $ | 7.93 | ||||
| Severance and ad valorem taxes |
1.29 | 1.88 | ||||||
| Transportation, processing, gathering and other operating expenses |
1.72 | 2.15 | ||||||
| Depreciation, depletion, amortization, and accretion of asset retirement obligations |
32.47 | 33.73 | ||||||
| Abandonment expense and impairment of unproved properties |
— | 2.85 | ||||||
| Exploration |
— | 0.03 | ||||||
| Contract termination and rig stacking |
— | 0.89 | ||||||
| General and administrative expenses(2) |
3.87 | 5.32 | ||||||
| (1) | Totals may not sum or recalculate due to rounding. |
| (2) | General and administrative expenses do not include additional expenses we would have incurred as a result of being a public company. |
20
Table of Contents
Investing in our common stock involves risks. You should carefully consider the information in this prospectus, including the matters addressed under “Cautionary Statement Regarding Forward-Looking Statements,” and the following risks before making an investment decision. The trading price of our common stock could decline due to any of these risks, and you may lose all or part of your investment.
Risks Related to Our Business
Oil, natural gas and NGL prices are volatile. A sustained decline in oil, natural gas and NGL prices could adversely affect our business, financial condition and results of operations and our ability to meet our capital expenditure obligations and financial commitments.
The prices we receive for our oil, natural gas and NGL production heavily influence our revenue, profitability, access to capital, future rate of growth and carrying value of our properties. Oil, natural gas and NGLs are commodities, and their prices may fluctuate widely in response to relatively minor changes in the supply of and demand for oil, natural gas and NGLs and market uncertainty. Historically, oil, natural gas and NGL prices have been volatile. For example, during the period from January 1, 2014 through May 31, 2016, the WTI spot price for oil has declined from a high of $107.62 per Bbl on July 23, 2014 to $26.21 per Bbl on February 11, 2016, and the Henry Hub spot price for natural gas has declined from a high of $7.92 per MMBtu on March 4, 2014 to a low of $1.49 per MMBtu on March 4, 2016. Likewise, NGLs, which are made up of ethane, propane, isobutene, normal butane and natural gasoline, all of which have different uses and different pricing characteristics, have suffered significant recent declines in realized prices. The prices we receive for our production, and the levels of our production, depend on numerous factors beyond our control, which include the following:
| • | worldwide and regional economic conditions impacting the global supply and demand for oil, natural gas and NGLs; |
| • | the price and quantity of foreign imports of oil, natural gas and NGLs; |
| • | political and economic conditions in or affecting other producing regions or countries, including the Middle East, Africa, South America and Russia; |
| • | actions of the Organization of the Petroleum Exporting Countries, its members and other state-controlled oil companies relating to oil price and production controls; |
| • | the level of global exploration, development and production; |
| • | the level of global inventories; |
| • | prevailing prices on local price indexes in the area in which we operate; |
| • | the proximity, capacity, cost and availability of gathering and transportation facilities; |
| • | localized and global supply and demand fundamentals and transportation availability; |
| • | the cost of exploring for, developing, producing and transporting reserves; |
| • | weather conditions and other natural disasters; |
| • | technological advances affecting energy consumption; |
| • | the price and availability of alternative fuels; |
| • | expectations about future commodity prices; and |
| • | U.S. federal, state and local and non-U.S. governmental regulation and taxes. |
21
Table of Contents
In the second half of 2014, oil prices began a rapid and significant decline as the global oil supply began to outpace demand. During 2015 and thus far in 2016, the global oil supply has continued to outpace demand, resulting in a sustained decline in realized prices for oil production. In general, this imbalance between supply and demand reflects the significant supply growth achieved in the United States as a result of shale drilling and oil production increases by certain other countries, including Russia and Saudi Arabia, as part of an effort to retain market share, combined with only modest demand growth in the United States and less-than-expected demand in other parts of the world, particularly in Europe and China. Although there has been a dramatic decrease in drilling activity in the industry, oil storage levels in the United States remain at historically high levels. Until supply and demand balance and the overhang in storage levels begins to decline, prices are expected to remain under pressure. In addition, the lifting of economic sanctions on Iran has resulted in increasing supplies of oil from Iran, adding further downward pressure to oil prices. NGL prices generally correlate to the price of oil. Also adversely affecting the price for NGLs is the supply of NGLs in the United States, which has continued to grow due to an increase in industry participants targeting projects that produce NGLs in recent years. Prices for domestic natural gas began to decline during the third quarter of 2014 and have continued to be weak throughout 2015 and thus far in 2016. The declines in natural gas prices are primarily due to an imbalance between supply and demand across North America. The duration and magnitude of the commodity price declines cannot be accurately predicted. Compared to 2014, our realized oil price for 2015 fell 47.3% to $42.43 per barrel, and our realized oil price for the three months ended March 31, 2016 has further decreased to $28.14 per barrel. Similarly, our realized natural gas price for 2015 dropped 43.2% to $2.60 per Mcf and our realized price for NGLs declined 52.2% to $14.66 per barrel. For the three months ended March 31, 2016, our realized price for natural gas was $1.88 per Mcf and our realized price for NGLs was $8.31 per barrel.
Lower commodity prices may reduce our cash flows and borrowing ability. If we are unable to obtain needed capital or financing on satisfactory terms, our ability to develop future reserves could be adversely affected. Also, using lower prices in estimating proved reserves may result in a reduction in proved reserve volumes due to economic limits. In addition, sustained periods with oil and natural gas prices at levels lower than current West Texas Intermediate or Henry Hub strip prices and the resultant effect such prices may have on our drilling economics and our ability to raise capital may require us to re-evaluate and postpone or eliminate our development drilling, which could result in the reduction of some of our proved undeveloped reserves and related standardized measure. If we are required to curtail our drilling program, we may be unable to continue to hold leases that are scheduled to expire, which may further reduce our reserves. As a result, a substantial or extended decline in commodity prices may materially and adversely affect our future business, financial condition, results of operations, liquidity and ability to finance planned capital expenditures.
Our development and acquisition projects require substantial capital expenditures. We may be unable to obtain required capital or financing on satisfactory terms, which could lead to a decline in our ability to access or grow production and reserves.
The oil and natural gas industry is capital-intensive. We make and expect to continue to make substantial capital expenditures related to our development and acquisition projects. Our 2016 capital budget for drilling, completion, recompletion activities and facilities costs is approximately $87 million, excluding leasing and other acquisitions. We expect to fund our 2016 capital expenditures with cash generated by operations, borrowings under our revolving credit facility and a portion of the proceeds from this offering; however, our financing needs may require us to alter or increase our capitalization substantially through the issuance of debt or equity securities or the sale of assets. The issuance of additional indebtedness would require that a portion of our cash flow from operations be used for the payment of interest and principal on our indebtedness, thereby reducing our ability to use cash flow from operations to fund working capital, capital expenditures and acquisitions. The issuance of additional equity securities would be dilutive to our other stockholders. The actual amount and timing of our future capital expenditures may differ materially from our estimates as a result of, among other things, oil, natural gas and NGL prices; actual drilling results; the availability of drilling rigs and other services and equipment; and regulatory, technological and competitive developments. A reduction in commodity prices from current levels may result in a decrease in our actual capital expenditures, which would negatively impact our ability to grow production.
22
Table of Contents
Our cash flow from operations and access to capital are subject to a number of variables, including:
| • | the prices at which our production is sold; |
| • | our proved reserves; |
| • | the level of hydrocarbons we are able to produce from existing wells; |
| • | our ability to acquire, locate and produce new reserves; |
| • | the levels of our operating expenses; and |
| • | our ability to borrow under our revolving credit facility and our ability to access the capital markets. |
If our revenues or the borrowing base under our revolving credit facility decrease as a result of lower oil, natural gas and NGL prices, operating difficulties, declines in reserves or for any other reason, we may have limited ability to obtain the capital necessary to sustain our operations at current levels. If additional capital is needed, we may not be able to obtain debt or equity financing on terms acceptable to us, if at all. For a period of 180 days following the date of this prospectus, we will not be able to sell any shares of our common stock, whether pursuant to a private or public offering, without the prior written consent of Credit Suisse Securities (USA) LLC. See “Underwriting” for more information. If cash flow generated by our operations or available borrowings under our revolving credit facility are not sufficient to meet our capital requirements, the failure to obtain additional financing could result in a curtailment of our operations relating to development of our properties, which in turn could lead to a decline in our reserves and production, and could materially and adversely affect our business, financial condition and results of operations.
Part of our strategy involves using some of the latest available horizontal drilling and completion techniques, which involve risks and uncertainties in their application.
Our operations involve utilizing some of the latest drilling and completion techniques as developed by us and our service providers. Risks that we face while drilling horizontal wells include the following:
| • | landing our wellbore in the desired drilling zone; |
| • | staying in the desired drilling zone while drilling horizontally through the formation; |
| • | running our casing the entire length of the wellbore; and |
| • | being able to run tools and other equipment consistently through the horizontal wellbore. |
Risks that we face while completing our wells include the following:
| • | the ability to fracture stimulate the planned number of stages; |
| • | the ability to run tools the entire length of the wellbore during completion operations; and |
| • | the ability to successfully clean out the wellbore after completion of the final fracture stimulation stage. |
In addition, certain of the new techniques we are adopting may cause irregularities or interruptions in production due to offset wells being shut in and the time required to drill and complete multiple wells before any such wells begin producing. Furthermore, the results of our drilling in new or emerging formations are more uncertain initially than drilling results in areas that are more developed and have a longer history of established production. Newer or emerging formations and areas have limited or no production history and, consequently, we are more limited in assessing future drilling results in these areas. If our drilling results are less than anticipated, the return on our investment for a particular project may not be as attractive as we anticipated, and we could incur material write-downs of unevaluated properties and the value of our undeveloped acreage could decline in the future.
23
Table of Contents
Drilling for and producing oil and natural gas are high risk activities with many uncertainties that could adversely affect our business, financial condition or results of operations.
Our future financial condition and results of operations will depend on the success of our development, acquisition and production activities, which are subject to numerous risks beyond our control, including the risk that drilling will not result in commercially viable oil and natural gas production.
Our decisions to develop or purchase prospects or properties will depend in part on the evaluation of data obtained through geophysical and geological analyses, production data and engineering studies, the results of which are often inconclusive or subject to varying interpretations. For a discussion of the uncertainty involved in these processes, see “—Reserve estimates depend on many assumptions that may turn out to be inaccurate. Any material inaccuracies in reserve estimates or underlying assumptions will materially affect the quantities and present value of our reserves.” In addition, our cost of drilling, completing and operating wells is often uncertain.
Further, many factors may curtail, delay or cancel our scheduled drilling projects, including the following:
| • | delays imposed by or resulting from compliance with regulatory requirements, including limitations resulting from wastewater disposal, emission of greenhouse gases (“GHGs”) and limitations on hydraulic fracturing; |
| • | pressure or irregularities in geological formations; |
| • | shortages of or delays in obtaining equipment and qualified personnel or in obtaining water for hydraulic fracturing activities; |
| • | equipment failures, accidents or other unexpected operational events; |
| • | lack of available gathering facilities or delays in construction of gathering facilities; |
| • | lack of available capacity on interconnecting transmission pipelines; |
| • | adverse weather conditions; |
| • | issues related to compliance with environmental regulations; |
| • | environmental hazards, such as oil and natural gas leaks, oil spills, pipeline and tank ruptures and unauthorized discharges of brine, well stimulation and completion fluids, toxic gases or other pollutants into the surface and subsurface environment; |
| • | declines in oil and natural gas prices; |
| • | limited availability of financing at acceptable terms; |
| • | title problems; and |
| • | limitations in the market for oil and natural gas. |
We may not be able to generate sufficient cash to service all of our indebtedness and may be forced to take other actions to satisfy our obligations under applicable debt instruments, which may not be successful.
Our ability to make scheduled payments on or to refinance our indebtedness obligations, including our term loan and revolving credit facility, depends on our financial condition and operating performance, which are subject to prevailing economic and competitive conditions and certain financial, business and other factors beyond our control. We may not be able to maintain a level of cash flows from operating activities sufficient to permit us to pay the principal, premium, if any, and interest on our indebtedness.
If our cash flows and capital resources are insufficient to fund debt service obligations, we may be forced to reduce or delay investments and capital expenditures, sell assets, seek additional capital or restructure or refinance indebtedness. Our ability to restructure or refinance indebtedness will depend on the condition of the
24
Table of Contents
capital markets and our financial condition at such time. Any refinancing of indebtedness could be at higher interest rates and may require us to comply with more onerous covenants, which could further restrict business operations. The terms of existing or future debt instruments may restrict us from adopting some of these alternatives. In addition, any failure to make payments of interest and principal on outstanding indebtedness on a timely basis would likely result in a reduction of our credit rating, which could harm our ability to incur additional indebtedness. In the absence of sufficient cash flows and capital resources, we could face substantial liquidity problems and might be required to dispose of material assets or operations to meet debt service and other obligations. Our credit agreement currently restricts our ability to dispose of assets and our use of the proceeds from such disposition. We may not be able to consummate those dispositions, and the proceeds of any such disposition may not be adequate to meet any debt service obligations then due. These alternative measures may not be successful and may not permit us to meet scheduled debt service obligations.
Restrictions in our existing and future debt agreements could limit our growth and our ability to engage in certain activities.
Our credit agreement contains a number of significant covenants, including restrictive covenants that may limit our ability to, among other things:
| • | incur additional indebtedness; |
| • | make loans to others; |
| • | make investments; |
| • | merge or consolidate with another entity; |
| • | make certain payments; |
| • | hedge future production or interest rates; |
| • | incur liens; |
| • | sell assets; and |
| • | engage in certain other transactions without the prior consent of the lenders. |
In addition, our credit agreement requires us to maintain certain financial ratios or to reduce our indebtedness if we are unable to comply with such ratios. As of March 31, 2016, we were in full compliance with such financial ratios and covenants.
The restrictions in our credit agreement may also limit our ability to obtain future financings to withstand a future downturn in our business or the economy in general, or to otherwise conduct necessary corporate activities. We may also be prevented from taking advantage of business opportunities that arise because of the limitations that the restrictive covenants under our credit agreement impose on us.
A breach of any covenant in our credit agreement would result in a default under the applicable agreement after any applicable grace periods. A default, if not waived, could result in acceleration of the indebtedness outstanding under our credit agreement and in a default with respect to, and an acceleration of, the indebtedness outstanding under other debt agreements. The accelerated indebtedness would become immediately due and payable. If that occurs, we may not be able to make all of the required payments or borrow sufficient funds to refinance such indebtedness. Even if new financing were available at that time, it may not be on terms that are acceptable to us.
25
Table of Contents
Any significant reduction in our borrowing base under our revolving credit facility as a result of the periodic borrowing base redeterminations or otherwise may negatively impact our ability to fund our operations.
Our revolving credit facility limits the amounts we can borrow up to a borrowing base amount, which the lenders, in their sole discretion, determine semiannually on April 1 and October 1. The borrowing base depends on, among other things, projected revenues from, and asset values of, the oil and natural gas properties securing our loan. The borrowing base will automatically be decreased by an amount equal to 25% of the aggregate notional amount of issued permitted senior unsecured notes unless such decrease is waived by the lenders. The lenders can unilaterally adjust the borrowing base and the borrowings permitted to be outstanding under our revolving credit facility. Any increase in the borrowing base requires the consent of the lenders holding 100% of the commitments. Our borrowing base was $140 million as of March 31, 2016 and was reaffirmed on April 29, 2016. Our next scheduled borrowing base redetermination is expected in the fall of 2016.
In the future, we may not be able to access adequate funding under our revolving credit facility as a result of a decrease in our borrowing base due to the issuance of new indebtedness, the outcome of a subsequent borrowing base redetermination or an unwillingness or inability on the part of lending counterparties to meet their funding obligations and the inability of other lenders to provide additional funding to cover the defaulting lender’s portion. Declines in commodity prices could result in a determination to lower the borrowing base in the future and, in such a case, we could be required to repay any indebtedness in excess of the redetermined borrowing base. As a result, we may be unable to implement our respective drilling and development plan, make acquisitions or otherwise carry out business plans, which would have a material adverse effect on our financial condition and results of operations and impair our ability to service our indebtedness.
Our derivative activities could result in financial losses or could reduce our earnings.
We enter into derivative instrument contracts for a portion of our oil and natural gas production. As of March 31, 2016, we had entered into hedging contracts through December 2018 covering a total of 996 MBbls of our projected oil production. In addition, as of March 31, 2016, we had entered into basis swaps covering a total of 1,071 MBbls of our projected oil production. Accordingly, our earnings may fluctuate significantly as a result of changes in fair value of our derivative instruments.
Derivative instruments also expose us to the risk of financial loss in some circumstances, including when:
| • | production is less than the volume covered by the derivative instruments; |
| • | the counterparty to the derivative instrument defaults on its contractual obligations; |
| • | there is an increase in the differential between the underlying price in the derivative instrument and actual prices received; or |
| • | there are issues with regard to legal enforceability of such instruments. |
The use of derivatives may, in some cases, require the posting of cash collateral with counterparties. If we enter into derivative instruments that require cash collateral and commodity prices or interest rates change in a manner adverse to us, our cash otherwise available for use in our operations would be reduced, which could limit our ability to make future capital expenditures and make payments on our indebtedness, and which could also limit the size of our borrowing base. Future collateral requirements will depend on arrangements with our counterparties, highly volatile oil and natural gas prices and interest rates. In addition, derivative arrangements could limit the benefit we would receive from increases in the prices for oil and natural gas, which could also have a material adverse effect on our financial condition.
Our commodity derivative contracts expose us to risk of financial loss if a counterparty fails to perform under a contract. Disruptions in the financial markets could lead to sudden decreases in a counterparty’s liquidity,
26
Table of Contents
which could make the counterparty unable to perform under the terms of the contract, and we may not be able to realize the benefit of the contract. We are unable to predict sudden changes in a counterparty’s creditworthiness or ability to perform. Even if we do accurately predict sudden changes, our ability to negate the risk may be limited depending upon market conditions.
During periods of declining commodity prices, our derivative contract receivable positions generally increase, which increases our counterparty credit exposure. If the creditworthiness of our counterparties deteriorates and results in their nonperformance, we could incur a significant loss with respect to our commodity derivative contracts.
Reserve estimates depend on many assumptions that may turn out to be inaccurate. Any material inaccuracies in reserve estimates or underlying assumptions will materially affect the quantities and present value of our reserves.
The process of estimating oil and natural gas reserves is complex. It requires interpretations of available technical data and many assumptions, including assumptions relating to current and future economic conditions and commodity prices. Any significant inaccuracies in these interpretations or assumptions could materially affect the estimated quantities and present value of our reserves. In order to prepare reserve estimates, we must project production rates and timing of development expenditures. We must also analyze available geological, geophysical, production and engineering data. The extent, quality and reliability of this data can vary. The process also requires economic assumptions about matters such as oil and natural gas prices, drilling and operating expenses, capital expenditures, taxes and availability of funds.
Actual future production, oil and natural gas prices, revenues, taxes, development expenditures, operating expenses and quantities of recoverable oil and natural gas reserves may vary from our estimates. For instance, initial production rates reported by us or other operators may not be indicative of future or long-term production rates, our recovery efficiencies may be worse than expected, and production declines may be greater than we estimate and may be more rapid and irregular when compared to initial production rates. In addition, we may adjust reserve estimates to reflect additional production history, results of development activities, current commodity prices and other existing factors. Any significant variance could materially affect the estimated quantities and present value of our reserves.
You should not assume that the present value of future net revenues from our reserves is the current market value of our estimated reserves. We generally base the estimated discounted future net cash flows from reserves on prices and costs on the date of the estimate. Actual future prices and costs may differ materially from those used in the present value estimate. For example, our estimated proved reserves as of December 31, 2015 and related standardized measure were calculated under SEC rules using twelve-month trailing average benchmark prices of $46.79 per barrel of oil (WTI) and $2.59 per MMBtu (Henry Hub spot), which, for certain periods in 2016, were substantially higher than the available spot prices. If spot prices are below such calculated amounts, using more recent prices in estimating proved reserves may result in a reduction in proved reserve volumes due to economic limits.
We will not be the operator on all of our acreage or drilling locations, and, therefore, we will not be able to control the timing of exploration or development efforts, associated costs, or the rate of production of any non-operated assets.
We have leased or acquired approximately 42,500 net acres, approximately 83% of which we operate, as of June 15, 2016. As of June 15, 2016, we were the operator on 674 of our 1,357 identified gross horizontal drilling locations. We will have limited ability to exercise influence over the operations of the drilling locations operated by our partners, and there is the risk that our partners may at any time have economic, business or legal interests
27
Table of Contents
or goals that are inconsistent with ours. Furthermore, the success and timing of development activities operated by our partners will depend on a number of factors that will be largely outside of our control, including:
| • | the timing and amount of capital expenditures; |
| • | the operator’s expertise and financial resources; |
| • | the approval of other participants in drilling wells; |
| • | the selection of technology; and |
| • | the rate of production of reserves, if any. |
This limited ability to exercise control over the operations and associated costs of some of our drilling locations could prevent the realization of targeted returns on capital in drilling or acquisition activities.
Our identified drilling locations are scheduled out over many years, making them susceptible to uncertainties that could materially alter the occurrence or timing of their drilling. In addition, we may not be able to raise the substantial amount of capital that would be necessary to drill such locations.
Our management team has specifically identified and scheduled certain drilling locations as an estimation of our future multi-year drilling activities on our existing acreage. These drilling locations represent a significant part of our growth strategy. Our ability to drill and develop these locations depends on a number of uncertainties, including oil and natural gas prices, the availability and cost of capital, drilling and production costs, availability of drilling services and equipment, drilling results, lease expirations, gathering system and pipeline transportation constraints, access to and availability of water sourcing and distribution systems, regulatory approvals and other factors. Because of these uncertain factors, we do not know if the numerous drilling locations we have identified will ever be drilled or if we will be able to produce natural gas or oil from these or any other drilling locations. In addition, unless production is established within the spacing units covering the undeveloped acres on which some of the drilling locations are obtained, the leases for such acreage will expire. As such, our actual drilling activities may materially differ from those presently identified.
As of June 15, 2016, we had identified 1,357 horizontal drilling locations on our acreage based on approximately 880-foot spacing with five to six wells per 640-acre section in the Wolfcamp zones and approximately 1,320-foot spacing with four wells per 640-acre section in the 3rd Bone Spring Sandstone, in each case, consisting of laterals ranging from 4,500 feet up to 9,500 feet. As a result of the limitations described above, we may be unable to drill many of our identified locations. In addition, we will require significant additional capital over a prolonged period in order to pursue the development of these locations, and we may not be able to raise or generate the capital required to do so. See “—Our development and acquisition projects require substantial capital expenditures. We may be unable to obtain required capital or financing on satisfactory terms, which could lead to a decline in our ability to access or grow production and reserves.” Any drilling activities we are able to conduct on these locations may not be successful or result in our ability to add additional proved reserves to our overall proved reserves or may result in a downward revision of our estimated proved reserves, which could have a material adverse effect on our future business and results of operations. Additionally, if we curtail our drilling program, we may lose a portion of our acreage through lease expirations.
Certain of our undeveloped leasehold acreage is subject to leases that will expire over the next several years unless production is established on units containing the acreage, the primary term is extended through continuous drilling provisions or the leases are renewed.
As of June 15, 2016, approximately 67% of our total net acreage (approximately 75% of our net acreage in Reeves and Ward counties) was either held by production or under continuous drilling provisions. The leases for our net acreage not held by production will expire at the end of their primary term unless production is established in paying quantities under the units containing these leases, the leases are held beyond their primary terms under continuous drilling provisions or the leases are renewed. If our leases expire and we are unable to renew the leases, we will lose our right to develop the related properties. Our ability to drill and develop these
28
Table of Contents
locations depends on a number of uncertainties, including oil and natural gas prices, the availability and cost of capital, drilling and production costs, availability of drilling services and equipment, drilling results, lease expirations, gathering system and pipeline transportation constraints, access to and availability of water sourcing and distribution systems, regulatory approvals and other factors.
Adverse weather conditions may negatively affect our operating results and our ability to conduct drilling activities.
Adverse weather conditions may cause, among other things, increases in the costs of, and delays in, drilling or completing new wells, power failures, temporary shut-in of production and difficulties in the transportation of our oil, natural gas and NGLs. Any decreases in production due to poor weather conditions will have an adverse effect on our revenues, which will in turn negatively affect our cash flow from operations.
Our operations are substantially dependent on the availability of water. Restrictions on our ability to obtain water may have an adverse effect on our financial condition, results of operations and cash flows.
Water is an essential component of deep shale oil and natural gas production during both the drilling and hydraulic fracturing processes. Drought conditions have persisted in Texas in past years. These drought conditions have led governmental authorities to restrict the use of water subject to their jurisdiction for hydraulic fracturing to protect local water supplies. If we are unable to obtain water to use in our operations, we may be unable to economically produce oil and natural gas, which could have a material and adverse effect on our financial condition, results of operations and cash flows.
Our producing properties are located in the Delaware Basin, a sub-basin of the Permian Basin, in West Texas, making us vulnerable to risks associated with operating in a single geographic area.
All of our producing properties are geographically concentrated in the Delaware Basin, a sub-basin of the Permian Basin, in West Texas. At December 31, 2015, all of our total estimated proved reserves were attributable to properties located in this area. As a result of this concentration, we may be disproportionately exposed to the impact of regional supply and demand factors, delays or interruptions of production from wells in this area caused by governmental regulation, processing or transportation capacity constraints, market limitations, availability of equipment and personnel, water shortages or other drought related conditions or interruption of the processing or transportation of oil, natural gas or NGLs.
The marketability of our production is dependent upon transportation and other facilities, certain of which we do not control. If these facilities are unavailable, our operations could be interrupted and our revenues reduced.
The marketability of our oil and natural gas production depends in part upon the availability, proximity and capacity of transportation facilities owned by third parties. Our oil production is transported from the wellhead to our tank batteries by our gathering systems. The oil is then transported by the purchaser by truck to a transportation facility. Our natural gas production is generally transported by third-party gathering lines from the wellhead to a gas processing facility. We do not control these trucks and other third-party transportation facilities and our access to them may be limited or denied. Insufficient production from our wells to support the construction of pipeline facilities by our purchasers or a significant disruption in the availability of our or third-party transportation facilities or other production facilities could adversely impact our ability to deliver to market or produce our oil and natural gas and thereby cause a significant interruption in our operations. If, in the future, we are unable, for any sustained period, to implement acceptable delivery or transportation arrangements or encounter production related difficulties, we may be required to shut in or curtail production. Any such shut-in or curtailment, or an inability to obtain favorable terms for delivery of the oil and natural gas produced from our fields, would materially and adversely affect our financial condition and results of operations.
29
Table of Contents
We may incur losses as a result of title defects in the properties in which we invest.
The existence of a material title deficiency can render a lease worthless and can adversely affect our results of operations and financial condition. While we typically obtain title opinions prior to commencing drilling operations on a lease or in a unit, the failure of title may not be discovered until after a well is drilled, in which case we may lose the lease and the right to produce all or a portion of the minerals under the property.
The development of our estimated PUDs may take longer and may require higher levels of capital expenditures than we currently anticipate. Therefore, our estimated PUDs may not be ultimately developed or produced.
As of December 31, 2015, 60% of our total estimated proved reserves were classified as proved undeveloped. Development of these proved undeveloped reserves may take longer and require higher levels of capital expenditures than we currently anticipate. Delays in the development of our reserves, increases in costs to drill and develop such reserves or decreases in commodity prices will reduce the value of our estimated PUDs and future net revenues estimated for such reserves and may result in some projects becoming uneconomic. In addition, delays in the development of reserves could cause us to have to reclassify our PUDs as unproved reserves. Further, we may be required to write-down our PUDs if we do not drill those wells within five years after their respective dates of booking.
If commodity prices decrease to a level such that our future undiscounted cash flows from our properties are less than their carrying value, we may be required to take write-downs of the carrying values of our properties.
Accounting rules require that we periodically review the carrying value of our properties for possible impairment. Based on prevailing commodity prices and specific market factors and circumstances at the time of prospective impairment reviews, and the continuing evaluation of development plans, production data, economics and other factors, we may be required to write-down the carrying value of our properties. A write-down constitutes a non-cash charge to earnings. Recently, commodity prices have declined significantly. On May 31, 2016, the WTI spot price for crude oil was $45.10 per barrel and the Henry Hub spot price for natural gas was $2.09 per MMBtu, representing decreases of 54% and 74%, respectively, from the high of $107.62 per barrel of oil and $7.92 per MMBtu for natural gas during 2014. Likewise, NGLs have suffered significant recent declines in realized prices. NGLs are made up of ethane, propane, isobutene, normal butane and natural gasoline, all of which have different uses and different pricing characteristics. Lower commodity prices in the future could result in impairments of our properties, which could have a material adverse effect on our results of operations for the periods in which such charges are taken.
Unless we replace our reserves with new reserves and develop those reserves, our reserves and production will decline, which would adversely affect our future cash flows and results of operations.
Producing oil and natural gas reservoirs generally are characterized by declining production rates that vary depending upon reservoir characteristics and other factors. Unless we conduct successful ongoing exploration and development activities or continually acquire properties containing proved reserves, our proved reserves will decline as those reserves are produced. Our future reserves and production, and therefore our future cash flow and results of operations, are highly dependent on our success in efficiently developing our current reserves and economically finding or acquiring additional recoverable reserves. We may not be able to develop, find or acquire sufficient additional reserves to replace our current and future production. If we are unable to replace our current and future production, the value of our reserves will decrease, and our business, financial condition and results of operations would be materially and adversely affected.
30
Table of Contents
Conservation measures and technological advances could reduce demand for oil and natural gas.
Fuel conservation measures, alternative fuel requirements, increasing consumer demand for alternatives to oil and natural gas, technological advances in fuel economy and energy generation devices could reduce demand for oil and natural gas. The impact of the changing demand for oil and natural gas may have a material adverse effect on our business, financial condition, results of operations and cash flows.
We depend upon a significant purchaser for the sale of most of our oil, natural gas and NGL production.
We normally sell our production to a relatively small number of customers, as is customary in our business. For the years ended December 31, 2015 and 2014, Plains Marketing, L.P. accounted for 64% and 78%, respectively, of our total revenue. During such years, no other purchaser accounted for 10% or more of our revenue. The loss of Plains Marketing, L.P. as a purchaser could materially and adversely affect our revenues in the short-term.
Our operations may be exposed to significant delays, costs and liabilities as a result of environmental and occupational health and safety requirements applicable to our business activities.
Our operations are subject to stringent and complex federal, state and local laws and regulations governing the discharge of materials into the environment, health and safety aspects of our operations or otherwise relating to environmental protection. These laws and regulations may impose numerous obligations applicable to our operations, including the acquisition of a permit or other approval before conducting regulated activities; the restriction of types, quantities and concentration of materials that can be released into the environment; the limitation or prohibition of drilling activities on certain lands lying within wilderness, wetlands and other protected areas; the application of specific health and safety criteria addressing worker protection; and the imposition of substantial liabilities for pollution resulting from our operations. Numerous governmental authorities, such as the U.S. Environmental Protection Agency (“EPA”) and analogous state agencies, have the power to enforce compliance with these laws and regulations and the permits issued under them. Such enforcement actions often involve taking difficult and costly compliance measures or corrective actions. Failure to comply with these laws and regulations may result in the assessment of sanctions, including administrative, civil or criminal penalties, natural resource damages, the imposition of investigatory or remedial obligations, and the issuance of orders limiting or prohibiting some or all of our operations. In addition, we may experience delays in obtaining, or be unable to obtain, required permits, which may delay or interrupt our operations and limit our growth and revenue.
Certain environmental laws impose strict as well as joint and several liability for costs required to remediate and restore sites where hazardous substances, hydrocarbons or solid wastes have been stored or released. We may be required to remediate contaminated properties currently or formerly operated by us or facilities of third parties that received waste generated by our operations regardless of whether such contamination resulted from the conduct of others or from consequences of our own actions that were in compliance with all applicable laws at the time those actions were taken. In connection with certain acquisitions, we could acquire, or be required to provide indemnification against, environmental liabilities that could expose us to material losses. In addition, claims for damages to persons or property, including natural resources, may result from the environmental, health and safety impacts of our operations. Our insurance may not cover all environmental risks and costs or may not provide sufficient coverage if an environmental claim is made against us. Moreover, public interest in the protection of the environment has increased dramatically in recent years. The trend of more expansive and stringent environmental legislation and regulations applied to the crude oil and natural gas industry could continue, resulting in increased costs of doing business and consequently affecting profitability. To the extent laws are enacted or other governmental action is taken that restricts drilling or imposes more stringent and costly operating, waste handling, disposal and cleanup requirements, our business, prospects, financial condition or results of operations could be materially adversely affected.
31
Table of Contents
We may incur substantial losses and be subject to substantial liability claims as a result of our operations. Additionally, we may not be insured for, or our insurance may be inadequate to protect us against, these risks.
We are not insured against all risks. Losses and liabilities arising from uninsured and underinsured events could materially and adversely affect our business, financial condition or results of operations.
Our development activities are subject to all of the operating risks associated with drilling for and producing oil and natural gas, including the possibility of:
| • | environmental hazards, such as uncontrollable releases of oil, natural gas, brine, well fluids, toxic gas or other pollution into the environment, including groundwater, air and shoreline contamination; |
| • | abnormally pressured formations; |
| • | mechanical difficulties, such as stuck oilfield drilling and service tools and casing collapse; |
| • | fires, explosions and ruptures of pipelines; |
| • | personal injuries and death; |
| • | natural disasters; and |
| • | terrorist attacks targeting oil and natural gas related facilities and infrastructure. |
Any of these risks could adversely affect our ability to conduct operations or result in substantial loss to us as a result of claims for:
| • | injury or loss of life; |
| • | damage to and destruction of property, natural resources and equipment; |
| • | pollution and other environmental damage; |
| • | regulatory investigations and penalties; and |
| • | repair and remediation costs. |
We may elect not to obtain insurance for any or all of these risks if we believe that the cost of available insurance is excessive relative to the risks presented. In addition, pollution and environmental risks generally are not fully insurable. The occurrence of an event that is not fully covered by insurance could have a material adverse effect on our business, financial condition and results of operations.
Properties that we decide to drill may not yield oil or natural gas in commercially viable quantities.
Properties that we decide to drill that do not yield oil or natural gas in commercially viable quantities will adversely affect our results of operations and financial condition. There is no way to predict in advance of drilling and testing whether any particular prospect will yield oil or natural gas in sufficient quantities to recover drilling or completion costs or to be economically viable. The use of micro-seismic data and other technologies and the study of producing fields in the same area will not enable us to know conclusively prior to drilling whether oil or natural gas will be present or, if present, whether oil or natural gas will be present in commercial quantities. We cannot assure you that the analogies we draw from available data from other wells, more fully explored prospects or producing fields will be applicable to our drilling prospects. Further, our drilling operations may be curtailed, delayed or cancelled as a result of numerous factors, including:
| • | unexpected drilling conditions; |
| • | title problems; |
32
Table of Contents
| • | pressure or lost circulation in formations; |
| • | equipment failure or accidents; |
| • | adverse weather conditions; |
| • | compliance with environmental and other governmental or contractual requirements; and |
| • | increase in the cost of, shortages or delays in the availability of, electricity, supplies, materials, drilling or workover rigs, equipment and services. |
We may be unable to make attractive acquisitions or successfully integrate acquired businesses, and any inability to do so may disrupt our business and hinder our ability to grow.
In the future we may make acquisitions of assets or businesses that complement or expand our current business. However, there is no guarantee we will be able to identify attractive acquisition opportunities. In the event we are able to identify attractive acquisition opportunities, we may not be able to complete the acquisition or do so on commercially acceptable terms. Competition for acquisitions may also increase the cost of, or cause us to refrain from, completing acquisitions.
The success of any completed acquisition will depend on our ability to integrate effectively the acquired business into our existing operations. The process of integrating acquired businesses may involve unforeseen difficulties and may require a disproportionate amount of our managerial and financial resources. In addition, possible future acquisitions may be larger and for purchase prices significantly higher than those paid for earlier acquisitions. No assurance can be given that we will be able to identify additional suitable acquisition opportunities, negotiate acceptable terms, obtain financing for acquisitions on acceptable terms or successfully acquire identified targets. Our failure to achieve consolidation savings, to integrate the acquired businesses and assets into our existing operations successfully or to minimize any unforeseen operational difficulties could have a material adverse effect on our financial condition and results of operations.
In addition, our credit agreement imposes certain limitations on our ability to enter into mergers or combination transactions. Our credit agreement also limits our ability to incur certain indebtedness, which could indirectly limit our ability to engage in acquisitions of businesses.
Certain of our properties are subject to land use restrictions, which could limit the manner in which we conduct our business.
Certain of our properties are subject to land use restrictions, including city ordinances, which could limit the manner in which we conduct our business. Although none of our drilling locations associated with proved undeveloped reserves as of December 31, 2015 or March 31, 2016 are on properties currently subject to such land use restrictions, such restrictions could affect, among other things, our access to and the permissible uses of our facilities as well as the manner in which we produce oil and natural gas and may restrict or prohibit drilling in general. The costs we incur to comply with such restrictions may be significant in nature, and we may experience delays or curtailment in the pursuit of development activities and perhaps even be precluded from the drilling of wells.
The unavailability or high cost of additional drilling rigs, equipment, supplies, personnel and oilfield services could adversely affect our ability to execute our development plans within our budget and on a timely basis.
The demand for drilling rigs, pipe and other equipment and supplies, as well as for qualified and experienced field personnel to drill wells and conduct field operations, geologists, geophysicists, engineers and other professionals in the oil and natural gas industry, can fluctuate significantly, often in correlation with oil and natural gas prices, causing periodic shortages. Our operations are concentrated in areas in which industry had
33
Table of Contents
increased rapidly, and as a result, demand for such drilling rigs, equipment and personnel, as well as access to transportation, processing and refining facilities in these areas, had increased, as did the costs for those items. However, beginning in the second half of 2014, commodity prices began to decline and the demand for goods and services has subsided due to reduced activity. To the extent that commodity prices improve in the future, any delay or inability to secure the personnel, equipment, power, services, resources and facilities access necessary for us to resume or increase our development activities could result in production volumes being below our forecasted volumes. In addition, any such negative effect on production volumes, or significant increases in costs, could have a material adverse effect on our cash flow and profitability. Furthermore, if we are unable to secure a sufficient number of drilling rigs at reasonable costs, we may not be able to drill all of our acreage before our leases expire.
We could experience periods of higher costs if commodity prices rise. These increases could reduce our profitability, cash flow and ability to complete development activities as planned.
Historically, our capital and operating costs have risen during periods of increasing oil, natural gas and NGL prices. These cost increases result from a variety of factors beyond our control, such as increases in the cost of electricity, steel and other raw materials that we and our vendors rely upon; increased demand for labor, services and materials as drilling activity increases; and increased taxes. Decreased levels of drilling activity in the oil and gas industry in recent periods have led to declining costs of some drilling equipment, materials and supplies. However, such costs may rise faster than increases in our revenue if commodity prices rise, thereby negatively impacting our profitability, cash flow and ability to complete development activities as scheduled and on budget. This impact may be magnified to the extent that our ability to participate in the commodity price increases is limited by our derivative activities.
Should we fail to comply with all applicable FERC administered statutes, rules, regulations and orders, we could be subject to substantial penalties and fines.
Under the Domenici-Barton Energy Policy Act of 2005 (“EP Act of 2005”), the Federal Energy Regulatory Commission (“FERC”) has civil penalty authority under the Natural Gas Act of 1938 (the “NGA”) and the Natural Gas Policy Act (“NGPA”) to impose penalties for current violations of up to $1 million per day for each violation and disgorgement of profits associated with any violation. While our operations have not been regulated by FERC as a natural gas company under the NGA, FERC has adopted regulations that may subject certain of our otherwise non-FERC jurisdictional operations to FERC annual reporting and posting requirements. We also must comply with the anti-market manipulation rules enforced by FERC. Additional rules and legislation pertaining to those and other matters may be considered or adopted by FERC from time to time. Failure to comply with those regulations in the future could subject us to civil penalty liability, as described in “Business—Regulation of the Oil and Natural Gas Industry.”
Climate change laws and regulations restricting emissions of GHGs could result in increased operating costs and reduced demand for the oil and natural gas that we produce, while potential physical effects of climate change could disrupt our production and cause us to incur significant costs in preparing for or responding to those effects.
In response to findings that emissions of carbon dioxide, methane and other GHGs present an endangerment to public health and the environment, the EPA has adopted regulations pursuant to the federal Clean Air Act that, among other things, require preconstruction and operating permits for certain large stationary sources. Facilities required to obtain preconstruction permits for their GHG emissions are also required to meet “best available control technology” standards that are being established by the states or, in some cases, by the EPA on a case-by-case basis. These regulatory requirements could adversely affect our operations and restrict or delay our ability to obtain air permits for new or modified sources. In addition, the EPA has adopted rules requiring the monitoring and reporting of GHG emissions from specified onshore and offshore oil and natural gas production sources in the United States on an annual basis, which include certain of our operations. Furthermore, in May 2016, the EPA finalized rules that establish new controls for emissions of methane from new, modified or reconstructed
34
Table of Contents
sources in the oil and natural gas source category, including production, processing, transmission and storage activities. The rule includes first-time standards to address emissions of methane from equipment and processes across the source category, including hydraulically fractured oil and natural gas well completions. The EPA has also announced that it intends to impose methane emission standards for existing sources as well but, to date, has not yet issued a proposal. Compliance with these rules will require enhanced record-keeping practices, the purchase of new equipment, such as optical gas imaging instruments to detect leaks, and increased frequency of maintenance and repair activities to address emissions leakage. The rules will also likely require additional personnel time to support these activities or the engagement of third party contractors to assist with and verify compliance. These new and proposed rules could result in increased compliance costs on our operations.
While Congress has from time to time considered legislation to reduce emissions of GHGs, there has not been significant activity in the form of adopted legislation to reduce GHG emissions at the federal level in recent years. In the absence of such federal climate legislation, a number of state and regional efforts have emerged that are aimed at tracking and/or reducing GHG emissions by means of cap and trade programs. These programs typically require major sources of GHG emissions to acquire and surrender emission allowances in return for emitting those GHGs. In addition, efforts have been made and continue to be made in the international community toward the adoption of international treaties or protocols that would address global climate change issues. Most recently in April 2016, the United States was one of 175 countries to ratify the Paris Agreement, which requires member countries to review and “represent a progression” in their intended nationally determined contributions, which set GHG emission reduction goals, every five years beginning in 2020. Although it is not possible at this time to predict how legislation or new regulations that may be adopted to address GHG emissions would impact our business, any such future laws and regulations imposing reporting obligations on, or limiting emissions of GHGs from, our equipment and operations could require us to incur costs to reduce emissions of GHGs associated with our operations. Substantial limitations on GHG emissions could adversely affect demand for the oil and natural gas we produce. Finally, it should be noted that some scientists have concluded that increasing concentrations of GHGs in the Earth’s atmosphere may produce climate changes that have significant physical effects, such as increased frequency and severity of storms, floods and other climatic events; if any such effects were to occur, they could have a material adverse effect on our operations.
Federal, state and local legislative and regulatory initiatives relating to hydraulic fracturing as well as governmental reviews of such activities could result in increased costs and additional operating restrictions or delays in the completion of oil and natural gas wells and adversely affect our production.
Hydraulic fracturing is an important and common practice that is used to stimulate production of oil and/or natural gas from dense subsurface rock formations. The hydraulic fracturing process involves the injection of water, proppants and chemicals under pressure into targeted subsurface formations to fracture the surrounding rock and stimulate production. We regularly use hydraulic fracturing as part of our operations. Hydraulic fracturing is typically regulated by state oil and natural gas commissions, but the EPA has asserted federal regulatory authority pursuant to the federal Safe Drinking Water Act (“SDWA”) over certain hydraulic fracturing activities involving the use of diesel fuels and published permitting guidance in February 2014 addressing the performance of such activities using diesel fuels. The EPA has also issued final regulations under the federal Clean Air Act establishing performance standards, including standards for the capture of air emissions released during hydraulic fracturing, and advanced notice of proposed rulemaking under the Toxic Substances Control Act to require companies to disclose information regarding the chemicals used in hydraulic fracturing, and also finalized rules in 2016 that prohibit the discharge of wastewater from hydraulic fracturing operations to publicly owned wastewater treatment plants. In addition, the Bureau of Land Management finalized rules in March 2015 that impose new or more stringent standards for performing hydraulic fracturing on federal and American Indian lands. The U.S. District Court of Wyoming has temporarily stayed implementation of this rule. A final decision has not yet been issued. In addition, Congress has from time to time considered legislation to provide for federal regulation of hydraulic fracturing under the SDWA and to require disclosure of the chemicals used in the hydraulic fracturing process. It is unclear how any additional federal regulation of hydraulic fracturing activities may affect our operations.
35
Table of Contents
Certain governmental reviews are either underway or being proposed that focus on environmental aspects of hydraulic fracturing practices. The White House Council on Environmental Quality is coordinating an administration-wide review of hydraulic fracturing practices. Additionally, in June 2015, the EPA released its draft report on the potential impacts of hydraulic fracturing on drinking water resources. The EPA report concluded that hydraulic fracturing activities have not led to widespread, systemic impacts on drinking water resources in the United States, although there are above and below ground mechanisms by which hydraulic fracturing activities have the potential to impact drinking water resources. The draft report is expected to be finalized after a public comment period and a formal review by the EPA’s Science Advisory Board. Other governmental agencies, including the United States Department of Energy and the United States Department of the Interior, are evaluating various other aspects of hydraulic fracturing. These ongoing or proposed studies could spur initiatives to further regulate hydraulic fracturing under the federal SDWA or other regulatory mechanisms.
At the state level, several states have adopted or are considering legal requirements that could impose more stringent permitting, disclosure and well construction requirements on hydraulic fracturing activities. For example, in May 2013, the Railroad Commission of Texas issued a “well integrity rule,” which updates the requirements for drilling, putting pipe down and cementing wells. The rule also includes new testing and reporting requirements, such as (i) the requirement to submit cementing reports after well completion or after cessation of drilling, whichever is later, and (ii) the imposition of additional testing on wells less than 1,000 feet below usable groundwater. The well integrity rule took effect in January 2014. Local governments also may seek to adopt ordinances within their jurisdictions regulating the time, place and manner of drilling activities in general or hydraulic fracturing activities in particular. We believe that we follow applicable standard industry practices and legal requirements for groundwater protection in our hydraulic fracturing activities. Nonetheless, if new or more stringent federal, state or local legal restrictions relating to the hydraulic fracturing process are adopted in areas where we operate, we could incur potentially significant added costs to comply with such requirements, experience delays or curtailment in the pursuit of development activities, and perhaps even be precluded from drilling wells.
Legislation or regulatory initiatives intended to address seismic activity could restrict our drilling and production activities, as well as our ability to dispose of saltwater gathered from such activities, which could have a material adverse effect on our business.
State and federal regulatory agencies recently have focused on a possible connection between the hydraulic fracturing related activities and the increased occurrence of seismic activity, and regulatory agencies at all levels are continuing to study the possible linkage between oil and gas activity and induced seismicity. For example, in 2015, the United States Geological Study identified eight states, including Texas, with areas of increased rates of induced seismicity that could be attributed to fluid injection or oil and gas extraction. In addition, a number of lawsuits have been filed in other states, most recently in Oklahoma, alleging that disposal well operations have caused damage to neighboring properties or otherwise violated state and federal rules regulating waste disposal. In response to these concerns, regulators in some states are seeking to impose additional requirements, including requirements in the permitting of saltwater disposal wells or otherwise to assess any relationship between seismicity and the use of such wells. For example, in October 2014, the Railroad Commission of Texas published a new rule governing permitting or re-permitting of disposal wells that would require, among other things, the submission of information on seismic events occurring within a specified radius of the disposal well location, as well as logs, geologic cross sections and structure maps relating to the disposal area in question. If the permittee or an applicant of a disposal well permit fails to demonstrate that the saltwater or other fluids are confined to the disposal zone or if scientific data indicates such a disposal well is likely to be or determined to be contributing to seismic activity, then the agency may deny, modify, suspend or terminate the permit application or existing operating permit for that well.
We dispose of large volumes of saltwater gathered from our drilling and production operations pursuant to permits issued to us by governmental authorities overseeing such disposal activities. While these permits are issued pursuant to existing laws and regulations, these legal requirements are subject to change, which could
36
Table of Contents
result in the imposition of more stringent operating constraints or new monitoring and reporting requirements, owing to, among other things, concerns of the public or governmental authorities regarding such gathering or disposal activities. The adoption and implementation of any new laws or regulations that restrict our ability to use hydraulic fracturing or dispose of saltwater gathered from our drilling and production activities by limiting volumes, disposal rates, disposal well locations or otherwise, or requiring us to shut down disposal wells, could have a material adverse effect on our business, financial condition and results of operations.
Competition in the oil and natural gas industry is intense, making it more difficult for us to acquire properties, market oil or natural gas and secure trained personnel.
Our ability to acquire additional prospects and to find and develop reserves in the future will depend on our ability to evaluate and select suitable properties and to consummate transactions in a highly competitive environment for acquiring properties, marketing oil and natural gas and securing trained personnel. Also, there is substantial competition for capital available for investment in the oil and natural gas industry. Many of our competitors possess and employ financial, technical and personnel resources substantially greater than ours. Those companies may be able to pay more for productive properties and exploratory prospects and to evaluate, bid for and purchase a greater number of properties and prospects than our financial or personnel resources permit. In addition, other companies may be able to offer better compensation packages to attract and retain qualified personnel than we are able to offer. The cost to attract and retain qualified personnel has increased over the past three years due to competition and may increase substantially in the future. We may not be able to compete successfully in the future in acquiring prospective reserves, developing reserves, marketing hydrocarbons, attracting and retaining quality personnel and raising additional capital, which could have a material adverse effect on our business.
The loss of senior management or technical personnel could adversely affect operations.
We depend on the services of our senior management and technical personnel. We do not maintain, nor do we plan to obtain, any insurance against the loss of any of these individuals. The loss of the services of our senior management or technical personnel could have a material adverse effect on our business, financial condition and results of operations.
Our business is difficult to evaluate because we have a limited operating history, and we are susceptible to the potential difficulties associated with rapid growth and expansion.
Our predecessors were formed in 2006 and 2012. As a result, there is only limited historical financial and operating information available upon which to base your evaluation of our performance.
In addition, we have grown rapidly over the last several years. Our management believes that our future success depends on our ability to manage the rapid growth that we have experienced and the demands from increased responsibility on management personnel. The following factors could present difficulties:
| • | increased responsibilities for our executive level personnel; |
| • | increased administrative burden; |
| • | increased capital requirements; and |
| • | increased organizational challenges common to large, expansive operations. |
Our operating results could be adversely affected if we do not successfully manage these potential difficulties. The historical financial information incorporated herein is not necessarily indicative of the results that may be realized in the future. In addition, our operating history is limited and the results from our current producing wells are not necessarily indicative of success from our future drilling operations.
37
Table of Contents
Increases in interest rates could adversely affect our business.
Our business and operating results can be harmed by factors such as the availability, terms of and cost of capital, increases in interest rates or a reduction in credit rating. These changes could cause our cost of doing business to increase, limit our ability to pursue acquisition opportunities, reduce cash flow used for drilling and place us at a competitive disadvantage. For example, as of March 31, 2016, outstanding borrowings subject to variable interest rates were approximately $142 million, and a 1.0% increase in interest rates would result in an increase in annual interest expense of approximately $1.4 million, assuming the $142 million of debt was outstanding for the full year. Recent and continuing disruptions and volatility in the global financial markets may lead to a contraction in credit availability impacting our ability to finance our operations. We require continued access to capital. A significant reduction in cash flows from operations or the availability of credit could materially and adversely affect our ability to achieve our planned growth and operating results.
We may be subject to risks in connection with acquisitions of properties.
The successful acquisition of producing properties requires an assessment of several factors, including:
| • | recoverable reserves; |
| • | future oil and natural gas prices and their applicable differentials; |
| • | operating costs; and |
| • | potential environmental and other liabilities. |
The accuracy of these assessments is inherently uncertain. In connection with these assessments, we perform a review of the subject properties that we believe to be generally consistent with industry practices. Our review will not reveal all existing or potential problems nor will it permit us to become sufficiently familiar with the properties to fully assess their deficiencies and capabilities. Inspections may not always be performed on every well, and environmental problems, such as groundwater contamination, are not necessarily observable even when an inspection is undertaken. Even when problems are identified, the seller may be unwilling or unable to provide effective contractual protection against all or part of the problems. We often are not entitled to contractual indemnification for environmental liabilities and acquire properties on an “as is” basis.
Certain U.S. federal income tax deductions currently available with respect to oil and natural gas exploration and development may be eliminated, and additional federal, state and local taxes on oil and natural gas extraction may be imposed, as a result of future legislation.
Potential legislation, if enacted into law, could make significant changes to U.S. federal and state income tax laws, including the elimination of certain key U.S. federal income tax incentives currently available to oil and gas exploration and production companies. These changes include, but are not limited to, (i) the repeal of the percentage depletion allowance for oil and natural gas properties, (ii) the elimination of current deductions for intangible drilling and development costs, (iii) the elimination of the deduction for certain U.S. production activities, and (iv) an extension of the amortization period for certain geological and geophysical expenditures. It is unclear whether these or similar changes will be enacted and, if enacted, how soon any such changes could become effective. The passage of this legislation or any other similar changes in U.S. federal and state income tax laws could eliminate or postpone certain tax deductions that are currently available with respect to oil and natural gas exploration and development, and any such change could negatively affect our financial condition and results of operations. Additionally, legislation could be enacted that increases the taxes states impose on oil and natural gas extraction. Moreover, President Obama has proposed, as part of the Budget of the United States Government for Fiscal Year 2017, to impose an “oil fee” of $10.25 on a per barrel equivalent of crude oil. This fee would be collected on domestically produced and imported petroleum products. The fee would be phased in evenly over five years, beginning October 1, 2016. The adoption of this, or similar proposals, could result in increased operating costs and/or reduced consumer demand for petroleum products, which in turn could affect the prices we receive for our oil.
38
Table of Contents
Our use of seismic data is subject to interpretation and may not accurately identify the presence of oil and natural gas, which could adversely affect the results of our drilling operations.
Even when properly used and interpreted, seismic data and visualization techniques are only tools used to assist geoscientists in identifying subsurface structures and hydrocarbon indicators and do not enable the interpreter to know whether hydrocarbons are, in fact, present in those structures. As a result, our drilling activities may not be successful or economical. In addition, the use of advanced technologies, such as 3-D seismic data, requires greater pre-drilling expenditures than traditional drilling strategies, and we could incur losses as a result of such expenditures.
Restrictions on drilling activities intended to protect certain species of wildlife may adversely affect our ability to conduct drilling activities in areas where we operate.
Oil and natural gas operations in our operating areas may be adversely affected by seasonal or permanent restrictions on drilling activities designed to protect various wildlife. Seasonal restrictions may limit our ability to operate in protected areas and can intensify competition for drilling rigs, oilfield equipment, services, supplies and qualified personnel, which may lead to periodic shortages when drilling is allowed. These constraints and the resulting shortages or high costs could delay our operations or materially increase our operating and capital costs. Permanent restrictions imposed to protect endangered species could prohibit drilling in certain areas or require the implementation of expensive mitigation measures. The designation of previously unprotected species in areas where we operate as threatened or endangered could cause us to incur increased costs arising from species protection measures or could result in limitations on our activities that could have a material and adverse impact on our ability to develop and produce our reserves.
The enactment of derivatives legislation could have an adverse effect on our ability to use derivative instruments to reduce the effect of commodity price, interest rate and other risks associated with our business.
The Dodd-Frank Act, enacted on July 21, 2010, established federal oversight and regulation of the over-the-counter derivatives market and entities, such as us, that participate in that market. The Dodd-Frank Act requires the Commodity Futures Trading Commission (“CFTC”) and the SEC to promulgate rules and regulations implementing the Dodd-Frank Act. In October 2011, the CFTC issued regulations to set position limits for certain futures and option contracts in the major energy markets and for swaps that are their economic equivalents. The initial position limits rule was vacated by the United States District Court for the District of Columbia in September 2012. However, in November 2013, the CFTC proposed new rules that would place limits on positions in certain core futures and equivalent swaps contracts for or linked to certain physical commodities, subject to exceptions for certain bona fide hedging transactions. As these new position limit rules are not yet final, the impact of those provisions on us is uncertain at this time.
The CFTC has designated certain interest rate swaps and credit default swaps for mandatory clearing. The CFTC has not yet proposed rules designating any other classes of swaps, including physical commodity swaps, for mandatory clearing. In addition, certain banking regulators and the CFTC have recently adopted final rules establishing minimum margin requirements for uncleared swaps. Although we expect to qualify for the end-user exception from such margin requirements for swaps entered into to hedge our commercial risks, the application of such requirements to other market participants, such as swap dealers, may change the cost and availability of the swaps that we use for hedging. If any of our swaps do not qualify for the commercial end-user exception, posting of collateral could impact liquidity and reduce cash available to us for capital expenditures, therefore reducing our ability to execute hedges to reduce risk and protect cash flow.
The full impact of the Dodd-Frank Act and related regulatory requirements upon our business will not be known until the regulations are implemented and the market for derivatives contracts has adjusted. The Dodd-Frank Act and any new regulations could significantly increase the cost of derivative contracts, materially alter the terms of derivative contracts, reduce the availability of derivatives to protect against risks we encounter, and
39
Table of Contents
reduce our ability to monetize or restructure our existing derivative contracts. If we reduce our use of derivatives as a result of the Dodd-Frank Act and regulations, our results of operations may become more volatile and our cash flows may be less predictable, which could adversely affect our ability to plan for and fund capital expenditures. Finally, the Dodd-Frank Act was intended, in part, to reduce the volatility of oil and natural gas prices, which some legislators attributed to speculative trading in derivatives and commodity instruments related to oil and natural gas. Our revenues could therefore be adversely affected if a consequence of the Dodd-Frank Act and implementing regulations is to lower commodity prices. Any of these consequences could have a material and adverse effect on us and our financial condition.
In addition, the European Union and other non-U.S. jurisdictions are implementing regulations with respect to the derivatives market. To the extent we transact with counterparties in foreign jurisdictions, we may become subject to such regulations, the impact of which is not clear at this time.
The standardized measure of our estimated reserves is not an accurate estimate of the current fair value of our estimated oil and natural gas reserves.
Standardized measure is a reporting convention that provides a common basis for comparing oil and natural gas companies subject to the rules and regulations of the SEC. Standardized measure requires the use of specific pricing as required by the SEC as well as operating and development costs prevailing as of the date of computation. Consequently, it may not reflect the prices ordinarily received or that will be received for oil and natural gas production because of varying market conditions, nor may it reflect the actual costs that will be required to produce or develop the oil and natural gas properties. In addition, our predecessor generally passed through its taxable income to its owners for income tax purposes and was not subject to U.S. federal, state or local income taxes other than franchise tax in the State of Texas. Accordingly, our standardized measure does not provide for U.S. federal, state or local income taxes other than franchise tax in the State of Texas. However, following our corporate reorganization, we will be subject to U.S. federal, state and local income taxes. As a result, estimates included herein of future net cash flow may be materially different from the future net cash flows that are ultimately received. Therefore, the standardized measure of our estimated reserves included in this prospectus should not be construed as accurate estimates of the current fair value of our proved reserves.
We may not be able to keep pace with technological developments in our industry.
The oil and natural gas industry is characterized by rapid and significant technological advancements and introductions of new products and services using new technologies. As others use or develop new technologies, we may be placed at a competitive disadvantage or may be forced by competitive pressures to implement those new technologies at substantial costs. In addition, other oil and natural gas companies may have greater financial, technical and personnel resources that allow them to enjoy technological advantages and that may in the future allow them to implement new technologies before we can. We may not be able to respond to these competitive pressures or implement new technologies on a timely basis or at an acceptable cost. If one or more of the technologies we use now or in the future were to become obsolete, our business, financial condition or results of operations could be materially and adversely affected.
40
Table of Contents
Risks Related to this Offering and Our Common Stock
The requirements of being a public company, including compliance with the reporting requirements of the Securities Exchange Act of 1934, as amended (the “Exchange Act”), and the requirements of the Sarbanes-Oxley Act, may strain our resources, increase our costs and distract management, and we may be unable to comply with these requirements in a timely or cost-effective manner.
As a public company, we will need to comply with new laws, regulations and requirements, certain corporate governance provisions of the Sarbanes-Oxley Act of 2002, related regulations of the SEC and the requirements of the NASDAQ, with which we are not required to comply as a private company. Complying with these statutes, regulations and requirements will occupy a significant amount of time of our board of directors and management and will significantly increase our costs and expenses. We will need to:
| • | institute a more comprehensive compliance function; |
| • | comply with rules promulgated by the NASDAQ; |
| • | continue to prepare and distribute periodic public reports in compliance with our obligations under the federal securities laws; |
| • | establish new internal policies, such as those relating to insider trading; and |
| • | involve and retain to a greater degree outside counsel and accountants in the above activities. |
Furthermore, while we generally must comply with Section 404 of the Sarbanes Oxley Act of 2002 for our fiscal year ending December 31, 2016, we are not required to have our independent registered public accounting firm attest to the effectiveness of our internal controls until our first annual report subsequent to our ceasing to be an “emerging growth company” within the meaning of Section 2(a)(19) of the Securities Act. Accordingly, we may not be required to have our independent registered public accounting firm attest to the effectiveness of our internal controls until as late as our annual report for the fiscal year ending December 31, 2021. Once it is required to do so, our independent registered public accounting firm may issue a report that is adverse in the event it is not satisfied with the level at which our controls are documented, designed, operated or reviewed. Compliance with these requirements may strain our resources, increase our costs and distract management, and we may be unable to comply with these requirements in a timely or cost-effective manner.
In addition, we expect that being a public company subject to these rules and regulations may make it more difficult and more expensive for us to obtain director and officer liability insurance and we may be required to accept reduced policy limits and coverage or incur substantially higher costs to obtain the same or similar coverage. As a result, it may be more difficult for us to attract and retain qualified individuals to serve on our board of directors or as executive officers. We are currently evaluating these rules, and we cannot predict or estimate the amount of additional costs we may incur or the timing of such costs.
If we fail to develop or maintain an effective system of internal controls, we may not be able to accurately report our financial results or prevent fraud. As a result, current and potential stockholders could lose confidence in our financial reporting, which would harm our business and the trading price of our common stock.
Effective internal controls are necessary for us to provide reliable financial reports, prevent fraud and operate successfully as a public company. If we cannot provide reliable financial reports or prevent fraud, our reputation and operating results would be harmed. We cannot be certain that our efforts to develop and maintain our internal controls will be successful, that we will be able to maintain adequate controls over our financial processes and reporting in the future or that we will be able to comply with our obligations under Section 404 of the Sarbanes Oxley Act of 2002. Any failure to develop or maintain effective internal controls, or difficulties encountered in implementing or improving our internal controls, could harm our operating results or cause us to fail to meet our reporting obligations. Ineffective internal controls could also cause investors to lose confidence in our reported financial information, which would likely have a negative effect on the trading price of our common stock.
41
Table of Contents
The initial public offering price of our common stock may not be indicative of the market price of our common stock after this offering. In addition, an active, liquid and orderly trading market for our common stock may not develop or be maintained, and our stock price may be volatile.
Prior to this offering, our common stock was not traded on any market. An active, liquid and orderly trading market for our common stock may not develop or be maintained after this offering. Active, liquid and orderly trading markets usually result in less price volatility and more efficiency in carrying out investors’ purchase and sale orders. The market price of our common stock could vary significantly as a result of a number of factors, some of which are beyond our control. In the event of a drop in the market price of our common stock, you could lose a substantial part or all of your investment in our common stock. The initial public offering price will be negotiated between us, the selling stockholders and representative of the underwriters, based on numerous factors which we discuss in “Underwriting,” and may not be indicative of the market price of our common stock after this offering. Consequently, you may not be able to sell shares of our common stock at prices equal to or greater than the price paid by you in this offering.
The following factors could affect our stock price:
| • | our operating and financial performance and drilling locations, including reserve estimates; |
| • | quarterly variations in the rate of growth of our financial indicators, such as net income per share, net income and revenues; |
| • | the public reaction to our press releases, our other public announcements and our filings with the SEC; |
| • | strategic actions by our competitors; |
| • | changes in revenue or earnings estimates, or changes in recommendations or withdrawal of research coverage, by equity research analysts; |
| • | speculation in the press or investment community; |
| • | the failure of research analysts to cover our common stock; |
| • | sales of our common stock by us, the selling stockholders or other stockholders, or the perception that such sales may occur; |
| • | changes in accounting principles, policies, guidance, interpretations or standards; |
| • | additions or departures of key management personnel; |
| • | actions by our stockholders; |
| • | general market conditions, including fluctuations in commodity prices; |
| • | domestic and international economic, legal and regulatory factors unrelated to our performance; and |
| • | the realization of any risks described under this “Risk Factors” section. |
The stock markets in general have experienced extreme volatility that has often been unrelated to the operating performance of particular companies. These broad market fluctuations may adversely affect the trading price of our common stock. Securities class action litigation has often been instituted against companies following periods of volatility in the overall market and in the market price of a company’s securities. Such litigation, if instituted against us, could result in very substantial costs, divert our management’s attention and resources and harm our business, operating results and financial condition.
NGP has the ability to direct the voting of a majority of our common stock, and its interests may conflict with those of our other stockholders.
Upon completion of this offering, NGP, through Centennial HoldCo and Celero, will beneficially own approximately % of our outstanding common stock (or approximately % if the underwriters’ over-allotment
42
Table of Contents
option is exercised in full). As a result, NGP will be able to control matters requiring stockholder approval, including the election of directors, changes to our organizational documents and significant corporate transactions. This concentration of ownership makes it unlikely that any other holder or group of holders of our common stock will be able to affect the way we are managed or the direction of our business. The interests of NGP with respect to matters potentially or actually involving or affecting us, such as future acquisitions, financings and other corporate opportunities and attempts to acquire us, may conflict with the interests of our other stockholders. Given this concentrated ownership, NGP would have to approve any potential acquisition of us. In addition, certain of our directors are currently employees of NGP. These directors’ duties as employees of NGP may conflict with their duties as our directors, and the resolution of these conflicts may not always be in our or your best interest. Furthermore, in connection with this offering, we expect to enter into a voting agreement with Centennial HoldCo and Celero. The voting agreement is expected to provide Centennial HoldCo with the right to designate a certain number of nominees to our board of directors so long as it and Celero and their affiliates collectively beneficially own more than 5% of the outstanding shares of our common stock. See “Certain Relationships and Related Party Transactions—Voting Agreement.” The existence of a significant stockholder and the voting agreement may have the effect of deterring hostile takeovers, delaying or preventing changes in control or changes in management, or limiting the ability of our other stockholders to approve transactions that they may deem to be in the best interests of our company. Moreover, NGP’s concentration of stock ownership may adversely affect the trading price of our common stock to the extent investors perceive a disadvantage in owning stock of a company with a significant stockholder.
Certain of our directors have significant duties with, and spend significant time serving, entities that may compete with us in seeking acquisitions and business opportunities and, accordingly, may have conflicts of interest in allocating time or pursuing business opportunities.
Certain of our directors, who are responsible for managing the direction of our operations and acquisition activities, hold positions of responsibility with other entities (including NGP-affiliated entities) that are in the business of identifying and acquiring oil and natural gas properties. For example, four of our directors (Messrs. Carter, Hayes, Ray and Weber) are Managing Directors or Managing Partners of NGP, which is in the business of investing in oil and natural gas companies with independent management teams that also seek to acquire oil and natural gas properties, and one of our directors (Mr. Sumner) is a Managing Director of The Carlyle Group L.P. (“Carlyle”), which is in the business of making investments in companies, including other energy companies. The existing positions held by these directors may give rise to fiduciary or other duties that are in conflict with the duties they owe to us. These directors may become aware of business opportunities that may be appropriate for presentation to us as well as to the other entities with which they are or may become affiliated. Due to these existing and potential future affiliations, they may present potential business opportunities to other entities prior to presenting them to us, which could cause additional conflicts of interest. They may also decide that certain opportunities are more appropriate for other entities with which they are affiliated, and as a result, they may elect not to present those opportunities to us. These conflicts may not be resolved in our favor. For additional discussion of our management’s business affiliations and the potential conflicts of interest of which our stockholders should be aware, see “Certain Relationships and Related Party Transactions.”
NGP, Carlyle and their respective affiliates are not limited in their ability to compete with us, and the corporate opportunity provisions in our amended and restated certificate of incorporation could enable NGP and Carlyle to benefit from corporate opportunities that might otherwise be available to us.
Our governing documents will provide that NGP, Carlyle and their respective affiliates (including portfolio investments of NGP, Carlyle and their respective affiliates) are not restricted from owning assets or engaging in businesses that compete directly or indirectly with us. In particular, subject to the limitations of applicable law, our amended and restated certificate of incorporation will, among other things:
| • | permit NGP, Carlyle and their respective affiliates to conduct business that competes with us and to make investments in any kind of property in which we may make investments; and |
43
Table of Contents
| • | provide that if NGP, Carlyle or any of their respective affiliates, or any employee, partner, member, manager, officer or director of NGP or Carlyle or their respective affiliates who is also one of our directors or officers, becomes aware of a potential business opportunity, transaction or other matter, they will have no duty to communicate or offer that opportunity to us. |
NGP, Carlyle or their respective affiliates may become aware, from time to time, of certain business opportunities (such as acquisition opportunities) and may direct such opportunities to other businesses in which they have invested, in which case we may not become aware of or otherwise have the ability to pursue such opportunity. Further, such businesses may choose to compete with us for these opportunities, possibly causing these opportunities to not be available to us or causing them to be more expensive for us to pursue. In addition, NGP, Carlyle and their respective affiliates may dispose of oil and natural gas properties or other assets in the future, without any obligation to offer us the opportunity to purchase any of those assets. As a result, our renouncing our interest and expectancy in any business opportunity that may be from time to time presented to NGP, Carlyle or their respective affiliates could adversely impact our business or prospects if attractive business opportunities are procured by such parties for their own benefit rather than for ours. Please read “Description of Capital Stock—Corporate Opportunity.”
NGP and Carlyle are established participants in the oil and natural gas industry and have resources greater than ours, which may make it more difficult for us to compete with NGP and Carlyle with respect to commercial activities as well as for potential acquisitions. We cannot assure you that any conflicts that may arise between us and our stockholders, on the one hand, and NGP or Carlyle, on the other hand, will be resolved in our favor. As a result, competition from NGP, Carlyle and their respective affiliates could adversely impact our results of operations.
Our amended and restated certificate of incorporation and amended and restated bylaws, as well as Delaware law, will contain provisions that could discourage acquisition bids or merger proposals, which may adversely affect the market price of our common stock and could deprive our investors of the opportunity to receive a premium for their shares.
Our amended and restated certificate of incorporation will authorize our board of directors to issue preferred stock without stockholder approval in one or more series, designate the number of shares constituting any series, and fix the rights, preferences, privileges and restrictions thereof, including dividend rights, voting rights, rights and terms of redemption, redemption price or prices and liquidation preferences of such series. If our board of directors elects to issue preferred stock, it could be more difficult for a third party to acquire us. In addition, some provisions of our amended and restated certificate of incorporation and amended and restated bylaws could make it more difficult for a third party to acquire control of us, even if the change of control would be beneficial to our stockholders. These provisions include:
| • | at such time as a group that includes Centennial HoldCo and Celero no longer beneficially own or control the voting of more than 50% of our outstanding common stock, dividing our board of directors into three classes of directors, with each class serving staggered three-year terms; |
| • | at such time as a group that includes Centennial HoldCo and Celero no longer beneficially own or control the voting of more than 50% of our outstanding common stock, providing that all vacancies, including newly created directorships, may, except as otherwise required by law or, if applicable, the rights of holders of a series of preferred stock, only be filled by the affirmative vote of a majority of directors then in office, even if less than a quorum (prior to such time, vacancies may also be filled by stockholders holding a majority of the outstanding shares); |
| • | at such time as a group that includes Centennial HoldCo and Celero no longer beneficially own or control the voting of more than 50% of our outstanding common stock, permitting any action by stockholders to be taken only at an annual meeting or special meeting rather than by a written consent of the stockholders, subject to the rights of any series of preferred stock with respect to such rights; |
44
Table of Contents
| • | at such time as a group that includes Centennial HoldCo and Celero no longer beneficially own or control the voting of more than 50% of our outstanding common stock, permitting special meetings of our stockholders to be called only by our board of directors pursuant to a resolution adopted by the affirmative vote of a majority of the total number of authorized directors whether or not there exist any vacancies in previously authorized directorships (prior to such time, a special meeting may also be called at the request of stockholders holding a majority of the outstanding shares entitled to vote); |
| • | at such time as a group that includes Centennial HoldCo and Celero no longer beneficially own or control the voting of more than 50% of our outstanding common stock, requiring the affirmative vote of the holders of at least 75% in voting power of all then outstanding common stock entitled to vote generally in the election of directors, voting together as a single class, to remove any or all of the directors from office at any time, and directors will be removable only for “cause”; |
| • | prohibiting cumulative voting in the election of directors; |
| • | establishing advance notice provisions for stockholder proposals and nominations for elections to the board of directors to be acted upon at meetings of stockholders; and |
| • | providing that the board of directors is expressly authorized to adopt, or to alter or repeal our bylaws. |
Our amended and restated certificate of incorporation will designate the Court of Chancery of the State of Delaware as the sole and exclusive forum for certain types of actions and proceedings that may be initiated by our stockholders, which could limit our stockholders’ ability to obtain a favorable judicial forum for disputes with us or our directors, officers, employees or agents.
Our amended and restated certificate of incorporation will provide that, unless we consent in writing to the selection of an alternative forum, the Court of Chancery of the State of Delaware will, to the fullest extent permitted by applicable law, be the sole and exclusive forum for (i) any derivative action or proceeding brought on our behalf, (ii) any action asserting a claim of breach of a fiduciary duty owed by any of our directors, officers, employees or agents to us or our stockholders, (iii) any action asserting a claim arising pursuant to any provision of the Delaware General Corporation Law (the “DGCL”), our amended and restated certificate of incorporation or our bylaws, or (iv) any action asserting a claim against us that is governed by the internal affairs doctrine, in each such case subject to such Court of Chancery having personal jurisdiction over the indispensable parties named as defendants therein. Any person or entity purchasing or otherwise acquiring any interest in shares of our capital stock will be deemed to have notice of, and consented to, the provisions of our amended and restated certificate of incorporation described in the preceding sentence. This choice of forum provision may limit a stockholder’s ability to bring a claim in a judicial forum that it finds favorable for disputes with us or our directors, officers, employees or agents, which may discourage such lawsuits against us and such persons. Alternatively, if a court were to find these provisions of our amended and restated certificate of incorporation inapplicable to, or unenforceable in respect of, one or more of the specified types of actions or proceedings, we may incur additional costs associated with resolving such matters in other jurisdictions, which could adversely affect our business, financial condition or results of operations.
Investors in this offering will experience immediate and substantial dilution of $ per share.
Based on an assumed initial public offering price of $ per share (the midpoint of the range set forth on the cover of this prospectus), purchasers of our common stock in this offering will experience an immediate and substantial dilution of $ per share in the as adjusted net tangible book value per share of common stock from the initial public offering price, and our as adjusted net tangible book value as of March 31, 2016 after giving effect to this offering would be $ per share. This dilution is due in large part to earlier investors having paid substantially less than the initial public offering price when they purchased their shares. See “Dilution.”
45
Table of Contents
We do not intend to pay cash dividends on our common stock, and our credit agreement places certain restrictions on our ability to do so. Consequently, your only opportunity to achieve a return on your investment is if the price of our common stock appreciates.
We do not plan to declare cash dividends on shares of our common stock in the foreseeable future. Additionally, our credit agreement places certain restrictions on our ability to pay cash dividends. Consequently, your only opportunity to achieve a return on your investment in us will be if you sell your common stock at a price greater than you paid for it. There is no guarantee that the price of our common stock that will prevail in the market will ever exceed the price that you pay in this offering.
Future sales of our common stock in the public market, or the perception that such sales may occur, could reduce our stock price, and any additional capital raised by us through the sale of equity or convertible securities may dilute your ownership in us.
We may sell additional shares of common stock in subsequent public offerings. We may also issue additional shares of common stock or convertible securities. After the completion of this offering, we will have outstanding shares of common stock. This number includes shares that we and the selling stockholders are selling in this offering and shares that the selling stockholders may sell in this offering if the underwriters’ over-allotment option is fully exercised, which may be resold immediately in the public market. Following the completion of this offering, and assuming full exercise of the underwriters’ over-allotment option, the Existing Investors will own shares of our common stock, or approximately % of our total outstanding shares, all of which are restricted from immediate resale under the federal securities laws and are subject to the lock-up agreements between them and the underwriters described in “Underwriting,” but may be sold into the market in the future. The Existing Investors will be party to a registration rights agreement, which will require us to effect the registration of their shares in certain circumstances no earlier than the expiration of the lock-up period contained in the underwriting agreement entered into in connection with this offering.
In connection with this offering, we intend to file a registration statement with the SEC on Form S-8 providing for the registration of shares of our common stock issued or reserved for issuance under the 2016 Long Term Incentive Plan. Subject to the satisfaction of vesting conditions, the expiration of lock-up agreements and the requirements of Rule 144, shares registered under the registration statement on Form S-8 may be made available for resale immediately in the public market without restriction.
We cannot predict the size of future issuances of our common stock or securities convertible into common stock or the effect, if any, that future issuances and sales of shares of our common stock will have on the market price of our common stock. Sales of substantial amounts of our common stock (including shares issued in connection with an acquisition), or the perception that such sales could occur, may adversely affect prevailing market prices of our common stock.
The underwriters of this offering may waive or release parties to the lock-up agreements entered into in connection with this offering, which could adversely affect the price of our common stock.
We, all of our directors and executive officers, and the selling stockholders have entered or will enter into lock-up agreements pursuant to which we and they will be subject to certain restrictions with respect to the sale or other disposition of our common stock for a period of 180 days following the date of this prospectus. Credit Suisse Securities (USA) LLC, at any time and without notice, may release all or any portion of the common stock subject to the foregoing lock-up agreements. See “Underwriting” for more information on these agreements. If the restrictions under the lock-up agreements are waived, then the common stock, subject to compliance with the Securities Act or exceptions therefrom, will be available for sale into the public markets, which could cause the market price of our common stock to decline and impair our ability to raise capital.
46
Table of Contents
We may issue preferred stock whose terms could adversely affect the voting power or value of our common stock.
Our amended and restated certificate of incorporation will authorize us to issue, without the approval of our stockholders, one or more classes or series of preferred stock having such designations, preferences, limitations and relative rights, including preferences over our common stock respecting dividends and distributions, as our board of directors may determine. The terms of one or more classes or series of preferred stock could adversely impact the voting power or value of our common stock. For example, we might grant holders of preferred stock the right to elect some number of our directors in all events or on the happening of specified events or the right to veto specified transactions. Similarly, the repurchase or redemption rights or liquidation preferences we might assign to holders of preferred stock could affect the residual value of the common stock.
We expect to be a “controlled company” within the meaning of the NASDAQ rules and, as a result, will qualify for and intend to rely on exemptions from certain corporate governance requirements.
Upon completion of this offering, NGP, through Centennial HoldCo and Celero, will collectively beneficially control a majority of the combined voting power of all classes of our outstanding voting stock. As a result, we expect to be a controlled company within the meaning of the NASDAQ corporate governance standards. Under the NASDAQ rules, a company of which more than 50% of the voting power is held by another person or group of persons acting together is a controlled company and may elect not to comply with certain NASDAQ corporate governance requirements, including the requirements that:
| • | a majority of the board of directors consist of independent directors as defined under the rules of NASDAQ; |
| • | the nominating and governance committee be composed entirely of independent directors with a written charter addressing the committee’s purpose and responsibilities; and |
| • | the compensation committee be composed entirely of independent directors with a written charter addressing the committee’s purpose and responsibilities. |
These requirements will not apply to us as long as we remain a controlled company. Following this offering, we intend to utilize some or all of these exemptions. Accordingly, you may not have the same protections afforded to stockholders of companies that are subject to all of the corporate governance requirements of the NASDAQ. See “Management.”
For as long as we are an emerging growth company, we will not be required to comply with certain reporting requirements, including those relating to accounting standards and disclosure about our executive compensation, that apply to other public companies.
In April 2012, President Obama signed into law the JOBS Act. We are classified as an “emerging growth company” under the JOBS Act. For as long as we are an emerging growth company, which may be up to five full fiscal years, unlike other public companies, we will not be required to, among other things: (i) provide an auditor’s attestation report on management’s assessment of the effectiveness of our system of internal control over financial reporting pursuant to Section 404(b) of the Sarbanes-Oxley Act; (ii) comply with any new requirements adopted by the PCAOB requiring mandatory audit firm rotation or a supplement to the auditor’s report in which the auditor would be required to provide additional information about the audit and the financial statements of the issuer; (iii) provide certain disclosures regarding executive compensation required of larger public companies; or (iv) hold nonbinding advisory votes on executive compensation. We will remain an emerging growth company for up to five years, although we will lose that status sooner if we have more than $1.0 billion of revenues in a fiscal year, have more than $700.0 million in market value of our common stock held by non-affiliates, or issue more than $1.0 billion of non-convertible debt over a three-year period.
To the extent that we rely on any of the exemptions available to emerging growth companies, you will receive less information about our executive compensation and internal control over financial reporting than issuers that are
47
Table of Contents
not emerging growth companies. If some investors find our common stock to be less attractive as a result, there may be a less active trading market for our common stock and our stock price may be more volatile.
If securities or industry analysts do not publish research or reports about our business, if they adversely change their recommendations regarding our common stock or if our operating results do not meet their expectations, our stock price could decline.
The trading market for our common stock will be influenced by the research and reports that industry or securities analysts publish about us or our business. If one or more of these analysts cease coverage of our company or fail to publish reports on us regularly, we could lose visibility in the financial markets, which in turn could cause our stock price or trading volume to decline. Moreover, if one or more of the analysts who cover our company downgrades our common stock or if our operating results do not meet their expectations, our stock price could decline.
48
Table of Contents
CAUTIONARY STATEMENT REGARDING FORWARD-LOOKING STATEMENTS
The information in this prospectus includes “forward-looking statements.” All statements, other than statements of historical fact included in this prospectus, regarding our strategy, future operations, financial position, estimated revenues and losses, projected costs, prospects, plans and objectives of management are forward-looking statements. When used in this prospectus, the words “could,” “believe,” “anticipate,” “intend,” “estimate,” “expect,” “project” and similar expressions are intended to identify forward-looking statements, although not all forward-looking statements contain such identifying words. These forward-looking statements are based on management’s current expectations and assumptions about future events and are based on currently available information as to the outcome and timing of future events. When considering forward-looking statements, you should keep in mind the risk factors and other cautionary statements described under the heading “Risk Factors” included in this prospectus.
Forward-looking statements may include statements about:
| • | our business strategy; |
| • | our reserves; |
| • | our drilling prospects, inventories, projects and programs; |
| • | our ability to replace the reserves we produce through drilling and property acquisitions; |
| • | our financial strategy, liquidity and capital required for our development program; |
| • | our realized oil, natural gas and NGL prices; |
| • | the timing and amount of our future production of oil, natural gas and NGLs; |
| • | our hedging strategy and results; |
| • | our future drilling plans; |
| • | our competition and government regulations; |
| • | our ability to obtain permits and governmental approvals; |
| • | our pending legal or environmental matters; |
| • | our marketing of oil, natural gas and NGLs; |
| • | our leasehold or business acquisitions; |
| • | our costs of developing our properties; |
| • | general economic conditions; |
| • | credit markets; |
| • | uncertainty regarding our future operating results; and |
| • | our plans, objectives, expectations and intentions contained in this prospectus that are not historical. |
We caution you that these forward-looking statements are subject to all of the risks and uncertainties, most of which are difficult to predict and many of which are beyond our control, incident to the development, production, gathering and sale of oil and natural gas. These risks include, but are not limited to, commodity price volatility, inflation, lack of availability of drilling and production equipment and services, environmental risks, drilling and other operating risks, regulatory changes, the uncertainty inherent in estimating reserves and in projecting future rates of production, cash flow and access to capital, the timing of development expenditures and the other risks described under “Risk Factors” in this prospectus.
49
Table of Contents
Reserve engineering is a process of estimating underground accumulations of oil and natural gas that cannot be measured in an exact way. The accuracy of any reserve estimate depends on the quality of available data, the interpretation of such data and price and cost assumptions made by reserve engineers. In addition, the results of drilling, testing and production activities may justify revisions of estimates that were made previously. If significant, such revisions would change the schedule of any further production and development drilling. Accordingly, reserve estimates may differ significantly from the quantities of oil and natural gas that are ultimately recovered.
Should one or more of the risks or uncertainties described in this prospectus occur, or should underlying assumptions prove incorrect, our actual results and plans could differ materially from those expressed in any forward-looking statements.
All forward-looking statements, expressed or implied, included in this prospectus are expressly qualified in their entirety by this cautionary statement. This cautionary statement should also be considered in connection with any subsequent written or oral forward-looking statements that we or persons acting on our behalf may issue.
Except as otherwise required by applicable law, we disclaim any duty to update any forward-looking statements, all of which are expressly qualified by the statements in this section, to reflect events or circumstances after the date of this prospectus.
50
Table of Contents
We expect to receive approximately $ million of net proceeds (assuming the midpoint of the price range set forth on the cover of this prospectus) from the sale of the common stock offered by us after deducting underwriting discounts and commissions and estimated offering expenses payable by us. We will not receive any proceeds from the sale of shares by the selling stockholders.
We intend to use a portion of the net proceeds from this offering to fully repay our $65.0 million term loan and the outstanding indebtedness under our revolving credit facility and the remaining net proceeds to fund our 2016, 2017 and 2018 capital expenditures and for general corporate purposes. The following table illustrates our anticipated use of the net proceeds from this offering:
| Sources of Funds |
Use of Funds | |||||
| (In millions) | ||||||
| Net proceeds from this offering |
$ | Repayment of our term loan |
$ | |||
| Repayment of our credit facility |
||||||
| Funding of our 2016, 2017 and 2018 capital expenditures |
||||||
| General corporate purposes |
||||||
|
|
| |||||
| Total sources of funds |
$ | Total uses of funds |
$ | |||
|
|
| |||||
Our term loan matures on April 15, 2018. Interest on the term loan is LIBOR plus 5.25%. At March 31, 2016, the weighted average interest rate on our term loan was 5.69%. As of June 30, 2016, we had $ million of outstanding borrowings and $0.5 million of letters of credit outstanding under our revolving credit facility. Our revolving credit facility matures October 15, 2019 and bears interest at a variable rate. At March, 31, 2016, the weighted average interest rate on borrowings under our revolving credit facility was 2.44%. We also pay a commitment fee on unused amounts of our revolving credit facility ranging from 37.5 basis points to 50 basis points, depending on the percentage of the borrowing base utilized. The outstanding borrowings under our revolving credit facility were incurred to fund a portion of our 2014, 2015 and 2016 capital expenditures. We may at any time reborrow amounts repaid under our revolving credit facility, and we expect to do so in the future to fund our capital program.
A $1.00 increase or decrease in the assumed initial public offering price of $ per share would cause the net proceeds from this offering, after deducting the underwriting discounts and commissions and estimated offering expenses, received by us to increase or decrease, respectively, by approximately $ million, assuming the number of shares offered by us, as set forth on the cover page of this prospectus, remains the same. If the proceeds increase due to a higher initial public offering price, we would use the additional net proceeds to fund our 2016, 2017 and 2018 capital expenditures or for general corporate purposes. If the proceeds decrease due to a lower initial public offering price, then we would first reduce by a corresponding amount the net proceeds directed to general corporate purposes and then, if necessary, the net proceeds directed to repay outstanding borrowings under our revolving credit facility.
51
Table of Contents
We have never declared or paid, and do not anticipate declaring or paying, any cash dividends to holders of our common stock in the foreseeable future. We currently intend to retain future earnings, if any, to finance our operations and the growth of our business. Our future dividend policy is within the discretion of our board of directors and will depend upon then-existing conditions, including our results of operations, financial condition, capital requirements, investment opportunities, statutory restrictions on our ability to pay dividends and other factors our board of directors may deem relevant. In addition, our credit agreement places restrictions on our ability to pay cash dividends.
52
Table of Contents
The following table sets forth our cash and cash equivalents and capitalization as of March 31, 2016:
| • | on an actual basis for our predecessor; and |
| • | on a pro forma basis to give effect to our corporate reorganization and the sale of shares of our common stock in this offering at an assumed initial offering price of $ per share (which is the midpoint of the range set forth on the cover of this prospectus) and the application of the net proceeds from this offering as set forth under “Use of Proceeds.” |
The pro forma information set forth in the table below is illustrative only and will be adjusted based on the actual initial public offering price and other final terms of this offering. This table should be read in conjunction with “Use of Proceeds,” the historical audited and unaudited consolidated and combined financial statements of our predecessor and accompanying notes included elsewhere in this prospectus.
| As of March 31, 2016 | ||||||||
| Actual(1) | Pro Forma(2) | |||||||
| (In thousands, except number of shares and par value) |
||||||||
| Cash and cash equivalents |
$ | 98 | $ | |||||
|
|
|
|
|
|||||
| Long-term debt, including current maturities: |
||||||||
| Revolving credit facility(3) |
77,000 | — | ||||||
| Term loan, net of unamortized deferred financing costs(4) |
64,687 | — | ||||||
|
|
|
|
|
|||||
| Total long-term debt |
$ | 141,687 | $ | — | ||||
|
|
|
|
|
|||||
| Owners’ equity |
$ | 436,403 | $ | |||||
| Stockholders’ equity: |
||||||||
| Common stock—$0.01 par value; no shares authorized, issued or outstanding, actual; shares authorized, shares issued and outstanding, pro forma |
— | |||||||
| Additional paid-in capital |
— | |||||||
| Accumulated deficit |
— | |||||||
|
|
|
|
|
|||||
| Total owners’ and stockholders’ equity |
$ | 436,403 | $ | |||||
|
|
|
|
|
|||||
| Total capitalization |
$ | 578,090 | $ | |||||
|
|
|
|
|
|||||
| (1) | Centennial Resource Development, Inc. was formed as a holding company in October 2014 and has not had any operations since its formation. Accordingly, Centennial Resource Development, Inc. does not have historical financial operating results, and the data in this table has been derived from the historical consolidated and combined financial statements included in this prospectus which pertain to the assets, liabilities, revenues and expenses of our accounting predecessor. |
| (2) | A $1.00 increase (decrease) in the assumed initial public offering price of $ per share, which is the midpoint of the price range set forth on the cover page of this prospectus, would increase (decrease) additional paid-in capital, total equity and total capitalization by approximately $ million, $ million and $ million, respectively, assuming that the number of shares offered by us, as set forth on the cover page of this prospectus, remains the same, after deducting the estimated underwriting discounts and commissions payable by us. We may also increase or decrease the number of shares we are offering. An increase (decrease) of one million shares offered by us at an assumed offering price of $ per share, which is the midpoint of the price range set forth on the cover page of this prospectus, would increase (decrease) additional paid-in capital, total stockholders’ equity and total capitalization by approximately $ million, $ million and $ million, respectively, after deducting the estimated underwriting discounts and commissions and estimated offering expenses payable by us. |
53
Table of Contents
| (3) | As of March 31, 2016, the borrowing base was $140.0 million, we had $77.0 million of outstanding borrowings and $0.5 million of letters of credit outstanding under our revolving credit facility, and we were able to incur approximately $62.5 million of additional indebtedness under our revolving credit facility. As of June 30, 2016, the borrowing base was $140.0 million, we had $ million of outstanding borrowings and $0.5 million of letters of credit outstanding under our revolving credit facility, and we were able to incur approximately $ million of additional indebtedness under our revolving credit facility. After giving effect to the sale of shares of our common stock in this offering and the application of the anticipated net proceeds of this offering, we expect to have $ million of available borrowing capacity under our revolving credit facility. However, borrowings could be limited due to covenant restrictions. |
| (4) | Unamortized deferred financing costs, which were approximately $0.3 million as of March 31, 2016, have been netted against the carrying value of our $65.0 million term loan. |
54
Table of Contents
Purchasers of our common stock in this offering will experience immediate and substantial dilution in the net tangible book value (tangible assets less total liabilities) per share of our common stock for accounting purposes. Our net tangible book value as of March 31, 2016, after giving pro forma effect to the corporate reorganization, was approximately $ million, or $ per share.
Pro forma net tangible book value per share is determined by dividing our net tangible book value, or total tangible assets less total liabilities, by our shares of common stock that will be outstanding immediately prior to the closing of this offering, including giving effect to the corporate reorganization. Assuming an initial public offering price of $ per share (which is the midpoint of the price range set forth on the cover page of this prospectus), after giving effect to the sale of the shares in this offering and further assuming the receipt of the estimated net proceeds (after deducting estimated underwriting discounts and commissions and estimated offering expenses payable by us), our adjusted pro forma net tangible book value as of March 31, 2016 would have been approximately $ million, or $ per share. This represents an immediate increase in the net tangible book value of $ per share to our existing stockholders and an immediate dilution to new investors purchasing shares in this offering of $ per share, resulting from the difference between the offering price and the pro forma as adjusted net tangible book value after this offering. The following table illustrates the per share dilution to new investors purchasing shares in this offering:
| Assumed initial public offering price per share |
$ | |||||||
| Pro forma net tangible book value per share as of March 31, 2016 (after giving effect to the corporate reorganization) |
$ | |||||||
| Increase per share attributable to new investors in this offering |
||||||||
|
|
|
|||||||
| As adjusted pro forma net tangible book value per share (after giving effect to the corporate reorganization and this offering) |
||||||||
|
|
|
|||||||
| Dilution in pro forma net tangible book value per share to new investors in this offering |
$ | |||||||
|
|
|
A $1.00 increase (decrease) in the assumed initial public offering price of $ per share, which is the midpoint of the price range set forth on the cover page of this prospectus, would increase (decrease) our as adjusted pro forma net tangible book value per share after the offering by $ and increase (decrease) the dilution to new investors in this offering by $ per share, assuming the number of shares offered by us, as set forth on the cover page of this prospectus, remains the same, after deducting the estimated underwriting discounts and commissions and estimated offering expenses payable by us.
The following table summarizes, on an adjusted pro forma basis as of March 31, 2016, the total number of shares of common stock owned by existing stockholders and to be owned by new investors at $ per share, which is the midpoint of the price range set forth on the cover page of this prospectus, and the total consideration paid and the average price per share paid by our existing stockholders and to be paid by new investors in this offering at $ , the midpoint of the price range set forth on the cover page of this prospectus, calculated before deduction of estimated underwriting discounts and commissions.
| Shares Acquired |
Total Consideration | Average Price Per Share |
||||||||||||||||
| Number | Percent | Amount | Percent | |||||||||||||||
| Existing stockholders |
% | $ | % | $ | ||||||||||||||
| New investors in this offering |
||||||||||||||||||
|
|
|
|
|
|
|
|
|
|
||||||||||
| Total |
100 | % | $ | 100 | % | $ | ||||||||||||
|
|
|
|
|
|
|
|
|
|
||||||||||
55
Table of Contents
The data in the table excludes shares of common stock reserved for issuance under the 2016 Long Term Incentive Plan (which amount may be increased each year in accordance with the terms of the Plan). If the underwriters’ over-allotment option is exercised in full, the number of shares held by new investors will be increased to , or approximately % of the total number of shares of common stock.
56
Table of Contents
SELECTED HISTORICAL CONSOLIDATED AND COMBINED FINANCIAL DATA
Centennial Resource Development, Inc. was formed as a holding company in October 2014 and has not had any operations since its formation. Accordingly, Centennial Resource Development, Inc. does not have historical financial operating results, and the following table shows selected historical consolidated and combined financial data, for the periods and as of the dates indicated, of Centennial Resource Development, Inc.’s accounting predecessor. For all periods ending on or prior to and all dates as of or prior to the consummation of the Combination on October 15, 2014, the accounting predecessor reflects the combined results of Centennial OpCo and Celero, and for all periods and dates subsequent to October 15, 2014, the accounting predecessor reflects the results of Centennial OpCo. Due to the factors described in “Management’s Discussion and Analysis of Financial Condition and Results of Operations—Factors Affecting the Comparability of Our Results of Operations to the Historical Results of Operations of Our Predecessor,” our future results of operations will not be comparable to the historical results of our predecessor. For more information regarding our predecessor, see “Management’s Discussion and Analysis of Financial Condition and Results of Operations—Our Predecessor and Centennial Resource Development, Inc.”
The selected historical consolidated and combined financial data of our predecessor as of and for the years ended December 31, 2015 and 2014 were derived from the audited historical consolidated and combined financial statements of our predecessor included elsewhere in this prospectus. The selected historical interim consolidated financial data of our predecessor as of March 31, 2016 and for the three months ended March 31, 2016 and 2015 were derived from the unaudited interim condensed consolidated financial statements of our predecessor included elsewhere in this prospectus.
Our historical results are not necessarily indicative of future operating results. The selected consolidated and combined financial data should be read in conjunction with, “Use of Proceeds,” “Capitalization,” “Management’s Discussion and Analysis of Financial Condition and Results of Operations,” “Recent and Formation Transactions,” the historical consolidated and combined financial statements of our predecessor and accompanying notes included elsewhere in this prospectus.
57
Table of Contents
| Our Predecessor | ||||||||||||||||
| Three Months Ended March 31, |
Year Ended December 31, |
|||||||||||||||
| 2016 | 2015 | 2015 | 2014 | |||||||||||||
| (Unaudited) | ||||||||||||||||
| (In thousands, except per share data) | ||||||||||||||||
| Statement of Operations Data: |
||||||||||||||||
| Revenues: |
||||||||||||||||
| Oil sales |
$ | 13,226 | $ | 21,066 | $ | 77,643 | $ | 114,955 | ||||||||
| Natural gas sales |
1,313 | 1,963 | 7,965 | 9,670 | ||||||||||||
| NGL sales |
582 | 1,387 | 4,852 | 7,200 | ||||||||||||
|
|
|
|
|
|
|
|
|
|||||||||
| Total revenues |
15,121 | 24,416 | 90,460 | 131,825 | ||||||||||||
|
|
|
|
|
|
|
|
|
|||||||||
| Operating expenses: |
||||||||||||||||
| Lease operating expenses |
4,042 | 6,497 | 21,173 | 17,690 | ||||||||||||
| Severance and ad valorem taxes |
844 | 1,193 | 5,021 | 6,875 | ||||||||||||
| Transportation, processing, gathering and other operating expenses |
1,130 | 1,283 | 5,732 | 4,772 | ||||||||||||
| Depreciation, depletion, amortization and accretion of asset retirement obligations |
21,303 | 23,230 | 90,084 | 69,110 | ||||||||||||
| Abandonment expense and impairment of unproved properties |
— | — | 7,619 | 20,025 | ||||||||||||
| Exploration |
— | — | 84 | — | ||||||||||||
| Contract termination and rig stacking |
— | 1,540 | 2,387 | — | ||||||||||||
| General and administrative expenses |
2,536 | 2,913 | 14,206 | 31,694 | ||||||||||||
|
|
|
|
|
|
|
|
|
|||||||||
| Total operating expenses |
29,855 | 36,656 | 146,306 | 150,166 | ||||||||||||
|
|
|
|
|
|
|
|
|
|||||||||
| Loss (gain) on sale of oil and natural gas properties |
4 | (2,675 | ) | (2,439 | ) | 2,096 | ||||||||||
|
|
|
|
|
|
|
|
|
|||||||||
| Total operating loss |
(14,738 | ) | (9,565 | ) | (53,407 | ) | (20,437 | ) | ||||||||
|
|
|
|
|
|
|
|
|
|||||||||
| Other income (expense): |
||||||||||||||||
| Interest expense |
(1,641 | ) | (1,526 | ) | (6,266 | ) | (2,475 | ) | ||||||||
| Gain on derivatives instruments |
1,918 | 5,154 | 20,756 | 41,943 | ||||||||||||
| Other income |
— | — | 20 | 281 | ||||||||||||
|
|
|
|
|
|
|
|
|
|||||||||
| Total other income |
277 | 3,628 | 14,510 | 39,749 | ||||||||||||
|
|
|
|
|
|
|
|
|
|||||||||
| (Loss) income before taxes |
(14,461 | ) | (5,937 | ) | (38,897 | ) | 19,312 | |||||||||
| Income tax benefit (expense) |
— | — | 572 | (1,524 | ) | |||||||||||
|
|
|
|
|
|
|
|
|
|||||||||
| Net (loss) income |
(14,461 | ) | (5,937 | ) | (38,325 | ) | 17,788 | |||||||||
| Less: Net loss attributable to noncontrolling interest |
— | — | — | (2 | ) | |||||||||||
|
|
|
|
|
|
|
|
|
|||||||||
| Net (loss) income |
$ | (14,461 | ) | $ | (5,937 | ) | $ | (38,325 | ) | $ | 17,790 | |||||
|
|
|
|
|
|
|
|
|
|||||||||
| Pro Forma Per Share Data (Unaudited)(1): |
||||||||||||||||
| Net loss per common share: |
||||||||||||||||
| Basic and diluted |
$ | $ | ||||||||||||||
| Weighted average common shares outstanding: |
||||||||||||||||
| Basic and diluted |
||||||||||||||||
| Cash Flow Data: |
||||||||||||||||
| Net cash provided by operating activities |
$ | 18,552 | $ | 27,632 | $ | 68,882 | $ | 97,248 | ||||||||
| Net cash used in investing activities |
(22,419 | ) | (79,006 | ) | (198,635 | ) | (163,380 | ) | ||||||||
| Net cash provided by financing activities |
2,197 | 38,913 | 118,504 | 36,966 | ||||||||||||
| Other Financial Data: |
||||||||||||||||
| Adjusted EBITDAX(2) |
$ | 15,198 | $ | 22,259 | $ | 82,279 | $ | 88,108 | ||||||||
58
Table of Contents
| (1) | The net loss per common share and weighted average common shares outstanding reflect the estimated number of shares of common stock we expect to have outstanding upon the completion of the corporate reorganization described under “Recent and Formation Transactions—Formation Transactions—Our Corporate Reorganization” and this offering. The pro forma per share data also reflects additional pro forma income tax benefit of $5.1 million and $13.6 million for the three months ended March 31, 2016 and the year ended December 31, 2015 associated with the income tax effects of the corporate reorganization described under “Recent and Formation Transactions—Formation Transactions—Our Corporate Reorganization” or this offering. Centennial Resource Development, Inc. is a C-corp under the Code, and as a result, will be subject to U.S. federal, state and local income taxes. Although our predecessor was subject to franchise tax in the State of Texas, it generally passed through its taxable income to its owners for other income tax purposes and thus was not subject to U.S. federal income taxes or other state or local income taxes. |
| (2) | Adjusted EBITDAX is a non-GAAP financial measure. For a definition of Adjusted EBITDAX and a reconciliation of Adjusted EBITDAX to net income, see “Prospectus Summary—Summary Historical Financial Data—Non-GAAP Financial Measure.” |
| Our Predecessor | ||||||||||||
| March 31, 2016 |
December 31, | |||||||||||
| 2015 | 2014 | |||||||||||
| (Unaudited) | ||||||||||||
| (In thousands) | ||||||||||||
| Balance Sheet Data: |
||||||||||||
| Cash and cash equivalents |
$ | 98 | $ | 1,768 | $ | 13,017 | ||||||
| Other current assets |
22,153 | 32,377 | 54,329 | |||||||||
|
|
|
|
|
|
|
|||||||
| Total current assets |
22,251 | 34,145 | 67,346 | |||||||||
|
|
|
|
|
|
|
|||||||
| Total property and equipment, net |
579,863 | 578,787 | 540,624 | |||||||||
| Other long-term assets |
2,953 | 3,363 | 7,799 | |||||||||
|
|
|
|
|
|
|
|||||||
| Total assets |
$ | 605,067 | $ | 616,295 | $ | 615,769 | ||||||
|
|
|
|
|
|
|
|||||||
| Current liabilities |
$ | 22,146 | $ | 22,133 | $ | 103,512 | ||||||
| Revolving credit facility |
77,000 | 74,000 | 65,000 | |||||||||
| Term loan, net of unamortized deferred financing costs |
64,687 | 64,649 | 64,568 | |||||||||
| Other long-term liabilities |
4,831 | 4,649 | 4,757 | |||||||||
|
|
|
|
|
|
|
|||||||
| Total liabilities |
168,664 | 165,431 | 237,837 | |||||||||
| Owners’ equity |
436,403 | 450,864 | 377,932 | |||||||||
|
|
|
|
|
|
|
|||||||
| Total liabilities and owners’ equity |
$ | 605,067 | $ | 616,295 | $ | 615,769 | ||||||
|
|
|
|
|
|
|
|||||||
59
Table of Contents
MANAGEMENT’S DISCUSSION AND ANALYSIS OF
FINANCIAL CONDITION AND RESULTS OF OPERATIONS
The following discussion and analysis should be read in conjunction with the “Selected Historical Consolidated and Combined Financial Data” and the accompanying financial statements and related notes included elsewhere in this prospectus. The following discussion contains forward-looking statements that reflect our future plans, estimates, beliefs and expected performance. The forward-looking statements are dependent upon events, risks and uncertainties that may be outside our control. Our actual results could differ materially from those discussed in these forward-looking statements. Factors that could cause or contribute to such differences include, but are not limited to, market prices for oil, natural gas and NGLs, production volumes, estimates of proved reserves, capital expenditures, economic and competitive conditions, regulatory changes and other uncertainties, as well as those factors discussed below and elsewhere in this prospectus, particularly in “Risk Factors” and “Cautionary Statement Regarding Forward-Looking Statements,” all of which are difficult to predict. In light of these risks, uncertainties and assumptions, the forward-looking events discussed may not occur. We do not undertake any obligation to publicly update any forward-looking statements except as otherwise required by applicable law.
Our Predecessor and Centennial Resource Development, Inc.
Centennial Resource Development, Inc. was formed as a holding company in October 2014 and has not had any operations since its formation. Accordingly, Centennial Resource Development, Inc. does not have historical financial operating results. Our accounting predecessor, for all periods ending on or before October 15, 2014 and for all dates on or before October 15, 2014, reflects the combined results of (i) Centennial OpCo, which was formed in August 2012 to engage in the development and acquisition of both conventional and unconventional oil and associated liquids-rich natural gas reserves in the Permian Basin, and (ii) Celero, which was formed in 2006 to focus on the development and acquisition of oil and natural gas properties in Texas and New Mexico, primarily in the Permian Basin in West Texas. On October 15, 2014, through the Combination, Celero conveyed substantially all of its oil and natural gas properties and other assets to Centennial OpCo in exchange for membership interests in Centennial OpCo, and as a result, subsequent to October 15, 2014, our accounting predecessor reflects the results of Centennial OpCo. As a result of the dispositions discussed under “—Factors Affecting the Comparability of Our Results of Operations to the Historical Results of Operations of Our Predecessor—Dispositions,” substantially all of our operations are now concentrated in the Delaware Basin in West Texas.
Pursuant to the terms of a corporate reorganization that will be completed prior to the closing of this offering, our Existing Investors will contribute all of their interests in Centennial OpCo to Centennial Resource Development, Inc., the issuer of common stock in this offering, in exchange for shares of common stock of Centennial Resource Development, Inc. For more information on our corporate formation transactions, see “Recent and Formation Transactions—Formation Transactions.”
Overview
We are an independent oil and natural gas company focused on the development and acquisition of unconventional oil and associated liquids-rich natural gas reserves in the Permian Basin. Our assets are concentrated in the Delaware Basin, a sub-basin of the Permian Basin. Our horizontal wells span an area approximately 45 miles long by 20 miles wide where we have established commercial production in five distinct zones: the 3rd Bone Spring Sandstone, Upper Wolfcamp A, Lower Wolfcamp A, Wolfcamp B and Wolfcamp C.
60
Table of Contents
Market Conditions
The oil and gas industry is cyclical and commodity prices are highly volatile. In the second half of 2014, oil prices began a rapid and significant decline as the global oil supply began to outpace demand. During 2015 and thus far in 2016, the global oil supply has continued to outpace demand, resulting in a sustained decline in realized prices for oil production. In general, this imbalance between supply and demand reflects the significant supply growth achieved in the United States as a result of shale drilling and oil production increases by certain other countries, including Russia and Saudi Arabia, as part of an effort to retain market share, combined with only modest demand growth in the United States and less-than-expected demand in other parts of the world, particularly in Europe and China. Although there has been a dramatic decrease in drilling activity in the industry, oil storage levels in the United States remain at historically high levels. Until supply and demand balance and the overhang in storage levels begins to decline, prices are expected to remain under pressure. In addition, the lifting of economic sanctions on Iran has resulted in increasing supplies of oil from Iran, adding further downward pressure to oil prices. NGL prices generally correlate to the price of oil. Also adversely affecting the price for NGLs is the supply of NGLs in the United States, which has continued to grow due to an increase in industry participants targeting projects that produce NGLs in recent years. Prices for domestic natural gas began to decline during the third quarter of 2014 and have continued to be weak throughout 2015 and thus far in 2016. The declines in natural gas prices are primarily due to an imbalance between supply and demand across North America. The duration and magnitude of the commodity price declines cannot be accurately predicted.
Our revenue, profitability and future growth are highly dependent on the prices we receive for our oil and natural gas production, as well as NGLs that are extracted from our natural gas during processing. Compared to 2014, our realized oil price for 2015 fell 47.3% to $42.43 per barrel, and our realized oil price for the three months ended March 31, 2016 has further decreased to $28.14 per barrel. Similarly, our realized natural gas price for 2015 dropped 43.2% to $2.60 per Mcf and our realized price for NGLs declined 52.2% to $14.66 per barrel. For the three months ended March 31, 2016, our realized price for natural gas was $1.88 per Mcf and our realized price for NGLs was $8.31 per barrel. Lower oil, natural gas and NGL prices not only may decrease our revenues, but also may reduce the amount of oil, natural gas and NGLs that we can produce economically and therefore potentially lower our oil, natural gas and NGL reserves. Lower commodity prices in the future could result in impairments of our properties and may materially and adversely affect our future business, financial condition, results of operations, operating cash flows, liquidity or ability to finance planned capital expenditures. Lower oil, natural gas and NGL prices may also reduce the borrowing base under our credit agreement, which is determined at the discretion of the lenders and is based on the collateral value of our proved reserves that have been mortgaged to the lenders. Alternatively, higher oil and natural gas prices may result in significant non-cash fair value losses being incurred on our derivatives, which could cause us to experience net losses when oil and natural gas prices rise.
How We Evaluate Our Operations
We use a variety of financial and operational metrics to assess the performance of our oil and natural gas operations, including:
| • | realized prices on the sale of oil, natural gas and NGLs, including the effect of our commodity derivative contracts on our oil production; |
| • | production results; |
| • | lease operating expenses; and |
| • | Adjusted EBITDAX. |
See “—Sources of Our Revenues,” “—Production Results,” “—Operating Costs and Expenses” and “—Adjusted EBITDAX” for a discussion of these metrics.
61
Table of Contents
Sources of Our Revenues
Our revenues are derived from the sale of our oil and natural gas production, as well as the sale of NGLs that are extracted from our natural gas during processing. Oil sales contributed 87% of our total revenues for the first three months of 2016. Natural gas sales contributed 9% and NGL sales contributed 4% of our total revenues for the first three months of 2016. Our oil, natural gas and NGL revenues do not include the effects of derivatives.
Increases or decreases in our revenue, profitability and future production growth are highly dependent on the commodity prices we receive. Oil, natural gas and NGL prices are market driven and have been historically volatile, and we expect that future prices will continue to fluctuate due to supply and demand factors, seasonality and geopolitical and economic factors. See “—Market Conditions” for information regarding the current commodity price environment. A $1.00 per barrel change in our realized oil price would have resulted in a $0.5 million change in oil revenues for the first three months of 2016. A $0.10 per Mcf change in our realized natural gas price would have resulted in a $0.1 million change in our gas revenues for the first three months of 2016. A $1.00 per barrel change in NGL prices would have changed revenue by $0.1 million for the first three months of 2016.
The following table presents our average realized commodity prices, as well as the effects of derivative settlements.
| Three Months Ended March 31, |
Year Ended December 31, |
|||||||||||||||
| 2016 | 2015 | 2015 | 2014 | |||||||||||||
| Crude Oil (per Bbl): |
||||||||||||||||
| Average NYMEX price |
$ | 33.63 | $ | 48.57 | $ | 48.76 | $ | 92.91 | ||||||||
| Realized price, before the effects of derivative settlements |
28.14 | 42.22 | 42.43 | 80.50 | ||||||||||||
| Effects of derivative settlements |
18.36 | 18.73 | 19.18 | 3.23 | ||||||||||||
| Natural Gas: |
||||||||||||||||
| Average NYMEX price (per MMBtu) |
$ | 1.98 | $ | 2.81 | $ | 2.63 | $ | 4.26 | ||||||||
| Realized price, before the effects of derivative settlements (per Mcf) |
1.88 | 2.78 | 2.60 | 4.58 | ||||||||||||
| Effects of derivative settlements (per Mcf) |
— | 0.54 | 0.43 | — | ||||||||||||
| NGLs (per Bbl): |
||||||||||||||||
| Average realized NGL price |
$ | 8.31 | $ | 17.12 | $ | 14.66 | $ | 30.64 | ||||||||
While quoted NYMEX oil and natural gas prices are generally used as a basis for comparison within our industry, the prices we receive are affected by quality, energy content, location and transportation differentials for these products.
See “—Predecessor Results of Operations” below for an analysis of the impact changes in realized prices had on our revenues.
Production Results
The following table presents historical production volumes for our properties for the three months ended March 31, 2016 and 2015 and the years ended December 31, 2015 and 2014:
| Three Months Ended March 31, |
Year Ended December 31, |
|||||||||||||||
| 2016 | 2015 | 2015 | 2014 | |||||||||||||
| Oil (MBbls) |
470 | 499 | 1,830 | 1,428 | ||||||||||||
| Natural gas (MMcf) |
698 | 705 | 3,058 | 2,112 | ||||||||||||
| NGLs (MBbls) |
70 | 81 | 331 | 235 | ||||||||||||
|
|
|
|
|
|
|
|
|
|||||||||
| Total (MBoe)(1) |
656 | 698 | 2,671 | 2,015 | ||||||||||||
| Average net daily production (Boe/d)(1) |
7,212 | 7,750 | 7,317 | 5,521 | ||||||||||||
62
Table of Contents
| (1) | May not sum or recalculate due to rounding. |
As reservoir pressures decline, production from a given well or formation decreases. Growth in our future production and reserves will depend on our ability to continue to add proved reserves in excess of our production. Accordingly, we plan to maintain our focus on adding reserves through drilling as well as acquisitions. Our ability to add reserves through development projects and acquisitions is dependent on many factors, including our ability to borrow or raise capital, obtain regulatory approvals, procure contract drilling rigs and personnel and successfully identify and consummate acquisitions. Please read “Risk Factors—Risks Related to Our Business” for a discussion of these and other risks affecting our proved reserves and production.
Derivative Activity
Pricing for oil and natural gas production has been volatile and unpredictable for several years, and we expect this volatility to continue in the future. Due to this volatility, we have historically used commodity derivative instruments, such as collars, swaps and basis swaps, to hedge price risk associated with a portion of our anticipated production. Our hedging instruments allow us to reduce, but not eliminate, the potential effects of the variability in cash flow from operations due to fluctuations in oil and natural gas prices and provide increased certainty of cash flows for our drilling program and debt service requirements. These instruments provide only partial price protection against declines in oil and natural gas prices and may partially limit our potential gains from future increases in prices. See “—Quantitative and Qualitative Disclosure About Market Risk—Commodity Price Risk” for information regarding our exposure to market risk, including the effects of changes in commodity prices, and our commodity derivative contracts.
We expect to continue to use commodity derivative instruments to hedge our price risk in the future. Our hedging strategy and future hedging transactions will be determined at our discretion and may be different than what we have done on a historical basis. We are not under an obligation to hedge a specific portion of our production. Our credit agreement allows us to hedge up to 80% of our reasonably anticipated production from proved reserves for up to 24 months in the future and up to 90% of our reasonably anticipated production from proved developed producing reserves for 25 to 60 months in the future, provided that no hedges may have a tenor beyond five years.
Operating Costs and Expenses
Costs associated with producing oil, gas and NGLs are substantial. Some of these costs vary with commodity prices, some trend with the type and volume of production, and others are a function of the number of wells we own. As of March 31, 2016 and December 31, 2015, we owned interests in 140 and 138 gross wells, respectively.
Lease Operating Expenses. Lease operating expenses (“LOE”) are the costs incurred in the operation of producing properties and workover costs. Expenses for utilities, direct labor, water injection and disposal, materials and supplies comprise the most significant portion of our LOE. Certain items, such as direct labor and materials and supplies, generally remain relatively fixed across broad production volume ranges, but can fluctuate depending on activities performed during a specific period. For instance, repairs to our pumping equipment or surface facilities result in increased LOE in periods during which they are performed. Certain of our operating cost components are variable and increase or decrease as the level of produced hydrocarbons and water increases or decreases. For example, we incur power costs in connection with various production-related activities, such as pumping to recover oil and natural gas and separation and treatment of water produced in connection with our oil and natural gas production.
We monitor our operations to ensure that we are incurring LOE at an acceptable level. For example, we monitor our LOE per Boe to determine if any wells or properties should be shut in, recompleted or sold. This unit rate also allows us to monitor these costs in certain fields and geographic areas to identify trends and to benchmark against other producers. Although we strive to reduce our LOE, these expenses can increase or
63
Table of Contents
decrease on a per unit basis as a result of various factors as we operate our properties or make acquisitions and dispositions of properties. For example, we may increase field level expenditures to optimize our operations, incurring higher expenses in one quarter relative to another, or we may acquire or dispose of properties that have different LOE per Boe. These initiatives would influence our overall operating cost and could cause fluctuations when comparing LOE on a period to period basis.
Severance and Ad Valorem Taxes. Severance taxes are paid on produced oil and natural gas based on a percentage of revenues from production sold at fixed rates established by federal, state or local taxing authorities. In general, the severance taxes we pay correlate to the changes in oil, natural gas and NGLs revenues. We are also subject to ad valorem taxes in the counties where our production is located. Ad valorem taxes are generally based on the valuation of our oil and natural gas properties, which also trend with oil and natural gas prices.
Transportation, Processing, Gathering and Other Operating Expense. Transportation, processing, gathering and other operating expense principally consists of expenditures to prepare and transport production from the wellhead to a specified sales point and gas processing costs. These costs will fluctuate with increases or decreases in production volumes, contractual fees and changes in fuel and compression costs.
Depreciation, Depletion, Amortization, and Accretion of Asset Retirement Obligations. Depreciation, depletion, amortization, and accretion of asset retirement obligations (“DD&A”) is the systematic expensing of the capitalized costs incurred to acquire and develop oil and natural gas properties. We use the successful efforts method of accounting for oil and natural gas activities and, as such, we capitalize all costs associated with our development and acquisition efforts and all successful exploration efforts, which are then allocated to each unit of production using the unit of production method. Please read “—Critical Accounting Policies and Estimates—Successful Efforts Method of Accounting for Oil and Natural Gas Activities” for further discussion.
Impairment Expense. We review our proved properties and unproved leasehold costs for impairment whenever events and changes in circumstances indicate that a decline in the recoverability of their carrying value may have occurred. Please read “—Critical Accounting Policies and Estimates—Impairment of Oil and Natural Gas Properties” for further discussion.
General and Administrative Expenses. General and administrative (“G&A”) expenses are costs incurred for overhead, including payroll and benefits for our corporate staff, costs of maintaining our headquarters, costs of managing our production and development operations, audit and other fees for professional services and legal compliance.
Derivative Gain (Loss). Derivative instruments are recognized on the balance sheet as either assets or liabilities measured at fair value. We have not elected to apply cash flow hedge accounting, and consequently, recognize gains and losses in earnings rather than deferring such amounts in other comprehensive income as allowed under cash flow hedge accounting. Fair value gains or losses, as well as cash receipts or payments on settled derivative contracts, are recognized in our results of operations. Cash flows from derivatives are reported as cash flows from operating activities.
Interest Expense. We finance a portion of our working capital requirements and capital expenditures with borrowings under our revolving credit facility and term loan. As a result, we incur interest expense that is affected by both fluctuations in interest rates and our financing decisions. We reflect interest paid to the lenders under our revolving credit facility and term loan in interest expense.
Adjusted EBITDAX
We define Adjusted EBITDAX as net income (loss) before interest expense, income taxes, depreciation, depletion and amortization and accretion of asset retirement obligations, abandonment expense and impairment of unproved properties, (gains) losses on derivatives excluding net cash receipts (payments) on settled derivatives, non-cash equity based compensation, gains and losses from the sale of assets and other non-cash and non-recurring operating items.
64
Table of Contents
Management believes Adjusted EBITDAX is useful because it allows them to more effectively evaluate our operating performance and compare the results of our operations from period to period without regard to our financing methods or capital structure. We exclude the items listed above from net income in arriving at Adjusted EBITDAX because these amounts can vary substantially from company to company within our industry depending upon accounting methods and book values of assets, capital structures and the method by which the assets were acquired. Adjusted EBITDAX should not be considered as an alternative to, or more meaningful than, net income as determined in accordance with GAAP or as an indicator of our operating performance or liquidity. Certain items excluded from Adjusted EBITDAX are significant components in understanding and assessing a company’s financial performance, such as a company’s cost of capital and tax structure, as well as the historic costs of depreciable assets, none of which are components of Adjusted EBITDAX. Our computations of Adjusted EBITDAX may not be comparable to other similarly titled measures of other companies. For further discussion, please read “Prospectus Summary—Summary Historical Financial Data—Non-GAAP Financial Measure.”
Factors Affecting the Comparability of Our Results of Operations to the
Historical Results of Operations of Our Predecessor
Our future results of operations may not be comparable to the historical results of operations of our predecessor for the periods presented, primarily for the reasons described below.
Incentive Unit Compensation
Centennial HoldCo Incentive Units. Certain of our employees hold incentive units in Centennial HoldCo that are intended to be compensation for services rendered to us. After members that have made capital contributions to Centennial HoldCo have received cumulative distributions in respect of their membership interests equal to specified rates of return, these incentive units may upon vesting entitle the holders to a disproportionate share of Centennial HoldCo’s distributions. These rates of return and the vesting schedule are described under “Executive Compensation—Narrative Disclosures—Incentive Units.” These incentive units are being accounted for as liability-classified awards with performance conditions under the Financial Accounting Standards Board’s Accounting Standard Codification Topic 718-Stock Compensation (“ASC 718”).
At such time that the occurrence of the performance conditions associated with any of these incentive units are deemed probable, we will record non-cash compensation expense equal to a percentage of the then-determined fair value of those awards based on the implied service period that has been rendered at that date. As long as we continue to view the achievement of the performance conditions as probable of occurring, we will remeasure the amount of compensation expense to be recognized each period until the awards are settled. We expect that upon successful completion of this offering at the midpoint of the price range set forth on the cover of this prospectus, the performance conditions associated with the Centennial HoldCo Tier incentive units will be deemed probable of reaching payout, which will result in the recognition of non-cash compensation expense of approximately $ million and unrecognized non-cash compensation expense of approximately $ million. Assuming no change to the midpoint of the price range set forth on the cover of this prospectus, the non-cash compensation expense for the remainder of 2016 would be $ million and $ million in 2017. Any change in fair value of the awards at each subsequent reporting period will impact the aforementioned non-cash compensation expense. Please read “Executive Compensation—Narrative Disclosures—Incentive Units” for more information on the incentive units.
Follow-On Incentive Units. Certain of our employees hold incentive units in Follow-On that are intended to be compensation for services rendered to us. After members that have made capital contributions to Follow-On have received cumulative distributions in respect of their membership interests equal to specified rates of return, these incentive units may upon vesting entitle the holders to a disproportionate share of Follow-On’s distributions. These rates of return and the vesting schedule are described under “Executive Compensation—Narrative Disclosures—
65
Table of Contents
Incentive Units.” These incentive units are being accounted for as liability-classified awards with performance conditions under ASC 718, and at such time that the occurrence of the performance conditions associated with any of these incentive units are deemed probable, we will record non-cash compensation expense equal to a percentage of the then-determined fair value of those awards based on the implied service period that has been rendered at that date.
As part of the transactions described in “Recent and Formation Transactions—Formation Transactions—Our Corporate Reorganization,” Follow-On will be recapitalized into a single class of equity with each member of Follow-On, including holders of the Follow-On incentive units, receiving a fixed percentage interest in Follow-On based on the distribution provisions contained in Follow-On’s limited liability company agreement and the implied equity value of Follow-On immediately prior to this offering, based on the aggregate number of shares of our common stock to be issued to Follow-On in connection with our corporate reorganization. Promptly following the consummation of this offering, Follow-On intends to distribute all of its shares of our common stock and any cash received in respect of shares of our common stock it sells in this offering to its members on a pro-rata basis and then dissolve. We expect that upon a successful completion of this offering at the midpoint of our price range set forth on the cover of this prospectus and assuming the underwriters’ over-allotment option is not exercised, approximately shares of our common stock and approximately $ million of cash will be distributed in respect of the Follow-On incentive units. This is expected to result in the recognition of approximately $ million of non-cash compensation expense to be recorded in the period in which this offering occurs.
Public Company Expenses
Upon completion of this offering, we expect to incur direct, incremental G&A expenses as a result of being a publicly traded company, including, but not limited to, costs associated with hiring new personnel, implementation of compensation programs that are competitive with our public company peer group, annual and quarterly reports to stockholders, tax return preparation, independent auditor fees, investor relations activities, registrar and transfer agent fees, incremental director and officer liability insurance costs and independent director compensation. These direct, incremental G&A expenses are not included in our historical results of operations.
Income Taxes
Centennial Resource Development, Inc. is a C-corp under the Code, and as a result, will be subject to U.S. federal, state and local income taxes. Although our predecessor was subject to franchise tax in the State of Texas (at less than 1% of modified pre-tax earnings), it generally passed through its taxable income to its owners for other income tax purposes and thus was not subject to U.S. federal income taxes or other state or local income taxes. Accordingly, the financial data attributable to our predecessor contains no provision for U.S. federal income taxes or income taxes in any state or locality other than franchise tax in the State of Texas. We estimate that Centennial Resource Development, Inc. will be subject to U.S. federal, state and local taxes at a blended statutory rate of 36% of pre-tax earnings.
Dispositions
Our predecessor made the following dispositions in 2014:
| • | Marston Disposition—In December 2014, our predecessor conveyed approximately 1,845 net acres in Ward County, Texas, including 18 wells that produced 122 net Boe/d for the year ended December 31, 2014, for cash proceeds of approximately $12.5 million. This disposition was accounted for as a transaction between entities under common control. We refer to this disposition as the “Marston Disposition.” |
| • | CO2 Project Disposition—In May 2014, our predecessor conveyed certain oil and natural gas properties in Chaves County, New Mexico pursuant to which it had pursued a tertiary recovery project utilizing CO2 |
66
Table of Contents
| to increase production on such properties, including wells that produced 378 net Boe/d in the first half of 2014, for net cash proceeds of approximately $59.3 million. We refer to this disposition as the “CO2 Project Disposition.” |
Predecessor Results of Operations
Three Months Ended March 31, 2016 Compared to Three Months Ended March 31, 2015
Oil, Natural Gas and NGL Sales Revenues. The following table provides the components of our revenues for the periods indicated, as well as each period’s respective average prices and production volumes:
| Three Months Ended March 31, |
||||||||||||||||
| 2016 | 2015 | Change | % Change | |||||||||||||
| Revenues (in thousands): |
||||||||||||||||
| Oil sales |
$ | 13,226 | $ | 21,066 | $ | (7,840 | ) | (37 | )% | |||||||
| Natural gas sales |
1,313 | 1,963 | (650 | ) | (33 | )% | ||||||||||
| NGL sales |
582 | 1,387 | (805 | ) | (58 | )% | ||||||||||
|
|
|
|
|
|
|
|||||||||||
| Total revenues |
$ | 15,121 | $ | 24,416 | $ | (9,295 | ) | (38 | )% | |||||||
|
|
|
|
|
|
|
|||||||||||
| Average sales price:(1) |
||||||||||||||||
| Oil (per Bbl) |
$ | 28.14 | $ | 42.22 | $ | (14.08 | ) | (33 | )% | |||||||
| Natural gas (per Mcf) |
1.88 | 2.78 | (0.90 | ) | (32 | )% | ||||||||||
| NGL (per Bbl) |
8.31 | 17.12 | (8.81 | ) | (51 | )% | ||||||||||
|
|
|
|
|
|
|
|||||||||||
| Total (per Boe) |
$ | 23.05 | $ | 34.98 | $ | (11.93 | ) | (34 | )% | |||||||
| Production: |
||||||||||||||||
| Oil (MBbls) |
470 | 499 | (29 | ) | (6 | )% | ||||||||||
| Natural gas (MMcf) |
698 | 705 | (7 | ) | (1 | )% | ||||||||||
| NGLs (MBbls) |
70 | 81 | (11 | ) | (14 | )% | ||||||||||
|
|
|
|
|
|
|
|||||||||||
| Total (MBoe)(2) |
656 | 698 | (42 | ) | (6 | )% | ||||||||||
|
|
|
|
|
|
|
|||||||||||
| Average daily production volume: |
||||||||||||||||
| Oil (Bbls/d) |
5,165 | 5,544 | (379 | ) | (7 | )% | ||||||||||
| Natural Gas (Mcf/d) |
7,670 | 7,833 | (163 | ) | (2 | )% | ||||||||||
| NGLs (Bbls/d) |
769 | 900 | (131 | ) | (15 | )% | ||||||||||
|
|
|
|
|
|
|
|||||||||||
| Total (Boe/d)(2) |
7,212 | 7,750 | (538 | ) | (7 | )% | ||||||||||
|
|
|
|
|
|
|
|||||||||||
| (1) | Average prices shown in the table reflect prices before the effects of our realized commodity derivative transactions. |
| (2) | Totals may not sum or recalculate due to rounding. |
As reflected in the table above, our total revenues for the first three months of 2016 was 38%, or $9.3 million, lower than the prior year period. The decrease is primarily due to a significant decrease in commodity prices, resulting in a 34% decrease in the average sales price per Boe, and 6% decrease in production sold in the first three months of 2016 compared to the prior year period. The decrease in average daily production is attributable to the decrease in commodity prices, which resulted in the curtailment of drilling activity in the beginning of 2015 continuing into 2016.
Oil sales decreased 37%, or $7.8 million, primarily due to a 33% decrease in the average sales price for oil and partially due to a 6% decrease in oil volumes sold. Natural gas sales decreased 33%, or $0.7 million, primarily due to a 32% decrease in the average sales price for natural gas. NGL sales decreased 58%, or $0.8 million, primarily due to a 51% decrease in the average sales price for NGLs and partially due to a 14% decrease in NGL volumes sold.
67
Table of Contents
Operating Expenses. We present per Boe information because we use this information to evaluate our performance relative to our peers and to identify and measure trends we believe may require additional analysis.
The following table summarizes our expenses for the periods indicated:
| Three Months Ended March 31, |
||||||||||||||||
| 2016 | 2015 | Change | % Change | |||||||||||||
| (Unaudited) | ||||||||||||||||
| Operating expenses (in thousands): |
||||||||||||||||
| Lease operating expenses |
$ | 4,042 | $ | 6,497 | $ | (2,455 | ) | (38 | )% | |||||||
| Severance and ad valorem taxes |
844 | 1,193 | (349 | ) | (29 | )% | ||||||||||
| Transportation, processing, gathering and other operating expenses |
1,130 | 1,283 | (153 | ) | (12 | )% | ||||||||||
| Depreciation, depletion, amortization and accretion of asset retirement obligations |
21,303 | 23,230 | (1,927 | ) | (8 | )% | ||||||||||
| Contract termination and rig stacking |
— | 1,540 | (1,540 | ) | (100 | )% | ||||||||||
| General and administrative expenses |
2,536 | 2,913 | (377 | ) | (13 | )% | ||||||||||
|
|
|
|
|
|
|
|||||||||||
| Total operating expenses before loss on sale of oil and natural gas properties |
$ | 29,855 | $ | 36,656 | $ | (6,801 | ) | (19 | )% | |||||||
| Loss (gain) on sale of oil and natural gas properties |
4 | (2,675 | ) | NM | NM | |||||||||||
|
|
|
|
|
|
|
|||||||||||
| Total operating expenses after loss (gain) on sale of oil and natural gas properties |
$ | 29,859 | $ | 33,981 | $ | (4,122 | ) | (12 | )% | |||||||
|
|
|
|
|
|
|
|||||||||||
| Expenses per Boe: |
||||||||||||||||
| Lease operating expenses |
$ | 6.16 | $ | 9.31 | $ | (3.15 | ) | (34 | )% | |||||||
| Severance and ad valorem taxes |
1.29 | 1.71 | (0.42 | ) | (25 | )% | ||||||||||
| Transportation, processing, gathering and other operating expenses |
1.72 | 1.84 | (0.12 | ) | (7 | )% | ||||||||||
| Depreciation, depletion, amortization and accretion of asset retirement obligations |
32.47 | 33.28 | (0.81 | ) | (2 | )% | ||||||||||
| Contract termination and rig stacking |
— | 2.21 | (2.21 | ) | (100 | )% | ||||||||||
| General and administrative expenses |
3.87 | 4.17 | (0.30 | ) | (7 | )% | ||||||||||
|
|
|
|
|
|
|
|||||||||||
| Total operating expenses per Boe |
$ | 45.51 | $ | 52.52 | $ | (7.01 | ) | (13 | )% | |||||||
|
|
|
|
|
|
|
|||||||||||
Lease Operating Expenses. We experience volatility in our LOE as a result of the impact industry activity has on service provider costs and seasonality in workover expense. LOE decreased 38%, or $2.5 million, in the first three months of 2016 compared to the prior year period due in part to service providers lowering costs in light of the weak commodity price environment. Additionally, fewer wells were brought on line in the first three months of 2016 compared to the prior year period, which resulted in decreased needs for compression, rental equipment, fuel, saltwater disposal and chemicals. Furthermore, workover expense decreased in the first three months of 2016 compared to the prior year period.
Severance and Ad Valorem Taxes. Severance taxes are primarily based on the market value of our production at the wellhead and ad valorem taxes are generally based on the valuation of our oil and natural gas properties and vary across the different counties in which we operate. Severance and ad valorem taxes decreased 29%, or $0.3 million, in the first three months of 2016 compared to the prior year period, primarily due to lower production revenues, which were primarily as a result of lower realized commodity prices. Severance and ad valorem taxes as a percentage of our revenue was 5.6% for the first three months of 2016 compared to 4.9% for the prior year period.
68
Table of Contents
Transportation, Processing, Gathering and Other Operating Expenses. Transportation, processing, gathering and other operating expenses decreased 12%, or $0.2 million, in the first three months of 2016 compared to the prior year period, primarily due to a decrease in sales and processing volumes and lower prices for natural gas and NGLs, which resulted in lower costs associated with fuel and processing fees.
Depreciation, Depletion, Amortization and Accretion of Asset Retirement Obligations. Our DD&A rate can fluctuate as a result of impairments, dispositions, finding and development costs and proved reserve volumes. DD&A decreased 8%, or $1.9 million, for the first three months of 2016 compared to the prior year period, primarily due to a decrease in production volumes. DD&A per Boe was $32.47 for the first three months of 2016 compared to $33.28 for the prior year period.
Contract Termination and Rig Stacking. In the first three months of 2016, we incurred no drilling and rig termination fees, as compared to $1.5 million in the prior year period. In light of the low commodity price environment, we curtailed drilling activity beginning in the first quarter of 2015, and as a result, we incurred drilling and rig termination fees of $1.5 million in the first three months of 2015.
General and Administrative Expenses. G&A expenses decreased 13%, or $0.4 million, primarily due to a decrease in consulting and professional services in the first three months of 2016 compared to the prior year period.
Gain (Loss) on Sale of Oil and Natural Gas Properties. In the first three months of 2016, we recorded an immaterial net loss on the sale of oil and natural gas properties as compared to a net gain of $2.7 million in the prior year period, which was primarily attributable to a gain of $2.4 million associated with the sale of non-core unproved property to an unrelated third party.
Other Income and Expenses. The following table summarizes our other income and expenses for the periods indicated:
| Three Months Ended March 31, |
||||||||||||||||
| 2016 | 2015 | Change | % Change | |||||||||||||
| (Unaudited) | ||||||||||||||||
| Other (expense) income (in thousands): |
||||||||||||||||
| Interest expense |
$ | (1,641 | ) | $ | (1,526 | ) | $ | (115 | ) | 8 | % | |||||
| Gain on derivative instruments |
1,918 | 5,154 | (3,236 | ) | (63 | )% | ||||||||||
|
|
|
|
|
|
|
|||||||||||
| Total other income |
$ | 277 | $ | 3,628 | $ | (3,351 | ) | (92 | )% | |||||||
|
|
|
|
|
|
|
|||||||||||
| Income tax expense |
$ | — | $ | — | $ | — | — | % | ||||||||
|
|
|
|
|
|
|
|||||||||||
Interest Expense. Interest expense increased 8%, or $0.1 million, primarily due to an increase in the average borrowings under our revolving credit facility during the first three months of 2016 compared to the prior year period.
Gain on Derivative Instruments. In the first three months of 2016, we recognized a $1.9 million derivative gain as compared to a $5.2 million derivative gain in the prior year period. Net gains on our derivatives are a function of fluctuations in the underlying commodity prices and the monthly settlement of the instruments.
69
Table of Contents
Year Ended December 31, 2015 Compared to the Year Ended December 31, 2014
Oil and Natural Gas Revenues. The following table provides the components of our revenues for the years indicated, as well as each year’s respective average prices and production volumes:
| Year Ended December 31, |
||||||||||||||||
| 2015 | 2014 | $ Change | % Change | |||||||||||||
| Revenues (in thousands): |
||||||||||||||||
| Oil sales |
$ | 77,643 | $ | 114,955 | $ | (37,312 | ) | (32 | )% | |||||||
| Natural gas sales |
7,965 | 9,670 | (1,705 | ) | (18 | )% | ||||||||||
| NGL sales |
4,852 | 7,200 | (2,348 | ) | (33 | )% | ||||||||||
|
|
|
|
|
|
|
|||||||||||
| Total revenues |
$ | 90,460 | $ | 131,825 | $ | (41,365 | ) | (31 | )% | |||||||
|
|
|
|
|
|
|
|||||||||||
| Average sales price:(1) |
||||||||||||||||
| Oil (per Bbl) |
$ | 42.43 | $ | 80.50 | $ | (38.07 | ) | (47 | )% | |||||||
| Natural gas (per Mcf) |
2.60 | 4.58 | (1.98 | ) | (43 | )% | ||||||||||
| NGLs (per Bbl) |
14.66 | 30.64 | (15.98 | ) | (52 | )% | ||||||||||
|
|
|
|
|
|
|
|||||||||||
| Total (per Boe) |
$ | 33.87 | $ | 65.42 | $ | (31.55 | ) | (48 | )% | |||||||
| Production: |
||||||||||||||||
| Oil (MBbls) |
1,830 | 1,428 | 402 | 28 | % | |||||||||||
| Natural gas (MMcf) |
3,058 | 2,112 | 946 | 45 | % | |||||||||||
| NGLs (MBbls) |
331 | 235 | 96 | 41 | % | |||||||||||
|
|
|
|
|
|
|
|||||||||||
| Total (MBoe)(2) |
2,671 | 2,015 | 656 | 33 | % | |||||||||||
|
|
|
|
|
|
|
|||||||||||
| Average daily production volumes: |
||||||||||||||||
| Oil (Bbls/d) |
5,014 | 3,912 | 1,102 | 28 | % | |||||||||||
| Natural gas (Mcf/d) |
8,378 | 5,786 | 2,592 | 45 | % | |||||||||||
| NGLs (Bbls/d) |
907 | 644 | 263 | 41 | % | |||||||||||
|
|
|
|
|
|
|
|||||||||||
| Total (Boe/d)(2) |
7,317 | 5,521 | 1,796 | 33 | % | |||||||||||
|
|
|
|
|
|
|
|||||||||||
| (1) | Average prices shown in the table reflect prices before the effects of our realized commodity derivative transactions. |
| (2) | Totals may not sum or recalculate due to rounding. |
As reflected in the table above, our total revenues for 2015 was 31%, or $41.4 million, lower than in 2014. The decrease is primarily due to a significant decrease in commodity prices, resulting in a 48% decrease in the average sales price per Boe. The decrease was offset in part by a 33% increase in average daily production sold in 2015 compared to 2014. The increase in average daily production in 2015 was negatively impacted by property divestitures that occurred in 2014. In 2014, average daily production attributable to the property dispositions approximated 310 Boe/d.
Oil sales decreased 32%, or $37.3 million, primarily as result of a 47% decrease in average sales price for oil, offset by a 28% increase in oil volumes sold. Natural gas sales decreased 18%, or $1.7 million, primarily as a result of 43% decrease in the average sales price for natural gas, offset by a 45% increase in natural gas volumes sold. NGL sales decreased 33%, or $2.3 million, primarily as a result of a 52% decrease in the average price for NGLs, offset by a 41% increase in NGL volumes sold.
70
Table of Contents
Operating Expenses. The following table summarizes our expenses for the periods indicated:
| Year Ended December 31, |
||||||||||||||||
| 2015 | 2014 | $ Change | % Change | |||||||||||||
| Operating expenses (in thousands): |
||||||||||||||||
| Lease operating expenses |
$ | 21,173 | $ | 17,690 | $ | 3,483 | 20 | % | ||||||||
| Severance and ad valorem taxes |
5,021 | 6,875 | (1,854 | ) | (27 | )% | ||||||||||
| Transportation, processing, gathering and other operating expenses |
5,732 | 4,772 | 960 | 20 | % | |||||||||||
| Depreciation, depletion, amortization and accretion of asset retirement obligations |
90,084 | 69,110 | 20,974 | 30 | % | |||||||||||
| Abandonment expense and impairment of unproved properties |
7,619 | 20,025 | (12,406 | ) | (62 | )% | ||||||||||
| Exploration |
84 | — | 84 | 100 | % | |||||||||||
| Contract termination and rig stacking |
2,387 | — | 2,387 | 100 | % | |||||||||||
| General and administrative expenses |
14,206 | 31,694 | (17,488 | ) | (55 | )% | ||||||||||
|
|
|
|
|
|
|
|||||||||||
| Total operating expenses |
$ | 146,306 | $ | 150,166 | $ | (3,860 | ) | (3 | )% | |||||||
| (Gain) loss on sale of oil and natural gas properties |
(2,439 | ) | 2,096 | NM | NM | |||||||||||
|
|
|
|
|
|
|
|||||||||||
| Total operating expenses after (loss) gain on sale of oil and natural gas properties |
$ | 143,867 | $ | 152,262 | $ | (8,395 | ) | (6 | )% | |||||||
|
|
|
|
|
|
|
|||||||||||
| Average unit costs per Boe: |
||||||||||||||||
| Lease operating expenses |
$ | 7.93 | $ | 8.78 | $ | (0.85 | ) | (10 | )% | |||||||
| Severance and ad valorem taxes |
1.88 | 3.41 | (1.53 | ) | (45 | )% | ||||||||||
| Transportation, processing, gathering and other operating expenses |
2.15 | 2.37 | (0.22 | ) | (9 | )% | ||||||||||
| Depreciation, depletion, amortization and accretion of asset retirement obligations |
33.73 | 34.30 | (0.57 | ) | (2 | )% | ||||||||||
| Abandonment expense and impairment of unproved properties |
2.85 | 9.94 | (7.09 | ) | (71 | )% | ||||||||||
| Exploration |
0.03 | — | 0.03 | 100 | % | |||||||||||
| Contract termination and rig stacking |
0.89 | — | 0.89 | 100 | % | |||||||||||
| General and administrative expenses |
5.32 | 15.73 | (10.41 | ) | (66 | )% | ||||||||||
|
|
|
|
|
|
|
|||||||||||
| Total operating expenses per Boe |
$ | 54.78 | $ | 74.53 | $ | (19.75 | ) | (26 | )% | |||||||
|
|
|
|
|
|
|
|||||||||||
Lease Operating Expenses. We experience volatility in our LOE as a result of the impact industry activity has on service provider costs and seasonality in workover expense. LOE increased 20%, or $3.5 million, in 2015 as compared to 2014, as we continued to put new wells on production, resulting in increased needs for compression, rental equipment, fuel, saltwater disposal and chemicals. We also had a year-over-year increase in workover expense.
Severance and Ad Valorem Taxes. Severance taxes are primarily based on the market value of our production at the wellhead and ad valorem taxes are generally based on the valuation of our oil and natural gas properties and vary across the different counties in which we operate. Severance and ad valorem taxes decreased 27%, primarily due to lower production revenues primarily as a result of lower realized commodity prices. Severance and ad valorem taxes as a percentage of our revenue was 5.6% for 2015 compared to 5.2% for 2014.
Transportation, Processing, Gathering and Other Operating Expenses. Transportation, processing, gathering and other operating expenses increased 20%, or $1.0 million. In 2015, lower prices for natural gas and NGLs resulted in lower costs associated with fuel and processing fees, which were partially offset by higher processing volumes.
71
Table of Contents
Depreciation, Depletion, Amortization and Accretion of Asset Retirement Obligations. Our DD&A rate can fluctuate as a result of impairments, dispositions, finding and development costs and proved reserve volumes. DD&A expense increased 30%, or $21.0 million, primarily due to an increase in production volumes. DD&A per Boe was $33.73 for 2015, a slight decrease as compared to $34.30 in 2014.
Abandonment Expense and Impairment of Unproved Properties. In 2015, we recorded $7.6 million attributable to leases that expired during the year or were expected to expire in the future. In 2014, we recorded impairment expense of $20.0 million, of which $13.8 million was attributable to an impairment of unproved properties and $6.2 million was attributable to leases that expired during the year or were expected to expire in the future.
Contract Termination and Rig Stacking. In light of the low commodity price environment, we curtailed drilling activity in 2015. As a result, we incurred drilling and rig termination fees of $2.4 million in 2015 as compared to no drilling and rig termination fees in 2014.
General and Administrative Expenses. G&A expenses decreased 55%, or $17.5 million, primarily due to $12.4 million of incentive compensation recorded in 2014 due to the achievement of certain performance criteria associated with our predecessor’s incentive units. Additionally, the decrease is the result of no longer having two distinct management teams and employees associated with each of our predecessors along with our growing capital program and oil production levels.
Gain (Loss) on Sale of Oil and Natural Gas Properties. In 2015, we recorded a net gain of $2.4 million, primarily attributable to the sale of non-core unproved property to an unrelated third party. In 2014, we recorded a net loss of $2.1 million, primarily attributable to the CO2 Project Disposition
Other Income and Expenses. The following table summarizes our other income and expenses for the years indicated:
| Year Ended December 31, |
||||||||||||||||
| 2015 | 2014 | $ Change | % Change | |||||||||||||
| Other income (expense) (in thousands): |
||||||||||||||||
| Interest expense |
$ | (6,266 | ) | $ | (2,475 | ) | $ | (3,791 | ) | 153 | % | |||||
| Gain on derivative instruments |
20,756 | 41,943 | (21,187 | ) | (51 | )% | ||||||||||
| Other income |
20 | 281 | (261 | ) | NM | |||||||||||
|
|
|
|
|
|
|
|||||||||||
| Total other income |
$ | 14,510 | $ | 39,749 | $ | (25,239 | ) | (63 | )% | |||||||
|
|
|
|
|
|
|
|||||||||||
| Income tax benefit (expense) |
$ | 572 | $ | (1,524 | ) | NM | NM | |||||||||
|
|
|
|
|
|
|
|||||||||||
Interest Expense. Interest expense increased $3.8 million, or 153%, primarily due to an increase in the average amounts outstanding under our term loan and revolving credit facility in 2015 compared to 2014.
Gain on Derivative Instruments. In 2015, we recognized a $20.8 million gain on derivative instruments compared to a $41.9 million gain on derivative instruments in 2014. Net gains on our derivatives are a function of fluctuations in the underlying commodity prices and the monthly settlement of the instruments.
Income Tax Expense. For the year ended December 31, 2015, we recognized a tax benefit of $0.6 million associated with our Texas franchise tax obligation. For the year ended December 31, 2014, we recognized income tax expense of $1.5 million. The decrease is primarily due to a decrease in the Texas franchise tax rate and a decrease in our estimated income attributable to Texas franchise tax year-over-year.
72
Table of Contents
Capital Requirements and Sources of Liquidity
Our development and acquisition activities require us to make significant operating and capital expenditures. Historically, our primary sources of liquidity have been capital contributions from our equity sponsors, borrowings under our revolving credit facility and term loan, proceeds from asset dispositions and cash flows from operations. Centennial HoldCo and Follow-On, our equity sponsors, have agreed to make capital contributions to Centennial OpCo of up to $321.9 million and $184.5 million, respectively, and as of March 31, 2016, Centennial HoldCo and Follow-On have made total capital contributions of $289.4 million and $84.2 million, respectively. Such capital contribution commitments will terminate upon the closing of this offering. To date, our primary use of capital has been for the development and acquisition of oil and natural gas properties.
We plan to continue our practice of entering into hedging arrangements to reduce the impact of commodity price volatility on our cash flow from operations. Under this strategy, we expect to maintain an active hedging program that seeks to reduce our exposure to commodity prices and protect our cash flow.
The amount and allocation of future capital expenditures will depend upon a number of factors, including the number and size of acquisition opportunities, our cash flows from operating, investing and financing activities, and our ability to assimilate acquisitions and execute our drilling program. We periodically review our capital expenditure budget to assess changes in current and projected cash flows, acquisition and divestiture activities, debt requirements, and other factors. If we are unable to obtain funds when needed or on acceptable terms, we may not be able to complete acquisitions that may be favorable to us or finance the capital expenditures necessary to maintain our production or proved reserves.
Our 2016 capital budget for drilling, completion and recompletion activities and facilities costs is approximately $87 million, excluding leasing and other acquisitions. In the three months ended March 31, 2016, we incurred capital costs of approximately $16.5 million, excluding leasing and acquisition costs.
Because we are the operator of a high percentage of our acreage, the amount and timing of these capital expenditures are largely discretionary and within our control. We could choose to defer a portion of these planned capital expenditures depending on a variety of factors, including, but not limited to, the success of our drilling activities, prevailing and anticipated prices for oil and natural gas, the availability of necessary equipment, infrastructure and capital, the receipt and timing of required regulatory permits and approvals, seasonal conditions, drilling and acquisition costs and the level of participation by other working interest owners. A deferral of planned capital expenditures, particularly with respect to drilling and completing new wells, could result in a reduction in anticipated production and cash flows. Additionally, if we curtail our drilling program, we may lose a portion of our acreage through lease expirations. See “Business—Oil and Natural Gas Production Prices and Costs—Developed and Undeveloped Acreage.” In addition, we may be required to reclassify some portion of our reserves currently booked as proved undeveloped reserves if such a deferral of planned capital expenditures means we will be unable to develop such reserves within five years of their initial booking.
As of March 31, 2016, we had $77.0 million outstanding under our revolving credit facility and $0.5 million of letters of credit outstanding, and we were able to incur approximately $62.5 million of additional indebtedness under our revolving credit facility. We intend to use a portion of the net proceeds from this offering to fully repay the outstanding borrowings under our revolving credit facility. Our borrowing base under our revolving credit facility was $140.0 million as of March 31, 2016 and was reaffirmed on April 29, 2016.
Based upon current oil and natural gas price expectations for the remainder of 2016 and 2017, following the closing of this offering, we believe that our cash flow from operations, additional borrowings under our revolving credit facility and a portion of the proceeds from this offering will provide us with sufficient liquidity to execute our current capital program. However, future cash flows are subject to a number of variables, including the level of oil and natural gas production and prices, and significant additional capital expenditures will be required to more fully develop our properties. We cannot assure you that operations and other needed capital will be available on acceptable terms or at all. In the event we make additional acquisitions and the amount of capital
73
Table of Contents
required is greater than the amount we have available for acquisitions at that time, we could be required to reduce the expected level of capital expenditures and/or seek additional capital. If we require additional capital for that or other reasons, we may seek such capital through traditional reserve base borrowings, joint venture partnerships, production payment financings, asset sales, offerings of debt and equity securities or other means. We cannot assure you that needed capital will be available on acceptable terms or at all. If we are unable to obtain funds when needed or on acceptable terms, we may be required to curtail our current drilling program, which could result in a loss of acreage through lease expirations. In addition, we may not be able to complete acquisitions that may be favorable to us or finance the capital expenditures necessary to maintain our production or replace our reserves.
Working Capital
Our working capital, which we define as current assets minus current liabilities, totaled $0.1 million at March 31, 2016. At December 31, 2015, we had a working capital of $12.0 million, and at December 31, 2014, we had a working capital deficit of $36.2 million. We may again incur a working capital deficit in the future due to the amounts that accrue related to our drilling program. Our collection of receivables has historically been timely, and losses associated with uncollectible receivables have historically not been significant. Our cash and cash equivalents balance totaled $0.1 million, $1.8 million and $13.0 million at March 31, 2016, December 31, 2015 and December 31, 2014, respectively. We expect that our cash flows from operating activities, availability under our revolving credit facility after application of the estimated net proceeds from this offering, as described under “Use of Proceeds,” and a portion of the proceeds from this offering will be sufficient to fund our working capital needs. We expect that our pace of development, production volumes, commodity prices and differentials to NYMEX prices for our oil and natural gas production will be the largest variables affecting our working capital.
Cash Flows
The following table summarizes our cash flows for the periods indicated:
| Three Months Ended March 31, |
Year Ended December 31, |
|||||||||||||||
| 2016 | 2015 | 2015 | 2014 | |||||||||||||
| (Unaudited) | ||||||||||||||||
| (In thousands) | ||||||||||||||||
| Net cash provided by operating activities |
$ | 18,552 | $ | 27,632 | $ | 68,882 | $ | 97,248 | ||||||||
| Net cash used in investing activities |
(22,419 | ) | (79,006 | ) | (198,635 | ) | (163,380 | ) | ||||||||
| Net cash provided by financing activities |
2,197 | 38,913 | 118,504 | 36,966 | ||||||||||||
Analysis of Cash Flow Changes Between the Three Months Ended March 31, 2016 and 2015
Operating Activities. Net cash provided by operating activities is primarily affected by the price of oil, natural gas and NGLs, production volumes and changes in working capital. The decrease in net cash provided by operating activities for the first three months of 2016 compared to the prior year period is primarily due to a $9.3 million decrease in total revenues and a $1.1 million decrease in net cash received for derivative settlements, primarily offset by decreased operating expenses.
Investing Activities. Net cash used in investing activities is primarily comprised of acquisition and development of oil and natural gas properties, net of dispositions. In the first three months of 2016, net cash used for investing activities included $22.4 million attributable to the acquisition and development of oil and natural gas properties. In 2015, net cash used for investing activities included $80.8 million for the acquisition and development of oil and natural gas properties and $1.0 million for the acquisitions of other property, plant and equipment, offset by proceeds from asset sales of $2.7 million.
74
Table of Contents
Financing Activities. Net cash provided by financing activities in the first three months of 2016 included $5.0 million of borrowings under our revolving credit facility, offset by repayments of $2.0 million and payments of $0.8 million associated with our financing obligation. Net cash provided by financing activities in the first three months of 2015 primarily included $39.0 million of borrowings under our revolving credit facility.
Analysis of Cash Flow Changes Between the Year Ended December 31, 2015 and 2014
Operating Activities. Net cash provided by operating activities is primarily affected by the price of oil, natural gas and NGLs, production volumes and changes in working capital. The decrease in net cash provided by operating activities for the year ended December 31, 2015 as compared to the prior year is primarily due to a $41.4 million decrease in total revenues and a decrease in changes in current assets and current liabilities, which decreased cash proceeds provided by operating activities by $16.4 million. The decreases are primarily offset by an increase in net cash received for derivative settlements of $30.9 million.
Investing Activities. Net cash used in investing activities is primarily comprised of acquisition and development of oil and natural gas properties net of dispositions. In 2015, net cash used for investing activities included $201.3 million attributable to the acquisition and development of oil and natural gas properties, offset by proceeds from asset sales of $2.7 million. In 2014, net cash used for investing activities included $298.3 million attributable to the acquisition and development of oil and natural gas properties, offset by net proceeds from asset sales of $129.9 million.
Financing Activities. Net cash provided by financing activities in 2015 included $92.0 million of borrowings under our revolving credit facility, offset by repayments of $83.0 million, capital contributions of $111.4 million, $1.6 million of payments associated with our financing obligation and debt issuance costs of $0.3 million. Net cash provided by financing activities in 2014 included $196.0 million of borrowing under our revolving credit facility, offset by $160.0 million of repayments, $65.0 million of proceeds from our term loan, and capital contributions of $59.8 million, offset by $119.3 million attributable to the repurchase of equity interests and $1.6 million of debt issuance costs.
Our Term Loan and Our Revolving Credit Facility
On October 15, 2014, Centennial OpCo entered into an amended and restated credit agreement (as amended to date, our “credit agreement”) with JPMorgan Chase Bank, N.A., as administrative agent, and a syndicate of lenders, that includes both a term loan commitment of $65.0 million (our “term loan”), which was fully funded as of March 31, 2016, and a revolving credit facility (our “revolving credit facility”) with commitments of $500.0 million (subject to the borrowing base), with a sublimit for letters of credit of $15.0 million. As of March 31, 2016, the borrowing base under our revolving credit facility was $140.0 million, and our borrowing base was reaffirmed on April 29, 2016. As of March 31, 2016, we had $77.0 million outstanding under our revolving credit facility and $0.5 million of letters of credit outstanding, and we were able to incur approximately $62.5 million of additional indebtedness under our revolving credit facility. We intend to use a portion of the net proceeds of this offering to fully repay and terminate our term loan and fully repay the outstanding borrowings under our revolving credit facility. Our term loan matures on April 15, 2018, and our revolving credit facility matures on October 15, 2019.
The amount available to be borrowed under our revolving credit facility is subject to a borrowing base that will be redetermined semiannually each April 1 and October 1 by the lenders in their sole discretion. Our credit agreement also allows, in 2016 and thereafter, for two optional borrowing base redeterminations on January 1 and July 1. The borrowing base depends on, among other things, the volumes of Centennial OpCo’s proved oil and natural gas reserves and estimated cash flows from these reserves and Centennial OpCo’s commodity hedge positions. The borrowing base will automatically be decreased by an amount equal to 25% of the aggregate notional amount of issued permitted senior unsecured notes unless such decrease is waived by the lenders. Upon a redetermination of the borrowing base, if borrowings in excess of the revised borrowing capacity are outstanding, Centennial OpCo could be required to immediately repay a portion of its debt outstanding under our credit agreement.
75
Table of Contents
Principal amounts borrowed are payable on the term loan maturity date and the revolving credit maturity date, as applicable. Interest on the term loan is LIBOR plus 5.25%. At March 31, 2016, the weighted average interest rate on our term loan was 5.69%. Loans under our revolving credit facility may be base rate loans or LIBOR loans. Interest is payable quarterly for base rate loans and at the end of the applicable interest period for LIBOR loans. LIBOR loans bear interest at LIBOR (adjusted for statutory reserve requirements) plus an applicable margin ranging from 150 to 250 basis points, depending on the percentage of the borrowing base utilized. Base rate loans bear interest at a rate per annum equal to the greatest of: (i) the agent bank’s prime rate; (ii) the federal funds effective rate plus 50 basis points; and (iii) the adjusted LIBOR rate for a one-month interest period plus 100 basis points, plus an applicable margin ranging from 50 to 150 basis points, depending on the percentage of the borrowing base utilized. At March 31, 2016, the weighted average interest rate on borrowings under our revolving credit facility was approximately 2.44%. Centennial OpCo also pays a commitment fee on unused amounts of our revolving credit facility ranging from 37.5 basis points to 50 basis points, depending on the percentage of the borrowing base utilized. Centennial OpCo may repay any amounts borrowed prior to the maturity date without any premium or penalty other than customary LIBOR breakage costs.
Our credit agreement contains restrictive covenants that limit Centennial OpCo’s ability to, among other things:
| • | incur additional indebtedness; |
| • | make investments and loans; |
| • | enter into mergers; |
| • | make or declare dividends; |
| • | enter into commodity hedges exceeding a specified percentage of Centennial OpCo’s expected production; |
| • | enter into interest rate hedges exceeding a specified percentage of Centennial OpCo’s outstanding indebtedness; |
| • | incur liens; |
| • | sell assets; and |
| • | engage in transactions with affiliates. |
Our credit agreement also requires Centennial OpCo to maintain compliance with the following financial ratios:
| • | a current ratio, which is the ratio of Centennial OpCo’s consolidated current assets (including unused commitments under our revolving credit facility and excluding non-cash assets under Financial Accounting Standards Board’s (“FASB”) Accounting Standard Codification (“ASC”) 815 and certain restricted cash) to Centennial OpCo’s consolidated current liabilities (excluding the current portion of long-term debt under our credit agreement and non-cash liabilities under ASC 815), of not less than 1.0 to 1.0; and |
| • | a leverage ratio, which is the ratio of Total Funded Debt (as defined in our credit agreement) to consolidated EBITDAX (as defined in our credit agreement) for the rolling four fiscal quarter period ending on such day, of not greater than 4.0 to 1.0. |
As of March 31, 2016, we were in compliance with such covenants and the financial ratios described above.
76
Table of Contents
Contractual Obligations
A summary of our contractual obligations as of December 31, 2015 is provided in the following table.
| Payments Due by Period For the Year Ending December 31, | ||||||||||||||||||||||||||||
| 2016 | 2017 | 2018 | 2019 | 2020 | Thereafter | Total | ||||||||||||||||||||||
| (In thousands) | ||||||||||||||||||||||||||||
| Revolving credit facility(1) |
$ | — | $ | — | $ | — | $ | 74,000 | $ | — | $ | — | $ | 74,000 | ||||||||||||||
| Term loan(2) |
— | — | 65,000 | — | — | — | 65,000 | |||||||||||||||||||||
| Drilling rig commitments |
422 | — | — | — | — | — | 422 | |||||||||||||||||||||
| Office and equipment leases |
539 | 477 | 485 | 419 | — | — | 1,920 | |||||||||||||||||||||
| Pipeline financing obligation(3) |
2,137 | — | — | — | — | 2,137 | ||||||||||||||||||||||
| Asset retirement obligations(4) |
— | — | — | — | — | 2,288 | 2,288 | |||||||||||||||||||||
|
|
|
|
|
|
|
|
|
|
|
|
|
|
|
|||||||||||||||
| Total |
$ | 3,098 | $ | 477 | $ | 65,485 | $ | 74,419 | $ | — | $ | 2,288 | $ | 145,767 | ||||||||||||||
|
|
|
|
|
|
|
|
|
|
|
|
|
|
|
|||||||||||||||
| (1) | This table does not include future commitment fees, amortization of deferred financing costs, interest expense or other fees on our revolving credit facility because obligations thereunder are floating rate instruments and we cannot determine with accuracy the timing of future loan advances, repayments or future interest rates to be charged. As of March 31, 2016, we had $77.0 million outstanding under our revolving credit facility and $0.5 million of letters of credit outstanding, and we were able to incur approximately $62.5 million of additional indebtedness under our revolving credit facility. We intend to use a portion of the net proceeds from this offering to fully repay borrowings under our revolving credit facility. Please see “Use of Proceeds.” |
| (2) | We intend to use a portion of the net proceeds from this offering to fully repay and terminate our term loan. Please see “Use of Proceeds.” |
| (3) | A subsidiary of PennTex Midstream Partners, LP has constructed an expansion of a gas gathering system for which we have agreed to repay all construction costs, which totaled approximately $4.0 million. Each month, we pay a minimum fee of $7,000 per day until all construction costs are paid. |
| (4) | Amounts represent estimates of our future asset retirement obligations. Because these costs typically extend many years into the future, estimating these future costs requires management to make estimates and judgments that are subject to future revisions based upon numerous factors, including the rate of inflation, changing technology and the political and regulatory environment. |
Quantitative and Qualitative Disclosure About Market Risk
We are exposed to market risk, including the effects of adverse changes in commodity prices and interest rates as described below. The primary objective of the following information is to provide quantitative and qualitative information about our potential exposure to market risks. The term “market risk” refers to the risk of loss arising from adverse changes in oil and natural gas prices and interest rates. The disclosures are not meant to be precise indicators of expected future losses, but rather indicators of reasonably possible losses. All of our market risk sensitive instruments were entered into for purposes other than speculative trading.
Commodity Price Risk
Our major market risk exposure is in the pricing that we receive for our oil, natural gas and NGLs production. Pricing for oil, natural gas and NGLs has been volatile and unpredictable for several years, and we expect this volatility to continue in the future. During the period from January 1, 2014 through May 31, 2016, the WTI spot price for oil has declined from a high of $107.62 per Bbl on July 23, 2014 to $26.21 per Bbl on February 11, 2016. NGL prices generally correlate to the price of oil, and accordingly prices for these products have likewise declined and are likely to continue following that market. Prices for domestic natural gas began to decline during the third quarter of 2014 and have continued to be weak throughout 2015 and thus far in 2016.
77
Table of Contents
During the period from January 1, 2014 through May 31, 2016, the Henry Hub spot price for natural gas has declined from a high of $7.92 per MMBtu on March 4, 2014 to a low of $1.49 per MMBtu on March 4, 2016. The prices we receive for our oil, natural gas and NGLs production depend on numerous factors beyond our control, some of which are discussed in “Risk Factors—Risks Related to Our Business—Oil, natural gas and NGL prices are volatile. A sustained decline in oil, natural gas and NGL prices could adversely affect our business, financial condition and results of operations and our ability to meet our capital expenditure obligations and financial commitments.”
A $1.00 per barrel change in our realized oil price would have resulted in a $1.8 million change in oil revenues for 2015. A $0.10 per Mcf change in our realized natural gas price would have resulted in a $0.3 million change in our natural gas revenues for 2015. A $1.00 per barrel change in NGL prices would have changed NGL revenue by $0.3 million for 2015. Oil sales contributed 86% of our total revenues for 2015. Natural gas sales contributed 9% and NGL sales contributed 5% of our total revenues for 2015. Our oil, natural gas and NGL revenues do not include the effects of derivatives.
Due to this volatility, we have historically used, and we expect to continue to use, commodity derivative instruments, such as collars, swaps and basis swaps, to hedge price risk associated with a portion of our anticipated production. Our hedging instruments allow us to reduce, but not eliminate, the potential effects of the variability in cash flow from operations due to fluctuations in oil and natural gas prices and provide increased certainty of cash flows for our drilling program and debt service requirements. These instruments provide only partial price protection against declines in oil and natural gas prices and may partially limit our potential gains from future increases in prices. Our credit agreement allows us to hedge up to 80% of our reasonably anticipated production from proved reserves for up to 24 months in the future and up to 90% of our reasonably anticipated production from proved developed producing reserves for 25 to 60 months in the future, provided that no hedges may have a tenor beyond five years.
78
Table of Contents
Our open positions as of March 31, 2016:
| Description & Production Period |
Volume (Bbl) | Weighted Average Swap Price ($/Bbl)(1) |
||||||
| Crude Oil Swaps: |
||||||||
| April 2016—December 2016 |
34,375 | $ | 76.25 | |||||
| April 2016—December 2016 |
68,750 | 62.42 | ||||||
| April 2016—December 2016 |
34,375 | 77.32 | ||||||
| April 2016—December 2016 |
68,750 | 65.58 | ||||||
| April 2016—June 2016 |
90,000 | 90.95 | ||||||
| April 2016—December 2016 |
27,500 | 54.00 | ||||||
| April 2016—December 2016 |
27,500 | 53.23 | ||||||
| April 2016—December 2016 |
27,500 | 51.80 | ||||||
| April 2016—December 2016 |
96,250 | 52.10 | ||||||
| April 2016—December 2016 |
27,500 | 50.20 | ||||||
| July 2016—December 2016 |
18,400 | 40.87 | ||||||
| July 2016—December 2016 |
36,800 | 43.35 | ||||||
| July 2016—December 2016 |
55,200 | 42.75 | ||||||
| January 2017—December 2017 |
91,250 | 64.05 | ||||||
| January 2017—December 2017 |
36,500 | 54.65 | ||||||
| January 2017—December 2017 |
36,500 | 43.50 | ||||||
| January 2017—December 2017 |
36,500 | 44.85 | ||||||
| January 2017—December 2017 |
36,500 | 45.10 | ||||||
| January 2017—December 2017 |
109,500 | 44.80 | ||||||
| January 2018—December 2018 |
36,500 | 55.95 | ||||||
| Crude Oil Basis Swaps: |
||||||||
| February 2016—November 2016 |
68,750 | $ | (1.65 | ) | ||||
| February 2016—November 2016 |
68,750 | (1.05 | ) | |||||
| February 2016—November 2016 |
68,750 | (1.40 | ) | |||||
| March 2016—December 2016 |
76,500 | (0.55 | ) | |||||
| February 2016—November 2016 |
82,500 | 0.25 | ||||||
| February 2016—November 2016 |
55,000 | (0.16 | ) | |||||
| February 2016—November 2016 |
27,500 | (0.50 | ) | |||||
| February 2016—November 2016 |
27,500 | (0.40 | ) | |||||
| February 2016—November 2016 |
82,500 | (0.25 | ) | |||||
| February 2016—November 2016 |
137,500 | (0.25 | ) | |||||
| February 2016—November 2016 |
137,500 | (0.20 | ) | |||||
| February 2016—November 2016 |
55,000 | (0.10 | ) | |||||
| February 2016—November 2016 |
55,000 | 0.10 | ||||||
| November 2016—November 2017 |
91,250 | (0.20 | ) | |||||
| November 2016—November 2017 |
36,500 | (0.20 | ) | |||||
| (1) | The oil swap contracts are settled based on the month’s average daily NYMEX price of West Texas Intermediate Light Sweet Crude. The oil basis derivative contracts are settled based on the month’s average daily implied Principal Components of Our Cost Structure |
Counterparty and Customer Credit Risk
Our derivative contracts expose us to credit risk in the event of nonperformance by counterparties. While we do not require counterparties to our derivative contracts to post collateral, we do evaluate the credit standing of such counterparties as we deem appropriate. The counterparties to our derivative contracts currently in place have investment grade ratings.
79
Table of Contents
Our principal exposures to credit risk are through receivables resulting from joint interest receivables and receivables from the sale of our oil and natural gas production due to the concentration of our oil and natural gas receivables with several significant customers. The inability or failure of our significant customers to meet their obligations to us or their insolvency or liquidation may adversely affect our financial results. However, we believe the credit quality of our customers is high.
Joint operations receivables arise from billings to entities that own partial interests in the wells we operate. These entities participate in our wells primarily based on their ownership in leases on which we intend to drill. We have little ability to control whether these entities will participate in our wells.
Interest Rate Risk
At March 31, 2016, we had $142.0 million of debt outstanding, with an assumed weighted average interest rate of 3.93%. Interest is calculated under the terms of our credit agreement based on a LIBOR spread. Assuming no change in the amount outstanding, the impact on interest expense of a 1% increase or decrease in the assumed weighted average interest rate would be approximately $1.4 million per year. We do not currently have or intend to enter into any derivative arrangements to protect against fluctuations in interest rates applicable to our outstanding indebtedness.
Critical Accounting Policies and Estimates
The discussion and analysis of our financial condition and results of operations are based upon our predecessor’s consolidated and combined financial statements, which have been prepared in accordance with GAAP. The preparation of our predecessor’s financial statements requires it to make estimates and assumptions that affect the reported amounts of assets, liabilities, revenues and expenses and related disclosure of contingent assets and liabilities. Changes in facts and circumstances or additional information may result in revised estimates, and actual results may differ from these estimates.
A complete list of our predecessor’s significant accounting policies are described in Note 2—Basis of Presentation, Summary of Significant Accounting Policies, and Recently Issued Accounting Standards in our predecessor’s audited financial statements for the year ended December 31, 2015 included elsewhere in this prospectus.
Successful Efforts Method of Accounting for Oil and Natural Gas Activities
Our oil and natural gas producing activities are accounted for using the successful efforts method of accounting. Under the successful efforts method, we capitalize lease acquisition costs, all development costs and successful exploration costs.
Proved Oil and Natural Gas Properties. Costs incurred to obtain access to proved reserves and to provide facilities for extracting, treating, gathering and storing oil, natural gas and NGLs are capitalized. All costs incurred to drill and equip successful exploratory wells, development wells, development-type stratigraphic test wells and service wells, including unsuccessful development wells, are capitalized.
Unproved Properties. Acquisition costs associated with the acquisition of non-producing leaseholds are recorded as unproved leasehold costs and capitalized as incurred. These consist of costs incurred in obtaining a mineral interest or right in a property, such as a lease in addition to options to lease, broker fees, recording fees and other similar costs related to acquiring properties. Leasehold costs are classified as unproved until proved reserves are discovered, at which time related costs are transferred to proved oil and natural gas properties.
Exploration Costs. Exploration costs, other than exploration drilling costs, are charged to expense as incurred. These costs include seismic expenditures, other geological and geophysical costs, and lease rentals. The costs of drilling exploratory wells and exploratory-type stratigraphic wells are initially capitalized pending
80
Table of Contents
determination of whether the well has discovered proved commercial reserves. If the exploratory well is determined to be unsuccessful, the cost of the well is transferred to expense.
Impairment of Oil and Natural Gas Properties
Our proved oil and natural gas properties are recorded at cost. We evaluate our proved properties for impairment when events or changes in circumstances indicate that a decline in the recoverability of their carrying value may have occurred. We estimate the expected future cash flows of our oil and natural gas properties and compare these undiscounted cash flows to the carrying amount of the oil and natural gas properties to determine if the carrying amount is recoverable. If the carrying amount exceeds the estimated undiscounted future cash flows, we will write down the carrying amount of the oil and natural gas properties to fair value. The factors used to determine fair value include, but are not limited to, estimates of reserves, future commodity prices, future production estimates, estimated future operating and capital expenditures, and discount rates.
Unproved properties costs consist of costs to acquire undeveloped leases as well as costs to acquire unproved reserves. We evaluate significant unproved properties for impairment based on remaining lease term, drilling results, reservoir performance, seismic interpretation or future plans to develop acreage.
Oil and Natural Gas Reserve Quantities
Our estimated proved reserve quantities and future net cash flows are critical to the understanding of the value of our business. They are used in comparative financial ratios and are the basis for significant accounting estimates in our financial statements, including the calculations of depletion and impairment of proved oil and natural gas properties. Future cash inflows and future production and development costs are determined by applying prices and costs, including transportation, quality differentials and basis differentials, applicable to each period to the estimated quantities of proved reserves remaining to be produced as of the end of that period. Expected cash flows are discounted to present value using an appropriate discount rate. For example, the standardized measure calculations require a 10 percent discount rate to be applied. Although reserve estimates are inherently imprecise, and estimates of new discoveries and undeveloped locations are more imprecise than those of established producing oil and gas properties, we make a considerable effort in estimating our reserves. We engage NSAI, our independent petroleum engineer, to prepare our total calculated proved reserve PV-10. We expect proved reserve estimates will change as additional information becomes available and as commodity prices and operating and capital costs change. We evaluate and estimate our proved reserves each year-end. For purposes of depletion and impairment, reserve quantities are adjusted in accordance with GAAP for the impact of additions and dispositions.
Revenue Recognition
Our revenue recognition policy is significant because revenue is a key component of our results of operations and our forward-looking statements contained in the above analysis of liquidity and capital resources. We derive our revenue primarily from the sale of produced oil, natural gas, and NGLs. Revenue is recognized when our production is delivered to the purchaser, but payment is generally received between 30 and 90 days after the date of production. No revenue is recognized unless it is determined that title to the product has transferred to a purchaser. At the end of each month, we make estimates of the amount of production delivered to the purchaser and the price we will receive. We use our knowledge of our properties, contractual arrangements, NYMEX and local spot market prices and other factors as the basis for these estimates. Variances between our estimates and the actual amounts received are recorded in the month payment is received.
Derivative Instruments
We utilize commodity derivative instruments, including swaps, collars and basis swaps, to manage the price risk associated with the forecasted sale of our oil and natural gas production. Our derivative instruments are not
81
Table of Contents
designated as hedges for accounting purposes. Accordingly, changes in fair value are recognized in our consolidated and combined statements of operations in the period of change. Gains and losses on derivatives and premiums paid for put options are included in cash flows from operating activities.
Asset Retirement Obligations
Our asset retirement obligation represents the estimated present value of the amount we will incur to retire long-lived assets at the end of their productive lives, in accordance with applicable state laws. Our asset retirement obligation is determined by calculating the present value of estimated cash flows related to the liability. The retirement obligation is recorded as a liability at its estimated present value as of inception with an offsetting increase in the carrying amount of the related long-lived asset. Periodic accretion of discount of the estimated liability is recorded as an expense in the income statement. The cost of the tangible asset, including the asset retirement cost, is depreciated over the useful life of the asset.
Asset retirement liability is determined using significant assumptions, including current estimates of plugging and abandonment costs, annual inflation of these costs, the productive lives of assets and our risk-adjusted interest rate. Changes in any of these assumptions can result in significant revisions to the estimated asset retirement obligation. Because of the subjectivity of assumptions, the costs to ultimately retire our wells may vary significantly from prior estimates.
Recently Issued Accounting Pronouncements
In February 2016, the FASB issued Accounting Standards Update (“ASU”) No. 2016-02, Leases, which requires all leasing arrangements to be presented in the balance sheet as liabilities along with a corresponding asset. The ASU will replace most existing leases guidance in GAAP when it becomes effective. The new standard becomes effective for us on January 1, 2019. Although early application is permitted, we do not plan to early adopt the ASU. The standard requires the use of the modified retrospective transition method. We are evaluating the impact, if any, that the adoption of this update will have on our condensed consolidated financial statements and related disclosures.
In March 2016, the FASB issued ASU No. 2016-09, Improvements to Employee Share-Based Payment Accounting, which includes provisions intended to simplify various aspects related to how share-based compensation payments are accounted for and presented in financial statements. This amendment will be effected prospectively for reporting periods beginning on or after December 15, 2016, and early adoption is permitted. We are evaluating the impact, if any, that the adoption of this update will have on our condensed consolidated financial statements and related disclosures.
In May 2014, the FASB issued ASU 2014-09, Revenue from Contracts with Customers. This guidance is to be applied using a full retrospective method or a modified retrospective method, as outlined in the guidance. In August 2015, the FASB deferred the effective date of the new revenue recognition standard by one year. The revenue recognition standard is now effective for annual periods, and interim periods within those annual periods, beginning after December 15, 2017. Early adoption is permitted but only for annual periods, and interim periods within those annual periods, beginning after December 15, 2016. We are evaluating the impact, if any, that the adoption of this update will have on our consolidated and combined financial statements and related disclosures.
Internal Controls and Procedures
We are not currently required to comply with the SEC’s rules implementing Section 404 of the Sarbanes Oxley Act of 2002, and are therefore not required to make a formal assessment of the effectiveness of our internal control over financial reporting for that purpose. Upon becoming a public company, we will be required
82
Table of Contents
to comply with the SEC’s rules implementing Section 302 of the Sarbanes-Oxley Act of 2002, which will require our management to certify financial and other information in our quarterly and annual reports and provide an annual management report on the effectiveness of our internal control over financial reporting. We will not be required to make our first assessment of our internal control over financial reporting under Section 404 until our first annual report subsequent to our ceasing to be an “emerging growth company” within the meaning of Section 2(a)(19) of the Securities Act.
Inflation
Inflation in the United States has been relatively low in recent years and did not have a material impact on our results of operations for the years ended December 31, 2015 or 2014. Although the impact of inflation has been insignificant in recent years, it is still a factor in the United States economy and we tend to experience inflationary pressure on the cost of oilfield services and equipment as increasing oil and natural gas prices increase drilling activity in our areas of operations.
Off-Balance Sheet Arrangements
Currently, neither we nor our predecessor have off-balance sheet arrangements.
83
Table of Contents
The following discussion should be read in conjunction with the “Selected Historical Consolidated and Combined Financial Data” and the accompanying financial statements and related notes included elsewhere in this prospectus.
The estimated proved reserve information for our properties as of December 31, 2015 contained in this prospectus is based on a reserve report relating to our properties prepared by NSAI, our independent petroleum engineer.
Business Overview
We are an independent oil and natural gas company focused on the development and acquisition of unconventional oil and associated liquids-rich natural gas reserves in the Permian Basin. Our assets are concentrated in the Delaware Basin, a sub-basin of the Permian Basin. Our properties consist of large, contiguous acreage blocks in Reeves, Ward and Pecos counties in West Texas.
As of June 15, 2016, our portfolio included 61 operated producing horizontal wells. Our horizontal wells span an area approximately 45 miles long by 20 miles wide where we have established commercial production in five distinct zones: the 3rd Bone Spring Sandstone, Upper Wolfcamp A, Lower Wolfcamp A, Wolfcamp B and Wolfcamp C. As a result, we have broadly appraised our acreage across various geographic areas and stratigraphic zones, which we expect will allow us to efficiently develop our drilling inventory with a focus on maximizing returns to our stockholders. In addition, we believe our acreage may be prospective for the 2nd and 3rd Bone Spring shales and Avalon Shale, where other operators have experienced drilling success near our acreage.
We have leased or acquired approximately 42,500 net acres, approximately 83% of which we operate, as of June 15, 2016. Our acreage is predominantly located in the southern portion of the Delaware Basin, where production and reserves typically contain a higher percentage of oil and natural gas liquids and a correspondingly lower percentage of natural gas compared to the northern portion of the Delaware Basin. After temporarily suspending drilling activity at the end of March 2016 to preserve capital, we added one horizontal rig in June 2016 and expect to add a second horizontal rig in the fourth quarter of 2016. During 2015, we operated, on average, one rig and placed 13 horizontal wells on production. Our development drilling plan is comprised exclusively of horizontal drilling with an ongoing focus on reducing drilling times, optimizing completions and reducing costs.
The Permian Basin is an attractive operating area due to its extensive original oil-in-place, favorable operating environment, multiple horizontal zones, high oil and liquids-rich natural gas content, well-developed network of oilfield service providers, long-lived reserves with relatively consistent reservoir quality and historically high drilling success rates. According to the EIA, the Permian Basin is the most prolific oil producing area in the United States, accounting for 23% and 20% of total U.S. crude oil production during the twelve-month periods ended April 30, 2016 and April 30, 2015, respectively.
84
Table of Contents
Over the past decade, the Delaware Basin has experienced significant horizontal drilling. According to Baker Hughes, three of the top six Permian Basin counties by horizontal rig count are located in the Delaware Basin. Reeves County, where the majority of our acreage is located, had the second most horizontal rigs of any U.S. county as of June 17, 2016, with 21 rigs as of such date. As a result of this horizontal drilling, the Delaware Basin is the only region in the United States that has experienced sustained fourth quarter-to-fourth quarter production growth rates greater than 25% for the past three years, as illustrated in the chart below.
| Year-Over-Year Production Growth for Major Oil Basins and Plays |
| Production (MMBoe) |
| Permian Basin(1) | ||||||||||||||||
| Delaware Wolfcamp, Bone Spring |
Midland Wolfcamp, Spraberry |
Eagle Ford | Bakken / Three Forks |
|||||||||||||
| Fourth Quarter 2012 |
22.5 | 49.6 | 112.5 | 78.2 | ||||||||||||
| Fourth Quarter 2013 |
33.8 | 61.4 | 164.0 | 101.0 | ||||||||||||
| Fourth Quarter 2014 |
56.9 | 86.1 | 219.2 | 130.3 | ||||||||||||
| Fourth Quarter 2015 |
72.6 | 91.8 | 205.9 | 127.1 | ||||||||||||
| (1) | Does not include production in the Permian Basin beyond the Midland and Delaware Basins. |
Source: IHS Performance Evaluator as of April 2016.
85
Table of Contents
Based on recent well results and significant decreases in drilling and completion costs, we believe the Delaware Basin represents one of the most attractive operating regions in the United States. As illustrated in the chart below, according to data from IHS Performance Evaluator, in 2012, 2013, 2014 and 2015, wells in the Delaware Basin had a higher average three-month cumulative initial production per 1,000 feet of lateral section than wells in the Midland Basin, another sub-basin of the Permian Basin. These results are driven primarily by the over-pressured nature of the Bone Spring and Wolfcamp reservoirs in the Delaware Basin, which enhances the deliverability of horizontal wells. We believe these results indicate the Wolfcamp and the Bone Spring formations in the Delaware Basin generate greater implied EURs per 1,000 feet of lateral length as compared to the Spraberry and Wolfcamp zones in the Midland Basin.
| Horizontal Well Results—Delaware Basin versus Midland Basin |
Average per well 3 month cumulative initial production
(MBoe per 1,000 feet of lateral length)
Note: Delaware Basin includes horizontal wells from Wolfcamp and Bone Spring producing formations and Midland Basin includes wells from Wolfcamp and Spraberry producing formations. Reflects a 6:1 gas - oil equivalent conversion ratio.
Source: IHS Performance Evaluator as of April 2016.
We were formed by an affiliate of NGP, a family of energy-focused private equity investments funds. Our goal is to build a premier development and acquisition company focused on horizontal drilling in the Delaware Basin. Our key management and technical team members average approximately 28 years of experience and have successfully led development operations in prolific oil basins in the Continental United States, including horizontal development in the Permian, Bakken and Niobrara plays. This expertise and technical acumen have been applied to the horizontal drilling and multi-stage completions on our properties, resulting in drilling success and continuous operating improvements across multiple zones.
We have assembled a multi-year inventory of horizontal drilling projects. As of June 15, 2016, we had identified 1,357 gross horizontal drilling locations in the 3rd Bone Spring Sandstone, Upper Wolfcamp A, Lower Wolfcamp A, Wolfcamp B and Wolfcamp C zones across our Delaware Basin acreage based on spacing of four wells per 640-acre section in the 3rd Bone Spring Sandstone and five to six wells per 640-acre section in the Wolfcamp zones. Our drilling inventory includes 366 extended lateral locations of either 9,500 or 7,500 lateral feet. Our near-term drilling program is focused on both the Upper and Lower Wolfcamp A zones, but we also intend to drill locations in the 3rd Bone Spring Sandstone, Wolfcamp B and Wolfcamp C zones. Based on our and other operators’ well results and our analysis of geologic and engineering data, we believe the 2nd and 3rd Bone Spring shales and Avalon Shale may also be prospective across our acreage, and we may integrate these
86
Table of Contents
zones into our future drilling program as they become further delineated. The following table provides a summary of our gross horizontal drilling locations by zone as of June 15, 2016.
Gross Identified Horizontal Drilling Locations(1)(2)
| Total | ||||
| Zones: |
||||
| 3rd Bone Spring Sandstone |
64 | |||
| Upper Wolfcamp A |
398 | |||
| Lower Wolfcamp A |
329 | |||
| Wolfcamp B |
300 | |||
| Wolfcamp C |
266 | |||
|
|
|
|||
| Total Horizontal Locations(3)(4) |
1,357 | |||
|
|
|
|||
| (1) | Our total identified horizontal drilling locations include 51 locations associated with proved undeveloped reserves as of December 31, 2015. We have estimated our drilling locations based on well spacing assumptions and upon the evaluation of our horizontal drilling results and those of other operators in our area, combined with our interpretation of available geologic and engineering data. In particular, we have analyzed and interpreted well results and other data acquired through our participation in the drilling of vertical wells that have penetrated our horizontal zones. In addition, to evaluate the prospectivity of our horizontal acreage, we have performed open-hole and mud log evaluations, core analysis and drill cuttings analysis. See “—Our Properties.” The drilling locations that we actually drill will depend on the availability of capital, regulatory approvals, commodity prices, costs, actual drilling results and other factors. Any drilling activities we are able to conduct on these identified locations may not be successful and may not result in our ability to add additional proved reserves to our existing proved reserves. See “Risk Factors—Risks Related to Our Business—Drilling for and producing oil and natural gas are high risk activities with many uncertainties that could adversely affect our business, financial condition or results of operations.” Further, to the extent the drilling locations are associated with acreage that expires, we would lose our right to develop the related locations. See “Risk Factors—Risks Related to Our Business—Our identified drilling locations are scheduled out over many years, making them susceptible to uncertainties that could materially alter the occurrence or timing of their drilling. In addition, we may not be able to raise the substantial amount of capital that would be necessary to drill such locations.” |
| (2) | Our horizontal drilling location count implies 880-foot spacing with five to six wells per 640-acre section in the Wolfcamp zones and 1,320-foot spacing with four wells per 640-acre section in the 3rd Bone Spring Sandstone, in each case, consisting primarily of single-section (i.e., approximately 4,500-foot) laterals. |
| (3) | 674 of our 1,357 horizontal drilling locations are on acreage that we operate. We have an approximate 82% average working interest in our operated acreage. |
| (4) | We have included undeveloped horizontal locations only on our leasehold in Reeves and Ward counties. |
We believe that development drilling of our 1,357 gross horizontal locations, with an increasing focus on drilling extended lateral wells as well as potential downspacing, will allow us to grow our production and reserves. In addition, we believe our large acreage blocks allow us to optimize our horizontal development program to maximize our resource recovery and our returns. We also intend to grow our production and reserves through acquisitions that meet our strategic and financial objectives. Furthermore, we believe our operational efficiency is enhanced by a third-party gas gathering system and cryogenic processing plant, which were built specifically for the area where the majority of our acreage is located, and our operated saltwater disposal system. In addition, a third-party crude gathering system, which is expected to be operational in the third quarter of 2016 and which will transport the majority of our crude oil to market at a lower cost than we have experienced historically, will provide additional efficiencies.
87
Table of Contents
We experienced a significant decrease in our drilling and completion costs during 2015, which has continued into 2016. This trend has been driven by efficiency improvements in the field, including reduced drilling days, the modification of well designs and reduction or elimination of unnecessary costs. Additionally, overall service costs have declined as a result of reduced industry demand. For the three months ended March 31, 2016, the spud-to-rig release for our three single-section horizontal wells was approximately 22 days compared to 28 days and 46 days for all single-section horizontal wells we drilled in 2015 and 2014, respectively. We expect that further optimization in the field (including the increased drilling of longer laterals, pad drilling, the use of shared facilities and zipper fracs), reduced rig rates and lower service costs will improve our well economics.
Our 2016 capital budget for drilling, completion and recompletion activities and facilities costs is approximately $87 million, excluding leasing and other acquisitions. We expect to allocate approximately $72 million of our 2016 capital budget for the drilling and completion of operated wells and $8 million for our participation in the drilling and completion of non-operated wells. For 2016, we have budgeted $25 million for leasing. In the three months ended March 31, 2016, we incurred capital costs of approximately $16.5 million, excluding leasing and acquisition costs.
Because we operate approximately 83% of our net acreage, the amount and timing of these capital expenditures are largely subject to our discretion. We believe our approximate 82% average working interest in our operated acreage provides us with flexibility to manage our drilling program and optimize our returns and profitability. We could choose to defer a portion of our planned capital expenditures depending on a variety of factors, including the success of our drilling activities; prevailing and anticipated prices for oil, natural gas and NGLs; the availability of necessary equipment, infrastructure and capital; the receipt and timing of required regulatory permits and approvals; drilling, completion and acquisition costs; and the level of participation by other working interest owners. We have an approximate 15% working interest in our non-operated acreage.
For the three months ended March 31, 2016, our average net daily production was 7,212 Boe/d (approximately 71.7% oil, 17.7% natural gas and 10.6% NGLs). The following table provides summary information regarding our proved reserves as of December 31, 2015, based on a reserve report prepared by NSAI, our independent petroleum engineer. Of our proved reserves, approximately 40% were classified as PDP. PUDs included in this estimate are from 52 horizontal well locations across three zones.
| Estimated Total Proved Reserves | ||||||||||||
| Oil (MMBbls) |
NGLs |
Natural Gas |
Total (MMBoe) |
% Oil |
% Liquids(1) |
% Developed | ||||||
| 23.2 |
3.9 | 32.4 | 32.5 | 71 | 83 | 40 | ||||||
| (1) | Includes oil and NGLs. |
Based on the reserve estimates of NSAI, the average PUD horizontal EUR as of December 31, 2015 is approximately 610 MBoe (approximately 71% oil, 12% NGLs and 17% natural gas) for our Wolfcamp wells, which have an average lateral length of approximately 4,500 feet.
Business Strategies
Our primary business objective is to increase stockholder value through the following strategies:
| • | Grow production, cash flow and reserves by developing our extensive Delaware Basin drilling inventory. Our horizontal drilling expertise and technical acumen have enabled us to successfully drill horizontal wells across the areal extent of our acreage while targeting multiple horizontal zones. We have identified an inventory of 1,357 horizontal drilling locations across five zones, which we believe can be expanded via downspacing or the de-risking of other stacked pay zones accessible on our leasehold. After |
88
Table of Contents
| temporarily suspending drilling activity at the end of March 2016 to preserve capital, we added one horizontal drilling rig in June 2016 and expect to add a second horizontal rig in the fourth quarter of 2016. Our recent drilling activity has focused on both the Upper and Lower Wolfcamp A zones. We also plan to target the 3rd Bone Spring Sandstone, Wolfcamp B and Wolfcamp C zones in our future drilling program. We will continue to closely monitor operators with active leases on adjoining properties, or offset operators, as they delineate adjoining acreage and zones, providing us further data to optimize our development plan over time. We believe this strategy will allow us to significantly grow our production, cash flow and reserves while efficiently allocating capital to maximize the value of our resource base. |
| • | Maximize returns by optimizing drilling and completion techniques and improving operating efficiency. We believe completion design combined with cost reductions are the biggest drivers within our control affecting field-level economics. Additionally, we believe that drilling extended laterals of 7,500 or 9,500 feet will enhance our field level economics, and we are optimizing our land position, through swaps and acquisitions, to maximize our extended lateral inventory. We seek to optimize our wellbore economics and consequently increase net asset value through a methodical and continuous focus on drilling efficiency, wellbore accuracy, completion design and execution. We have also improved our completion techniques by increasing the amount of proppant used, reducing gel weight and increasing the slickwater component of total fluid pumped. We closely monitor offset operators to learn from their operational results and apply best practices to our own drilling plan to enhance returns. |
| • | Maintain a high degree of operational control. We seek to maintain operational control of our properties in order to better execute on our strategy of enhancing returns through operating improvements and cost efficiencies. As the operator of approximately 83% of our net acreage, we are able to manage (i) the timing and level of our capital spending, (ii) our development drilling strategies and (iii) our operating costs. We believe this flexibility to manage our drilling program allows us to optimize our returns and profitability. |
| • | Leverage extensive acquisition and Delaware Basin experience to evaluate and execute accretive opportunities. Our executive and core technical team has an average of approximately 28 years of industry experience. Our team has significant experience in successfully evaluating and executing acquisition opportunities and an extensive track record of building businesses in resource plays. Furthermore, we believe our ability to understand the geology, geophysics and reservoir parameters of the rock formations in the Delaware Basin will allow us to make prudent future acquisition decisions in order to grow our resource base and maximize stockholder value. Finally, we have developed working relationships with many operators in the Delaware Basin that we believe represent potential acquisition or partnership opportunities and also provide insight into operational best practices. |
| • | Preserve financial flexibility to pursue organic and external growth opportunities. We carefully manage our liquidity and leverage levels by continuously monitoring cash flow, capital spending and debt capacity. We intend to maintain modest leverage levels to preserve operational and strategic flexibility as well as access to the capital markets. We expect to fund our growth with cash flow from operations, availability under our revolving credit facility and capital markets offerings when appropriate. We intend to allocate capital in a disciplined manner and proactively manage our cost structure to achieve our business objectives. We expect to maintain an active hedging program that seeks to reduce our exposure to commodity price volatility and protect our cash flow. |
Our Competitive Strengths
We believe that the following strengths will help us achieve our business goals:
| • | Attractively positioned in the oil-rich core of the Southern Delaware Basin. Substantially all of our current leasehold acreage is located in the oil-rich southern portion of the Delaware Basin in Reeves, Ward and Pecos counties. The majority of our properties are in Reeves County, which is the second most active county in the United States in horizontal drilling with 21 horizontal rigs running as of June 17, 2016. We believe our multi-year, oil-weighted inventory of horizontal drilling locations provides |
89
Table of Contents
| attractive growth and return opportunities. As of December 31, 2015, our estimated reserves consisted of approximately 71% oil, 12% NGLs and 17% natural gas. The extensive original oil-in-place and other favorable geologic characteristics of the Southern Delaware Basin, along with the established vertical well control present across our acreage, give us a high degree of confidence in our current inventory of horizontal drilling locations. Further, our acreage is in close proximity to extensive infrastructure with long-term transportation agreements in place, which facilitates development. A crude gathering system, which is expected to be operational in the third quarter of 2016, will transport the majority of our crude oil to market at a lower cost than we have experienced historically. For gas gathering and processing, the majority of our gas is processed at a cryogenic plant that is centrally located in our area of operations. As a result of the existing infrastructure, the Permian Basin has historically realized attractive differentials compared to other top U.S. basins. |
| • | Large horizontal drilling inventory across multiple pay zones. We have identified 1,357 undeveloped horizontal drilling locations in five zones across our acreage position in Reeves and Ward counties. Our horizontal drilling inventory includes 366 extended lateral locations that we believe will generate superior economic returns relative to single-section laterals. Based upon our current operated drilling inventory and anticipated development pace, we believe we have over ten years of drilling inventory. In addition, we believe we may be able to identify additional horizontal locations as we conduct future downspacing pilots. Of the initial 1,357 identified horizontal drilling locations, 64 are in the 3rd Bone Spring Sandstone, 398 are in the Upper Wolfcamp A, 329 are in the Lower Wolfcamp A, 300 are in the Wolfcamp B and 266 are in the Wolfcamp C. Future development results achieved by us and offset operators may allow us to expand our location inventory in these intervals to other parts of our leasehold. Furthermore, the 2nd and 3rd Bone Spring shales, which are thought to be geologically analogous to the Middle and Lower Spraberry shales in the Midland Basin, and the Avalon Shale may provide additional future opportunities as offset operators prove up and reduce development risk in those zones. |
| • | Our acreage has been delineated across multiple zones. Our 61 operated horizontal wells span an area approximately 45 miles long by 20 miles wide where we have established commercial production in five distinct zones: the 3rd Bone Spring Sandstone, Upper Wolfcamp A, Lower Wolfcamp A, Wolfcamp B and Wolfcamp C. As a result, we have broadly appraised our acreage across various geographic areas and stratigraphic zones, which we expect will allow us to efficiently develop our drilling inventory with a focus on maximizing returns to our stockholders. In addition, offset operators have continued to successfully drill horizontal wells across our five targeted zones in close proximity to our leasehold, further delineating our acreage position. This delineation of the surrounding acreage by offset operators combined with the consistent performance of our wells provides us with substantial data to make development decisions. |
| • | Proven horizontal drilling expertise and technical acumen in the Delaware Basin. We believe our horizontal drilling experience targeting multiple pay zones in the Delaware Basin provides us with a competitive advantage. Over the past two years, we have substantially reduced drilling days for our Wolfcamp horizontal wells. For the three months ended March 31, 2016, the average spud-to-rig release for our three single-section horizontal wells was 22 days, as compared to 28 days and 46 days for all single-section horizontal wells we drilled in 2015 and 2014, respectively. We expect drilling efficiencies to continue and have continually modified our completion design to optimize the performance of our wells. Furthermore, our technical team has extensive experience developing resources using horizontal drilling in the Permian, Bakken and Niobrara plays over the last decade and has leveraged this experience to enhance the development of our Delaware Basin acreage. |
| • | High degree of operational control. Our significant operational control allows us to execute our development program, with a focus on the timing and allocation of capital expenditures and application of the optimal drilling and completion techniques to efficiently develop our resource base. We believe this flexibility allows us to efficiently develop our current acreage and adjust drilling and completion activity opportunistically for the prevailing commodity price environment. In addition, we believe communication and data exchange with offset operators will reduce the risks associated with drilling the multiple horizontal zones of our acreage. We also believe our significant level of operational control will enable us to implement drilling and completion optimization strategies, such as pad drilling, continued reduction of |
90
Table of Contents
| spud-to-rig release days and tailored completion designs. As of June 15, 2016, approximately 75% of our net acreage in Reeves and Ward counties was either held by production or under continuous drilling provisions. We believe the substantial majority of our operated net acreage in Reeves and Ward counties will be held by production or under continuous drilling provisions by the end of 2017. |
| • | Experienced and incentivized management team. With an average of 28 years of industry experience, our senior management team has a proven track record of building and running successful businesses focused on the development and acquisition of oil and natural gas properties. We believe our team’s experience and expertise in horizontal drilling and completions in unconventional formations across multiple resource plays provides us with a distinct competitive advantage. Additionally, our management team has a significant economic interest in us, which provides a meaningful incentive to increase the value of our business for the benefit of all stockholders. |
| • | Conservatively capitalized balance sheet and strong liquidity profile. After giving effect to this offering and the use of proceeds therefrom, we expect to have no outstanding debt and approximately $ million of cash on the balance sheet. We believe the approximately $ million of availability under our revolving credit facility, cash on hand and cash flow from operations will provide us with sufficient liquidity to execute on our current capital program. |
Our Properties
Our properties include working interests in approximately 90,700 gross (42,500 net) surface acres, substantially all of which are located in the oil-rich core of the Southern Delaware Basin, a sub-basin of the Permian Basin, in the Texas counties of Reeves, Ward and Pecos. The following table summarizes our surface acreage by county as of June 15, 2016.
| Gross | Net | |||||||
| County: |
||||||||
| Reeves |
76,100 | 35,800 | ||||||
| Ward |
2,400 | 1,900 | ||||||
| Pecos |
12,200 | 4,800 | ||||||
|
|
|
|
|
|||||
| Total |
90,700 | 42,500 | ||||||
|
|
|
|
|
|||||
Permian Basin. The Permian Basin consists of mature, legacy onshore oil and liquids-rich natural gas reservoirs that span approximately 86,000 square miles in West Texas and New Mexico. The Basin is composed of five sub regions: the Delaware Basin, the Central Basin Platform, the Midland Basin, the Northwest Shelf and the Eastern Shelf. The Permian Basin is an attractive operating area due to its multiple horizontal and vertical target zones, favorable operating environment, high oil and liquids-rich natural gas content, mature infrastructure, well-developed network of oilfield service providers, long-lived reserves with consistent reservoir quality and historically high drilling success rates. According to the EIA, the Permian Basin is the most prolific oil producing area in the U.S., accounting for 23% and 20% of total U.S. crude oil production during the twelve-month periods ended April 30, 2016 and April 30, 2015, respectively. Six key producing formations within the Permian Basin (Spraberry, Wolfcamp, Bone Spring, Glorieta, Yeso and Delaware) have provided the bulk of the Basin’s 122% increase in oil production since 2007. Approximately 62% of the increase came from the Wolfcamp, Bone Spring and Spraberry formations.
Delaware Basin. The present structural form of the Delaware Basin, a sub-basin of the Permian Basin, began to take shape in the early Pennsylvanian period at which time the area slowly downwarped relative to the adjacent Central Basin Platform and Northwest Shelf. This period was characterized by relatively stable marine shale and limestone deposition with periodic influxes of siliciclastics during sea-level lowstands. Stratigraphic records indicate a rapid deepening of the Delaware Basin during early Permian time. High total organic carbon
91
Table of Contents
marine shales, carbonate debris flows and turbidite sandstones were the predominant deposits in the Delaware Basin during this period. Subsequent burial and thermal maturation of this thick Permian succession of highly organic source and reservoir rock resulted in what we believe is evolving into a prolific oil field.
The Delaware Basin encompasses an estimated 10,039 square miles and contained over 25,000 producing wells at the end of 2015, with production from certain wells dating back to 1924. Over the past decade, horizontal drilling activity has been more prevalent within the Delaware Basin relative to other areas of the Permian Basin. According to Baker Hughes, three of the top six Permian Basin counties by horizontal rig count are located in the Delaware Basin. Reeves County, where the majority of our acreage is located, had the second most horizontal rigs of any U.S. county in June 17, 2016, with 21 rigs as of such date.
We believe that our properties are prospective for oil and liquids-rich natural gas from multiple producing stratigraphic horizons, which we refer to as “stacked pay zones.” For the three months ended March 31, 2016, our net daily production averaged 71.7% oil, 17.7% natural gas and 10.6% NGLs and had a greater liquids-content than other areas of the Delaware Basin.
Oil and gas production was first established in the area of our leasehold from vertical wells in the Wolfbone interval, a blend of stacked pay zones in the Permian (Wolfcampian) Wolfcamp and overlying (Leonardian) Bone Spring formations. Operators were initially drawn to this area for the thick pay section, superior rock quality and oil-rich production. The Barilla Draw field, partially coincident with our leasehold, is the source of substantial petrophysical data acquired during this vertical phase of development. This data, including 17 of our wells with advanced petrophysical logs and two of our wells with whole core, is being utilized to guide our horizontal development of the area. The vertical development has resulted in a better understanding of our leasehold’s geology relative to other parts of the Basin and has not caused significant depletion. Depth to the top of the Wolfcamp from a representative well central to our leasehold is approximately 10,600 feet. The gross thickness of the potential pay section from the top of the Bone Spring formation through the base of the Wolfcamp C is approximately 3,500 feet, an attractive thickness for development with multiple horizontal landing zones. We believe that the combination of these conditions will allow us to achieve superior results during the development of our leasehold.
Our horizontal drilling, including 61 operated wells, has been widespread with locations across the majority of our leasehold. We have established commercial production in five distinct zones: the 3rd Bone Spring Sandstone, Upper Wolfcamp A, Lower Wolfcamp A, Wolfcamp B and Wolfcamp C, across an area approximately 45 miles long by 20 miles wide. As a result, we have broadly appraised our acreage across various geographic areas and stratigraphic zones. Also, as of June 15, 2016, approximately 67% of our total net acreage (approximately 75% of our net acreage in Reeves and Ward counties) was either held by production or under continuous drilling provisions. This has put us in a position to strategically develop our acreage with a near-term focus on high-return projects. Our previous activity, such as horizontal drilling in the Wolfcamp B and C zones, has been a catalyst for activity from offset operators. We will closely monitor this offset activity and adjust our future development plans with information and best practices learned from our peers.
We operate approximately 83% of our net acreage and have an approximate 82% average working interest in our operated acreage. This operational control gives us flexibility in development strategy and pace. After temporarily suspending drilling activity at the end of March 2016 to preserve capital, which suspension had no effect on our proved undeveloped reserves as of December 31, 2015, we added one horizontal drilling rig in June 2016 and expect to add a second horizontal rig in the fourth quarter of 2016. During 2015, we operated, on average, one rig and placed 13 horizontal wells on production. Our development drilling plan is comprised exclusively of horizontal drilling with an ongoing focus on reducing drilling times, optimizing completions and reducing costs without compromising worker health, safety and environmental protection. For the three months ended March 31, 2016, the spud-to-rig release for our three single-section horizontal wells was approximately 22 days compared to 28 days and 46 days for all single-section horizontal wells we drilled in 2015 and 2014, respectively. We expect that further optimization in the field (including the increased drilling of longer laterals,
92
Table of Contents
pad drilling, the use of shared facilities and zipper fracs), reduced rig rates and lower service costs will improve our well economics. In March 2016, we drilled and completed our first 9,500-foot lateral well, which had an initial 90-day oil production rate of approximately 900 barrels of oil per day.
Completion design and its effective execution are the predominant factors that dictate relative well performance in an area or zone. We have an evolving completion strategy that includes methodical adjustments of parameters, experimentation of different designs on adjacent locations with similar rock characteristics, constant monitoring and re-evaluation of results and ultimately tailoring completions to the conditions specific to an area or zone. Our current base completion design is a hybrid fracture stimulation, a combination of slickwater and cross-linked gel, targeting approximately 150 feet stage length, 50 feet cluster spacing, 40 barrels of total fluid per foot of lateral length and 1,600 to 1,900 pounds of white sand per foot of lateral length. Field-level rate of return is most influenced by incremental improvements in well performance and cost savings; our philosophy is to focus on both parameters, with an emphasis on performance enhancement.
Our current drilling program is focused primarily on the Upper and Lower Wolfcamp A intervals. However, based on existing well results and our analysis of geologic and engineering data, we believe the 3rd Bone Spring Sandstone, Wolfcamp B and Wolfcamp C intervals are prospective across our acreage and plan to target those zones in our future drilling program. Our current location count for the Wolfcamp is based on locations spaced approximately 880 feet from each other within a zone and staggered vertically in adjacent zones, and for the 3rd Bone Spring Sandstone, the current location count is based on locations spaced approximately 1,320 feet from each other (as illustrated in the figure below). If future downspacing pilots are successful, we may be able to add additional locations to our multi-year inventory. In addition, we believe our acreage may be prospective for the 2nd and 3rd Bone Spring shales and Avalon Shale, where other operators have experienced drilling success near our acreage.
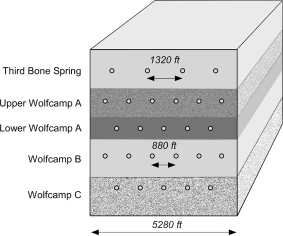
NSAI, our independent petroleum engineer, has estimated that as of December 31, 2015, proved reserves net to our interest in our properties were approximately 32,457 MBoe, of which 40% were classified as PDP. The proved reserves are generally characterized as long-lived, with predictable production profiles.
Production Status. For the three months ended March 31, 2016, our average net daily production was 7,212 Boe/d (approximately 71.7% oil, 17.7% natural gas and 10.6% NGLs). During 2015, our average net daily production was 7,317 Boe/d (approximately 69% oil and 19% natural gas and 12% NGLs). As of March 31, 2016, we produced from 72 horizontal and 68 vertical wells, in each case, operated and non-operated.
Facilities. We strive to develop the necessary infrastructure to lower our costs and support our drilling schedule and production growth. We accomplish this goal primarily through contractual arrangements with third-party service providers. Our facilities located on our properties are generally in close proximity to our well
93
Table of Contents
locations and include storage tank batteries, oil/gas/water separation equipment and artificial lift equipment. A crude gathering system, which is expected to be operational in the third quarter of 2016, will transport the majority of our crude oil to market at a lower cost than we have experienced historically. For gas gathering and processing, we have infrastructure in place that spans the heart of our leasehold. The majority of our gas is processed at a cryogenic plant that is centrally located in our area of operations. We have a long-term agreement with a third-party gas gatherer and processor and benefit from priority producer status as the anchor tenant.
Recent and Future Activity. During the three months ended March 31, 2016, 2 gross (1.0 net) wells were placed on production on our acreage. All of these wells were horizontal wells. After temporarily suspending drilling activity at the end of March 2016 to preserve capital, we added one horizontal rig in June 2016 and expect to add a second horizontal rig in the fourth quarter of 2016. During the remainder of 2016, an additional 11 operated horizontal wells are scheduled to be placed on production.
As of June 15, 2016, we had identified 1,357 gross horizontal drilling locations in the 3rd Bone Spring Sandstone, Upper Wolfcamp A, Lower Wolfcamp A, Wolfcamp B and Wolfcamp C horizontal zones across our Delaware Basin acreage based on approximately 880-foot spacing for the Wolfcamp zones and 1,320-foot spacing for the 3rd Bone Spring Sandstone. Our drilling inventory includes 366 horizontal extended lateral locations of either 9,500 or 7,500 feet. In this prospectus, we define identified gross drilling locations as locations on operated and non-operated leaseholds specifically identified by management as an estimation of our multi-year drilling activities based on evaluation of applicable geologic and engineering data. We have estimated our drilling locations based on well spacing assumptions and upon the evaluation of our horizontal drilling results and those of other operators in our area, combined with our interpretation of available geologic and engineering data. In particular, we have analyzed and interpreted well results and other data acquired through our participation in the drilling of vertical wells that have penetrated our horizontal zones. In addition, to evaluate the prospectivity of our horizontal acreage, we have performed open-hole and mud log evaluations, core analysis and drill cuttings analysis. The availability of local infrastructure, drilling support assets and other factors as management may deem relevant, such as easement restrictions and state and local regulations, are considered in determining such locations. The drilling locations for which we actually drill wells will ultimately depend upon the availability of capital, regulatory approvals, seasonal restrictions, oil and natural gas prices, costs, actual drilling results and other factors.
Oil and Natural Gas Data
Proved Reserves
Evaluation and Review of Proved Reserves. Our proved reserve estimates as of December 31, 2015 and 2014 were prepared by NSAI, our independent petroleum engineer. The technical persons responsible for preparing our proved reserve estimates meet the requirements with regard to qualifications, independence, objectivity and confidentiality set forth in the Standards Pertaining to the Estimating and Auditing of Oil and Gas Reserves Information promulgated by the Society of Petroleum Engineers. NSAI does not own an interest in any of our properties, nor is it employed by us on a contingent basis. A copy of our independent petroleum engineer’s proved reserve reports as of December 31, 2015 and December 31, 2014 are included as exhibits to the registration statement of which this prospectus forms a part.
We maintain an internal staff of petroleum engineers and geoscience professionals who worked closely with our independent petroleum engineer to ensure the integrity, accuracy and timeliness of the data used to calculate our proved reserves relating to our assets in the Permian Basin. Our internal technical team members meet with our independent petroleum engineer periodically during the period covered by the proved reserve report to discuss the assumptions and methods used in the proved reserve estimation process. We provide historical information to NSAI for our properties, such as ownership interest, oil and natural gas production, well test data, commodity prices and operating and development costs. Terry Sherban, our Vice President, Reservoir Engineering, is primarily responsible for overseeing the preparation of all of our reserve estimates. Mr. Sherban
94
Table of Contents
is a petroleum engineer with 37 years of reservoir and operations experience, and our geoscience staff has an average of approximately 28 years of energy industry experience.
The preparation of our proved reserve estimates were completed in accordance with our internal control procedures. These procedures, which are intended to ensure reliability of reserve estimations, include the following:
| • | review and verification of historical production data, which data is based on actual production as reported by us; |
| • | review of reserve estimates by Mr. Sherban or under his direct supervision; |
| • | review by our Vice President, Development and Chief Executive Officer of all of our reported proved reserves, including the review of all significant reserve changes and all new PUDs additions; |
| • | direct reporting responsibilities by our Vice President, Reservoir Engineering to our Chief Executive Officer; and |
| • | verification of property ownership by our land department. |
Estimation of Proved Reserves. Under SEC rules, proved reserves are those quantities of oil and natural gas, which, by analysis of geoscience and engineering data, can be estimated with reasonable certainty to be economically producible—from a given date forward, from known reservoirs and under existing economic conditions, operating methods and government regulations—prior to the time at which contracts providing the right to operate expire, unless evidence indicates that renewal is reasonably certain, regardless of whether deterministic or probabilistic methods are used for the estimation. If deterministic methods are used, the SEC has defined reasonable certainty for proved reserves as a “high degree of confidence that the quantities will be recovered.” All of our proved reserves as of December 31, 2015 and December 31, 2014 were estimated using a deterministic method. The estimation of reserves involves two distinct determinations. The first determination results in the estimation of the quantities of recoverable oil and natural gas and the second determination results in the estimation of the uncertainty associated with those estimated quantities in accordance with the definitions established under SEC rules. The process of estimating the quantities of recoverable oil and natural gas reserves relies on the use of certain generally accepted analytical procedures. These analytical procedures fall into four broad categories or methods: (i) production performance-based methods; (ii) material balance-based methods; (iii) volumetric-based methods; and (iv) analogy. These methods may be used singularly or in combination by the reserve evaluator in the process of estimating the quantities of reserves. Reserves for PDP wells were estimated using production performance methods for the vast majority of properties. Certain new producing properties with very little production history were forecast using a combination of production performance and analogy to similar production, both of which are considered to provide a reasonably high degree of accuracy. Non-producing reserve estimates, for developed and undeveloped properties, were forecast using analogy methods. This method provides a reasonably high degree of accuracy for predicting proved developed non-producing (“PDNP”) and PUD for our properties, due to the abundance of analog data.
To estimate economically recoverable proved reserves and related future net cash flows, NSAI considered many factors and assumptions, including the use of reservoir parameters derived from geological and engineering data which cannot be measured directly, economic criteria based on current costs and the SEC pricing requirements and forecasts of future production rates.
Under SEC rules, reasonable certainty can be established using techniques that have been proven effective by actual production from projects in the same reservoir or an analogous reservoir or by other evidence using reliable technology that establishes reasonable certainty. Reliable technology is a grouping of one or more technologies (including computational methods) that have been field tested and have been demonstrated to provide reasonably certain results with consistency and repeatability in the formation being evaluated or in an analogous formation. To establish reasonable certainty with respect to our estimated proved reserves, the
95
Table of Contents
technologies and economic data used in the estimation of our proved reserves have been demonstrated to yield results with consistency and repeatability, and include production and well test data, downhole completion information, geologic data, electrical logs, radioactivity logs, core analyses, available seismic data and historical well cost and operating expense data.
Summary of Oil and Natural Gas Reserves. The following table presents our estimated net proved oil and natural gas reserves as of December 31, 2015 and 2014, based on the proved reserve report as of such dates by NSAI, our independent petroleum engineer, prepared in accordance with the rules and regulations of the SEC. A copy of the proved reserve report as of December 31, 2015 prepared by NSAI with respect to our properties is included as an exhibit to the registration statement of which this prospectus forms a part. All of our proved reserves are located in the United States.
| December 31, 2015(1) |
December 31, 2014(2) |
|||||||
| Proved developed reserves: |
||||||||
| Oil (MBbls) |
9,347 | 8,026 | ||||||
| Natural gas (MMcf) |
12,711 | 11,959 | ||||||
| NGLs (MBbls) |
1,603 | 766 | ||||||
|
|
|
|
|
|||||
| Total (MBoe) |
13,068 | 10,786 | ||||||
| Proved undeveloped reserves: |
||||||||
| Oil (MBbls) |
13,852 | 11,823 | ||||||
| Natural gas (MMcf) |
19,731 | 15,455 | ||||||
| NGLs (MBbls) |
2,248 | 785 | ||||||
|
|
|
|
|
|||||
| Total (MBoe) |
19,389 | 15,184 | ||||||
| Total proved reserves: |
||||||||
| Oil (MBbls) |
23,199 | 19,850 | ||||||
| Natural gas (MMcf) |
32,442 | 27,414 | ||||||
| NGLs (MBbls) |
3,851 | 1,551 | ||||||
|
|
|
|
|
|||||
| Total (MBoe) |
32,457 | 25,970 | ||||||
| Oil and Natural Gas Prices: |
||||||||
| Oil—WTI posted price per Bbl |
$ | 46.79 | $ | 91.48 | ||||
| Natural gas—Henry Hub spot price per MMBtu |
$ | 2.59 | $ | 4.35 | ||||
| (1) | Our estimated net proved reserves were determined using average first-day-of-the-month prices for the prior 12 months in accordance with SEC guidance. For oil and NGL volumes, the average West Texas Intermediate posted price of $46.79 per barrel as of December 31, 2015 was adjusted for quality, transportation fees and a regional price differential. For gas volumes, the average Henry Hub spot price of $2.59 per MMBtu as of December 31, 2015 was adjusted for energy content, transportation fees and a regional price differential. All prices are held constant throughout the lives of the properties. The average adjusted product prices weighted by production over the remaining lives of the properties are $41.85 per barrel of oil, $13.94 per barrel of NGL and $1.71 per Mcf of gas as of December 31, 2015. |
| (2) | Our estimated net proved reserves were determined using average first-day-of-the-month prices for the prior twelve months in accordance with SEC guidance. For oil and NGL volumes, the average West Texas Intermediate posted price of $91.48 per barrel as of December 31, 2014 was adjusted for quality, transportation fees and a regional price differential. For gas volumes, the average Henry Hub spot price of $4.35 per MMBtu as of December 31, 2014 was adjusted for energy content, transportation fees and a regional price differential. All prices are held constant throughout the lives of the properties. The average adjusted product prices weighted by production over the remaining lives of the properties are $84.94 per barrel of oil, $22.70 per barrel of NGL and $4.70 per Mcf of gas as of December 31, 2014. |
96
Table of Contents
The changes from December 31, 2014 estimated proved reserves to December 31, 2015 estimated proved reserves reflect the addition of 12,864 MBoe of proved reserves through extensions and 1,275 MBoe of acquired proved reserves, offset by net negative revisions of 4,981 MBoe primarily due to the decline in commodity prices.
Reserve engineering is and must be recognized as a subjective process of estimating volumes of economically recoverable oil and natural gas that cannot be measured in an exact manner. The accuracy of any reserve estimate is a function of the quality of available data and of engineering and geological interpretation. As a result, the estimates of different engineers often vary. In addition, the results of drilling, testing and production may justify revisions of such estimates. Accordingly, reserve estimates often differ from the quantities of oil and natural gas that are ultimately recovered. Estimates of economically recoverable oil and natural gas and of future net revenues are based on a number of variables and assumptions, all of which may vary from actual results, including geologic interpretation, prices and future production rates and costs. Please read “Risk Factors” appearing elsewhere in this prospectus.
Additional information regarding our proved reserves can be found in the notes to our financial statements included elsewhere in this prospectus and the proved reserve report as of December 31, 2015, which is included as an exhibit to the registration statement of which this prospectus forms a part.
PUDs
Year Ended December 31, 2015
As of December 31, 2015, our PUDs totaled 13,852 MBbls of oil, 19,731 MMcf of natural gas and 2,248 MBbls of NGLs, for a total of 19,389 MBoe. PUDs will be converted from undeveloped to developed as the applicable wells begin production.
Changes in PUDs that occurred during 2015 were primarily due to (i) negative revisions of 4,648 MBoe primarily related to the conversion of PUDs to unproved reserves of approximately 6,794 MBoe due to the decline in commodity prices, partially offset by a positive revision in performance; (ii) an increase of approximately 9,605 MBoe attributable to extensions resulting from strategic drilling of wells by us to delineate our acreage position; (iii) the conversion of approximately 1,020 MBoe attributable to PUDs into proved developed reserves; and (iv) the acquisition of 268 MBoe of PUDs.
During the twelve months ended December 31, 2015, we spent $17.7 million to convert PUDs to proved developed reserves.
All of our PUD drilling locations are scheduled to be drilled within five years of their initial booking. As of December 31, 2015, none of our total proved reserves were classified as PDNP.
Year Ended December 31, 2014
As of December 31, 2014, our PUDs totaled 11,823 MBbls of oil, 15,455 MMcf of natural gas and 785 MBbls of NGLs, for a total of 15,184 MBoe. PUDs will be converted from undeveloped to developed as the applicable wells begin production.
Changes in PUDs that occurred during 2014 were primarily due to (i) a decrease of approximately 10,806 MBoe related to the CO2 Project Disposition in May 2014 and 296 MBoe related to the Marston Disposition in December 2014; (ii) additions of approximately 13,618 MBoe attributable to extensions resulting from strategic drilling of wells by us to delineate our acreage position; and (iii) the conversion of approximately 318 MBoe attributable to PUDs into proved developed reserves.
97
Table of Contents
During the twelve months ended December 31, 2014, we spent $10.6 million to convert PUDs to proved developed reserves.
All of our PUD drilling locations are scheduled to be drilled within five years of their initial booking. As of December 31, 2014, 0.2% of our total proved reserves were classified as PDNP.
Oil and Natural Gas Production Prices and Costs
Production and Price History
The following table sets forth information regarding net production of oil, natural gas and NGLs, and certain price and cost information for each of the periods indicated:
| Our Predecessor | ||||||||||||||||
| Three Months Ended March 31, |
Year Ended December 31, |
|||||||||||||||
| 2016 | 2015 | 2015 | 2014 | |||||||||||||
| (In thousands) | ||||||||||||||||
| Production data: |
||||||||||||||||
| Oil (MBbls) |
470 | 499 | 1,830 | 1,428 | ||||||||||||
| Natural gas (MMcf) |
698 | 705 | 3,058 | 2,112 | ||||||||||||
| NGLs (MMBbls) |
70 | 81 | 331 | 235 | ||||||||||||
|
|
|
|
|
|
|
|
|
|||||||||
| Total (MBoe)(1) |
656 | 698 | 2,671 | 2,015 | ||||||||||||
| Average realized prices before effects of hedges: |
||||||||||||||||
| Oil (per Bbl) |
$ | 28.14 | $ | 42.22 | $ | 42.43 | $ | 80.50 | ||||||||
| Natural gas (per Mcf) |
1.88 | 2.78 | 2.60 | 4.58 | ||||||||||||
| NGLs (per Bbl) |
8.31 | 17.12 | 14.66 | 30.64 | ||||||||||||
|
|
|
|
|
|
|
|
|
|||||||||
| Total (per Boe) |
$ | 23.05 | $ | 34.98 | $ | 33.87 | $ | 65.42 | ||||||||
| Average realized prices after effects of hedges: |
||||||||||||||||
| Oil (per Bbl) |
$ | 46.50 | $ | 60.95 | $ | 61.61 | $ | 83.73 | ||||||||
| Natural gas (per Mcf) |
1.88 | 3.33 | 3.04 | 4.58 | ||||||||||||
| NGLs (per Bbl) |
8.31 | 17.12 | 14.66 | 30.64 | ||||||||||||
|
|
|
|
|
|
|
|
|
|||||||||
| Total (per Boe) |
$ | 36.20 | $ | 48.92 | $ | 47.51 | $ | 67.71 | ||||||||
| Average costs (per Boe): |
||||||||||||||||
| Lease operating expenses |
$ | 6.16 | $ | 9.31 | $ | 7.93 | $ | 8.78 | ||||||||
| Severance and ad valorem taxes |
1.29 | 1.71 | 1.88 | 3.41 | ||||||||||||
| Transportation, processing, gathering and other operating expenses |
1.72 | 1.84 | 2.15 | 2.37 | ||||||||||||
| Depreciation, depletion, amortization and accretion of asset retirement obligations |
32.47 | 33.28 | 33.73 | 34.30 | ||||||||||||
| Abandonment expense and impairment of unproved properties |
— | — | 2.85 | 9.94 | ||||||||||||
| Exploration |
— | — | 0.03 | — | ||||||||||||
| Contract termination and rig stacking |
— | 2.21 | 0.89 | — | ||||||||||||
| General and administrative expenses(2) |
3.87 | 4.17 | 5.32 | 15.73 | ||||||||||||
|
|
|
|
|
|
|
|
|
|||||||||
| Total |
$ | 45.51 | $ | 52.52 | $ | 54.78 | $ | 74.53 | ||||||||
|
|
|
|
|
|
|
|
|
|||||||||
| (1) | May not sum or recalculate due to rounding. |
| (2) | General and administrative expenses do not include additional expenses we would have to incur as a result of being a public company. |
98
Table of Contents
Productive Wells
As of March 31, 2016, we owned an approximate 59% average working interest in 140 gross (82 net) productive wells. Our wells are oil wells that produce associated liquids-rich natural gas. Productive wells consist of producing wells, wells capable of production and wells awaiting connection to production facilities. Gross wells are the total number of producing wells in which we have an interest, operated and non-operated, and net wells are the sum of our fractional working interests owned in gross wells.
Developed and Undeveloped Acreage
The following table sets forth information as of March 31, 2016 relating to our leasehold acreage. Developed acreage consists of acres spaced or assigned to productive wells and does not include undrilled acreage held by production under the terms of the lease. Undeveloped acreage is defined as acres on which wells have not been drilled or completed to a point that would permit the production of commercial quantities of oil or natural gas, regardless of whether such acreage contains proved reserves.
| Developed Acreage |
Undeveloped Acreage |
Total Acreage | ||||||||
| Gross(1) |
Net(2) |
Gross(1) |
Net(2) |
Gross(1) |
Net(2) | |||||
| 7,700 |
5,800 | 79,000 | 34,900 | 86,700 | 40,700 | |||||
| (1) | A gross acre is an acre in which a working interest is owned. The number of gross acres is the total number of acres in which a working interest is owned. |
| (2) | A net acre is deemed to exist when the sum of the fractional ownership working interests in gross acres equals one. The number of net acres is the sum of the fractional working interests owned in gross acres expressed as whole numbers and fractions thereof. |
Many of the leases comprising the undeveloped acreage set forth in the table above will expire at the end of their respective primary terms unless production from the leasehold acreage has been established prior to such date, in which event the lease will remain in effect until the cessation of production. Substantially all of the leases governing our acreage have continuous development clauses that permit us to continue to hold the acreage under such leases after the expiration of the primary term if we initiate additional development within 60 to 180 days after the completion of the last well drilled on such lease, without the requirement of a lease extension payment. Thereafter, the lease is held with additional development every 60 to 180 days until the entire lease is held by production. None of our horizontal drilling locations associated with proved undeveloped reserves are scheduled for drilling outside of a lease term that is not accounted for with a continuous development schedule. The following table sets forth the gross and net undeveloped acreage, as of March 31, 2016, that will expire over the next five years unless production is established within the spacing units covering the acreage or the lease is renewed or extended under continuous drilling provisions prior to the primary term expiration dates.
| Remaining 2016 |
2017 |
2018 |
2019 |
2020 | ||||||||||||||
| Gross |
Net |
Gross |
Net |
Gross |
Net |
Gross |
Net |
Gross |
Net | |||||||||
| 11,600 |
5,500 | 6,600 | 3,100 | 11,300 | 5,300 | 1,100 | 500 | 0 | 0 | |||||||||
99
Table of Contents
Drilling Results
The following table sets forth the results of our drilling activity, as defined by wells having been placed on production, for the periods indicated. The information should not be considered indicative of future performance, nor should it be assumed that there is necessarily any correlation among the number of productive wells drilled, quantities of reserves found or economic value. Productive wells are those that produce, or are capable of producing, commercial quantities of hydrocarbons, regardless of whether they produce a reasonable rate of return. Dry wells are those that prove to be incapable of producing hydrocarbons in sufficient quantities to justify completion.
| For the Three Months Ended March 31, |
For the Year Ended December 31, |
|||||||||||||||||||||||||||||||
| 2016 | 2015 | 2015 | 2014 | |||||||||||||||||||||||||||||
| Gross | Net | Gross | Net | Gross | Net | Gross | Net | |||||||||||||||||||||||||
| Exploratory Wells: |
||||||||||||||||||||||||||||||||
| Productive(1) |
— | — | — | — | — | — | — | — | ||||||||||||||||||||||||
| Dry |
— | — | — | — | — | — | — | — | ||||||||||||||||||||||||
|
|
|
|
|
|
|
|
|
|
|
|
|
|
|
|
|
|||||||||||||||||
| Total Exploratory |
— | — | — | — | — | — | — | — | ||||||||||||||||||||||||
|
|
|
|
|
|
|
|
|
|
|
|
|
|
|
|
|
|||||||||||||||||
| Development Wells: |
||||||||||||||||||||||||||||||||
| Productive(1) |
2.0 | 1.0 | 3.0 | 2.7 | 16.0 | 12.4 | 36.0 | 26.8 | ||||||||||||||||||||||||
| Dry |
— | — | — | — | — | — | — | — | ||||||||||||||||||||||||
|
|
|
|
|
|
|
|
|
|
|
|
|
|
|
|
|
|||||||||||||||||
| Total Development |
2.0 | 1.0 | 3.0 | 2.7 | 16.0 | 12.4 | 36.0 | 26.8 | ||||||||||||||||||||||||
|
|
|
|
|
|
|
|
|
|
|
|
|
|
|
|
|
|||||||||||||||||
| Total Wells: |
||||||||||||||||||||||||||||||||
| Productive(1) |
2.0 | 1.0 | 3.0 | 2.7 | 16.0 | 12.4 | 36.0 | 26.8 | ||||||||||||||||||||||||
| Dry |
— | — | — | — | — | — | — | — | ||||||||||||||||||||||||
|
|
|
|
|
|
|
|
|
|
|
|
|
|
|
|
|
|||||||||||||||||
| Total |
2.0 | 1.0 | 3.0 | 2.7 | 16.0 | 12.4 | 36.0 | 26.8 | ||||||||||||||||||||||||
|
|
|
|
|
|
|
|
|
|
|
|
|
|
|
|
|
|||||||||||||||||
| (1) | Although a well may be classified as productive upon completion, future changes in oil and natural gas prices, operating costs and production may result in the well becoming uneconomical, particularly exploratory wells where there is no production history. |
Operations
General
We are the operator of approximately 83% of our net acreage. As operator, we design and manage the development of a well and supervise operation and maintenance activities on a day-to-day basis. Independent contractors engaged by us provide all the equipment and personnel associated with these activities. We employ petroleum engineers, geologists and land professionals who work to improve production rates, increase reserves and lower the cost of operating our oil and natural gas properties.
Marketing and Customers
We market the majority of our production from properties we operate for both our account and the account of the other working interest owners in these properties. We sell our oil, natural gas and NGL production to purchasers at market prices. We sell all of our natural gas and NGLs under contracts with terms of greater than twelve months and all of our oil under contracts with terms of twelve months or less.
We normally sell production to a relatively small number of customers, as is customary in our business. For the years ended December 31, 2015 and 2014, Plains Marketing, L.P. accounted for 64% and 78%, respectively, of our total revenue. During such years, no other purchaser accounted for 10% or more of our revenue. The loss
100
Table of Contents
of Plains Marketing, L.P. as a purchaser could materially and adversely affect our revenues in the short-term. However, based on the current demand for oil and natural gas and the availability of other purchasers, we believe that the loss of Plains Marketing, L.P. as a purchaser would not have a material adverse effect on our financial condition and results of operations because crude oil and natural gas are fungible products with well-established markets and numerous purchasers.
Transportation
During the initial development of our fields, we consider all gathering and delivery infrastructure options in the areas of our production. Our oil is transported from the wellhead to our tank batteries by our gathering systems. Currently, the oil is then transported by the purchaser by truck to a transportation facility. However, we expect that, beginning in the third quarter of 2016, a third-party crude gathering system will transport the majority of our oil production at a lower cost than we have experienced historically with trucking. Our natural gas is generally transported by third-party gathering lines from the wellhead to a gas processing facility. At a small number of our wells, we own natural gas pipeline facilities that connect our wells to third-party natural gas gathering systems located in the vicinity of those wells.
Competition
The oil and natural gas industry is intensely competitive, and we compete with other companies that have greater resources. Many of these companies not only explore for and produce oil and natural gas, but also carry on midstream and refining operations and market petroleum and other products on a regional, national or worldwide basis. These companies may be able to pay more for productive oil and natural gas properties and exploratory prospects or to define, evaluate, bid for and purchase a greater number of properties and prospects than our financial or human resources permit. In addition, these companies may have a greater ability to continue exploration activities during periods of low oil and natural gas market prices. Our larger or more integrated competitors may be able to absorb the burden of existing, and any changes to, federal, state and local laws and regulations more easily than we can, which would adversely affect our competitive position. Our ability to acquire additional properties and to discover reserves in the future will be dependent upon our ability to evaluate and select suitable properties and to consummate transactions in a highly competitive environment. In addition, because we have fewer financial and human resources than many companies in our industry, we may be at a disadvantage in bidding for exploratory prospects and producing oil and natural gas properties.
There is also competition between oil and natural gas producers and other industries producing energy and fuel. Furthermore, competitive conditions may be substantially affected by various forms of energy legislation and/or regulation considered from time to time by the governments of the United States and the jurisdictions in which we operate. It is not possible to predict the nature of any such legislation or regulation which may ultimately be adopted or its effects upon our future operations. Such laws and regulations may substantially increase the costs of developing oil and natural gas and may prevent or delay the commencement or continuation of a given operation. Our larger competitors may be able to absorb the burden of existing, and any changes to, federal, state and local laws and regulations more easily than we can, which would adversely affect our competitive position.
Seasonality of Business
Weather conditions affect the demand for, and prices of, oil and natural gas. Demand for oil and natural gas is typically higher in the fourth and first quarters resulting in higher prices. Due to these seasonal fluctuations, results of operations for individual quarterly periods may not be indicative of the results that may be realized on an annual basis.
Title to Properties
As is customary in the oil and natural gas industry, we initially conduct only a cursory review of the title to our properties in connection with acquisition of leasehold acreage. At such time as we determine to conduct
101
Table of Contents
drilling operations on those properties, we conduct a thorough title examination and perform curative work with respect to significant defects prior to commencement of drilling operations. To the extent title opinions or other investigations reflect title defects on those properties, we are typically responsible for curing any title defects at our expense. We generally will not commence drilling operations on a property until we have cured any material title defects on such property. We have obtained title opinions on substantially all of our producing properties and believe that we have satisfactory title to our producing properties in accordance with standards generally accepted in the oil and natural gas industry.
Prior to completing an acquisition of producing oil and natural gas leases, we perform title reviews on the most significant leases and, depending on the materiality of properties, we may obtain a title opinion, obtain an updated title review or opinion or review previously obtained title opinions. Our oil and natural gas properties are subject to customary royalty and other interests, liens for current taxes and other burdens which we believe do not materially interfere with the use of or affect our carrying value of the properties.
We believe that we have satisfactory title to all of our material assets. Although title to these properties is subject to encumbrances in some cases, such as customary interests generally retained in connection with the acquisition of real property, customary royalty interests and contract terms and restrictions, liens under operating agreements, liens related to environmental liabilities associated with historical operations, liens for current taxes and other burdens, easements, restrictions and minor encumbrances customary in the oil and natural gas industry, we believe that none of these liens, restrictions, easements, burdens and encumbrances will materially detract from the value of these properties or from our interest in these properties or materially interfere with our use of these properties in the operation of our business. In addition, we believe that we have obtained sufficient rights-of-way grants and permits from public authorities and private parties for us to operate our business in all material respects as described in this prospectus.
Oil and Natural Gas Leases
The typical oil and natural gas lease agreement covering our properties provides for the payment of royalties to the mineral owner for all oil and natural gas produced from any wells drilled on the leased premises. The lessor royalties and other leasehold burdens on our properties generally range from 20% to 25%, resulting in a net revenue interest to us generally ranging from 75% to 80%.
Regulation of the Oil and Natural Gas Industry
Our operations are substantially affected by federal, state and local laws and regulations. In particular, natural gas production and related operations are, or have been, subject to price controls, taxes and numerous other laws and regulations. All of the jurisdictions in which we own or operate producing oil and natural gas properties have statutory provisions regulating the development and production of oil and natural gas, including provisions related to permits for the drilling of wells, bonding requirements to drill or operate wells, the location of wells, the method of drilling and casing wells, the surface use and restoration of properties upon which wells are drilled, sourcing and disposal of water used in the drilling and completion process, and the abandonment of wells. Our operations are also subject to various conservation laws and regulations. These include the regulation of the size of drilling and spacing units or proration units, the number of wells which may be drilled in an area, and the unitization or pooling of crude oil or natural gas wells, as well as regulations that generally prohibit the venting or flaring of natural gas, and impose certain requirements regarding the ratability or fair apportionment of production from fields and individual wells.
Failure to comply with applicable laws and regulations can result in substantial penalties. The regulatory burden on the industry increases the cost of doing business and affects profitability. Although we believe we are in substantial compliance with all applicable laws and regulations, such laws and regulations are frequently amended or reinterpreted. Therefore, we are unable to predict the future costs or impact of compliance. Additional proposals and proceedings that affect the oil and natural gas industry are regularly considered by Congress, the states, FERC and the courts. We cannot predict when or whether any such proposals may become effective.
102
Table of Contents
We believe we are in substantial compliance with currently applicable laws and regulations and that continued substantial compliance with existing requirements will not have a material adverse effect on our financial position, cash flows or results of operations. However, current regulatory requirements may change, currently unforeseen environmental incidents may occur or past non-compliance with environmental laws or regulations may be discovered.
Regulation of Production of Oil and Natural Gas
The production of oil and natural gas is subject to regulation under a wide range of local, state and federal statutes, rules, orders and regulations. Federal, state and local statutes and regulations require permits for drilling operations, drilling bonds and reports concerning operations. We own interests in properties located in Texas, which regulates drilling and operating activities by, among other things, requiring permits for the drilling of wells, maintaining bonding requirements in order to drill or operate wells, and regulating the location of wells, the method of drilling and casing wells, the surface use and restoration of properties upon which wells are drilled and the plugging and abandonment of wells. The laws of Texas also govern a number of conservation matters, including provisions for the unitization or pooling of oil and natural gas properties, the establishment of maximum allowable rates of production from oil and natural gas wells, the regulation of well spacing or density, and plugging and abandonment of wells. The effect of these regulations is to limit the amount of oil and natural gas that we can produce from our wells and to limit the number of wells or the locations at which we can drill, although we can apply for exceptions to such regulations or to have reductions in well spacing or density. Moreover, Texas imposes a production or severance tax with respect to the production and sale of oil, natural gas and NGLs within its jurisdiction.
The failure to comply with these rules and regulations can result in substantial penalties. Our competitors in the oil and natural gas industry are subject to the same regulatory requirements and restrictions that affect our operations.
Regulation of Sales and Transportation of Oil
Sales of oil, condensate and NGLs are not currently regulated and are made at negotiated prices. Nevertheless, Congress could reenact price controls in the future.
Our sales of oil are affected by the availability, terms and cost of transportation. The transportation of oil in common carrier pipelines is also subject to rate and access regulation. FERC regulates interstate oil pipeline transportation rates under the Interstate Commerce Act. In general, interstate oil pipeline rates must be cost-based, although settlement rates agreed to by all shippers are permitted and market-based rates may be permitted in certain circumstances.
Intrastate oil pipeline transportation rates are subject to regulation by state regulatory commissions. The basis for intrastate oil pipeline regulation, and the degree of regulatory oversight and scrutiny given to intrastate oil pipeline rates, varies from state to state. Insofar as effective interstate and intrastate rates and regulations regarding access are equally applicable to all comparable shippers, we believe that the regulation of oil transportation will not affect our operations in any way that is of material difference from those of our competitors who are similarly situated.
Regulation of Transportation and Sales of Natural Gas
Historically, the transportation and sale for resale of natural gas in interstate commerce have been regulated by agencies of the U.S. federal government, primarily FERC. In the past, the federal government has regulated the prices at which natural gas could be sold. While sales by producers of natural gas can currently be made at uncontrolled market prices, Congress could reenact price controls in the future. Deregulation of wellhead natural gas sales began with the enactment of the NGPA, and culminated in adoption of the Natural Gas Wellhead Decontrol Act which removed controls affecting wellhead sales of natural gas effective January 1, 1993. The
103
Table of Contents
transportation and sale for resale of natural gas in interstate commerce is regulated primarily under the NGA, and by regulations and orders promulgated under the NGA by FERC. In certain limited circumstances, intrastate transportation and wholesale sales of natural gas may also be affected directly or indirectly by laws enacted by Congress and by FERC regulations.
The EP Act of 2005 is a comprehensive compilation of tax incentives, authorized appropriations for grants and guaranteed loans, and significant changes to the statutory policy that affects all segments of the energy industry. Among other matters, the EP Act of 2005 amends the NGA to add an anti-market manipulation provision which makes it unlawful for any entity to engage in prohibited behavior to be prescribed by FERC, and furthermore provides FERC with additional civil penalty authority. The EP Act of 2005 provides FERC with the power to assess civil penalties of up to $1,000,000 per day for violations of the NGA and increases FERC’s civil penalty authority under the NGPA from $5,000 per violation per day to $1,000,000 per violation per day. The civil penalty provisions are applicable to entities that engage in the sale of natural gas for resale in interstate commerce. On January 19, 2006, FERC issued Order No. 670, a rule implementing the anti-market manipulation provision of the EP Act of 2005, and subsequently denied rehearing. The rules make it unlawful to: (i) in connection with the purchase or sale of natural gas subject to the jurisdiction of FERC, or the purchase or sale of transportation services subject to the jurisdiction of FERC, for any entity, directly or indirectly, use or employ any device, scheme or artifice to defraud; (ii) make any untrue statement of material fact or omit to make any such statement necessary to make the statements made not misleading; or (iii) engage in any act or practice that operates as a fraud or deceit upon any person. The new anti-market manipulation rule does not apply to activities that relate only to intrastate or other non-jurisdictional sales or gathering, but does apply to activities of gas pipelines and storage companies that provide interstate services, as well as otherwise non-jurisdictional entities to the extent the activities are conducted “in connection with” gas sales, purchases or transportation subject to FERC jurisdiction, which now includes the annual reporting requirements under Order 704, described below. The anti-market manipulation rule and enhanced civil penalty authority reflect an expansion of FERC’s NGA enforcement authority.
On December 26, 2007, FERC issued Order 704, a final rule on the annual natural gas transaction reporting requirements, as amended by subsequent orders on rehearing. Under Order 704, wholesale buyers and sellers of more than 2.2 million MMBtus of physical natural gas in the previous calendar year, including natural gas producers, gatherers and marketers, are now required to report, on May 1 of each year, aggregate volumes of natural gas purchased or sold at wholesale in the prior calendar year to the extent such transactions utilize, contribute to, or may contribute to the formation of price indices. It is the responsibility of the reporting entity to determine which individual transactions should be reported based on the guidance of Order 704. Order 704 also requires market participants to indicate whether they report prices to any index publishers, and if so, whether their reporting complies with FERC’s policy statement on price reporting.
Gathering service, which occurs upstream of jurisdictional transmission services, is regulated by the states onshore and in state waters. Section 1(b) of the NGA exempts natural gas gathering facilities from regulation by FERC as a natural gas company under the NGA. Although FERC has set forth a general test for determining whether facilities perform a non-jurisdictional gathering function or a jurisdictional transmission function, FERC’s determinations as to the classification of facilities are done on a case-by-case basis. To the extent that FERC issues an order that reclassifies certain jurisdictional transmission facilities as non-jurisdictional gathering facilities, and depending on the scope of that decision, our costs of getting gas to point of sale locations may increase. We believe that the natural gas pipelines in our gathering systems meet the traditional tests FERC has used to establish a pipeline’s status as a gatherer not subject to regulation as a natural gas company. However, the distinction between FERC-regulated transmission services and federally unregulated gathering services is the subject of ongoing litigation, so the classification and regulation of our gathering facilities are subject to change based on future determinations by FERC, the courts or Congress. State regulation of natural gas gathering facilities generally includes various occupational safety, environmental and, in some circumstances, nondiscriminatory-take requirements. Although such regulation has not generally been affirmatively applied by state agencies, natural gas gathering may receive greater regulatory scrutiny in the future.
104
Table of Contents
The price at which we sell natural gas is not currently subject to federal rate regulation and, for the most part, is not subject to state regulation. However, with regard to our physical sales of these energy commodities, we are required to observe anti-market manipulation laws and related regulations enforced by FERC under the EP Act of 2005 and under the Commodity Exchange Act (“CEA”), and regulations promulgated thereunder by the CFTC. The CEA prohibits any person from manipulating or attempting to manipulate the price of any commodity in interstate commerce or futures on such commodity. The CEA also prohibits knowingly delivering or causing to be delivered false or misleading or knowingly inaccurate reports concerning market information or conditions that affect or tend to affect the price of a commodity. Should we violate the anti-market manipulation laws and regulations, we could also be subject to related third-party damage claims by, among others, sellers, royalty owners and taxing authorities.
Intrastate natural gas transportation is also subject to regulation by state regulatory agencies. The basis for intrastate regulation of natural gas transportation and the degree of regulatory oversight and scrutiny given to intrastate natural gas pipeline rates and services varies from state to state. Insofar as such regulation within a particular state will generally affect all intrastate natural gas shippers within the state on a comparable basis, we believe that the regulation of similarly situated intrastate natural gas transportation in any states in which we operate and ship natural gas on an intrastate basis will not affect our operations in any way that is of material difference from those of our competitors. Like the regulation of interstate transportation rates, the regulation of intrastate transportation rates affects the marketing of natural gas that we produce, as well as the revenues we receive for sales of our natural gas.
Changes in law and to FERC or state policies and regulations may adversely affect the availability and reliability of firm and/or interruptible transportation service on interstate and intrastate pipelines, and we cannot predict what future action FERC or state regulatory bodies will take. We do not believe, however, that any regulatory changes will affect us in a way that materially differs from the way they will affect other natural gas producers and marketers with which we compete.
Regulation of Environmental and Occupational Safety and Health Matters
Our oil and natural gas development operations are subject to numerous stringent federal, regional, state and local statutes and regulations governing occupational safety and health, the discharge of materials into the environment or otherwise relating to environmental protection, some of which carry substantial administrative, civil and criminal penalties for failure to comply. These laws and regulations may require the acquisition of a permit before drilling or other regulated activity commences; restrict the types, quantities and concentrations of various substances that can be released into the environment in connection with drilling, production and transporting through pipelines; govern the sourcing and disposal of water used in the drilling and completion process; limit or prohibit drilling activities in certain areas and on certain lands lying within wilderness, wetlands, frontier and other protected areas; require some form of remedial action to prevent or mitigate pollution from former operations such as plugging abandoned wells or closing earthen pits; establish specific safety and health criteria addressing worker protection; and impose substantial liabilities for pollution resulting from operations or failure to comply with regulatory filings. In addition, these laws and regulations may restrict the rate of production.
The following is a summary of the more significant existing environmental and occupational health and safety laws and regulations, as amended from time to time, to which our business operations are subject and for which compliance may have a material adverse impact on our capital expenditures, results of operations or financial position.
Hazardous Substances and Waste Handling
The Comprehensive Environmental Response, Compensation, and Liability Act of 1980 (“CERCLA”), also known as the “Superfund” law, and comparable state laws impose liability, without regard to fault or the legality
105
Table of Contents
of the original conduct, on certain classes of persons that are considered to have contributed to the release of a “hazardous substance” into the environment. These persons include the current and past owner or operator of the disposal site or the site where the release occurred and companies that disposed or arranged for the disposal of the hazardous substances at the site where the release occurred. Under CERCLA, such persons may be subject to joint and several strict liability for the costs of cleaning up the hazardous substances that have been released into the environment and for damages to natural resources, and it is not uncommon for neighboring landowners and other third parties to file claims for personal injury and property damage allegedly caused by the hazardous substances released into the environment. We are able to control directly the operation of only those wells with respect to which we act as operator. Notwithstanding our lack of direct control over wells operated by others, the failure of an operator other than us to comply with applicable environmental regulations may, in certain circumstances, be attributed to us. We generate materials in the course of our operations that may be regulated as hazardous substances but we are unaware of any liabilities for which we may be held responsible that would materially and adversely affect us.
The Resource Conservation and Recovery Act (“RCRA”) and analogous state laws, impose detailed requirements for the generation, handling, storage, treatment and disposal of nonhazardous and hazardous solid wastes. RCRA specifically excludes drilling fluids, produced waters and other wastes associated with the development or production of crude oil, natural gas or geothermal energy from regulation as hazardous wastes. However, these wastes may be regulated by the EPA or state agencies under RCRA’s less stringent nonhazardous solid waste provisions, state laws or other federal laws. Moreover, it is possible that these particular oil and natural gas development and production wastes now classified as nonhazardous solid wastes could be classified as hazardous wastes in the future. For example, from time to time various environmental groups have challenged the EPA’s exemption of certain oil and gas wastes from RCRA. A loss of the RCRA exclusion for drilling fluids, produced waters and related wastes could result in an increase in our costs to manage and dispose of generated wastes, which could have a material adverse effect on our results of operations and financial position. In addition, in the course of our operations, we generate some amounts of ordinary industrial wastes, such as paint wastes, waste solvents, laboratory wastes and waste compressor oils that may be regulated as hazardous wastes if such wastes have hazardous characteristics. Although the costs of managing hazardous waste may be significant, we do not believe that our costs in this regard are materially more burdensome than those for similarly situated companies.
We currently own, lease or operate numerous properties that have been used for oil and natural gas development and production activities for many years. Although we believe that we have utilized operating and waste disposal practices that were standard in the industry at the time, hazardous substances, wastes or petroleum hydrocarbons may have been released on, under or from the properties owned or leased by us, or on, under or from other locations, including off-site locations, where such substances have been taken for recycling or disposal. In addition, some of our properties have been operated by third parties or by previous owners or operators whose treatment and disposal of hazardous substances, wastes or petroleum hydrocarbons was not under our control. These properties and the substances disposed or released on, under or from them may be subject to CERCLA, RCRA and analogous state laws. Under such laws, we could be required to undertake response or corrective measures, which could include removal of previously disposed substances and wastes, cleanup of contaminated property or performance of remedial plugging or pit closure operations to prevent future contamination.
Water Discharges
The Clean Water Act and comparable state laws impose restrictions and strict controls regarding the discharge of pollutants, including produced waters and other oil and natural gas wastes, into or near navigable waters. The discharge of pollutants into regulated waters is prohibited, except in accordance with the terms of a permit issued by the EPA or the state. The discharge of dredge and fill material in regulated waters, including wetlands, is also prohibited, unless authorized by a permit issued by the U.S. Army Corps of Engineers (the “Corps”). In September 2015, the EPA and the Corps issued new rules defining the scope of the EPA’s and the
106
Table of Contents
Corps’ jurisdiction under the Clean Water Act with respect to certain types of waterbodies and classifying these waterbodies as regulated wetlands. To the extent the rule expands the scope of the Clean Water Act’s jurisdiction, we could face increased costs and delays with respect to obtaining permits for dredge and fill activities in wetland areas. The rule has been challenged in court on the grounds that it unlawfully expands the reach of the Clean Water Act, and implementation of the rule has been stayed pending resolution of the court challenge. Obtaining permits has the potential to delay the development of oil and natural gas projects. These laws and any implementing regulations provide for administrative, civil and criminal penalties for any unauthorized discharges of oil and other substances in reportable quantities and may impose substantial potential liability for the costs of removal, remediation and damages.
Pursuant to these laws and regulations, we may be required to obtain and maintain approvals or permits for the discharge of wastewater or storm water and are required to develop and implement spill prevention, control and countermeasure plans, also referred to as “SPCC plans,” in connection with on-site storage of significant quantities of oil. We believe that we maintain all required discharge permits necessary to conduct our operations, and further believe we are in substantial compliance with the terms thereof. We are currently undertaking a review of recently acquired oil properties to determine the need for new or updated SPCC plans and, where necessary, we will be developing or upgrading such plans implementing the physical and operation controls imposed by these plans, the costs of which are not expected to be substantial.
The primary federal law related specifically to oil spill liability is the Oil Pollution Act of 1990 (“OPA”), which amends and augments the oil spill provisions of the Clean Water Act and imposes certain duties and liabilities on certain “responsible parties” related to the prevention of oil spills and damages resulting from such spills in or threatening waters of the United States or adjoining shorelines. For example, operators of certain oil and natural gas facilities must develop, implement and maintain facility response plans, conduct annual spill training for certain employees and provide varying degrees of financial assurance. Owners or operators of a facility, vessel or pipeline that is a source of an oil discharge or that poses the substantial threat of discharge is one type of “responsible party” who is liable. The OPA applies joint and several liability, without regard to fault, to each liable party for oil removal costs and a variety of public and private damages. Although defenses exist, they are limited. As such, a violation of the OPA has the potential to adversely affect our operations.
Air Emissions
The federal Clean Air Act and comparable state laws restrict the emission of air pollutants from many sources, such as, for example, compressor stations, through air emissions standards, construction and operating permitting programs and the imposition of other compliance requirements. These laws and regulations may require us to obtain pre-approval for the construction or modification of certain projects or facilities expected to produce or significantly increase air emissions, obtain and strictly comply with stringent air permit requirements or utilize specific equipment or technologies to control emissions of certain pollutants. Over the next several years, we may be required to incur certain capital expenditures for air pollution control equipment or other air emissions related issues. For example, in October 2015, the EPA lowered the National Ambient Air Quality Standard (“NAAQS”) for ozone from 75 to 70 parts per billion. State implementation of the revised NAAQS could result in stricter permitting requirements, delay or prohibit our ability to obtain such permits, and result in increased expenditures for pollution control equipment, the costs of which could be significant. In addition, the EPA has adopted new rules under the Clean Air Act that require the reduction of volatile organic compound emissions from certain fractured and refractured natural gas wells for which well completion operations are conducted and further require that most wells use reduced emission completions, also known as “green completions.” These regulations also establish specific new requirements regarding emissions from production-related wet seal and reciprocating compressors, and from pneumatic controllers and storage vessels. More recently, in May 2016, the EPA finalized rules regarding criteria for aggregating multiple small surface sites into a single source for air-quality permitting purposes applicable to the oil and gas industry. This rule could cause small facilities, on an aggregate basis, to be deemed a major source, thereby triggering more stringent air permitting processes and requirements. Compliance with these and other air pollution control and permitting
107
Table of Contents
requirements has the potential to delay the development of oil and natural gas projects and increase our costs of development, which costs could be significant. However, we do not believe that compliance with such requirements will have a material adverse effect on our operations.
Regulation of GHG Emissions
In response to findings that emissions of carbon dioxide, methane and other GHGs present an endangerment to public health and the environment, the EPA has adopted regulations pursuant to the federal Clean Air Act that, among other things, require preconstruction and operating permits for certain large stationary sources. Facilities required to obtain preconstruction permits for their GHG emissions are also required to meet “best available control technology” standards that are being established by the states or, in some cases, by the EPA on a case-by-case basis. These regulatory requirements could adversely affect our operations and restrict or delay our ability to obtain air permits for new or modified sources. In addition, the EPA has adopted rules requiring the monitoring and reporting of GHG emissions from specified onshore and offshore oil and natural gas production sources in the United States on an annual basis, which include certain of our operations. Furthermore, in May 2016, the EPA finalized rules that establish new controls for emissions of methane from new, modified or reconstructed sources in the oil and natural gas source category, including production, processing, transmission and storage activities. The rule includes first-time standards to address emissions of methane from equipment and processes across the source category, including hydraulically fractured oil and natural gas well completions. The EPA has also announced that it intends to impose methane emission standards for existing sources as well but, to date, has not yet issued a proposal. Compliance with these rules will require enhanced record-keeping practices, the purchase of new equipment such as optical gas imaging instruments to detect leaks, and increased frequency of maintenance and repair activities to address emissions leakage. The rules will also likely require hiring additional personnel to support these activities or the engagement of third party contractors to assist with and verify compliance. These new and proposed rules could result in increased compliance costs on our operations.
While Congress has from time to time considered legislation to reduce emissions of GHGs, there has not been significant activity in the form of adopted legislation to reduce GHG emissions at the federal level in recent years. In the absence of such federal climate legislation, a number of state and regional efforts have emerged that are aimed at tracking and/or reducing GHG emissions by means of cap and trade programs. These programs typically require major sources of GHG emissions to acquire and surrender emission allowances in return for emitting those GHGs. In addition, efforts have been made and continue to be made in the international community toward the adoption of international treaties or protocols that would address global climate change issues. Most recently in April 2016, the United States was one of 175 countries to ratify the Paris Agreement, which requires member countries to review and “represent a progression” in their intended nationally determined contributions, which set GHG emission reduction goals, every five years beginning in 2020. Although it is not possible at this time to predict how legislation or new regulations that may be adopted to address GHG emissions would impact our business, any such future laws and regulations imposing reporting obligations on, or limiting emissions of GHGs from, our equipment and operations could require us to incur costs to reduce emissions of GHGs associated with our operations. Substantial limitations on GHG emissions could adversely affect demand for the oil and natural gas we produce. Finally, it should be noted that some scientists have concluded that increasing concentrations of GHGs in the Earth’s atmosphere may produce climate changes that have significant physical effects, such as increased frequency and severity of storms, floods and other climatic events; if any such effects were to occur, they could have a material adverse effect on our operations.
Hydraulic Fracturing Activities
Hydraulic fracturing is an important and common practice that is used to stimulate production of oil and/or natural gas from dense subsurface rock formations. The hydraulic fracturing process involves the injection of water, proppants and chemicals under pressure into targeted subsurface formations to fracture the surrounding rock and stimulate production. We regularly use hydraulic fracturing as part of our operations. Hydraulic fracturing is typically regulated by state oil and natural gas commissions, but the EPA has asserted federal regulatory authority pursuant to the SDWA over certain hydraulic fracturing activities involving the use of diesel
108
Table of Contents
fuels and published permitting guidance in February 2014 addressing the performance of such activities using diesel fuels. The EPA has also issued final regulations under the federal Clean Air Act establishing performance standards, including standards for the capture of air emissions released during hydraulic fracturing, and advanced notice of proposed rulemaking under the Toxic Substances Control Act to require companies to disclose information regarding the chemicals used in hydraulic fracturing, and also finalized rules in June 2016 that prohibit the discharge of wastewater from hydraulic fracturing operations to publicly owned wastewater treatment plants. In addition, the Bureau of Land Management finalized rules in March 2015 that impose new or more stringent standards for performing hydraulic fracturing on federal and American Indian lands. The U.S. District Court of Wyoming has temporarily stayed implementation of this rule. A final decision has not yet been issued. In addition, Congress has from time to time considered legislation to provide for federal regulation of hydraulic fracturing under the SDWA and to require disclosure of the chemicals used in the hydraulic fracturing process. It is unclear how any additional federal regulation of hydraulic fracturing activities may affect our operations.
At the state level, several states have adopted or are considering legal requirements that could impose more stringent permitting, disclosure and well construction requirements on hydraulic fracturing activities. For example, in May 2013, the Railroad Commission of Texas issued a “well integrity rule,” which updates the requirements for drilling, putting pipe down and cementing wells. The rule also includes new testing and reporting requirements, such as (i) the requirement to submit cementing reports after well completion or after cessation of drilling, whichever is later, and (ii) the imposition of additional testing on wells less than 1,000 feet below usable groundwater. The well integrity rule took effect in January 2014. Local governments also may seek to adopt ordinances within their jurisdictions regulating the time, place and manner of drilling activities in general or hydraulic fracturing activities in particular. We believe that we follow applicable standard industry practices and legal requirements for groundwater protection in our hydraulic fracturing activities. Nonetheless, if new or more stringent federal, state or local legal restrictions relating to the hydraulic fracturing process are adopted in areas where we operate, we could incur potentially significant added costs to comply with such requirements, experience delays or curtailment in the pursuit of development activities, and perhaps even be precluded from drilling wells.
ESA and Migratory Birds
The Endangered Species Act (“ESA”) and (in some cases) comparable state laws were established to protect endangered and threatened species. Pursuant to the ESA, if a species is listed as threatened or endangered, restrictions may be imposed on activities adversely affecting that species’ habitat. Similar protections are offered to migratory birds under the Migratory Bird Treaty Act. We may conduct operations on oil and natural gas leases in areas where certain species that are listed as threatened or endangered are known to exist and where other species, such as the sage grouse, that potentially could be listed as threatened or endangered under the ESA may exist. The U.S. Fish and Wildlife Service may designate critical habitat and suitable habitat areas that it believes are necessary for survival of a threatened or endangered species. A critical habitat or suitable habitat designation could result in further material restrictions to federal land use and may materially delay or prohibit land access for oil and natural gas development. Moreover, as a result of a settlement approved by the U.S. District Court for the District of Columbia in September 2011, the U.S. Fish and Wildlife Service is required to make a determination on listing of more than 250 species as endangered or threatened under the ESA by no later than completion of the agency’s 2017 fiscal year. Similar protections are offered to migratory birds under the Migratory Bird Treaty Act. The federal government recently issued indictments under the Migratory Bird Treaty Act to several oil and natural gas companies after dead migratory birds were found near reserve pits associated with drilling activities. The identification or designation of previously unprotected species as threatened or endangered in areas where underlying property operations are conducted could cause us to incur increased costs arising from species protection measures or could result in limitations on our development activities that could have an adverse impact on our ability to develop and produce reserves. If we were to have a portion of our leases designated as critical or suitable habitat, it could adversely impact the value of our leases.
109
Table of Contents
OSHA
We are subject to the requirements of the Occupational Safety and Health Act (“OSHA”) and comparable state statutes whose purpose is to protect the health and safety of workers. In addition, the OSHA hazard communication standard, the Emergency Planning and Community Right-to-Know Act and comparable state statutes and any implementing regulations require that we organize and/or disclose information about hazardous materials used or produced in our operations and that this information be provided to employees, state and local governmental authorities and citizens. We believe that we are in substantial compliance with all applicable laws and regulations relating to worker health and safety.
Related Permits and Authorizations
Many environmental laws require us to obtain permits or other authorizations from state and/or federal agencies before initiating certain drilling, construction, production, operation or other oil and natural gas activities, and to maintain these permits and compliance with their requirements for on-going operations. These permits are generally subject to protest, appeal or litigation, which can in certain cases delay or halt projects and cease production or operation of wells, pipelines and other operations.
We have not experienced any material adverse effect from compliance with environmental requirements; however, there is no assurance that this will continue. We did not have any material capital or other non-recurring expenditures in connection with complying with environmental laws or environmental remediation matters in 2015, nor do we anticipate that such expenditures will be material in 2016.
Related Insurance
We maintain insurance against some risks associated with above or underground contamination that may occur as a result of our development activities. However, this insurance is limited to activities at the well site and there can be no assurance that this insurance will continue to be commercially available or that this insurance will be available at premium levels that justify its purchase by us. The occurrence of a significant event that is not fully insured or indemnified against could have a materially adverse effect on our financial condition and operations. Further, we have no coverage for gradual, long-term pollution events.
Employees
As of March 31, 2016, we had 39 full-time employees. We hire independent contractors on an as needed basis. We have no collective bargaining agreements with our employees. We believe that our employee relationships are satisfactory. Please see “Executive Compensation—Named Executive Officers” for a discussion regarding the entity that has historically employed our employees.
Legal Proceedings
We are party to lawsuits arising in the ordinary course of our business. We cannot predict the outcome of any such lawsuits with certainty, but management believes it is remote that pending or threatened legal matters will have a material adverse impact on our financial condition.
Due to the nature of our business, we are, from time to time, involved in other routine litigation or subject to disputes or claims related to our business activities, including workers’ compensation claims and employment related disputes. In the opinion of our management, none of these other pending litigation, disputes or claims against us, if decided adversely, will have a material adverse effect on our financial condition, cash flows or results of operations.
110
Table of Contents
Our executive officers are currently employees of Centennial Resource Management, LLC (“Centennial Management”), a wholly-owned subsidiary of Centennial HoldCo, and provide services to Centennial HoldCo and Centennial OpCo pursuant to management services agreements between such entities. Prior to the completion of this offering, Centennial HoldCo will contribute its interests in Centennial Management to Centennial OpCo and our executive officers will become employees of a wholly-owned subsidiary of Centennial OpCo.
The following table sets forth the names, ages and titles of our directors and executive officers.
| Name |
Age |
Position | ||||
| Ward Polzin |
53 | Chief Executive Officer and Director | ||||
| George Glyphis |
46 | Vice President and Chief Financial Officer | ||||
| Bret Siepman |
57 | Vice President, Development | ||||
| Jamie Wheat |
46 | Vice President and Chief Accounting Officer | ||||
| Chris Carter |
37 | Director | ||||
| David Hayes |
41 | Director | ||||
| Christopher Ray |
46 | Director | ||||
| Martin Sumner |
42 | Director | ||||
| Tony Weber |
53 | Director | ||||
Ward Polzin has served as our Chief Executive Officer since our formation and as a member of our board of directors since October 2014 and has served Centennial Management as Chief Executive Officer since July 2013. Immediately prior to joining Centennial Management, from February 2008 to June 2013, Mr. Polzin served as a Managing Director in Investment Banking at Tudor, Pickering, Holt & Co. Securities, Inc., where he spearheaded the firm’s E&P asset acquisition and divestiture practice since its inception in 2008. Mr. Polzin continues to serve as a senior advisor to Tudor, Pickering, Holt & Co. Securities, Inc. From 2006 to 2007, Mr. Polzin served as the U.S. Country Manager of Enerplus Resources (USA) Corporation with a focus on Bakken shale drilling in the Williston Basin of Montana. From 2003 to 2005, Mr. Polzin served in various positions at Scotia Waterous and rose to Co-Head of U.S. Acquisitions and Divestitures. He began his career with British Petroleum in Alaska where he spent seven years in various engineering and planning roles. Mr. Polzin earned his B.S. in Petroleum Engineering from Colorado School of Mines and an M.B.A. from Rice University. He is a member of the Society of Petroleum Engineers, Western Energy Alliance and the Colorado Oil & Gas Association. Mr. Polzin is also a CFA charterholder.
The board of directors believes that Mr. Polzin’s degree and experience in petroleum engineering, as well as his business expertise, bring valuable strategic, managerial and analytical skills to the board of directors and us.
George Glyphis has served as our Vice President and Chief Financial Officer since our formation and has served Centennial Management in such capacity since July 2014. Immediately, prior to joining Centennial Management, Mr. Glyphis served as a Managing Director in the Oil & Gas Investment Banking practice at J.P. Morgan where his client base comprised primarily upstream and integrated oil & gas companies. In his 21 years at J.P. Morgan, Mr. Glyphis led the origination and execution of transactions including initial public offerings, equity follow-on offerings, high yield and investment grade bond offerings, corporate mergers and acquisitions, asset acquisition and divestitures, and reserve-based and corporate lending. Mr. Glyphis earned his B.A. in History from the University of Virginia.
Bret Siepman has served as our Vice President, Development since our formation and has served Centennial Management in such capacity since August 2013. Immediately prior to joining Centennial Management, Mr. Siepman was Vice President, Business Development for Resolute Energy Corporation (“Resolute”), where he acted in various roles, including Vice President, Geology and Geophysics, for nine years with a focus on the Rockies and the Permian Basin. Mr. Siepman previously served as the Onshore North
111
Table of Contents
America Exploration Manager for Kerr-McGee Corporation, Geophysicist exploring the Rockies and California for Samedan Oil Corporation and Geologist and Geophysicist for Chevron USA. Mr. Siepman earned his B.A. in Geology at the University of California, Santa Barbara and an M.S. in Geology at Colorado School of Mines. He is a member of the American Association of Petroleum Geologists, the Society of Exploration Geophysicists and is a Registered Professional Geologist in Wyoming.
Jamie Wheat has served as our Vice President and Chief Accounting Officer since our formation and has served Centennial Management in such capacity since January 2014. Immediately prior to joining Centennial Management, Ms. Wheat served Berry Petroleum Company as the Vice President and Controller from March 2013 to December 2013, as the Controller from August 2009 to February 2013 and as the Accounting Manager from August 2008 to August 2009. Ms. Wheat also held various audit positions with KPMG from 2001 to 2008. She earned a B.S. in Accounting at the University of Colorado, Boulder, and an M.S. in Accounting at the University of Colorado, Denver. Ms. Wheat is a Certified Public Accountant and is a member of the American Institute of Certified Public Accountants and COPAS-Colorado.
Chris Carter has served as a member of our board of directors since May 2016. Mr. Carter has served Natural Gas Partners as a Managing Partner since March 2015 and previously served Natural Gas Partners in other capacities, including as a Managing Director from December 2012 to March 2015 and as a Principal from 2010 to December 2012. Prior to joining Natural Gas Partners in 2004, Mr. Carter was an analyst with Deutsche Bank’s Energy Investment Banking group in Houston, Texas, where he focused on financing and merger and acquisition transactions in the oil and gas and oilfield services industries. Since June 2015, Mr. Carter has served as a director for the general partner of PennTex Midstream Partners, LP. From October 2013 to November 2014, Mr. Carter served as a director of Rice Energy, Inc., and from April 2014 to January 2016, Mr. Carter served as a director of Parsley Energy, Inc. Mr. Carter received a B.B.A. and an M.P.A. in Accounting, summa cum laude, in 2002 from the University of Texas, where he was a member of the Business Honors Program. He received an M.B.A. in 2008 from Stanford University, where he graduated as an Arjay Miller Scholar.
The board of directors believes that Mr. Carter’s considerable financial and energy investing experience will bring important and valuable skills to the board of directors.
David Hayes has served as a member of our board of directors since November 2014. Mr. Hayes joined Natural Gas Partners in 1998 and has served as a Managing Director since 2008. He also currently serves as Director of Corporate Finance for Natural Gas Partners. Prior to joining Natural Gas Partners, Mr. Hayes was a member of Merrill Lynch’s Energy Investment Banking group in Houston, Texas, where he focused on mergers and acquisitions and financing in the exploration and production and natural gas pipeline industries. Since June 2015, Mr. Hayes has served as a director for the general partner of PennTex Midstream Partners, LP. Mr. Hayes previously served on the board of directors of the general partner of Eagle Rock Energy Partners, L.P. from June 2011 until its sale to Vanguard Natural Resources LLC in October 2015. Mr. Hayes received a B.A. in Economics, magna cum laude, in 1996 from Rice University, where he was elected to the Phi Beta Kappa scholastic honor society, and an M.B.A. in 2002 from Harvard Business School.
The board of directors believes that Mr. Hayes’s wealth of industry-specific transactional skills and experience will bring important and valuable skills to the board of directors.
Christopher Ray has served as a member of our board of directors since May 2015. Mr. Ray joined Natural Gas Partners in 2003 and has served as Senior Managing Director and Counsel since July 2012. He also currently serves on Natural Gas Partners’ Executive Committee and previously served Natural Gas Partners in other capacities, including Managing Director from 2007 to July 2012. Prior to joining Natural Gas Partners, Mr. Ray served as a partner in the law firm of Thompson & Knight, LLP. He practiced in the Corporate and Securities group in Dallas, Texas for eight years, working on investment and corporate financing transactions, including the formation and capitalization of investment funds, portfolio company investments and exits, mergers and
112
Table of Contents
acquisitions, securities law compliance and public and private debt and equity offerings. Since June 2015, Mr. Ray has served as a director for the general partner of PennTex Midstream Partners, LP. He previously served on the board of directors of the general partner of Eagle Rock Energy Partners, L.P. from June 2011 until its sale to Vanguard Natural Resources LLC in October 2015. Mr. Ray received a B.S. in Accounting with distinction in 1992 and a Juris Doctor in 1995 from the University of Virginia.
The board of directors believes that Mr. Ray’s significant financial and transactional background in the energy industry will bring important and valuable skills to the board of directors.
Martin Sumner has served as a member of our board of directors since May 2015. Mr. Sumner joined The Carlyle Group L.P. in 2003 and has served as a Managing Director focused on U.S. buyout opportunities in the industrial and transportation sectors since January 2014 and as a Principal from January 2011 to January 2014. Prior to joining The Carlyle Group L.P., Mr. Sumner held positions with Thayer Capital Partners, a private equity firm, and the strategy consulting group of Mercer Management Consulting. Since February 2013, Mr. Sumner has served as a member of the board of directors of Axalta Coating Systems Ltd., and he currently serves as the chairman of its nominating and corporate governance committee. Mr. Sumner received a B.S. in Economics, magna cum laude, from the Wharton School of the University of Pennsylvania in 1996. He received an M.B.A. in 2003 from Stanford University, where he graduated as an Arjay Miller Scholar.
The board of directors believes that Mr. Sumner’s significant financial and transactional background in the industrials industry will bring important and valuable skills to the board of directors.
Tony Weber has served as a member of our board of directors since May 2015. Mr. Weber joined Natural Gas Partners in December 2003 and has served as a Managing Partner since November 2013. He previously served Natural Gas Partners in other capacities, including Managing Director from 2007 to November 2013. Prior to joining Natural Gas Partners, Mr. Weber was the Chief Financial Officer of Merit Energy Company from April 1998 to December 2003. Prior to that, he was Senior Vice President and Manager of Union Bank of California’s Energy Division in Dallas, Texas from 1987 to 1998. Since September 2011, Mr. Weber has served as the Chairman of the Board for Memorial Resource Development Corp., and from September 2011 to March 2016, he served as a director of the general partner of Memorial Production Partners LP. Mr. Weber received a B.B.A. in Finance in 1984 from Texas A&M University.
The board of directors believes that Mr. Weber’s extensive corporate finance, banking and private equity experience will bring important and valuable skills to the board of directors.
There are no family relationships among any of our directors or executive officers.
Board Composition
Upon the closing of this offering, it is anticipated that we will have seven directors.
Our board of directors has determined that is independent under NASDAQ listing standards.
In connection with this offering, we will enter into a voting agreement with Centennial HoldCo and Celero. The voting agreement is expected to provide Centennial HoldCo with the right to designate a certain number of nominees to our board of directors so long as it and Celero and their affiliates collectively beneficially own more than 5% of the outstanding shares of our common stock.
Initially, our board of directors will consist of a single class of directors each serving one year terms. After NGP, through Centennial HoldCo and Celero, no longer beneficially owns or controls more than 50% of the voting power of our outstanding common stock, our board of directors will be divided into three classes of directors, with each class as equal in number as possible, serving staggered three-year terms, and such directors will be removable only for “cause.”
113
Table of Contents
In evaluating director candidates, we will assess whether a candidate possesses the integrity, judgment, knowledge, experience, skills and expertise that are likely to enhance the board of directors’ ability to manage and direct our affairs and business, including, when applicable, to enhance the ability of the committees of the board of directors to fulfill their duties. Our directors hold office until the earlier of their death, resignation, retirement, disqualification or removal or until their successors have been duly elected and qualified.
Status as a Controlled Company
Because NGP, through Centennial HoldCo and Celero, will collectively beneficially own a majority of our outstanding common stock following the completion of this offering, we expect to be a controlled company under the NASDAQ corporate governance standards. A controlled company need not comply with the NASDAQ corporate governance rules that require its board of directors to have a majority of independent directors and independent compensation and nominating and governance committees. Notwithstanding our status as a controlled company, we will remain subject to the NASDAQ corporate governance standard that requires us to have an audit committee composed entirely of independent directors. As a result, we must have at least one independent director on our audit committee by the date our common stock is listed on the NASDAQ, a majority of independent directors within 90 days of the listing date and all independent directors within one year of the listing date.
If at any time we cease to be a controlled company, we will take all action necessary to comply with the NASDAQ rules, including appointing a majority of independent directors to our board of directors and ensuring we have a compensation committee and a nominating and corporate governance committee, each composed entirely of independent directors, subject to a permitted “phase-in” period. We will cease to qualify as a controlled company once NGP, through Centennial HoldCo and Celero, ceases to control a majority of our voting stock.
Committees of the Board of Directors
Upon the conclusion of this offering, we intend to have an audit committee of our board of directors, and may have such other committees as the board of directors shall determine from time to time. We anticipate that each of the standing committees of the board of directors will have the composition and responsibilities described below.
In connection with this offering, we will enter into a voting agreement with Centennial HoldCo and Celero, which is expected to provide that, among other things, for so long as Centennial HoldCo and Celero and their affiliates collectively beneficially own at least 15% of the outstanding shares of our common stock, Centennial HoldCo will have the right to cause any committee of our board to include in its membership at least one director designated by Centennial HoldCo, except to the extent that such membership would violate applicable securities laws or stock exchange rules.
Audit Committee
We will establish an audit committee prior to the completion of this offering. will serve as the members of our audit committee. As required by the rules of the SEC and listing standards of the NASDAQ, the audit committee will consist solely of independent directors within one year of the listing date. SEC rules also require that a public company disclose whether or not its audit committee has an “audit committee financial expert” as a member. An “audit committee financial expert” is defined as a person who, based on his or her experience, possesses the attributes outlined in such rules. Our board of directors has determined that Mr. satisfies the definition of “audit committee financial expert.”
The audit committee will oversee, review, act on and report on various auditing and accounting matters to our board of directors, including: the selection of our independent accountants, the scope of our annual audits, fees to be paid to the independent accountants, the performance of our independent accountants and our
114
Table of Contents
accounting practices. In addition, the audit committee will oversee our compliance programs relating to legal and regulatory requirements. We expect to adopt an audit committee charter defining the committee’s primary duties in a manner consistent with the rules of the SEC and the NASDAQ.
Code of Business Conduct and Ethics
Prior to the completion of this offering, our board of directors will adopt a code of business conduct and ethics applicable to our employees, directors and officers, in accordance with applicable U.S. federal securities laws and the corporate governance rules of the NASDAQ. Any waiver of this code may be made only by our board of directors and will be promptly disclosed as required by applicable U.S. federal securities laws and the corporate governance rules of the NASDAQ.
Corporate Governance Guidelines
Prior to the completion of this offering, our board of directors will adopt corporate governance guidelines in accordance with the corporate governance rules of the NASDAQ.
115
Table of Contents
Named Executive Officers
We are currently considered an emerging growth company for purposes of the SEC’s executive compensation disclosure rules. In accordance with such rules, we are required to provide a Summary Compensation Table and an Outstanding Equity Awards at Fiscal Year End Table, as well as limited narrative disclosures regarding executive compensation for our last completed fiscal year. Further, our reporting obligations extend only to our “named executive officers,” who are those individuals serving as our principal executive officer and our two other most highly compensated executive officers who were serving as executive officers at the end of the last completed fiscal year. For fiscal year 2015, our named executive officers were:
| Name |
Principal Position | |
| Ward Polzin |
Chief Executive Officer | |
| George Glyphis |
Vice President and Chief Financial Officer | |
| Bret Siepman |
Vice President, Development |
During 2015 and to date in 2016, our executive officers have been employees of Centennial Management, a wholly-owned subsidiary of Centennial HoldCo, and provide services to Centennial HoldCo and Centennial OpCo pursuant to management services agreements between such entities. Prior to the completion of this offering, Centennial HoldCo will contribute its interests in Centennial Management to Centennial OpCo and our executive officers and the other employees providing services to us will become employees of a wholly-owned subsidiary of Centennial OpCo.
2015 Summary Compensation Table
The following table summarizes, with respect to our named executive officers, information relating to the compensation earned for services rendered in all capacities during the fiscal years ended December 31, 2015, December 31, 2014, and December 31, 2013, to the extent each such individual was a named executive officer for the applicable fiscal year.
| Name and Principal Position |
Year | Salary ($) |
Bonus ($)(1) |
Option Awards ($)(2)(3) |
All Other Compensation ($)(4) |
Total ($) |
||||||||||||||||||
| Ward Polzin, Chief Executive Officer |
2015 | $ | 250,000 | $ | 62,500 | $ | 0 | $ | 14,417 | $ | 326,917 | |||||||||||||
| 2014 | $ | 236,458 | $ | 62,500 | N/A | $ | 13,958 | $ | 312,916 | |||||||||||||||
| 2013 | $ | 89,567 | $ | 200,000 | $ | 0 | N/A | $ | 289,567 | |||||||||||||||
| George Glyphis, Vice President and |
2015 | $ | 275,000 | $ | 68,750 | $ | 0 | $ | 25,077 | $ | 368,827 | |||||||||||||
| Bret Siepman, Vice President, Development(5) |
2015 | $ | 250,000 | $ | 62,500 | $ | 0 | $ | 14,417 | $ | 326,917 | |||||||||||||
| 2014 | $ | 236,458 | $ | 62,500 | N/A | $ | 13,958 | $ | 312,916 | |||||||||||||||
| (1) | Amounts in this column reflect the discretionary bonus paid to our named executive officers for services in 2013, 2014 and 2015, as applicable. |
| (2) | Mr. Polzin received an award of “incentive units” pursuant to the Limited Liability Company Agreement of Centennial HoldCo (as amended from time to time, the “HoldCo LLC Agreement”) in 2013 (the “HoldCo Incentive Units”). While Messrs. Glyphis and Siepman also previously received awards of HoldCo Incentive Units, as explained in greater detail in footnote (5) to this 2015 Summary Compensation Table, neither Mr. Glyphis nor Mr. Siepman was a named executive officer for the applicable year in which the award was granted (2014 for Mr. Glyphis; 2013 for Mr. Siepman) and, therefore, 2014 compensation for Mr. Glyphis and 2013 compensation for Mr. Siepman, in either case, is not required to be reported in this |
116
Table of Contents
| table. Information regarding outstanding HoldCo Incentive Units held by each of our named executive officers as of December 31, 2015 is provided below under “—Outstanding Equity Awards at 2015 Fiscal Year-End.” The HoldCo Incentive Units are intended to constitute “profits interests” and represent actual (non-voting) equity interests in Centennial HoldCo that have no liquidation value for U.S. federal income tax purposes on the date of grant but are designed to gain value only after the underlying assets have realized a certain level of growth and return to those persons who hold certain other classes of Centennial HoldCo’s equity. We believe that, despite the fact that the HoldCo Incentive Units do not require the payment of an exercise price, these awards are most similar economically to stock options and, as such, they are properly classified as “options” for purposes of the SEC’s executive compensation disclosure rules under the definition provided in Item 402(m)(5)(i) of Regulation S-K since these awards have “option-like features.” The amount reflected in this column for Mr. Polzin reports the value of the HoldCo Incentive Units at the grant date based upon the probable outcome of the applicable performance conditions, determined as of the grant date under ASC 718, which was $0, because the performance conditions related to these awards were not deemed probable of achievement at the time of grant in 2013. Further information regarding the assumptions used in the valuation of the HoldCo Incentive Units is included in Note 9—Incentive Unit Compensation to our Consolidated and Combined Financial Statements and under “—Narrative Disclosures—Incentive Units—HoldCo Incentive Units” below. The HoldCo Incentive Units are not designed with a threshold, target or maximum potential payout level; however, our best estimate of the aggregate grant date fair value of Mr. Polzin’s HoldCo Incentive Units that could have been reported under ASC 718 if the applicable performance conditions had been deemed probable to occur at the grant date would have been $3.7 million. The performance conditions related to the HoldCo Incentive Units granted to Messrs. Glyphis and Siepman also were not deemed probable of achievement at the time of grant in 2014 and 2013, respectively. |
| (3) | Our named executive officers each received an award of “incentive units” pursuant to the Limited Liability Company Agreement of Follow-On (as amended from time to time, the “Follow-On LLC Agreement”) in 2015 (the “Follow-On Incentive Units”). Information regarding outstanding Follow-On Incentive Units held by each of our named executive officers as of December 31, 2015 is provided below under “—Outstanding Equity Awards at 2015 Fiscal Year-End.” The Follow-On Incentive Units are intended to constitute “profits interests” and represent actual (non-voting) equity interests in Follow-On that have no liquidation value for U.S. federal income tax purposes on the date of grant but are designed to gain value only after the underlying assets have realized a certain level of growth and return to those persons who hold certain other classes of Follow-On’s equity. We believe that, despite the fact that the Follow-On Incentive Units do not require the payment of an exercise price, these awards are most similar economically to stock options and, as such, they are properly classified as “options” for purposes of the SEC’s executive compensation disclosure rules under the definition provided in Item 402(m)(5)(i) of Regulation S-K since these awards have “option-like features.” The amount reflected in this column for the named executive officers reports the value of the Follow-On Incentive Units at the grant date based upon the probable outcome of the applicable performance conditions, determined as of the grant date under ASC 718, which was $0, because the performance conditions related to these awards were not deemed probable of achievement at the time of grant in 2015. Further information regarding the assumptions used in the valuation of the Follow-On Incentive Units is included in Note 9—Incentive Unit Compensation to our Consolidated and Combined Financial Statements and under “—Narrative Disclosures—Incentive Units—Follow-On Incentive Units” below. The Follow-On Incentive Units are not designed with a threshold, target or maximum potential payout level; however, our best estimate of the aggregate grant date fair value of each named executive officer’s Follow-On Incentive Units that could have been reported under ASC 718 if the applicable performance conditions had been deemed probable to occur at the grant date would have been $2.4 million with respect to Mr. Polzin, $0.7 million with respect to Mr. Glyphis and $1.2 million with respect to Mr. Siepman. |
| (4) | Amounts in this column reflect (a) for all named executive officers, matching contributions to the 401(k) Plan made on behalf of our named executive officers for 2014 and 2015, as applicable, and (b) for Mr. Glyphis, reimbursement of moving expenses for 2015. See “—Narrative Disclosures—Retirement Benefits” below for more information on matching contributions to the 401(k) Plan. |
117
Table of Contents
| (5) | Mr. Glyphis became our employee during fiscal year 2014 and did not have compensation that exceeded $100,000 in fiscal year 2014, so disclosure of his compensation has not been provided in the table above for fiscal year 2014 in accordance with SEC rules. Mr. Siepman did not have compensation that exceeded $100,000 in fiscal year 2013, so disclosure of his compensation has not been provided in the table above for fiscal year 2013 in accordance with SEC rules. |
118
Table of Contents
Outstanding Equity Awards at 2015 Fiscal Year-End
The following table reflects information regarding outstanding incentive units held by our named executive officers as of December 31, 2015. As the incentive units are equity interests in Centennial HoldCo and Follow-On, following this offering, the incentive units held by our named executive officers will not relate directly to our securities, and we will not be responsible for making any payments, distributions or settlements to any award recipient relating to such incentive units. Centennial HoldCo and Follow-On, are currently responsible for making all payments, distributions and settlements to all award recipients relating to the HoldCo Incentive Units and Centennial Follow-On Incentive Units, and will continue to be responsible for making all payments, distributions and settlements to all award recipients relating to such incentive units following the closing of this offering.
| Option Awards(1) | ||||||||||||||||
| Name |
Number of Securities Underlying Unexercised Options, Exercisable (#) |
Number of Securities Underlying Unexercised Options, Unexercisable (#) |
Option Exercise Price ($) |
Option Expiration Date |
||||||||||||
| Ward Polzin |
||||||||||||||||
| HoldCo Incentive Units |
||||||||||||||||
| HoldCo Tier I Units |
154,000 | 176,000 | N/A | N/A | ||||||||||||
| HoldCo Tier II Units |
154,000 | 176,000 | N/A | N/A | ||||||||||||
| HoldCo Tier III Units |
0 | 330,000 | N/A | N/A | ||||||||||||
| HoldCo Tier IV Units |
0 | 330,000 | N/A | N/A | ||||||||||||
| HoldCo Tier V Units |
0 | 330,000 | N/A | N/A | ||||||||||||
| Follow-On Incentive Units |
||||||||||||||||
| Follow-On Tier I Units |
44,000 | 286,000 | N/A | N/A | ||||||||||||
| Follow-On Tier II Units |
44,000 | 286,000 | N/A | N/A | ||||||||||||
| Follow-On Tier III Units |
0 | 330,000 | N/A | N/A | ||||||||||||
| Follow-On Tier IV Units |
0 | 330,000 | N/A | N/A | ||||||||||||
| Follow-On Tier V Units |
0 | 330,000 | N/A | N/A | ||||||||||||
| George Glyphis |
||||||||||||||||
| HoldCo Incentive Units |
||||||||||||||||
| HoldCo Tier I Units |
25,000 | 75,000 | N/A | N/A | ||||||||||||
| HoldCo Tier II Units |
25,000 | 75,000 | N/A | N/A | ||||||||||||
| HoldCo Tier III Units |
0 | 100,000 | N/A | N/A | ||||||||||||
| HoldCo Tier IV Units |
0 | 100,000 | N/A | N/A | ||||||||||||
| HoldCo Tier V Units |
0 | 100,000 | N/A | N/A | ||||||||||||
| Follow-On Incentive Units |
||||||||||||||||
| Follow-On Tier I Units |
13,333 | 86,667 | N/A | N/A | ||||||||||||
| Follow-On Tier II Units |
13,333 | 86,667 | N/A | N/A | ||||||||||||
| Follow-On Tier III Units |
0 | 100,000 | N/A | N/A | ||||||||||||
| Follow-On Tier IV Units |
0 | 100,000 | N/A | N/A | ||||||||||||
| Follow-On Tier V Units |
0 | 100,000 | N/A | N/A | ||||||||||||
| Bret Siepman |
||||||||||||||||
| HoldCo Incentive Units |
||||||||||||||||
| HoldCo Tier I Units |
77,000 | 88,000 | N/A | N/A | ||||||||||||
| HoldCo Tier II Units |
77,000 | 88,000 | N/A | N/A | ||||||||||||
| HoldCo Tier III Units |
0 | 165,000 | N/A | N/A | ||||||||||||
| HoldCo Tier IV Units |
0 | 165,000 | N/A | N/A | ||||||||||||
| HoldCo Tier V Units |
0 | 165,000 | N/A | N/A | ||||||||||||
| Follow-On Incentive Units |
||||||||||||||||
| Follow-On Tier I Units |
22,000 | 143,000 | N/A | N/A | ||||||||||||
| Follow-On Tier II Units |
22,000 | 143,000 | N/A | N/A | ||||||||||||
| Follow-On Tier III Units |
0 | 165,000 | N/A | N/A | ||||||||||||
| Follow-On Tier IV Units |
0 | 165,000 | N/A | N/A | ||||||||||||
| Follow-On Tier V Units |
0 | 165,000 | N/A | N/A | ||||||||||||
119
Table of Contents
| (1) | The HoldCo Incentive Units and Follow-On Incentive Units are each divided into five tiers, and each tier has a separate distribution threshold and vesting schedule. Awards reflected as “Exercisable” are incentive units that have vested, and awards reflected as “Unexercisable” are incentive units that have not yet vested. For a description of how and when the HoldCo Incentive Units and Follow-On Incentive Units could become vested and when such awards could begin to receive payments, see “—Narrative Disclosures—Incentive Units” below. Additional information regarding the HoldCo Incentive Units and Follow-On Incentive Units is also provided in footnotes (2) and (3), respectively, to the 2015 Summary Compensation Table above. |
Narrative Disclosures
Employment, Severance or Change in Control Agreements
We historically have not maintained any employment, severance or change in control agreements with our named executive officers. In addition, our named executive officers are not entitled to any payments or other benefits in connection with a termination of employment or a change in control, other than with respect to incentive units as described below under “—Incentive Units.”
Retirement Benefits
We have not maintained, and do not currently intend to maintain, a defined benefit pension plan or nonqualified deferred compensation plan. Instead, our employees, including our named executive officers, may participate in a retirement plan intended to provide benefits under section 401(k) of the Code (the “401(k) Plan”) pursuant to which employees are allowed to contribute a portion of their base compensation to a tax-qualified retirement account. We provide matching contributions equal to 100% of the first 6% of employees’ eligible compensation contributed to the 401(k) Plan. Employees are immediately 100% vested in the matching contributions made to their 401(k) Plan account and are always 100% vested in the employee contributions they make to their 401(k) Plan account. Employees may generally receive a distribution of the vested portion of their 401(k) Plan account upon (i) a termination of employment, (ii) normal retirement, (iii) disability or (iv) death.
Incentive Units
Centennial HoldCo Incentive Units. In 2013, certain executive officers received an award of incentive units in Centennial HoldCo, or profits interests that represent actual (non-voting) equity interests in Centennial HoldCo, in order to provide them with the ability to benefit from the growth in our operations and business. The HoldCo Incentive Units are divided into five tiers, with each tier currently comprised of one tranche. A potential payout for each tranche will occur when a certain specified level of cumulative cash distributions has been received by the capital interest holding members of Centennial HoldCo. Tier I units and Tier II units each vest in five equal annual installments beginning on the first anniversary of the applicable date of grant (with vesting between such anniversaries occurring pro rata each month), although such vesting will be fully accelerated upon the occurrence of either (i) (a) with respect to the Tier I units, satisfaction of the payment threshold established for the Tier I units or (b) with respect to the Tier II units, satisfaction of the payment threshold established for the Tier II units or (ii) with respect to both Tier I units and Tier II units, a “Fundamental Change” (as defined below). Tier III units, Tier IV units and Tier V units each vest only upon satisfaction of the payment threshold established for the applicable tier. All HoldCo Incentive Units that have not yet vested according to their applicable vesting requirements will automatically be forfeited and become null and void at the time a named executive officer’s employment is terminated for any reason; provided, however, that, prior to such forfeiture, solely with respect to any unvested HoldCo Incentive Units that are Tier I or Tier II units, the named executive officer will vest, immediately prior to his termination of employment, as to a pro rata amount of such unvested HoldCo Incentive Units determined by multiplying the number of HoldCo Incentive Units that would vest on the next annual vesting date by a fraction with a numerator equal to the number of full months that have elapsed since the most recent vesting date and a denominator of 12, with such pro rata amount rounded to the closest whole number. If a
120
Table of Contents
named executive officer’s employment is terminated for “cause” (as defined below), or the named executive officer resigns or terminates the service relationship early (each, a “voluntary termination”), all vested HoldCo Incentive Units will be forfeited at the time of the termination. In the event that a named executive officer’s employment is terminated other than (i) for cause or (ii) due to a voluntary termination, the named executive officer will retain all vested HoldCo Incentive Units following such termination. For purposes of the foregoing, a named executive officer’s termination of employment means the termination of such named executive officer’s employment with us, Centennial HoldCo, Follow-On and all of its affiliates.
The Tier I units entitle Tier I unitholders to 20% of future distributions only after all of the members that have made capital contributions to Centennial HoldCo have received cumulative cash distributions in respect of their membership interests equal to their cumulative capital contributions multiplied by (1.08)n, where “n” is equal to the “Weighted Average Capital Contribution Factor” (as defined below) determined as of the date of such distribution. The Tier II units entitle Tier II unitholders to 5% of future distributions only after all of the members that have made capital contributions to Centennial HoldCo have received cumulative cash distributions in respect of their membership interests equal to their cumulative capital contributions multiplied by (1.20)n, where “n” is equal to the Weighted Average Capital Contribution Factor determined as of the date of such distribution. The Tier III units entitle Tier III unitholders to 5% of future distributions only after all of the members that have made capital contributions to Centennial HoldCo have received cumulative cash distributions in respect of their membership interests equal to two times their cumulative capital contributions. Tier IV units entitle Tier IV unitholders to 5% of future distributions only after all of the members that have made capital contributions to Centennial HoldCo have received cumulative cash distributions in respect of their membership interests equal to 2.5 times their cumulative capital contributions. The Tier V units entitle Tier V unitholders to 5% of future distributions only after all of the members that have made capital contributions to Centennial HoldCo have received cumulative cash distributions in respect of their membership interests equal to three times their cumulative capital contributions. “Weighted Average Capital Contribution Factor” is, as of any date of calculation, a weighted average equal to the sum of the amounts determined for each date on which capital contributions have been funded calculated as the product of (a) the percentage of the total capital commitments funded on each date, times (b) the number of years from the date of each capital contribution until the date of such calculation (with a partial year being expressed as a decimal determined by dividing the number of days which have passed since the most recent anniversary by 365).
We do not expect that this offering will result in a Fundamental Change with respect to the HoldCo Incentive Units, and as of the date of this filing, no tier of HoldCo Incentive Units has received a payout. Because we are not a party to the HoldCo LLC Agreement, we cannot be certain that the terms of the HoldCo Incentive Units and HoldCo LLC Agreement will remain the same in the future.
Follow-On Incentive Units. In 2015, each named executive officer received an award of incentive units in Follow-On, or profits interests that represent actual (non-voting) equity interests in Follow-On, in order to provide them with the ability to benefit from the growth in our operations and business. The Follow-On Incentive Units are divided into five tiers, with each tier currently comprised of one tranche. A potential payout for each tranche will occur when a certain specified level of cumulative cash distributions has been received by the capital interest holding members of Follow-On. Tier I units and Tier II units each vest in five equal annual installments beginning on the first anniversary of the applicable date of grant (with vesting between such anniversaries occurring pro rata each month), although such vesting will be fully accelerated upon the occurrence of either (i) (a) with respect to the Tier I units, satisfaction of the payment threshold established for the Tier I units or (b) with respect to the Tier II units, satisfaction of the payment threshold established for the Tier II units or (ii) with respect to both Tier I units and Tier II units, a “Fundamental Change” (as defined below). Tier III units, Tier IV units and Tier V units each vest only upon satisfaction of the payment threshold established for the applicable tier. All Follow-On Incentive Units that have not yet vested according to their applicable vesting requirements will automatically be forfeited and become null and void at the time a named executive officer’s employment is terminated for any reason; provided, however, that, prior to such forfeiture, solely with respect to any unvested Follow-On Incentive Units that are Tier I or Tier II units, the named executive officer will vest,
121
Table of Contents
immediately prior to his termination of employment, as to a pro rata amount of such unvested Follow-On Incentive Units determined by multiplying the number of Follow-On Incentive Units that would vest on the next annual vesting date by a fraction with a numerator equal to the number of full months that have elapsed since the most recent vesting date and a denominator of 12, with such pro rata amount rounded to the closest whole number. If a named executive officer’s employment is terminated for “cause” (as defined below), or the named executive officer resigns or terminates the service relationship early (each, a “voluntary termination”), all vested Follow-On Incentive Units will be forfeited at the time of the termination. In the event that a named executive officer’s employment is terminated other than (i) for cause or (ii) due to a voluntary termination, the named executive officer will retain all vested Follow-On Incentive Units following such termination. For purposes of the foregoing, a named executive officer’s termination of employment means the termination of such named executive officer’s employment with us, Follow-On, Centennial HoldCo and all of its affiliates.
The Tier I units entitle Tier I unitholders to 20% of future distributions only after all of the members that have made capital contributions to Follow-On have received cumulative cash distributions in respect of their membership interests equal to their cumulative capital contributions multiplied by (1.08)n, where “n” is equal to the “Weighted Average Capital Contribution Factor” (as defined below) determined as of the date of such distribution. The Tier II units entitle Tier II unitholders to 5% of future distributions only after all of the members that have made capital contributions to Follow-On have received cumulative cash distributions in respect of their membership interests equal to their cumulative capital contributions multiplied by (1.20)n, where “n” is equal to the Weighted Average Capital Contribution Factor determined as of the date of such distribution. The Tier III units entitle Tier III unitholders to 5% of future distributions only after all of the members that have made capital contributions to Follow-On have received cumulative cash distributions in respect of their membership interests equal to two times their cumulative capital contributions. Tier IV units entitle Tier IV unitholders to 5% of future distributions only after all of the members that have made capital contributions to Follow-On have received cumulative cash distributions in respect of their membership interests equal to 2.5 times their cumulative capital contributions. The Tier V units entitle Tier V unitholders to 5% of future distributions only after all of the members that have made capital contributions to Follow-On have received cumulative cash distributions in respect of their membership interests equal to three times their cumulative capital contributions. “Weighted Average Capital Contribution Factor” is, as of any date of calculation, a weighted average equal to the sum of the amounts determined for each date on which capital contributions have been funded calculated as the product of (a) the percentage of the total capital commitments funded on each date, times (b) the number of years from the date of each capital contribution until the date of such calculation (with a partial year being expressed as a decimal determined by dividing the number of days which have passed since the most recent anniversary by 365).
As of the date of this filing, no tier of Follow-On Incentive Units has received a payout. In connection with our corporate reorganization, Follow-On will be recapitalized into a single class of equity with each member of Follow-On, including holders of the Follow-On incentive units, receiving a fixed percentage interest in Follow-On based on the distribution provisions contained in Follow-On’s limited liability company agreement and the implied equity value of Follow-On immediately prior to this offering, based on the aggregate number of shares of our common stock to be issued to Follow-On in connection with our corporate reorganization. Promptly following the consummation of this offering, Follow-On intends to distribute all of its shares of our common stock and any cash received in respect of shares of our common stock it sells in this offering to its members on a pro-rata basis and then dissolve. Based on an initial public offering price of $ (the mid-point of the range set forth on the cover of this prospectus) and assuming the underwriters’ over-allotment option is not exercised, approximately shares of our common stock and approximately $ million in cash will be distributed in respect of the Follow-On Incentive Units. As a result, Messrs. Polzin, Glyphis and Siepman will receive approximately , and shares of our common stock, respectively, and approximately $ , $ and $ in cash (in each case, based on the mid-point of the price range set forth on the cover of this prospectus) with respect to the Follow-On incentive units. After the consummation of this offering, there will be no further liability with respect to the Follow-On Incentive Units. Because we are not a party to the Follow-On LLC Agreement, we cannot be certain that the terms of the Follow-On LLC Agreement will remain the same in the future.
122
Table of Contents
Definitions. Under the HoldCo LLC Agreement and the Follow-On LLC Agreement, a “Fundamental Change” is generally the occurrence of any of the following events: (i) (a) Centennial HoldCo merges or consolidates with or into, or enters into any similar transaction with, any person other than one of Centennial HoldCo’s affiliates, members or certain of its other related parties; (b) Centennial HoldCo’s outstanding interests are sold or exchanged in a single transaction, or a series of related transactions, to any person other than one of Centennial HoldCo’s affiliates, members or certain of its other related parties; or (c) Centennial HoldCo sells, leases, licenses or exchanges, or agrees to sell, lease, license or exchange, all or substantially all of Centennial HoldCo’s assets to a person that is not one of Centennial HoldCo’s affiliates, members or certain of its other related parties, provided that in the case of any such transaction described in (a), (b) or (c), the individuals that served as members of Centennial HoldCo’s board of managers before the consummation of such transaction cease to constitute at least a majority of the members of the board or analogous managing body of the surviving or acquiring entity immediately following completion of such transaction; (ii) any person or group (other than one of Centennial HoldCo’s affiliates, members or certain of its other related parties) purchases or otherwise acquires the right to vote or dispose of securities of Centennial HoldCo representing 50% or more of the total voting power of all outstanding voting securities of Centennial HoldCo, unless the transaction was approved by Centennial HoldCo’s board of managers; or (iii) Centennial HoldCo is dissolved and liquidated.
Under the HoldCo LLC Agreement and the Follow-On LLC Agreement, a termination for “cause” generally occurs upon a named executive officer’s: (i) conviction of, or plea of nolo contendere to, any felony or crime causing substantial harm to Follow-On, Centennial HoldCo or their respective affiliates or involving acts of theft, fraud, embezzlement, moral turpitude, or similar conduct; (ii) repeated intoxication by alcohol or drugs during the performance of the named executive officer’s duties in a manner that materially and adversely affects the performance of such duties; (iii) malfeasance in the conduct of the named executive officer’s duties, including but not limited to (a) misuse or diversion of funds of Follow-On, Centennial HoldCo or their respective affiliates, (b) embezzlement or (c) misrepresentations or concealments on any written reports submitted to Follow-On, Centennial HoldCo or their respective affiliates; (iv) violation of the Voting and Transfer Restriction Agreement among Centennial HoldCo and its members or the named executive officer’s confidentiality and noncompete agreement; or (v) failure to perform the duties of the named executive officer’s employment relationship with us, Follow-On, Centennial HoldCo or their respective affiliates, or failure to follow or comply with the reasonable and lawful written directives of our board of directors, Centennial HoldCo’s board of managers or the board of an affiliate of Centennial HoldCo or Follow-On by which the named executive officer is employed with, in either case, after the named executive officer shall have been informed, in writing, of such failure and given a period of not less than 60 days to remedy the failure.
Compensation of Directors
Our board of directors was formed in October 2014. No obligations with respect to compensation for directors have been accrued or paid for any periods prior to such formation date or following such formation date during the remainder of fiscal year 2014, fiscal year 2015 or to date in 2016. Individuals serving on the boards of managers of our predecessor did not receive any compensation for their services on such boards of managers during fiscal year 2015.
Going forward, our board of directors believes that attracting and retaining qualified non-employee directors will be critical to the future value growth and governance of our company. Our board of directors also believes that a significant portion of the total compensation package for our non-employee directors should be equity-based to align the interest of these directors with our stockholders.
We are reviewing the non-employee director compensation packages provided by certain peer companies and intend to implement a non-employee director compensation program in connection with this offering.
Directors who are also our employees will not receive any additional compensation for their service on our board of directors.
123
Table of Contents
We expect that each director will be reimbursed for (i) travel and miscellaneous expenses to attend meetings and activities of our board of directors or its committees; (ii) travel and miscellaneous expenses related to such director’s participation in general education and orientation programs for directors; and (iii) travel and miscellaneous expenses for each director’s spouse who accompanies a director to attend meetings and activities of our board of directors or any of our committees.
Compensation Following this Offering
IPO Bonuses
We intend to grant certain employees, including our named executive officers, a bonus in connection with this offering. For each recipient, half of the bonus is expected to be made in the form of a cash award and the second half of the bonus is expected to be made in the form of a restricted stock award under our 2016 Long Term Incentive Plan (as described further below). We anticipate that the cash award and the restricted stock award will each be granted at, or shortly following, the closing of this offering. With respect to the cash award, it is generally expected that one-half of the award will become payable on the closing date of this offering and one-half of the award will become payable on the earlier to occur of a “change of control” (as defined in the 2016 Long Term Incentive Plan) and the first anniversary of the closing date of this offering. With respect to the restricted stock award, it is generally expected that the award will vest in three substantially equal installments on the first three anniversaries of the closing date of this offering. Notwithstanding the foregoing, each cash award and restricted stock award will accelerate and become payable or vested, as applicable, upon a termination of the employee’s service relationship due to death, “disability” or without “cause” or for “good reason” (each such term as defined in the applicable award agreement) and the restricted stock award will also accelerate and become vested upon the occurrence of a change of control.
We expect that the cash award portion of the offering bonus will equal approximately $2,678,466 in the aggregate for all employees, with Mr. Polzin receiving $125,000, Mr. Glyphis receiving $137,500 and Mr. Siepman receiving $125,000. We expect that the value, on or around the date of grant, of the restricted stock award portion of the offering bonus will equal approximately $2,678,466 in the aggregate for all employees, with Mr. Polzin receiving an award valued at approximately $125,000, Mr. Glyphis receiving an award valued at approximately $137,500 and Mr. Siepman receiving an award valued at approximately $125,000.
2016 Long Term Incentive Plan
Prior to the completion of this offering, we anticipate that our board of directors will adopt a long term incentive plan pursuant to which our employees, consultants and directors (and those of our subsidiaries), including our named executive officers, will be eligible to receive awards. We anticipate that the long term incentive plan, which we refer to herein as the “2016 Long Term Incentive Plan” or the “Plan,” will provide for the grant of stock options, stock appreciation rights, restricted stock, restricted stock units, stock awards, dividend equivalents, other stock-based awards, cash awards, substitute awards, and performance awards intended to align the interests of participants with those of our stockholders. The following description of the Plan is based on the form we anticipate adopting, but the Plan has not yet been adopted and the provisions discussed below remain subject to change. As a result, the following description is qualified in its entirety by reference to the final Plan once adopted.
Administration. We anticipate that the Plan will be administered by our board of directors, or a committee thereof (as applicable, the “Plan Administrator”). The Plan Administrator will have the authority to, among other things, designate eligible persons as participants under the Plan, determine the type or types of awards to be granted to eligible persons, determine the number of shares of our common stock to be covered by awards, determine the terms and conditions applicable to awards and interpret and administer the Plan. The Plan Administrator may terminate or amend the Plan at any time with respect to any shares of our common stock for which a grant has not yet been made. The Plan Administrator also has the right to alter or amend the Plan or any
124
Table of Contents
part of the Plan from time to time, including increasing the number of shares of our common stock that may be granted, subject to stockholder approval as required by any exchange upon which our common stock is listed at that time. However, no change to any outstanding award may be made that would materially and adversely affect the rights of the participant under the award without the consent of the participant.
Number of Shares. Subject to adjustment in the event of any distribution, recapitalization, split, merger, consolidation or similar corporate event, we anticipate that the number of shares available for delivery pursuant to awards granted under the Plan will not exceed shares of our common stock. There is no limit on the number of awards that may be granted and paid in cash. Shares subject to awards under the Plan that are canceled, forfeited, exchanged, settled in cash or otherwise terminated, including shares withheld to satisfy exercise prices or tax withholding obligations, will again be available for awards under the Plan. The shares of our common stock to be delivered under the Plan will be made available from authorized but unissued shares, shares held in treasury, or previously issued shares reacquired by us, including by purchase on the open market.
Stock Options. A stock option, or option, is a right to purchase shares of our common stock at a specified price during specified time periods. It is anticipated that options will have an exercise price that may not be less than the fair market value of our common stock on the date of grant. Options granted under the Plan can be either incentive options (within the meaning of section 422 of the Code), which have certain tax advantages for recipients, or non-qualified options. No option will have a term that exceeds ten years.
Stock Appreciation Rights. A stock appreciation right is an award that, upon exercise, entitles a participant to receive the excess of the fair market value of our common stock on the exercise date over the grant price established for the stock appreciation right on the date of grant. Such excess will be paid in cash or in common stock, or a combination thereof. It is anticipated that stock appreciation rights will have a grant price that may not be less than the fair market value of our common stock on the date of grant.
Restricted Stock. A restricted stock grant is an award of common stock that vests over a period of time and, during such time, is subject to transfer limitations, a risk of forfeiture and other restrictions imposed by the Plan Administrator, in its discretion. During the restricted period, a participant will have rights as a stockholder, including the right to vote the common stock subject to the award and to receive cash dividends thereon (which may, if required by the Plan Administrator, be subjected to the same vesting terms that apply to the underlying award of restricted stock).
Restricted Stock Units. A restricted stock unit is a notional share that entitles the grantee to receive shares of our common stock, cash or a combination thereof, as determined by the Plan Administrator, following a specified period.
Stock Awards. A stock award is a transfer of unrestricted shares of our common stock on terms and conditions determined by the Plan Administrator.
Dividend Equivalents. Dividend equivalents entitle a participant to receive cash, common stock, other awards or other property equal in value to dividends paid with respect to a specified number of shares of our common stock, or other periodic payments at the discretion of the Plan Administrator. Dividend equivalents may be granted on a free-standing basis or in connection with another award (other than an award of restricted stock or a stock award).
Other Stock-Based Awards. Other stock-based awards are awards denominated or payable in, valued in whole or in part by reference to, or otherwise based on or related to, the value of our common stock.
Cash Awards. Cash awards may be granted on a free-standing basis, as an element of or a supplement to, or in lieu of any other award.
125
Table of Contents
Substitute Awards. Awards may be granted in substitution or exchange for any other award granted under the Plan or under another equity incentive plan or any other right of an eligible person to receive payment from us. Awards may also be granted under the Plan in substitution for similar awards held for individuals who become eligible persons as a result of a merger, consolidation or acquisition of another entity by or with us or one of our affiliates.
Performance Awards. A performance award is a right to receive all or part of an award granted under the Plan based upon performance conditions specified by the Plan Administrator. The Plan Administrator will determine the period over which certain specified company or individual goals or objectives must be met. The performance award may be paid in cash, common stock, other awards or other property, in the discretion of the Plan Administrator.
Tax Withholding. The Plan Administrator will determine, in its sole discretion, the form of payment acceptable to satisfy a participant’s obligations with respect to withholding taxes and other tax obligations relating to an award, including, without limitation, the delivery of cash or cash equivalents, common stock (including previously owned shares, net settlement, broker-assisted sale or other cashless withholding or reduction of the amount of shares of our common stock otherwise issuable or delivered pursuant to the award), other property or any other legal consideration that the Plan Administrator deems appropriate.
Change in Control. Upon a “change in control” (as defined in the Plan), the Plan Administrator may, in its discretion, (i) remove any forfeiture restrictions applicable to an award, (ii) accelerate the time of exercisability or vesting of an award, (iii) require awards to be surrendered in exchange for a cash payment, (iv) cancel unvested awards without payment or (v) make adjustments to awards as the Plan Administrator deems appropriate to reflect the change in control.
Other Adjustments. In the case of (i) a subdivision or consolidation of our common stock (by reclassification, split or reverse split or otherwise), (ii) a recapitalization, reclassification, or other change in our capital structure or (iii) any other reorganization, merger, combination, exchange or other relevant change in capitalization of our equity, then a corresponding and proportionate adjustment shall be made in accordance with the terms of the Plan, as appropriate, with respect to the maximum number of shares available under the Plan, the number of shares that may be acquired with respect to an award, and, if applicable, the exercise price of an award, in order to prevent dilution or enlargement of awards as a result of such events.
Termination of Employment or Service. The consequences of the termination of a participant’s employment, consulting arrangement, or membership on the board of directors will be determined by the Plan Administrator in the terms of the relevant award agreement.
126
Table of Contents
PRINCIPAL AND SELLING STOCKHOLDERS
The following table sets forth the beneficial ownership of our common stock that, upon the consummation of the corporate reorganization and this offering, will be owned by:
| • | each of the selling stockholders; |
| • | each person known to us to beneficially own more than 5% of any class of our outstanding common stock; |
| • | each of our directors; |
| • | our named executive officers; and |
| • | all of our directors and executive officers as a group. |
The selling stockholders are deemed under federal securities laws to be underwriters with respect to the shares of common stock they are offering hereby and any shares of common stock that they may sell pursuant to the underwriters’ option to purchase additional shares of our common stock. For further information regarding material transactions between us and the selling stockholders, see “Certain Relationships and Related Party Transactions.”
All information with respect to beneficial ownership has been furnished by the respective 5% or more stockholders, selling stockholders, directors or named executive officer, as the case may be. Unless otherwise noted, the mailing address of each listed beneficial owner is c/o Centennial Resource Development, Inc., 1401 17th Street, Suite 1000, Denver, Colorado 80202.
The underwriters have an option to purchase a maximum of additional shares from the selling stockholders to cover over-allotments of shares.
| Shares Beneficially Owned Before this Offering |
Shares Offered Hereby |
Shares Beneficially Owned After this Offering (Assuming No Exercise of the Underwriters’ Over- Allotment Option) |
Shares Beneficially Owned After this Offering (Assuming the Underwriters’ Over- Allotment Option is Exercised in Full) |
|||||||||||||||||
| Name of Beneficial Owner(1) |
Number | Percentage | Number | Percentage | Number | Percentage | ||||||||||||||
| Selling Stockholders: |
||||||||||||||||||||
| Centennial Resource Development, LLC(2) |
% | % | % | |||||||||||||||||
| Celero Energy Company, LP(3) |
% | % | % | |||||||||||||||||
| NGP Centennial Follow-On LLC(4)(5) |
% | % | % | |||||||||||||||||
| Carlyle Partners VI Centennial Holdings, L.P.(5)(6) |
% | % | % | |||||||||||||||||
| Directors and Named Executive Officers: |
||||||||||||||||||||
| Chris Carter |
% | % | % | |||||||||||||||||
| David Hayes |
% | % | % | |||||||||||||||||
| Ward Polzin(5) |
% | % | % | |||||||||||||||||
| Christopher Ray |
% | % | % | |||||||||||||||||
| Martin Sumner |
% | % | % | |||||||||||||||||
| Tony Weber |
% | % | % | |||||||||||||||||
| George Glyphis(5) |
% | % | % | |||||||||||||||||
| Bret Siepman(5) |
% | % | % | |||||||||||||||||
| Directors and Executive Officers as a Group (9 Persons)(5) |
% | % | % | |||||||||||||||||
127
Table of Contents
| (1) | The amounts and percentages of common stock beneficially owned are reported on the bases of regulations of the SEC governing the determination of beneficial ownership of securities. Under the rules of the SEC, a person is deemed to be a “beneficial owner” of a security if that person has or shares voting power, which includes the power to vote or direct the voting of such security, or investment power, which includes the power to dispose of or to direct the disposition of such security. Securities that can be so acquired are deemed to be outstanding for purposes of computing such person’s ownership percentage, but not for purposes of computing any other person’s percentage. Under these rules, more than one person may be deemed beneficial owner of the same securities, and a person may be deemed to be a beneficial owner of securities as to which such person has no economic interest. Except as otherwise indicated in these footnotes, each of the beneficial owners has, to our knowledge, sole voting and investment power with respect to the indicated shares of common stock, except to the extent this power may be shared with a spouse. |
| (2) | The board of managers of Centennial HoldCo has voting and dispositive power over these shares. The board of managers of Centennial HoldCo consists of Ward Polzin (our Chief Executive Officer and one of our directors), Bret Siepman (our Vice President, Development), Chris Carter (one of our directors), David Hayes (one of our directors), Martin Sumner (one of our directors), Christopher Ray (one of our directors) and Tony Weber (one of our directors). None of such persons individually have voting and dispositive power over these shares, and the board of managers of Centennial HoldCo acts by majority vote and thus each such person is not deemed to beneficially own the shares held by Centennial HoldCo. NGP X US Holdings, L.P. (“NGP X US Holdings”) owns 99% of Centennial HoldCo, and certain members of our management team own the remaining 1%. Certain members of our management team and certain of our employees also own incentive units in Centennial HoldCo. Please see “Executive Compensation—Narrative Disclosures—Incentive Units” for more information on the incentive units. As a result, NGP X US Holdings may be deemed to indirectly beneficially own the shares held by Centennial HoldCo. NGP X US Holdings disclaims beneficial ownership of these shares except to the extent of its pecuniary interest therein. NGP X Holdings GP, L.L.C. (the sole general partner of NGP X US Holdings), NGP Natural Resources X, L.P. (the sole member of NGP X Holdings GP, L.L.C.), G.F.W. Energy X, L.P. (the sole general partner of NGP Natural Resources X, L.P.) and GFW X, L.L.C. (the sole general partner of G.F.W. Energy X, L.P.) may each be deemed to share voting and dispositive power over the reported shares and therefore may also be deemed to be the beneficial owner of these shares. GFW X, L.L.C. has delegated full power and authority to manage NGP X US Holdings to NGP Energy Capital Management, L.L.C. and accordingly, NGP Energy Capital Management, L.L.C. may be deemed to share voting and dispositive power over these shares and therefore may also be deemed to be the beneficial owner of these shares. Chris Carter and Tony Weber, both of whom are members of our board of directors, are managing partners of NGP Energy Capital Management, L.L.C. In addition, Craig Glick and Christopher Ray are senior managing directors of NGP Energy Capital Management, L.L.C. Although none of Messrs. Carter, Weber, Glick or Ray individually have voting or dispositive power over these shares, such individuals may be deemed to share voting and dispositive power over these shares and therefore may also be deemed to be the beneficial owner of these shares. Each of Messrs. Carter, Weber, Glick and Ray disclaim beneficial ownership of these shares except to the extent of their respective pecuniary interest therein. The number of shares reflected in the table above as beneficially owned by Centennial HoldCo does not include shares held by Celero that are subject to the terms of the voting agreement pursuant to which, among other things, Celero has agreed to vote as directed by Centennial HoldCo. See “Certain Relationships and Related Party Transactions—Voting Agreement.” |
| (3) | Celero Energy Management, LLC, the general partner of Celero (“Celero GP”), has voting and dispositive power over these shares. The board of managers of Celero GP consists of David Hayes (one of our directors), Bruce Selkirk and Christopher Ray (one of our directors). None of such persons individually have voting and dispositive power over these shares, and the board of managers of Celero GP acts by majority vote and thus each such person is not deemed to beneficially own the shares held by Celero GP. Natural Gas Partners VIII, L.P. (“NGP VIII”) owns 94.7% of the membership interests of Celero GP, and the remaining 5.3% is held by certain members of Celero’s management team and other minority owners. As a result, NGP VIII may be deemed to indirectly beneficially own these shares. NGP VIII disclaims beneficial ownership |
128
Table of Contents
| of these shares except to the extent of its pecuniary interest therein. G.F.W. Energy VIII, L.P. (the sole general partner of NGP VIII) and GFW VIII, L.L.C. (the sole general partner of G.F.W. Energy VIII, L.P.) may each be deemed to share voting and dispositive power over these shares and therefore may also be deemed to be the beneficial owner of these shares. GFW VIII, L.L.C. has delegated full power and authority to manage NGP VIII to NGP Energy Capital Management, L.L.C. and accordingly, NGP Energy Capital Management, L.L.C. may be deemed to share voting and dispositive power over these shares and therefore may also be deemed to be the beneficial owner of these shares. Chris Carter and Tony Weber, both of whom are members of our board of directors, are managing partners of NGP Energy Capital Management, L.L.C. In addition, Craig Glick and Christopher Ray are senior managing directors of NGP Energy Capital Management, L.L.C. Although none of Messrs. Carter, Weber, Glick or Ray individually have voting or dispositive power over these shares, such individuals may be deemed to share voting and dispositive power over these shares and therefore may also be deemed to be the beneficial owner of these shares. Each of Messrs. Carter, Weber, Glick and Ray disclaim beneficial ownership of these shares except to the extent of their respective pecuniary interest therein. |
| (4) | NGP Centennial Follow-On LLC is managed by its managing member, NGP X US Holdings. As such, NGP X US Holdings has voting and dispositive power over these shares. NGP X US Holdings disclaims beneficial ownership of these shares except to the extent of its pecuniary interest therein. NGP X Holdings GP, L.L.C. (the sole general partner of NGP X US Holdings), NGP Natural Resources X, L.P. (the sole member of NGP X Holdings GP, L.L.C.), G.F.W. Energy X, L.P. (the sole general partner of NGP Natural Resources X, L.P.) and GFW X, L.L.C. (the sole general partner of G.F.W. Energy X, L.P.) may each be deemed to share voting and dispositive power over the reported shares and therefore may also be deemed to be the beneficial owner of these shares. G.F.W. Energy X, L.P. has delegated full power and authority to manage NGP Natural Resources X, L.P. to NGP Energy Capital Management, L.L.C. and accordingly, NGP Energy Capital Management, L.L.C. may be deemed to share voting and dispositive power over these shares and therefore may also be deemed to be the beneficial owner of these shares. Chris Carter and Tony Weber, both of whom are members of our board of directors, are managing partners of NGP Energy Capital Management, L.L.C. In addition, Craig Glick and Christopher Ray are senior managing directors of NGP Energy Capital Management, L.L.C. Although none of Messrs. Carter, Weber, Glick or Ray individually have voting or dispositive power over these shares, such individuals may be deemed to share voting and dispositive power over these shares and therefore may also be deemed to be the beneficial owner of these shares. Each of Messrs. Carter, Weber, Glick and Ray disclaim beneficial ownership of these shares except to the extent of their respective pecuniary interest therein. |
| (5) | As part of the transactions described in “Recent and Formation Transactions—Formation Transactions—Our Corporate Reorganization,” Follow-On will be recapitalized into a single class of equity with each member of Follow-On, including holders of the Follow-On incentive units, receiving a fixed percentage interest in Follow-On based on the distribution provisions contained in Follow-On’s limited liability company agreement and the implied equity value of Follow-On immediately prior to this offering, based on the aggregate number of shares of our common stock to be issued to Follow-On in connection with our corporate reorganization. Promptly following the consummation of this offering, Follow-On intends to distribute all of its shares of our common stock and any cash received in respect of shares of our common stock it sells in this offering to its members on a pro-rata basis and then dissolve. As a result of such distribution, Messrs. Polzin, Glyphis and Siepman and our directors and executive officers as a group will receive , , and shares of our common stock, respectively, based on an assumed initial public offering price of $ per share of common stock, the midpoint of the price range set forth on the cover page of this prospectus. Also as a result of such distribution, Carlyle Partners VI Centennial Holdings, L.P. will receive shares of our common stock, based on an assumed initial offering price of $ per share of common stock, the midpoint of the price range set forth on the cover page of this prospectus. The number of shares reflected in the table above as beneficially owned by Messrs. Polzin, Glyphis and Siepman, our directors and executive officers as a group and Carlyle Partners VI Centennial Holdings, L.P. does not include the shares to be received by such persons upon such distribution from Follow-On. |
| (6) | Carlyle Partners VI Centennial Holdings, L.P. is the record holder of the securities reported herein. Carlyle |
129
Table of Contents
| Group Management L.L.C. is the general partner of The Carlyle Group L.P., which is a publicly traded entity listed on NASDAQ. The Carlyle Group L.P. is the sole shareholder of Carlyle Holdings I GP Inc., which is the sole member of Carlyle Holdings I GP Sub L.L.C., which is the general partner of Carlyle Holdings I L.P., which is sole member of TC Group, L.L.C., which is the general partner of TC Group Sub L.P., which is the managing member of TC Group VI S1, L.L.C., which is the general partner of TC Group VI S1, L.P., which is the general partner of Carlyle Partners VI Centennial Holdings, L.P. Accordingly, each of the foregoing entities may be deemed to share beneficial ownership of the securities owned of record by Carlyle Partners VI Centennial Holdings, L.P. Voting and investment determinations with respect to the securities held by Carlyle Partners VI Centennial Holdings, L.P. are made by an investment committee of TC Group VI, L.P. comprised of Daniel D’Aniello, William Conway, David Rubenstein, Louis Gerstner, Allan Holt, Peter Clare, Gregor Bôhm, Kewsong Lee and Thomas Mayrhofer. Each member of the investment committee disclaims beneficial ownership of such securities. The address for each of the persons or entities named in this footnote is c/o The Carlyle Group, 1001 Pennsylvania Ave. NW, Suite 220 South, Washington, D.C. 20004-2505. |
130
Table of Contents
RECENT AND FORMATION TRANSACTIONS
Recent Acquisition
Reeves County Leasehold Acquisitions
In June 2016, we closed an acquisition of acreage that is contiguous to our existing acreage position, and in May 2016, we closed a leasehold acquisition in close proximity to our operating area. These assets are comprised primarily of operated acreage, and we believe they increase our inventory of extended laterals. The Recent Acquisitions added approximately 2,400 net acres and 250 Boe/d of production. Thus far in 2016, we have spent approximately $44 million on acquisitions.
Recent Dispositions
Marston Disposition
In December 2014, we conveyed approximately 3,840 gross (1,845 net) acres, including 18 vertical wells that produced approximately 142 net Boe/d for the second half of 2014, in Ward County, Texas for net cash proceeds of approximately $12.5 million to an NGP-controlled affiliate. Following the Marston Disposition, we have no vertical drilling locations in our drilling plan.
CO2 Project Disposition
In May 2014, we conveyed certain oil and natural gas properties in Chaves County, New Mexico pursuant to which we had pursued a tertiary recovery project utilizing CO2 to increase production on such properties, including wells that produced approximately 378 net Boe/d in the first half of 2014, for net cash proceeds of approximately $59.3 million.
Atlantic Midstream Disposition
In February 2014, Centennial OpCo sold its 98.5% interest in Atlantic Midstream, LLC (“Atlantic Midstream”) to an NGP-controlled entity for net cash proceeds of $71.8 million.
Formation Transactions
The Combination
Centennial OpCo is an independent oil and natural gas company formed on August 30, 2012 by its management members, third-party investors and an affiliate of NGP, a family of energy-focused private equity investment funds founded in 1988 with aggregate committed capital under management since inception of over $15.8 billion. Subsequently, in April 2014, NGP contributed its membership interests in Centennial OpCo to Centennial HoldCo, which was formed by NGP and certain members of management. Centennial HoldCo is a holding company with no independent operations apart from its ownership interests in Centennial OpCo. By August 2014, all of the other members of Centennial OpCo (including its management members) had sold their membership interests in Centennial OpCo to Centennial OpCo or Centennial HoldCo for cash. As a result of these transactions, Centennial OpCo became a wholly-owned subsidiary of Centennial HoldCo.
Celero is an independent oil and natural gas company that was formed in 2006 to focus on the development and acquisition of oil and natural gas properties in Texas and New Mexico, primarily in the Permian Basin in West Texas. Celero was formed by its general partner, Celero Energy Management, LLC, its management team and NGP. Prior to the Combination, Celero owned non-operated interests in oil and natural gas properties in the Delaware Basin in which Centennial OpCo also has a working interest and substantially all of which were operated by Centennial OpCo.
131
Table of Contents
On October 15, 2014, Celero conveyed substantially all of its oil and natural gas properties and other assets to Centennial OpCo in exchange for membership interests in Centennial OpCo. Immediately following the completion of the Combination, Centennial HoldCo owned approximately 72% of Centennial OpCo, and Celero owned the remaining 28%.
Subsequent Capital Raising Activities
In 2015, Centennial OpCo issued additional membership interests to Centennial HoldCo and Follow-On in exchange for capital contributions. As a result of such capital contributions, Centennial HoldCo, Celero and Follow-On own an approximate 61.1%, 21.2% and 17.6% membership interest in Centennial OpCo, respectively.
Our Corporate Reorganization
Pursuant to the terms of certain reorganization transactions that will be completed in connection with this offering, through a series of steps, we will acquire, directly and indirectly, all of the interests in Centennial OpCo currently owned by each of Centennial HoldCo, Celero and Follow-On in exchange for shares, shares and shares, respectively, of our common stock. As a result of these transactions, we will directly and indirectly wholly own Centennial OpCo.
As part of the reorganization transactions, Follow-On will be recapitalized into a single class of equity with each member of Follow-On, including holders of the Follow-On incentive units, receiving a fixed percentage interest in Follow-On based on the distribution provisions contained in Follow-On’s limited liability company agreement and the implied equity value of Follow-On immediately prior to this offering, based on the aggregate number of shares of our common stock to be issued to Follow-On in connection with our corporate reorganization and the initial public offering price of our common stock in this offering. Promptly following the consummation of this offering, Follow-On intends to distribute all of its shares of our common stock and any cash received in respect of shares of our common stock it sells in this offering to its members on a pro-rata basis and then dissolve.
As part of the corporate reorganization and in connection with this offering, we will enter into a registration rights agreement with Centennial HoldCo, Celero and Follow-On and a voting agreement with Centennial HoldCo and Celero. See “Certain Relationships and Related Party Transactions—Registration Rights Agreement” and “Certain Relationships and Related Party Transactions —Voting Agreement.”
Since our formation and to date in 2016, our executive officers have been employees of Centennial Management, a wholly-owned subsidiary of Centennial HoldCo, and have provided services to Centennial HoldCo and Centennial OpCo pursuant to management services agreements between such entities. Prior to the completion of this offering, Centennial HoldCo will contribute its interests in Centennial Management to Centennial OpCo and our executive officers and the other employees providing services to us will become employees of a wholly-owned subsidiary of Centennial OpCo.
The Existing Investors
Following our corporate reorganization, the Existing Investors will consist of the following:
| Number of Shares Owned Before this Offering |
Shares to be Offered in this Offering |
Number of Shares Owned After this Offering | ||||
| Existing Investor Name: |
||||||
| Centennial Resource Development, LLC(1) |
||||||
| Celero Energy Company, LP(1) |
||||||
| NGP Centennial Follow-On LLC(2) |
||||||
|
|
|
| ||||
| Total |
||||||
|
|
|
|
132
Table of Contents
| (1) | In connection with this offering, we will enter into a voting agreement with Centennial HoldCo and Celero pursuant to which, among other things, Celero has agreed to vote its shares of our common stock as directed by Centennial HoldCo. See “Certain Relationships and Related Party Transactions—Voting Agreement.” |
| (2) | As part of the reorganization transactions, Follow-On will be recapitalized into a single class of equity with each member of Follow-On, including holders of the Follow-On incentive units, receiving a fixed percentage interest in Follow-On based on the distribution provisions contained in Follow-On’s limited liability company agreement and the implied equity value of Follow-On immediately prior to this offering, based on the aggregate number of shares of our common stock to be issued to Follow-On in connection with our corporate reorganization and the initial public offering price of our common stock in this offering. Promptly following the consummation of this offering, Follow-On intends to distribute all of its shares of our common stock and any cash received in respect of shares of our common stock it sells in this offering to its members on a pro-rata basis and then dissolve. See footnote (5) in “Principal and Selling Stockholders” for information regarding Follow-On’s members who are officers or directors of the Company or are expected to beneficially own more than 5% of our outstanding common stock after this offering. |
For more information on the ownership of our common stock by our principal and selling stockholders, see “Principal and Selling Stockholders.”
133
Table of Contents
CERTAIN RELATIONSHIPS AND RELATED PARTY TRANSACTIONS
Historical Transactions with Affiliates
The NGP Contributions
In August 2012, an affiliate of NGP contributed approximately $75 million in cash to Centennial OpCo in exchange for 50.5% of the initial membership interests in Centennial OpCo. During 2013, the same affiliate of NGP contributed an additional $115 million to Centennial OpCo for additional membership interests in Centennial OpCo. In 2014, the same affiliate of NGP contributed all of its membership interests in Centennial OpCo to Centennial HoldCo.
In April 2015, Centennial HoldCo contributed an additional $19.9 million to Centennial OpCo for additional membership interest in Centennial OpCo. Also in April 2015 and May 2015, Follow-On, a Delaware limited liability company controlled by NGP but the economic interests in which are owned by unaffiliated third party investors and management, contributed $28.2 million and $33.3 million, respectively, in cash to Centennial OpCo in exchange for the membership interests in Centennial OpCo. In September 2015, Follow-On and Centennial HoldCo contributed $22.7 million and $7.3 million, respectively, to Centennial OpCo in exchange for additional membership interests in Centennial OpCo.
Other Transactions with NGP Affiliates
In May 2016, Centennial OpCo acquired acreage in close proximity to our operating area in Reeves County, Texas and wellbore only rights in an uncompleted horizontal wellbore for approximately $9.8 million from Caird DB, LLC, an affiliate of NGP. See “Recent and Formation Transactions—Recent Acquisition—Reeves County Leasehold Acquisitions.”
In February 2014, Centennial OpCo entered into a 15-year gas gathering agreement with Atlantic Midstream, which has been renamed PennTex Permian, LLC, which terminates on April 1, 2029 and is subject to one-year extensions at either party’s election. At the time this agreement was entered into, Centennial OpCo had a 98.5% interest in Atlantic Midstream. In February 2014, subsequent to entry into this gas gathering agreement, Centennial OpCo sold its 98.5% interest in Atlantic Midstream to PennTex Midstream Partners, LLC, an affiliate of NGP, for net cash proceeds of approximately $71.8 million. In October 2014, the gas gathering agreement was amended to provide for construction by PennTex Permian, LLC of an expansion of the gathering system and a receipt point. Centennial OpCo has agreed to repay all construction costs of this expansion project, which totaled approximately $4.0 million, and pays PennTex Permian, LLC a minimum monthly fee of $7,000 per day until repayment is complete. As of March 31, 2016, Centennial OpCo has repaid approximately $2.6 million of the construction costs. In addition, PennTex Permian, LLC paid Centennial OpCo approximately $2.2 million, $1.2 million and $30,000 for purchases of residue gas and NGLs (net of gas gathering, processing and other fees) for the years ended December 31, 2014 and 2015 and the three months ended March 31, 2016, respectively.
In December 2014, Centennial OpCo sold 3,840 gross (1,845 net) acres in Ward County, Texas to Blackbeard Resources, LLC, an affiliate of NGP, for net cash proceeds of approximately $12.5 million. See “Recent and Formation Transactions—Recent Dispositions—Marston Disposition.”
Effective October 2014, Centennial OpCo entered into a Management Services Agreement with Centennial Management, a wholly-owned subsidiary of Centennial HoldCo, pursuant to which employees of Centennial Management provide their services to Centennial HoldCo and Centennial OpCo. Our executive officers are currently employees of Centennial Management. Prior to the completion of this offering, Centennial HoldCo will contribute its interests in Centennial Management to Centennial OpCo and our executive officers will become employees of a wholly-owned subsidiary of Centennial OpCo.
From time to time, Centennial OpCo obtains services related to its drilling and completion activities from affiliates of NGP. In particular, since 2014, Centennial OpCo has paid the following amounts to the following
134
Table of Contents
affiliates of NGP for such services: (i) approximately $0.3 million during the three months ended March 31, 2016 to Cretic Energy Services, LLC; (ii) approximately $1.2 million and approximately $2.2 million during the year ended December 31, 2015 and the three months ended March 31, 2016, respectively, to RockPile Energy Services, LLC; and (iii) approximately $1.7 million during the year ended December 31, 2014 to MS Energy Services.
During the year ended December 31, 2015 and the three months ended March 31, 2016, Centennial OpCo paid approximately $0.5 million and approximately $0.2 million to WildHorse Resources II, LLC, an affiliate of NGP, for certain oil and gas lease extensions.
The Combination
As described under “Recent and Formation Transactions—Formation Transactions—The Combination,” on October 15, 2014, Celero conveyed substantially all of its oil and natural gas properties and other assets to Centennial OpCo in exchange for membership interests in Centennial OpCo. Immediately following the completion of the Combination, Celero owned approximately 28% of Centennial OpCo. An affiliate of NGP, Natural Gas Partners VIII, L.P., owns over 90% of the membership interests in the general partner of Celero and approximately 33% of the limited partnership interests of Celero. Two of our directors, David Hayes and Christopher Ray, are also directors of Celero.
Corporate Reorganization
As described in “Recent and Formation Transactions—Formation Transactions—Our Corporate Reorganization,” in connection with this offering, we will complete certain reorganization transactions pursuant to which we will acquire, directly or indirectly, all of the interests in Centennial OpCo currently owned by each of Centennial HoldCo, Celero and Follow-On, in exchange for shares, shares and shares, respectively, of our common stock. Promptly following the consummation of this offering, Follow-On intends to distribute its shares of our common stock and any cash received in respect of our common stock that it sells in this offering to its members on a pro-rata basis.
Registration Rights Agreement
In connection with the closing of this offering, we will enter into a registration rights agreement with Centennial HoldCo, Celero and Follow-On. We have been informed that, shortly after the consummation of this offering, Follow-On intends to distribute all of its shares of our common stock and other assets (including any cash received in respect of shares of our common stock it sells in this offering) to its members on a pro rata basis, assign its rights and obligations under the registration rights agreement to its members and dissolve. Pursuant to the registration rights agreement, we have agreed to register the sale of shares of our common stock under certain circumstances.
Demand Rights
At any time after the 180 day lock-up period, as described in “Underwriting,” and subject to the limitations set forth below, each of Centennial HoldCo and Celero (or their permitted transferees) will have the right to require us by written notice to prepare and file a registration statement registering the offer and sale of a certain number of their shares of our common stock. Generally, we are required to provide notice of the request to certain other holders of our common stock who may, in certain circumstances, participate in the registration. Subject to certain exceptions, we will not be obligated to effect a demand registration within 90 days after the closing of any underwritten offering of shares of our common stock. Further, we are not obligated to effect:
| • | (i) through the third anniversary of the closing date of this offering, more than a total of four demand registrations or (ii) on or after the third anniversary of the closing date of this offering, more than one demand registration per calendar year, at the request of Centennial HoldCo (or its permitted transferee); and |
| • | more than a total of three demand registrations at the request of Celero (or its permitted transferee). |
135
Table of Contents
We will also not be obligated to effect any demand registration in which the anticipated aggregate offering price for our common stock included in such offering is less than $30 million. Once we are eligible to effect a registration on Form S-3, any such demand registration may be for a shelf registration statement. We will be required to use reasonable best efforts to maintain the effectiveness of any such registration statement until the earlier of (i) 180 days (or two years in the case of a shelf registration statement) after the effective date thereof or (B) the date on which all shares covered by such registration statement have been sold (subject to certain extensions).
In addition, each of Centennial HoldCo and Celero (or their permitted transferees) will have the right to require us, subject to certain limitations, to effect a distribution of any or all of their shares of our common stock by means of an underwritten offering. In general, any demand for an underwritten offering (other than the first requested underwritten offering made in respect of a prior demand registration and other than a requested underwritten offering made concurrently with a demand registration) shall constitute a demand request subject to the limitations set forth above.
Piggyback Rights
Subject to certain exceptions, if at any time we propose to register an offering of common stock or conduct an underwritten offering, whether or not for our own account, then we must notify Centennial HoldCo, Celero and Follow-On (or their permitted transferees) of such proposal to allow them to include a specified number of their shares of our common stock in that registration statement or underwritten offering, as applicable.
Conditions and Limitations; Expenses
These registration rights will be subject to certain conditions and limitations, including the right of the underwriters to limit the number of shares to be included in a registration and our right to delay or withdraw a registration statement under certain circumstances. We will generally pay all registration expenses in connection with our obligations under the registration rights agreement, regardless of whether a registration statement is filed or becomes effective.
Voting Agreement
In connection with this offering, we will enter into a voting agreement with Centennial HoldCo and Celero. Among other things, the voting agreement will provide that Celero will vote all of their shares of our common stock as directed by Centennial HoldCo. The voting agreement will also provide Centennial HoldCo with the right to designate up to three nominees to our board of directors, provided that such number of nominees shall be reduced to two, one and zero if Centennial HoldCo and Celero and their affiliates collectively own less than 35%, 15% and 5%, respectively, of the outstanding shares of our common stock. Pursuant to the voting agreement we, Centennial HoldCo and Celero will be required to take all necessary actions, to the fullest extent permitted by applicable law (including with respect to any fiduciary duties under Delaware law), to cause the election of the nominees designated by Centennial HoldCo. In addition, the voting agreement will provide that for so long as Centennial HoldCo and Celero and their affiliates own at least 15% of the outstanding shares of our common stock, Centennial HoldCo will have the right to cause any committee of our board of directors to include in its membership at least one director designated by Centennial HoldCo, except to the extent that such membership would violate applicable securities laws or stock exchange rules. The rights granted to Centennial HoldCo to designate directors are additive to and not intended to limit in any way the rights that Centennial HoldCo, Celero or any of their affiliates may have to nominate, elect or remove our directors under our certificate of incorporation, bylaws or the DGCL.
136
Table of Contents
Procedures for Approval of Related Party Transactions
Prior to the closing of this offering, we have not maintained a policy for approval of Related Party Transactions. A “Related Party Transaction” is a transaction, arrangement or relationship in which we or any of our subsidiaries was, is or will be a participant, the amount of which involved exceeds $120,000, and in which any Related Person had, has or will have a direct or indirect material interest. A “Related Person” means:
| • | any person who is, or at any time during the applicable period was, one of our executive officers or one of our directors; |
| • | any person who is known by us to be the beneficial owner of more than 5% of our common stock; |
| • | any immediate family member of any of the foregoing persons, which means any child, stepchild, parent, stepparent, spouse, sibling, mother-in-law, father-in-law, son-in-law, daughter-in-law, brother-in-law or sister-in-law of a director, executive officer or a beneficial owner of more than 5% of our common stock, and any person (other than a tenant or employee) sharing the household of such director, executive officer or beneficial owner of more than 5% of our common stock; and |
| • | any firm, corporation or other entity in which any of the foregoing persons is a partner or principal or in a similar position or in which such person has a 10% or greater beneficial ownership interest. |
We anticipate that our board of directors will adopt a written related party transactions policy prior to the completion of this offering. Pursuant to this policy, we expect that our audit committee will review all material facts of all Related Party Transactions.
137
Table of Contents
Upon completion of this offering, the authorized capital stock of Centennial Resource Development, Inc. will consist of shares of common stock, $0.01 par value per share, of which shares will be issued and outstanding, and shares of preferred stock, $0.01 par value per share, of which no shares will be issued and outstanding.
The following summary of the capital stock and amended and restated certificate of incorporation and amended and restated bylaws of Centennial Resource Development, Inc. does not purport to be complete and is qualified in its entirety by reference to the provisions of applicable law and to our amended and restated certificate of incorporation and amended and restated bylaws, which are filed as exhibits to the registration statement of which this prospectus is a part.
Common Stock
Except as provided by law or in a preferred stock designation, holders of common stock are entitled to one vote for each share held of record on all matters submitted to a vote of the stockholders, will have the exclusive right to vote for the election of directors and do not have cumulative voting rights. Except as otherwise required by law, holders of common stock are not entitled to vote on any amendment to the amended and restated certificate of incorporation (including any certificate of designations relating to any series of preferred stock) that relates solely to the terms of any outstanding series of preferred stock if the holders of such affected series are entitled, either separately or together with the holders of one or more other such series, to vote thereon pursuant to our amended and restated certificate of incorporation (including any certificate of designations relating to any series of preferred stock) or pursuant to the DGCL. Subject to prior rights and preferences that may be applicable to any outstanding shares or series of preferred stock, holders of common stock are entitled to receive ratably in proportion to the shares of common stock held by them such dividends (payable in cash, stock or otherwise), if any, as may be declared from time to time by our board of directors out of funds legally available for dividend payments. All outstanding shares of common stock are fully paid and non-assessable, and the shares of common stock to be issued upon completion of this offering will be fully paid and non-assessable.
The holders of common stock have no preferences or rights of conversion, exchange, pre-emption or other subscription rights. There are no redemption or sinking fund provisions applicable to common stock. In the event of any voluntary or involuntary liquidation, dissolution or winding-up of our affairs, holders of common stock will be entitled to share ratably in our assets in proportion to the shares of common stock held by them that are remaining after payment or provision for payment of all of our debts and obligations and after distribution in full of preferential amounts to be distributed to holders of outstanding shares of preferred stock, if any.
Preferred Stock
Our amended and restated certificate of incorporation will authorize our board of directors, subject to any limitations prescribed by law, without further stockholder approval, to establish and to issue from time to time one or more classes or series of preferred stock, par value $0.01 per share, covering up to an aggregate of shares of preferred stock. Each class or series of preferred stock will have the powers, preferences, rights, qualifications, limitations and restrictions determined by the board of directors, which may include, among others, dividend rights, liquidation preferences, voting rights, conversion rights, preemptive rights and redemption rights. Except as provided by law or in a preferred stock designation, the holders of preferred stock will not be entitled to vote at or receive notice of any meeting of stockholders.
138
Table of Contents
Anti-Takeover Effects of Provisions of Our Amended and Restated Certificate of Incorporation, Our Amended and Restated Bylaws and Delaware Law
Some provisions of Delaware law, our amended and restated certificate of incorporation and our amended and restated bylaws will contain provisions that could make the following transactions more difficult: acquisitions of us by means of a tender offer, a proxy contest or otherwise or removal of our incumbent officers and directors. These provisions may also have the effect of preventing changes in our management. It is possible that these provisions could make it more difficult to accomplish or could deter transactions that stockholders may otherwise consider to be in their best interest or in our best interests, including transactions that might result in a premium over the market price for our shares.
These provisions are expected to discourage coercive takeover practices and inadequate takeover bids. These provisions are also designed to encourage persons seeking to acquire control of us to first negotiate with us. We believe that the benefits of increased protection and our potential ability to negotiate with the proponent of an unfriendly or unsolicited proposal to acquire or restructure us outweigh the disadvantages of discouraging these proposals because, among other things, negotiation of these proposals could result in an improvement of their terms.
Delaware Law
Section 203 of the DGCL prohibits a Delaware corporation, including those whose securities are listed for trading on the NASDAQ, from engaging in any business combination with any interested stockholder for a period of three years following the date that the stockholder became an interested stockholder, unless:
| • | the transaction is approved by the board of directors before the date the interested stockholder attained that status; |
| • | upon consummation of the transaction that resulted in the stockholder becoming an interested stockholder, the interested stockholder owned at least 85% of the voting stock of the corporation outstanding at the time the transaction commenced; or |
| • | on or after such time the business combination is approved by the board of directors and authorized at a meeting of stockholders by at least two-thirds of the outstanding voting stock that is not owned by the interested stockholder. |
Under our amended and restated certificate of incorporation, we have elected not to be subject to the provisions of Section 203 of the DGCL.
Our Amended and Restated Certificate of Incorporation and Our Amended and Restated Bylaws
Provisions of our amended and restated certificate of incorporation and our amended and restated bylaws, which will become effective upon the closing of this offering, may delay or discourage transactions involving an actual or potential change in control or change in our management, including transactions in which stockholders might otherwise receive a premium for their shares, or transactions that our stockholders might otherwise deem to be in their best interests. Therefore, these provisions could adversely affect the price of our common stock.
Among other things, upon the completion of this offering, our amended and restated certificate of incorporation and amended and restated bylaws will:
| • | establish advance notice procedures with regard to stockholder proposals relating to the nomination of candidates for election as directors or new business to be brought before meetings of our stockholders. These procedures provide that notice of stockholder proposals must be timely given in writing to our corporate secretary prior to the meeting at which the action is to be taken. Generally, to be timely, notice must be received at our principal executive offices not less than 90 days nor more than 120 days prior to the first anniversary date of the annual meeting for the preceding year. Our amended and restated bylaws |
139
Table of Contents
| specify the requirements as to form and content of all stockholders’ notices. These requirements may preclude stockholders from bringing matters before the stockholders at an annual or special meeting; |
| • | provide our board of directors the ability to authorize undesignated preferred stock. This ability makes it possible for our board of directors to issue, without stockholder approval, preferred stock with voting or other rights or preferences that could impede the success of any attempt to change control of us. These and other provisions may have the effect of deferring hostile takeovers or delaying changes in control or management of our company; |
| • | provide that the authorized number of directors may be changed only by resolution of the board of directors; |
| • | provide that all vacancies, including newly created directorships, may, except as otherwise required by law or, if applicable, the rights of holders of a series of preferred stock, be filled by the affirmative vote of a majority of directors then in office, even if less than a quorum; |
| • | provide that our bylaws can be amended by the board of directors; and |
| • | at any time after a group that includes Centennial HoldCo and Celero no longer collectively own or control the voting of more than 50% of the outstanding shares of our common stock, |
| • | provide that all vacancies, including newly created directorships, may, except as otherwise required by law or, if applicable, the rights of holders of a series of preferred stock, only be filled by the affirmative vote of a majority of directors then in office, even if less than a quorum (prior to such time, vacancies may also be filled by stockholders holding a majority of the outstanding shares); |
| • | provide that any action required or permitted to be taken by the stockholders must be effected at a duly called annual or special meeting of stockholders and may not be effected by any consent in writing in lieu of a meeting of such stockholders, subject to the rights of the holders of any series of preferred stock with respect to such series (prior to such time, such actions may be taken without a meeting by written consent of holders of common stock having not less than the minimum number of votes that would be necessary to authorize such action at a meeting); |
| • | provide that our certificate of incorporation and bylaws may be amended by the affirmative vote of the holders of at least two-thirds of our then outstanding common stock (prior to such time, our certificate of incorporation and bylaws may be amended by the affirmative vote of the holders of a majority of our then outstanding common stock); |
| • | provide that special meetings of our stockholders may only be called by our board of directors pursuant to a resolution adopted by the affirmative vote of a majority of the total number of authorized directors whether or not there exist any vacancies in previously authorized directorships (prior to such time, a special meeting may also be called at the request of stockholders holding a majority of the outstanding shares entitled to vote); |
| • | provide for our board of directors to be divided into three classes of directors, with each class as nearly equal in number as possible, serving staggered three year terms, other than directors which may be elected by holders of preferred stock, if any. This system of electing and removing directors may tend to discourage a third party from making a tender offer or otherwise attempting to obtain control of us, because it generally makes it more difficult for stockholders to replace a majority of the directors; and |
| • | provide that the affirmative vote of the holders of at least 75% of the voting power of all then outstanding common stock entitled to vote generally in the election of directors, voting together as a single class, shall be required to remove any or all of the directors from office and such removal may only be for cause. |
140
Table of Contents
Corporate Opportunity
Under our amended and restated certificate of incorporation, to the extent permitted by law:
| • | NGP, Carlyle and their respective affiliates have the right to, and have no duty to abstain from, exercising such right to, conduct business with any business that is competitive or in the same line of business as us, do business with any of our clients or customers, or invest or own any interest publicly or privately in, or develop a business relationship with, any business that is competitive or in the same line of business as us; |
| • | if NGP, Carlyle or their respective affiliates acquire knowledge of a potential transaction that could be a corporate opportunity, they have no duty to offer such corporate opportunity to us; and |
| • | we have renounced any interest or expectancy in, or in being offered an opportunity to participate in, such corporate opportunities. |
Forum Selection
Our amended and restated certificate of incorporation will provide that unless we consent in writing to the selection of an alternative forum, the Court of Chancery of the State of Delaware will, to the fullest extent permitted by applicable law, be the sole and exclusive forum for:
| • | any derivative action or proceeding brought on our behalf; |
| • | any action asserting a claim of breach of a fiduciary duty owed by any of our directors, officers, employees or agents to us or our stockholders; |
| • | any action asserting a claim against us arising pursuant to any provision of the DGCL, our amended and restated certificate of incorporation or our bylaws; or |
| • | any action asserting a claim against us that is governed by the internal affairs doctrine, in each such case subject to such Court of Chancery having personal jurisdiction over the indispensable parties named as defendants therein. |
Our amended and restated certificate of incorporation will also provide that any person or entity purchasing or otherwise acquiring any interest in shares of our capital stock will be deemed to have notice of, and to have consented to, this forum selection provision. Although we believe these provisions will benefit us by providing increased consistency in the application of Delaware law for the specified types of actions and proceedings, the provisions may have the effect of discouraging lawsuits against our directors, officers, employees and agents. The enforceability of similar exclusive forum provisions in other companies’ certificates of incorporation has been challenged in legal proceedings, and it is possible that, in connection with one or more actions or proceedings described above, a court could rule that this provision in our amended and restated certificate of incorporation is inapplicable or unenforceable.
Limitation of Liability and Indemnification Matters
Our amended and restated certificate of incorporation will limit the liability of our directors for monetary damages for breach of their fiduciary duty as directors, except for liability that cannot be eliminated under the DGCL. Delaware law provides that directors of a company will not be personally liable for monetary damages for breach of their fiduciary duty as directors, except for liabilities:
| • | for any breach of their duty of loyalty to us or our stockholders; |
| • | for acts or omissions not in good faith or which involve intentional misconduct or a knowing violation of law; |
141
Table of Contents
| • | for unlawful payment of dividend or unlawful stock repurchase or redemption, as provided under Section 174 of the DGCL; or |
| • | for any transaction from which the director derived an improper personal benefit. |
Any amendment, repeal or modification of these provisions will be prospective only and would not affect any limitation on liability of a director for acts or omissions that occurred prior to any such amendment, repeal or modification.
Our amended and restated bylaws will also provide that we will indemnify our directors and officers to the fullest extent permitted by Delaware law. Our amended and restated bylaws also will permit us to purchase insurance on behalf of any officer, director, employee or other agent for any liability arising out of that person’s actions as our officer, director, employee or agent, regardless of whether Delaware law would permit indemnification. We intend to enter into indemnification agreements with each of our current and future directors and officers. These agreements will require us to indemnify these individuals to the fullest extent permitted under Delaware law against liability that may arise by reason of their service to us, and to advance expenses incurred as a result of any proceeding against them as to which they could be indemnified. We believe that the limitation of liability provision that will be in our amended and restated certificate of incorporation and the indemnification agreements will facilitate our ability to continue to attract and retain qualified individuals to serve as directors and officers.
For a description of registration rights with respect to our common stock, see “Certain Relationships and Related Party Transactions—Registration Rights Agreement.”
Transfer Agent and Registrar
The transfer agent and registrar for our common stock is American Stock Transfer & Trust Company, LLC.
Listing
We have applied to list our common stock on the NASDAQ under the symbol “CDEV.”
142
Table of Contents
SHARES ELIGIBLE FOR FUTURE SALE
Prior to this offering, there has been no public market for our common stock. Future sales of our common stock in the public market, or the availability of such shares for sale in the public market, could adversely affect the market price of our common stock prevailing from time to time. As described below, only a limited number of shares will be available for sale shortly after this offering due to contractual and legal restrictions on resale. Nevertheless, sales of a substantial number of shares of our common stock in the public market after such restrictions lapse, or the perception that those sales may occur, could adversely affect the prevailing market price of our common stock at such time and our ability to raise equity-related capital at a time and price we deem appropriate.
Sales of Restricted Shares
Upon the closing of this offering, we will have outstanding an aggregate of shares of common stock. Of these shares, all of the shares of common stock to be sold in this offering will be freely tradable without restriction or further registration under the Securities Act, unless the shares are held by any of our “affiliates” as such term is defined in Rule 144 under the Securities Act. All remaining shares of common stock held by existing stockholders will be deemed “restricted securities” as such term is defined under Rule 144. The restricted securities were issued and sold by us in private transactions and are eligible for public sale only if registered under the Securities Act or if they qualify for an exemption from registration under Rule 144 or Rule 701 under the Securities Act, which rules are summarized below.
As a result of the lock-up agreements described below and the provisions of Rule 144 and Rule 701 under the Securities Act, the shares of our common stock (excluding the shares to be sold in this offering) that will be available for sale in the public market are as follows:
| • | no shares will be eligible for sale on the date of this prospectus or prior to 180 days after the date of this prospectus; |
| • | shares will be eligible for sale upon the expiration of the lock-up agreements, beginning 180 days after the date of this prospectus (subject to extension) and when permitted under Rule 144 or Rule 701; and |
| • | shares will be eligible for sale, upon exercise of vested options, upon the expiration of the lock-up agreements, beginning 180 days after the date of this prospectus (subject to extension). |
Lock-up Agreements
We, all of our directors and executive officers, the selling stockholders and certain of our stockholders and employees have agreed or will agree that, subject to certain exceptions and under certain conditions, for a period of 180 days after the date of this prospectus, we and they will not, without the prior written consent of Credit Suisse Securities (USA) LLC, dispose of or hedge any shares or any securities convertible into or exchangeable for shares of our capital stock. See “Underwriting” for a description of these lock-up provisions.
Rule 144
In general, under Rule 144 under the Securities Act as currently in effect, a person (or persons whose shares are aggregated) who is not deemed to have been an affiliate of ours at any time during the three months preceding a sale, and who has beneficially owned restricted securities within the meaning of Rule 144 for a least sixth months (including any period of consecutive ownership of preceding non-affiliated holders) would be entitled to sell those shares, subject only to the availability of current public information about us. A non-affiliated person who has beneficially owned restricted securities within the meaning of Rule 144 for at least one year would be entitled to sell those shares without regard to the provisions of Rule 144.
143
Table of Contents
A person (or persons whose shares are aggregated) who is deemed to be an affiliate of ours and who has beneficially owned restricted securities within the meaning of Rule 144 for at least six months would be entitled to sell within any three-month period a number of shares that does not exceed the greater of one percent of the then outstanding shares of our common stock or the average weekly trading volume of our common stock reported through the NASDAQ during the four calendar weeks preceding the filing of notice of the sale. Such sales are also subject to certain manner of sale provisions, notice requirements and the availability of current public information about us.
Rule 701
In general, under Rule 701 under the Securities Act, any of our employees, directors, officers, consultants or advisors who purchase or otherwise receive shares from us in connection with a compensatory stock or option plan or other written agreement before the effective date of this offering are entitled to sell such shares 90 days after the effective date of this offering in reliance on Rule 144, without having to comply with the holding period requirement of Rule 144 and, in the case of non-affiliates, without having to comply with the public information, volume limitation or notice filing provisions of Rule 144. The SEC has indicated that Rule 701 will apply to typical stock options granted by an issuer before it becomes subject to the reporting requirements of the Exchange Act, along with the shares acquired upon exercise of such options, including exercises after the date of this prospectus.
Stock Issued Under Employee Plans
We intend to file a registration statement on Form S-8 under the Securities Act to register shares issuable under the 2016 Long Term Incentive Plan. This registration statement on Form S-8 is expected to be filed following the effective date of the registration statement of which this prospectus is a part and will be effective upon filing. Accordingly, shares registered under such registration statement may be made available for sale in the open market following the effective date, unless such shares are subject to vesting restrictions with us, Rule 144 restrictions applicable to our affiliates or the lock-up restrictions described above.
144
Table of Contents
MATERIAL U.S. FEDERAL INCOME TAX CONSIDERATIONS FOR NON-U.S. HOLDERS
The following is a summary of the material U.S. federal income tax considerations related to the purchase, ownership and disposition of our common stock by a non-U.S. holder (as defined below), that holds our common stock as a “capital asset” (generally, property held for investment). This summary is based on the provisions of the Code, U.S. Treasury regulations and administrative rulings and judicial decisions, all as in effect on the date hereof, and all of which are subject to change, possibly with retroactive effect. We have not sought any ruling from the Internal Revenue Service (“IRS”) with respect to the statements made and the conclusions reached in the following summary, and there can be no assurance that the IRS or a court will agree with such statements and conclusions.
This summary does not address all aspects of U.S. federal income taxation that may be relevant to non-U.S. holders in light of their personal circumstances. In addition, this summary does not address the Medicare tax on certain investment income, U.S. federal gift or estate tax laws, any state, local or non-U.S. tax laws or any tax treaties. This summary also does not address tax considerations applicable to investors that may be subject to special treatment under the U.S. federal income tax laws, such as (without limitation):
| • | banks, insurance companies or other financial institutions; |
| • | tax-exempt or governmental organizations; |
| • | qualified foreign pension funds; |
| • | dealers in securities or foreign currencies; |
| • | traders in securities that use the mark-to-market method of accounting for U.S. federal income tax purposes; |
| • | persons subject to the alternative minimum tax; |
| • | partnerships or other pass-through entities for U.S. federal income tax purposes or holders of interests therein; |
| • | persons deemed to sell our common stock under the constructive sale provisions of the Code; |
| • | persons that acquired our common stock through the exercise of employee stock options or otherwise as compensation or through a tax-qualified retirement plan; |
| • | certain former citizens or long-term residents of the United States; |
| • | real estate investment trusts or regulated investment companies; and |
| • | persons that hold our common stock as part of a straddle, appreciated financial position, synthetic security, hedge, conversion transaction or other integrated investment or risk reduction transaction. |
PROSPECTIVE INVESTORS ARE ENCOURAGED TO CONSULT THEIR TAX ADVISORS WITH RESPECT TO THE APPLICATION OF THE U.S. FEDERAL INCOME TAX LAWS TO THEIR PARTICULAR SITUATION, AS WELL AS ANY TAX CONSEQUENCES OF THE PURCHASE, OWNERSHIP AND DISPOSITION OF OUR COMMON STOCK ARISING UNDER THE U.S. FEDERAL GIFT OR ESTATE TAX LAWS OR UNDER THE LAWS OF ANY STATE, LOCAL, NON-U.S. OR OTHER TAXING JURISDICTION OR UNDER ANY APPLICABLE TAX TREATY.
Non-U.S. Holder Defined
For purposes of this discussion, a “non-U.S. holder” is a beneficial owner of our common stock that is not for U.S. federal income tax purposes a partnership or any of the following:
| • | an individual who is a citizen or resident of the United States; |
| • | a corporation (or other entity treated as a corporation for U.S. federal income tax purposes) created or organized in or under the laws of the United States, any state thereof or the District of Columbia; |
145
Table of Contents
| • | an estate the income of which is subject to U.S. federal income tax regardless of its source; or |
| • | a trust (i) whose administration is subject to the primary supervision of a U.S. court and which has one or more United States persons who have the authority to control all substantial decisions of the trust or (ii) which has made a valid election under applicable U.S. Treasury regulations to be treated as a United States person. |
If a partnership (including an entity or arrangement treated as a partnership for U.S. federal income tax purposes) holds our common stock, the tax treatment of a partner in the partnership generally will depend upon the status of the partner, the activities of the partnership and certain determinations made at the partner level. Accordingly, we urge partners in partnerships (including entities or arrangements treated as partnerships for U.S. federal income tax purposes) considering the purchase of our common stock to consult their tax advisors regarding the U.S. federal income tax considerations of the purchase, ownership and disposition of our common stock by such partnership.
Distributions
As described in the section entitled “Dividend Policy,” we do not plan to make any distributions on our common stock for the foreseeable future. However, if we do make distributions of cash or property on our common stock, those distributions will constitute dividends for U.S. federal income tax purposes to the extent paid from our current or accumulated earnings and profits, as determined under U.S. federal income tax principles. To the extent those distributions exceed our current and accumulated earnings and profits, the distributions will be treated as a non-taxable return of capital to the extent of the non-U.S. holder’s tax basis in our common stock and thereafter as capital gain from the sale or exchange of such common stock. See “—Gain on Disposition of Common Stock.” Subject to the withholding rules under FATCA (as defined below) and with respect to effectively connected dividends, each of which is discussed below, any distribution made to a non-U.S. holder on our common stock generally will be subject to U.S. withholding tax at a rate of 30% of the gross amount of the distribution unless an applicable income tax treaty provides for a lower rate. To receive the benefit of a reduced treaty rate, a non-U.S. holder must provide the applicable withholding agent with an IRS Form W-8BEN or IRS Form W-8BEN-E (or other applicable or successor form) certifying qualification for the reduced rate.
Dividends paid to a non-U.S. holder that are effectively connected with a trade or business conducted by the non-U.S. holder in the United States (and, if required by an applicable income tax treaty, are treated as attributable to a permanent establishment maintained by the non-U.S. holder in the United States) generally will be taxed on a net income basis at the rates and in the manner generally applicable to United States persons (as defined under the Code). Such effectively connected dividends will not be subject to U.S. withholding tax if the non-U.S. holder satisfies certain certification requirements by providing the applicable withholding agent a properly executed IRS Form W-8ECI certifying eligibility for exemption. If the non-U.S. holder is a non-U.S. corporation, it may also be subject to a branch profits tax (at a 30% rate or such lower rate as specified by an applicable income tax treaty) on its effectively connected earnings and profits (as adjusted for certain items), which will include effectively connected dividends.
Gain on Disposition of Common Stock
Subject to the discussion below under “—Additional Withholding Requirements under FATCA,” a non-U.S. holder generally will not be subject to U.S. federal income tax on any gain realized upon the sale or other disposition of our common stock unless:
| • | the non-U.S. holder is an individual who is present in the United States for a period or periods aggregating 183 days or more during the calendar year in which the sale or disposition occurs and certain other conditions are met; |
146
Table of Contents
| • | the gain is effectively connected with a trade or business conducted by the non-U.S. holder in the United States (and, if required by an applicable income tax treaty, is attributable to a permanent establishment maintained by the non-U.S. holder in the United States); or |
| • | our common stock constitutes a United States real property interest by reason of our status as a United States real property holding corporation (“USRPHC”) for U.S. federal income tax purposes. |
A non-U.S. holder described in the first bullet point above will be subject to U.S. federal income tax at a rate of 30% (or such lower rate as specified by an applicable income tax treaty) on the amount of such gain, which generally may be offset by U.S. source capital losses.
A non-U.S. holder whose gain is described in the second bullet point above or, subject to the exceptions described in the next paragraph, the third bullet point above generally will be taxed on a net income basis at the rates and in the manner generally applicable to United States persons (as defined under the Code) unless an applicable income tax treaty provides otherwise. If the non-U.S. holder is a corporation, it may also be subject to a branch profits tax (at a 30% rate or such lower rate as specified by an applicable income tax treaty) on its effectively connected earnings and profits (as adjusted for certain items), which will include the gain described in the second bullet point above.
Generally, a corporation is a USRPHC if the fair market value of its United States real property interests equals or exceeds 50% of the sum of the fair market value of its worldwide real property interests and its other assets used or held for use in a trade or business. We believe that we currently are, and expect to remain for the foreseeable future, a USRPHC for U.S. federal income tax purposes. However, as long as our common stock continues to be regularly traded on an established securities market, only a non-U.S. holder that actually or constructively owns, or owned at any time during the shorter of the five-year period ending on the date of the disposition or the non-U.S. holder’s holding period for the common stock, more than 5% of our common stock will be taxable on gain realized on the disposition of our common stock as a result of our status as a USRPHC. If our common stock were not considered to be so regularly traded during the calendar year in which the relevant disposition by a non-U.S. holder occurs, such holder (regardless of the percentage of our common stock owned) would be subject to U.S. federal income tax on a taxable disposition of our common stock (as described in the preceding paragraph), and a 15% withholding tax would apply to the gross proceeds from such disposition.
Non-U.S. holders should consult their tax advisors with respect to the application of the foregoing rules to their ownership and disposition of our common stock.
Backup Withholding and Information Reporting
Any dividends paid to a non-U.S. holder must be reported annually to the IRS and to the non-U.S. holder. Copies of these information returns may be made available to the tax authorities in the country in which the non-U.S. holder resides or is established. Payments of dividends to a non-U.S. holder generally will not be subject to backup withholding if the non-U.S. holder establishes an exemption by properly certifying its non-U.S. status on an IRS Form W-8BEN, IRS Form W-8BEN-E or other appropriate version of IRS Form W-8.
Payments of the proceeds from a sale or other disposition by a non-U.S. holder of our common stock effected by or through a U.S. office of a broker generally will be subject to information reporting and backup withholding (at the applicable rate) unless the non-U.S. holder establishes an exemption by properly certifying its non-U.S. status on an IRS Form W-8BEN, IRS Form W-8BEN-E or other appropriate version of IRS Form W-8 and certain other conditions are met. Information reporting and backup withholding generally will not apply to any payment of the proceeds from a sale or other disposition of our common stock effected outside the United States by a non-U.S. office of a broker. However, unless such broker has documentary evidence in its records that the holder is not a United States person and certain other conditions are met, or the non-U.S. holder otherwise establishes an exemption, information reporting will apply to a payment of the proceeds of the disposition of our common stock effected outside the United States by such a broker if it has certain relationships within the United States.
147
Table of Contents
Backup withholding is not an additional tax. Rather, the U.S. income tax liability (if any) of persons subject to backup withholding will be reduced by the amount of tax withheld. If backup withholding results in an overpayment of taxes, a refund may be obtained, provided that the required information is timely furnished to the IRS.
Additional Withholding Requirements under FATCA
Sections 1471 through 1474 of the Code, and the Treasury regulations and administrative guidance issued thereunder (“FATCA”), impose a 30% withholding tax on any dividends paid on our common stock and on the gross proceeds from a disposition of our common stock (if such disposition occurs after December 31, 2018), in each case if paid to a “foreign financial institution” or a “non-financial foreign entity” (each as defined in the Code) (including, in some cases, when such foreign financial institution or non-financial foreign entity is acting as an intermediary), unless (i) in the case of a foreign financial institution, such institution enters into an agreement with the U.S. government to withhold on certain payments, and to collect and provide to the U.S. tax authorities substantial information regarding U.S. account holders of such institution (which includes certain equity and debt holders of such institution, as well as certain account holders that are non-U.S. entities with U.S. owners); (ii) in the case of a non-financial foreign entity, such entity certifies that it does not have any “substantial United States owners” (as defined in the Code) or provides the applicable withholding agent with a certification identifying the direct and indirect substantial United States owners of the entity (in either case, generally on an IRS Form W-8BEN-E); or (iii) the foreign financial institution or non-financial foreign entity otherwise qualifies for an exemption from these rules and provides appropriate documentation (such as an IRS Form W-8BEN-E). Foreign financial institutions located in jurisdictions that have an intergovernmental agreement with the United States governing these rules may be subject to different rules. Under certain circumstances, a holder might be eligible for refunds or credits of such taxes.
INVESTORS CONSIDERING THE PURCHASE OF OUR COMMON STOCK ARE URGED TO CONSULT THEIR OWN TAX ADVISORS REGARDING THE APPLICATION OF THE U.S. FEDERAL INCOME TAX LAWS TO THEIR PARTICULAR SITUATIONS AND THE APPLICABILITY AND EFFECT OF U.S. FEDERAL GIFT AND ESTATE TAX LAWS AND ANY STATE, LOCAL OR NON-U.S. TAX LAWS AND TAX TREATIES.
148
Table of Contents
Under the terms and subject to the conditions contained in an underwriting agreement dated , we and the selling stockholders have agreed to sell to the underwriters named below, for whom Credit Suisse Securities (USA) LLC and Barclays Capital Inc. are acting as representatives, the following respective numbers of shares of common stock:
| Underwriter |
Number of Shares | |
| Credit Suisse Securities (USA) LLC |
||
| Barclays Capital Inc. |
||
|
| ||
| Total |
||
|
|
The underwriting agreement provides that the underwriters are obligated to purchase all the shares of common stock in the offering if any are purchased, other than those shares covered by the over-allotment option described below. The underwriting agreement also provides that if an underwriter defaults, the purchase commitments of non-defaulting underwriters may be increased or the offering may be terminated.
We and the selling stockholders have agreed to indemnify the underwriters and certain of their controlling persons against certain liabilities, including liabilities under the Securities Act, and to contribute to payments that the underwriters may be required to make in respect of those liabilities.
The selling stockholders have granted to the underwriters a 30-day option to purchase on a pro rata basis up to additional shares at the initial public offering price less the underwriting discounts and commissions. The option may be exercised only to cover any over-allotments of common stock.
The selling stockholders are deemed under federal securities laws to be underwriters with respect to the shares of common stock they are offering hereby and any shares of common stock that they may sell pursuant to the underwriters’ option to purchase additional shares of our common stock.
The underwriters propose to offer the shares of common stock initially at the public offering price on the cover page of this prospectus and to selling group members at that price less a selling concession of $ per share. The underwriters and selling group members may allow a discount of $ per share on sales to other broker/dealers. After the initial public offering, the representatives may change the public offering price and concession and discount to other broker/dealers.
The following table summarizes the underwriting discounts and commissions we and the selling stockholders will pay:
| Per Share | Total | |||||||||||||||
| Without Over-allotment |
With Over-allotment |
Without Over-allotment |
With Over-allotment |
|||||||||||||
| Underwriting discounts and commissions paid by us |
$ | $ | $ | $ | ||||||||||||
| Underwriting discounts and commissions paid by selling stockholders |
$ | $ | $ | $ | ||||||||||||
The expenses of this offering that are payable by us are estimated to be approximately $ million (excluding underwriting discounts and commissions). We have agreed to pay certain expenses incurred by the selling stockholders in connection with this offering, other than the underwriting discounts and commissions.
The representatives have informed us that they do not expect sales to accounts over which the underwriters have discretionary authority to exceed 5% of the shares of common stock being offered.
149
Table of Contents
We have agreed that we will not offer, sell, contract to sell, pledge or otherwise dispose of, directly or indirectly, or file with the SEC a registration statement under the Securities Act relating to, any shares of our common stock or securities convertible into or exchangeable or exercisable for any shares of our common stock, or publicly disclose the intention to make any offer, sale, pledge, disposition or filing, without the prior written consent of Credit Suisse Securities (USA) LLC for a period of 180 days after the date of this prospectus.
Our officers and directors and the selling stockholders have agreed that they will not offer, sell, contract to sell, pledge or otherwise dispose of, directly or indirectly, any shares of our common stock or securities convertible into or exchangeable or exercisable for any shares of our common stock, enter into a transaction that would have the same effect, or enter into any swap, hedge or other arrangement that transfers, in whole or in part, any of the economic consequences of ownership of our common stock, whether any of these transactions are to be settled by delivery of our common stock or other securities, in cash or otherwise, or publicly disclose the intention to make any offer, sale, pledge or disposition, or to enter into any transaction, swap, hedge or other arrangement, without, in each case, the prior written consent of Credit Suisse Securities (USA) LLC for a period of 180 days after the date of this prospectus; provided, however, that Follow-On will be permitted to make a pro rata distribution of its shares of our common stock to its members, who shall agree to be subject to the restrictions described in this paragraph; provided, further, however, that such members who are individuals who are not executive officers or directors of the Company will not be subject to the restrictions described in this paragraph.
The underwriters have reserved for sale at the initial public offering price up to shares of the common stock for employees, directors and other persons associated with us who have expressed an interest in purchasing common stock in the offering. The number of shares available for sale to the general public in the offering will be reduced to the extent these persons purchase the reserved shares. Any reserved shares not so purchased will be offered by the underwriters to the general public on the same terms as the other shares.
We have applied to list the shares of common stock on the NASDAQ under the symbol “CDEV.”
Prior to this offering, there has been no public market for our common stock. The initial public offering price was determined by negotiations among us and the representatives and will not necessarily reflect the market price of the common stock following this offering. The principal factors considered included:
| • | the information presented in this prospectus and otherwise available to the underwriters; |
| • | the history of, and prospects for, the industry in which we will compete; |
| • | the ability of our management; |
| • | the prospects for our future earnings; |
| • | the present state of our development, results of operations and our current financial condition; |
| • | the general condition of the securities markets at the time of this offering; and |
| • | the recent market prices of, and the demand for, publicly traded common stock of generally comparable companies. |
We cannot assure you that the initial public offering price will correspond to the price at which the common stock will trade in the public market subsequent to this offering or that an active trading market for the common stock will develop and continue after this offering.
In connection with this offering, the underwriters may engage in stabilizing transactions, over-allotment transactions, syndicate covering transactions, and penalty bids.
| • | Stabilizing transactions permit bids to purchase the underlying security so long as the stabilizing bids do not exceed a specified maximum. |
| • | Over-allotment involves sales by the underwriters of shares in excess of the number of shares the underwriters are obligated to purchase, which creates a syndicate short position. The short position may |
150
Table of Contents
| be either a covered short position or a naked short position. In a covered short position, the number of shares over-allotted by the underwriters is not greater than the number of shares that they may purchase in the over-allotment option. In a naked short position, the number of shares involved is greater than the number of shares in the over-allotment option. The underwriters may close out any covered short position by either exercising their over-allotment option and/or purchasing shares in the open market. |
| • | Syndicate covering transactions involve purchases of the common stock in the open market after the distribution has been completed in order to cover syndicate short positions. In determining the source of shares to close out the short position, the underwriters will consider, among other things, the price of shares available for purchase in the open market as compared to the price at which they may purchase shares through the over-allotment option. If the underwriters sell more shares than could be covered by the over-allotment option, a naked short position, the position can only be closed out by buying shares in the open market. A naked short position is more likely to be created if the underwriters are concerned that there could be downward pressure on the price of the shares in the open market after pricing that could adversely affect investors who purchase in the offering. |
| • | Penalty bids permit the representatives to reclaim a selling concession from a syndicate member when the common stock originally sold by the syndicate member is purchased in a stabilizing or syndicate covering transaction to cover syndicate short positions. |
These stabilizing transactions, syndicate covering transactions and penalty bids may have the effect of raising or maintaining the market price of our common stock or preventing or retarding a decline in the market price of the common stock. As a result, the price of our common stock may be higher than the price that might otherwise exist in the open market. These transactions may be effected on the NASDAQ or otherwise and, if commenced, may be discontinued at any time.
A prospectus in electronic format may be made available on the web sites maintained by one or more of the underwriters, or selling group members, if any, participating in this offering and one or more of the underwriters participating in this offering may distribute prospectuses electronically. The representatives may agree to allocate a number of shares to underwriters and selling group members for sale to their online brokerage account holders. Internet distributions will be allocated by the underwriters and selling group members that will make internet distributions on the same basis as other allocations.
Other Relationships
The underwriters and certain of their affiliates are full service financial institutions engaged in various activities, which may include securities trading, commercial and investment banking, financial advisory, investment management, investment research, principal investment, hedging, financing and brokerage activities. The underwriters and certain of their affiliates have, from time to time, performed, and may in the future perform, various commercial and investment banking and financial advisory services for us and our affiliates, for which they received or may in the future receive customary fees and expenses.
In the ordinary course of their various business activities, the underwriters and certain of their affiliates may make or hold a broad array of investments and actively trade debt and equity securities (or related derivative securities) and financial instruments (including bank loans) for their own account and for the accounts of their customers, and such investment and securities activities may involve securities and/or instruments of ours or our affiliates. The underwriters and certain of their affiliates may also communicate independent investment recommendations, market color or trading ideas and/or publish or express independent research views in respect of such securities or instruments and may at any time hold, or recommend to clients that they acquire, long and/ or short positions in such securities and instruments.
151
Table of Contents
Selling Restrictions
This prospectus does not constitute an offer to sell to, or a solicitation of an offer to buy from, anyone in any country or jurisdiction (i) in which such an offer or solicitation is not authorized; (ii) in which any person making such offer or solicitation is not qualified to do so; or (iii) in which any such offer or solicitation would otherwise be unlawful. No action has been taken that would, or is intended to, permit a public offer of the shares of our common stock or possession or distribution of this prospectus or any other offering or publicity material relating to the shares of our common stock in any country or jurisdiction (other than the United States) where any such action for that purpose is required. Accordingly, each underwriter has undertaken that it will not, directly or indirectly, offer or sell any shares of our common stock or have in its possession, distribute or publish any prospectus, form of application, advertisement or other document or information in any country or jurisdiction except under circumstances that will, to the best of its knowledge and belief, result in compliance with any applicable laws and regulations and all offers and sales of shares of our common stock by it will be made on the same terms.
European Economic Area
In relation to each Member State of the European Economic Area that has implemented the Prospectus Directive (each, a “Relevant Member State”), an offer to the public of any common stock that are the subject of the offering contemplated herein may not be made in that Relevant Member State, except that an offer to the public in that Relevant Member State of any common stock may be made at any time under the following exemptions under the Prospectus Directive, if they have been implemented in that Relevant Member State:
| • | to legal entities that are qualified investors as defined under the Prospectus Directive; |
| • | by the underwriters to fewer than 100, or, if the Relevant Member State has implemented the relevant provisions of the 2010 PD Amending Directive, 150, natural or legal persons (other than qualified investors as defined in the Prospectus Directive), as permitted under the Prospectus Directive, subject to obtaining the prior consent of the representatives of the underwriters for any such offer; or |
| • | in any other circumstances falling within Article 3(2) of the Prospectus Directive, |
provided that no such offer of common stock shall result in a requirement for us, the selling stockholders or any underwriter to publish a prospectus pursuant to Article 3 of the Prospectus Directive or supplement a prospectus pursuant to Article 16 of the Prospectus Directive.
Each person in a Relevant Member State who receives any communication in respect of, or who acquires any common stock under, the offers contemplated here in this prospectus will be deemed to have represented, warranted and agreed to and with each underwriter, the selling stockholders and us that:
| • | it is a qualified investor as defined under the Prospectus Directive; and |
| • | in the case of any common stock acquired by it as a financial intermediary, as that term is used in Article 3(2) of the Prospectus Directive, (i) the common stock acquired by it in the offering have not been acquired on behalf of, nor have they been acquired with a view to their offer or resale to, persons in any Relevant Member State other than qualified investors, as that term is defined in the Prospectus Directive, or in the circumstances in which the prior consent of the representatives of the underwriters has been given to the offer or resale or (ii) where common stock have been acquired by it on behalf of persons in any Relevant Member State other than qualified investors, the offer of such common stock to it is not treated under the Prospectus Directive as having been made to such persons. |
For the purposes of this representation and the provision above, the expression an “offer of common stock to the public” in relation to any common stock in any Relevant Member State means the communication in any form and by any means of sufficient information on the terms of the offer and any common stock to be offered so
152
Table of Contents
as to enable an investor to decide to purchase or subscribe for the common stock, as the same may be varied in that Relevant Member State by any measure implementing the Prospectus Directive in that Relevant Member State, the expression “Prospectus Directive” means Directive 2003/71/EC (and amendments thereto, including the 2010 PD Amending Directive, to the extent implemented in the Relevant Member State), and includes any relevant implementing measure in each Relevant Member State and the expression “2010 PD Amending Directive” means Directive 2010/73/EU.
United Kingdom
This prospectus has only been communicated or caused to have been communicated and will only be communicated or caused to be communicated as an invitation or inducement to engage in investment activity (within the meaning of Section 21 of the Financial Services and Markets Act of 2000 (the “FSMA”)) as received in connection with the issue or sale of the common stock in circumstances in which Section 21(1) of the FSMA does not apply to us. All applicable provisions of the FSMA will be complied with in respect to anything done in relation to the common stock in, from or otherwise involving the United Kingdom.
Notice to Prospective Investors in Switzerland
This prospectus does not constitute an issue prospectus pursuant to Article 652a or Article 1156 of the Swiss Code of Obligations (“CO”) and the shares will not be listed on the SIX Swiss Exchange. Therefore, this prospectus may not comply with the disclosure standards of the CO and/or the listing rules (including any prospectus schemes) of the SIX Swiss Exchange. Accordingly, the shares may not be offered to the public in or from Switzerland, but only to a selected and limited circle of investors, which do not subscribe to the shares with a view to distribution.
Notice to Canadian Residents
Resale Restrictions
The distribution of shares of common stock in Canada is being made only in the provinces of Ontario, Quebec, Alberta and British Columbia on a private placement basis exempt from the requirement that we and the selling stockholders prepare and file a prospectus with the securities regulatory authorities in each province where trades of these securities are made. Any resale of the common stock in Canada must be made under applicable securities laws which may vary depending on the relevant jurisdiction, and which may require resales to be made under available statutory exemptions or under a discretionary exemption granted by the applicable Canadian securities regulatory authority. Purchasers are advised to seek legal advice prior to any resale of the securities.
Representations of Canadian Purchasers
By purchasing shares of our common stock in Canada and accepting delivery of a purchase confirmation, a purchaser is representing to us, the selling stockholders and the dealer from whom the purchase confirmation is received that:
| • | the purchaser is entitled under applicable provincial securities laws to purchase the shares of common stock without the benefit of a prospectus qualified under those securities laws as it is an “accredited investor” as defined under National Instrument 45-106—Prospectus Exemptions, |
| • | the purchaser is a “permitted client” as defined in National Instrument 31-103—Registration Requirements, Exemptions and Ongoing Registrant Obligations, |
| • | where required by law, the purchaser is purchasing as principal and not as agent, and |
| • | the purchaser has reviewed the text above under Resale Restrictions. |
153
Table of Contents
Conflicts of Interest
Canadian purchasers are hereby notified that the underwriters are relying on the exemption set out in section 3A.3 or 3A.4, if applicable, of National Instrument 33-105—Underwriting Conflicts from having to provide certain conflict of interest disclosure in this document.
Statutory Rights of Action
Securities legislation in certain provinces or territories of Canada may provide a purchaser with remedies for rescission or damages if the offering memorandum (including any amendment thereto) such as this document contains a misrepresentation, provided that the remedies for rescission or damages are exercised by the purchaser within the time limit prescribed by the securities legislation of the purchaser’s province or territory. The purchaser of these securities in Canada should refer to any applicable provisions of the securities legislation of the purchaser’s province or territory for particulars of these rights or consult with a legal advisor.
Enforcement of Legal Rights
All of our directors and officers as well as the experts named herein and the selling stockholders may be located outside of Canada and, as a result, it may not be possible for Canadian purchasers to effect service of process within Canada upon us or those persons. All or a substantial portion of our assets and the assets of those persons may be located outside of Canada and, as a result, it may not be possible to satisfy a judgment against us or those persons in Canada or to enforce a judgment obtained in Canadian courts against us or those persons outside of Canada.
Taxation and Eligibility for Investment
CANADIAN PERSONS CONSIDERING THE PURCHASE OF OUR COMMON STOCK ARE URGED TO CONSULT THEIR OWN LEGAL AND TAX ADVISORS REGARDING THE U.S. AND CANADIAN LEGAL AND TAX CONSEQUENCES OF AN INVESTMENT IN OUR SHARES OF COMMON STOCK AND THE APPLICATION OF SUCH LAWS TO THEIR PARTICULAR SITUATIONS.
154
Table of Contents
The validity of our common stock offered by this prospectus will be passed upon for us by Vinson & Elkins L.L.P., Houston, Texas. Certain legal matters in connection with this offering will be passed upon for the underwriters by Baker Botts L.L.P., Houston, Texas.
The consolidated and combined financial statements of Centennial Resource Production, LLC and Celero Energy Company, LP (Predecessor) as of December 31, 2015 and 2014, and each of the years in the two-year period ended December 31, 2015, and the balance sheet of Centennial Resource Development, Inc. as of April 30, 2016, have been included herein and in the registration statement in reliance upon the reports of KPMG LLP, independent registered public accounting firm, appearing elsewhere herein, and upon the authority of said firm as experts in accounting and auditing.
Estimates of our oil and natural gas reserves and related future net cash flows related to our properties as of December 31, 2015 included herein and elsewhere in the registration statement were based upon a reserve report prepared by our independent petroleum engineer, Netherland, Sewell & Associates, Inc. We have included these estimates in reliance on the authority of such firm as an expert in such matters.
WHERE YOU CAN FIND MORE INFORMATION
We have filed with the SEC a registration statement on Form S-1 (including the exhibits, schedules and amendments thereto) under the Securities Act, with respect to the shares of our common stock offered hereby. This prospectus does not contain all of the information set forth in the registration statement and the exhibits and schedules thereto. For further information with respect to the common stock offered hereby, we refer you to the registration statement and the exhibits and schedules filed therewith. Statements contained in this prospectus as to the contents of any contract, agreement or any other document are summaries of the material terms of such contract, agreement or other document and are not necessarily complete. With respect to each of these contracts, agreements or other documents filed as an exhibit to the registration statement, reference is made to the exhibits for a more complete description of the matter involved. A copy of the registration statement, and the exhibits and schedules thereto, may be inspected without charge at the public reference facilities maintained by the SEC at 100 F Street NE, Washington, D.C. 20549. Copies of these materials may be obtained, upon payment of a duplicating fee, from the Public Reference Room of the SEC at 100 F Street NE, Washington, D.C. 20549. Please call the SEC at 1-800-SEC-0330 for further information on the operation of the Public Reference Room. The SEC maintains a website that contains reports, proxy and information statements and other information regarding registrants that file electronically with the SEC. The address of the SEC’s website is www.sec.gov.
As a result of this offering, we will become subject to full information requirements of the Exchange Act. We will fulfill our obligations with respect to such requirements by filing periodic reports and other information with the SEC. We intend to furnish our stockholders with annual reports containing financial statements certified by an independent public accounting firm.
155
Table of Contents
| Page | ||||
| CENTENNIAL RESOURCE DEVELOPMENT, INC. |
||||
| Historical Balance Sheet |
||||
| F-2 | ||||
| F-3 | ||||
| F-4 | ||||
| CENTENNIAL RESOURCE PRODUCTION, LLC AND CELERO ENERGY COMPANY, LP (PREDECESSOR) |
||||
| Unaudited Historical Condensed Consolidated Financial Statements |
||||
| Unaudited condensed consolidated balance sheets as of March 31, 2016 |
F-5 | |||
| F-6 | ||||
| F-7 | ||||
| F-8 | ||||
| Notes to unaudited condensed consolidated financial statements |
F-9 | |||
| Historical Consolidated and Combined Financial Statements |
||||
| F-17 | ||||
| Consolidated and combined balance sheets as of December 31, 2015 and 2014 |
F-18 | |||
| Consolidated and combined statements of operations for the years ended December 31, 2015 and 2014 |
F-19 | |||
| F-20 | ||||
| Consolidated and combined statements of cash flows for the years ended December 31, 2015 and 2014 |
F-21 | |||
| F-22 | ||||
F-1
Table of Contents
Report of Independent Registered Public Accounting Firm
The Board of Directors
Centennial Resource Development, Inc.:
We have audited the accompanying balance sheet of Centennial Resource Development, Inc. (the Company) as of April 30, 2016. This balance sheet is the responsibility of the Company’s management. Our responsibility is to express an opinion on this balance sheet based on our audit.
We conducted our audit in accordance with the standards of the Public Company Accounting Oversight Board (United States). Those standards require that we plan and perform the audit to obtain reasonable assurance about whether the balance sheet is free of material misstatement. An audit includes examining, on a test basis, evidence supporting the amounts and disclosures in the balance sheet. An audit also includes assessing the accounting principles used and significant estimates made by management, as well as evaluating the overall balance sheet presentation. We believe that our audit provides a reasonable basis for our opinion.
In our opinion, the balance sheet referred to above presents fairly, in all material respects, the financial position of Centennial Resource Development, Inc. as of April 30, 2016, in conformity with U.S. generally accepted accounting principles.
/s/ KPMG LLP
Denver, Colorado
May 17, 2016
F-2
Table of Contents
CENTENNIAL RESOURCE DEVELOPMENT, INC.
BALANCE SHEET
| April 30, 2016 | ||||
| ASSETS |
||||
| Cash |
$ | 10 | ||
|
|
|
|||
| Total assets |
$ | 10 | ||
|
|
|
|||
| STOCKHOLDERS’ EQUITY |
||||
| Common stock, $0.01 par value, 1,000 shares authorized; 1,000 shares issued and outstanding |
$ | 10 | ||
|
|
|
|||
| Total stockholders’ equity |
$ | 10 | ||
|
|
|
|||
See the accompanying notes to the balance sheet.
F-3
Table of Contents
CENTENNIAL RESOURCE DEVELOPMENT, INC.
NOTES TO BALANCE SHEET
Note 1—Formation of the Company and Description of the Business
Centennial Resource Development, Inc. (the “Company”) was formed on October 6, 2014, pursuant to the laws of the State of Delaware, to become a holding company for Centennial Resource Production, LLC.
Note 2—Basis of Presentation
This balance sheet has been prepared in accordance with accounting principles generally accepted in the United States of America (“U.S. GAAP”). Separate statements of operations, statements of changes in stockholders’ equity and statements of cash flows have not been presented because the Company has had no business transactions or activities to date.
Note 3—Subsequent Events
We are not aware of any events that have occurred subsequent to April 30, 2016 through the filing of Registration Statement on Form S-1 of which this prospectus is a part that would require recognition or disclosure in this financial statement.
F-4
Table of Contents
CENTENNIAL RESOURCE PRODUCTION, LLC
(PREDECESSOR)
CONDENSED CONSOLIDATED BALANCE SHEETS
(Unaudited)
| March 31, 2016 |
December 31, 2015 |
|||||||
| (in thousands) | ||||||||
| ASSETS |
||||||||
| Current assets |
||||||||
| Cash and cash equivalents |
$ | 98 | $ | 1,768 | ||||
| Accounts receivable, net |
9,084 | 13,012 | ||||||
| Derivative instruments, net |
12,657 | 19,043 | ||||||
| Prepaid and other current assets |
412 | 322 | ||||||
|
|
|
|
|
|||||
| Total current assets |
22,251 | 34,145 | ||||||
| Oil and natural gas properties, other property and equipment |
||||||||
| Oil and natural gas properties, successful efforts method |
669,426 | 651,596 | ||||||
| Accumulated depreciation, depletion and amortization |
(201,967 | ) | (180,946 | ) | ||||
| Unproved oil and natural gas properties |
110,371 | 105,897 | ||||||
| Other property and equipment, net of accumulated depreciation of $1,108 and $868, respectively |
2,033 | 2,240 | ||||||
|
|
|
|
|
|||||
| Total property and equipment, net |
579,863 | 578,787 | ||||||
| Noncurrent assets |
||||||||
| Derivative instruments, net |
1,745 | 2,070 | ||||||
| Other noncurrent assets |
1,208 | 1,293 | ||||||
|
|
|
|
|
|||||
| Total assets |
$ | 605,067 | $ | 616,295 | ||||
|
|
|
|
|
|||||
| LIABILITIES AND OWNERS’ EQUITY |
||||||||
| Current liabilities |
||||||||
| Accounts payable and accrued expenses |
$ | 20,813 | $ | 19,985 | ||||
| Other current liabilities |
1,333 | 2,148 | ||||||
|
|
|
|
|
|||||
| Total current liabilities |
22,146 | 22,133 | ||||||
| Noncurrent liabilities |
||||||||
| Revolving credit facility |
77,000 | 74,000 | ||||||
| Term loan, net of unamortized deferred financing costs |
64,687 | 64,649 | ||||||
| Asset retirement obligations |
2,470 | 2,288 | ||||||
| Deferred tax liability |
2,361 | 2,361 | ||||||
|
|
|
|
|
|||||
| Total liabilities |
168,664 | 165,431 | ||||||
| Owners’ equity |
436,403 | 450,864 | ||||||
|
|
|
|
|
|||||
| Total liabilities and owners’ equity |
$ | 605,067 | $ | 616,295 | ||||
|
|
|
|
|
|||||
The accompanying notes are an integral part of these
unaudited condensed consolidated financial statements.
F-5
Table of Contents
CENTENNIAL RESOURCE PRODUCTION, LLC
(PREDECESSOR)
CONDENSED CONSOLIDATED STATEMENTS OF OPERATIONS
(Unaudited)
| For the Three Months Ended March 31, |
||||||||
| 2016 | 2015 | |||||||
| Revenues |
||||||||
| Oil sales |
$ | 13,226 | $ | 21,066 | ||||
| Natural gas sales |
1,313 | 1,963 | ||||||
| NGL sales |
582 | 1,387 | ||||||
|
|
|
|
|
|||||
| Total revenues |
15,121 | 24,416 | ||||||
| Operating expenses |
||||||||
| Lease operating expenses |
4,042 | 6,497 | ||||||
| Severance and ad valorem taxes |
844 | 1,193 | ||||||
| Transportation, processing, gathering and other operating expense |
1,130 | 1,283 | ||||||
| Depreciation, depletion, amortization and accretion of asset retirement obligations |
21,303 | 23,230 | ||||||
| Contract termination and rig stacking |
— | 1,540 | ||||||
| General and administrative expenses |
2,536 | 2,913 | ||||||
|
|
|
|
|
|||||
| Total operating expenses |
29,855 | 36,656 | ||||||
| Loss (gain) on sale of oil and natural gas properties |
4 | (2,675 | ) | |||||
|
|
|
|
|
|||||
| Total operating loss |
(14,738 | ) | (9,565 | ) | ||||
| Other income (expense) |
||||||||
| Interest expense |
(1,641 | ) | (1,526 | ) | ||||
| Gain on derivative instruments |
1,918 | 5,154 | ||||||
|
|
|
|
|
|||||
| Total other income |
277 | 3,628 | ||||||
|
|
|
|
|
|||||
| Loss before income taxes |
(14,461 | ) | (5,937 | ) | ||||
| Income tax expense |
— | — | ||||||
|
|
|
|
|
|||||
| Net loss attributable to Predecessor |
$ | (14,461 | ) | $ | (5,937 | ) | ||
|
|
|
|
|
|||||
| Pro Forma Information (Unaudited) |
||||||||
| Net loss |
$ | (14,461 | ) | |||||
| Pro forma tax benefit for income taxes |
5,134 | |||||||
|
|
|
|||||||
| Pro forma net loss |
$ | (9,327 | ) | |||||
|
|
|
|||||||
| Pro forma net income per common share |
||||||||
| Basic and diluted |
$ | |||||||
| Weighted average pro forma common shares outstanding |
||||||||
| Basic and diluted |
||||||||
The accompanying notes are an integral part of these
unaudited condensed consolidated financial statements.
F-6
Table of Contents
CENTENNIAL RESOURCE PRODUCTION, LLC
(PREDECESSOR)
CONDENSED CONSOLIDATED STATEMENT OF CHANGES IN OWNERS’ EQUITY
(Unaudited)
| Total Owners’ Equity |
||||
| (in thousands) | ||||
| Balance at December 31, 2015 |
$ | 450,864 | ||
| Contributions |
— | |||
| Net loss |
(14,461 | ) | ||
|
|
|
|||
| Balance at March 31, 2016 |
$ | 436,403 | ||
|
|
|
|||
The accompanying notes are an integral part of these
unaudited condensed consolidated financial statements.
F-7
Table of Contents
CENTENNIAL RESOURCE PRODUCTION, LLC
(PREDECESSOR)
CONDENSED CONSOLIDATED STATEMENTS OF CASH FLOWS
(Unaudited)
| For the Three Months Ended March 31, | ||||||||
| 2016 | 2015 | |||||||
| (in thousands) | ||||||||
| Cash flows from operating activities |
||||||||
| Net loss |
$ | (14,461 | ) | $ | (5,937 | ) | ||
| Adjustments to reconcile net loss to net cash provided by operating activities: |
||||||||
| Accretion of asset retirement obligations |
40 | 32 | ||||||
| Depreciation, depletion and amortization |
21,263 | 23,198 | ||||||
| Loss (gain) on sale of oil and natural gas properties |
4 | (2,675 | ) | |||||
| Gain on derivative instruments |
(1,918 | ) | (5,154 | ) | ||||
| Net cash received for derivative settlements |
8,629 | 9,729 | ||||||
| Amortization of debt issuance costs |
122 | 114 | ||||||
| Changes in operating assets and liabilities: |
||||||||
| Decrease in accounts receivable |
4,234 | 8,780 | ||||||
| Decrease (increase) in prepaid and other assets |
9 | (448 | ) | |||||
| Increase (decrease) in accounts payable and other liabilities |
630 | (7 | ) | |||||
|
|
|
|
|
|||||
| Net cash provided by operating activities |
18,552 | 27,632 | ||||||
|
|
|
|
|
|||||
| Cash flows from investing activities |
||||||||
| Acquisition of oil and natural gas properties |
(6,180 | ) | (4,096 | ) | ||||
| Development of oil and natural gas properties |
(16,206 | ) | (76,679 | ) | ||||
| Purchases of other property and equipment |
(33 | ) | (922 | ) | ||||
| Proceeds from sales of oil and natural gas properties |
— | 2,691 | ||||||
|
|
|
|
|
|||||
| Net cash used by investing activities |
(22,419 | ) | (79,006 | ) | ||||
|
|
|
|
|
|||||
| Cash flows from financing activities |
||||||||
| Proceeds from revolving credit facility |
5,000 | 39,000 | ||||||
| Repayment of revolving credit facility |
(2,000 | ) | — | |||||
| Financing obligation |
(803 | ) | — | |||||
| Debt issuance costs |
— | (87 | ) | |||||
|
|
|
|
|
|||||
| Net cash provided by financing activities |
2,197 | 38,913 | ||||||
|
|
|
|
|
|||||
| Net decrease in cash and cash equivalents |
(1,670 | ) | (12,461 | ) | ||||
| Cash and cash equivalents, beginning |
1,768 | 13,017 | ||||||
|
|
|
|
|
|||||
| Cash and cash equivalents, end |
$ | 98 | $ | 556 | ||||
|
|
|
|
|
|||||
| Supplemental disclosure of cash flow information: |
||||||||
| Cash paid for interest |
$ | 1,478 | $ | 1,368 | ||||
| Supplemental disclosure of noncash activity: |
||||||||
| Accrued capital expenditures included in accounts payable and accrued expenses |
$ | 13,000 | $ | 35,928 | ||||
The accompanying notes are an integral part of these
unaudited condensed consolidated financial statements.
F-8
Table of Contents
CENTENNIAL RESOURCE PRODUCTION, LLC
(PREDECESSOR)
NOTES TO CONDENSED CONSOLIDATED FINANCIAL STATEMENTS
(Unaudited)
Note 1—Organization and Nature of Operations
Centennial Resource Production, LLC, a Delaware limited liability company formerly named Atlantic Energy Holdings, LLC (“Centennial OpCo”), was formed on August 30, 2012 by its management members, third-party investors and NGP Natural Resources X, LP (“NGP X”), an affiliate of Natural Gas Partners (“NGP”), a family of energy-focused private equity investment funds. Centennial OpCo (the “Predecessor”) is engaged in the development and acquisition of unconventional oil and associated liquids-rich natural gas reserves, primarily in the Delaware Basin of West Texas.
For additional information regarding the organization and formation of the Predecessor please refer to Note 1—Organization and Nature of Operations in the Predecessor’s audited consolidated and combined financial statements for the year ended December 31, 2015, included in this prospectus.
Note 2—Basis of Presentation, Significant Accounting Policies, and Recently Issued Accounting Standards
Basis of Presentation
The accompanying unaudited condensed consolidated financial statements have been prepared in accordance with accounting principles generally accepted in the United States of America (“U.S. GAAP”). The condensed consolidated financial statements do not include all information and notes required by U.S. GAAP for complete financial statements. However, except as disclosed herein, there has been no material change in the information disclosed in the notes to the consolidated and combined financial statements included in the Predecessor’s audited financial statements for the year ended December 31, 2015, included in this prospectus. In the opinion of management, all adjustments, consisting of normal recurring accruals considered necessary for a fair presentation of interim financial information, have been included. Operating results for the periods presented are not necessarily indicative of expected results for the full year. Certain prior period amounts have been reclassified to conform to the current presentation on the accompanying condensed consolidated financial statements.
Subsequent Events
On April 25, 2016, the Predecessor entered into a purchase and sale agreement to acquire acreage that is contiguous to its existing acreage position, and on May 13, 2016, the Predecessor closed a leasehold acquisition in close proximity to its operating area. The acquisitions added approximately 2,400 net acres and 250 Boe/d of production.
Assumptions, Judgments and Estimates
The preparation of the Predecessor’s condensed consolidated financial statements requires the Predecessor’s management to make various assumptions, judgments and estimates to determine the reported amounts of assets, liabilities, revenues and expenses, and in the disclosures of commitments and contingencies. Changes in these assumptions, judgments, and estimates will occur as a result of the passage of time and the occurrence of future events and, accordingly, actual results could differ from amounts previously established.
The more significant areas requiring the use of assumptions, judgments and estimates include: (1) oil and natural gas reserves; (2) cash flow estimates used in impairment tests of long-lived assets; (3) depreciation, depletion and amortization; (4) asset retirement obligations; (5) determining fair value and allocating purchase price in connection with business combinations; (6) valuation of derivative instruments; and (7) accrued revenue and related receivables.
F-9
Table of Contents
CENTENNIAL RESOURCE PRODUCTION, LLC
(PREDECESSOR)
NOTES TO CONDENSED CONSOLIDATED FINANCIAL STATEMENTS
(Unaudited)—(Continued)
Significant Accounting Policies
The significant accounting policies followed by the Predecessor are set forth in Note 2—Basis of Presentation, Summary of Significant Accounting Policies, and Recently Issued Accounting Standards in the Predecessor’s audited consolidated and combined financial statements for the year ended December 31, 2015, included in this prospectus.
Unaudited Pro Forma Income Taxes
These condensed consolidated financial statements have been prepared in anticipation of a proposed initial public offering (the “Offering”) of the common stock of the Predecessor’s parent entity. In connection with the Offering, all interests in the Predecessor will be contributed to a Delaware corporation that will be taxed as a corporation under the Internal Revenue Code of 1986, as amended, and thus subject to U.S. federal, state and local income taxes. Accordingly, a pro forma income tax provision has been disclosed as if the Predecessor were a taxable corporation for all periods presented. The Predecessor has computed pro forma income tax expense using an estimated 36% blended corporate level U.S. federal, state and local tax rate.
Unaudited Pro Forma Earnings Per Share
The Predecessor has presented pro forma earnings per share for the most recent period. Pro forma basic and diluted income per share was computed by dividing pro forma net income by the number of shares of common stock attributable to the Predecessor by the number of shares of common stock to be issued in the initial public offering described in the registration statement, as if such shares were issued and outstanding for the three month period ended March 31, 2016.
Recently Issued Accounting Standards
In February 2016, the Financial Accounting Standards Board (FASB) issued Accounting Standards Update (ASU) No. 2016-02, Leases, which requires all leasing arrangements to be presented in the balance sheet as liabilities along with a corresponding asset. The ASU will replace most existing leases guidance in U.S. GAAP when it becomes effective. The new standard becomes effective for the Predecessor on January 1, 2019. Although early application is permitted, the Predecessor does not plan to early adopt the ASU. The standard requires the use of the modified retrospective transition method. The Predecessor is evaluating the impact, if any, that the adoption of this update will have on the Predecessor’s condensed consolidated financial statements and related disclosures.
In March 2016, the FASB issued ASU No. 2016-09, Improvements to Employee Share-Based Payment Accounting, which includes provisions intended to simplify various aspects related to how share-based compensation payments are accounted for and presented in the financial statements. This amendment will be effective prospectively for reporting periods beginning on or after December 15, 2016, and early adoption is permitted. The Predecessor is evaluating the impact, if any, that the adoption of this update will have on the Predecessor’s condensed consolidated financial statements and related disclosures.
In May 2014, the FASB issued ASU 2014-09, Revenue from Contracts with Customers. This guidance is to be applied using a full retrospective method or a modified retrospective method, as outlined in the guidance. In August 2015, the FASB deferred the effective date of the new revenue recognition standard by one year. The revenue recognition standard is now effective for annual periods, and interim periods within those annual
F-10
Table of Contents
CENTENNIAL RESOURCE PRODUCTION, LLC
(PREDECESSOR)
NOTES TO CONDENSED CONSOLIDATED FINANCIAL STATEMENTS
(Unaudited)—(Continued)
periods, beginning after December 15, 2017. Early adoption is permitted but only for annual periods, and interim periods within those annual periods, beginning after December 15, 2016. The Predecessor is evaluating the impact, if any, that the adoption of this update will have on the Predecessor’s consolidated and combined financial statements and related disclosures.
Other than as disclosed above or set forth in Note 2—Basis of Presentation, Summary of Significant Accounting Policies, and Recently Issued Accounting Standards in the Predecessor’s audited consolidated and combined financial statements for the year ended December 31, 2015, included in this prospectus, there are no other new accounting standards that would have a material impact on the Predecessor’s condensed consolidated financial statements and disclosures.
Note 3—Accounts Receivable, Accounts Payable and Accrued Expenses
Accounts receivable are comprised of the following:
| March 31, 2016 |
December 31, 2015 |
|||||||
| (in thousands) | ||||||||
| Oil and natural gas |
$ | 4,468 | $ | 5,789 | ||||
| Joint interest billings |
2,028 | 1,514 | ||||||
| Hedge settlements |
2,622 | 3,956 | ||||||
| Other |
57 | 1,844 | ||||||
| Allowance for doubtful accounts |
(91 | ) | (91 | ) | ||||
|
|
|
|
|
|||||
| Accounts receivable, net |
$ | 9,084 | $ | 13,012 | ||||
|
|
|
|
|
|||||
Accounts payable and accrued expenses are comprised of the following:
| March 31, 2016 |
December 31, 2015 |
|||||||
| (in thousands) | ||||||||
| Accounts payable |
$ | 6,098 | $ | 1,827 | ||||
| Accrued capital expenditures |
8,661 | 11,700 | ||||||
| Revenues payable |
3,242 | 3,439 | ||||||
| Other |
2,812 | 3,019 | ||||||
|
|
|
|
|
|||||
| Accounts payable and accrued expenses |
$ | 20,813 | $ | 19,985 | ||||
|
|
|
|
|
|||||
Note 4—Asset Retirement Obligations
The following table summarizes the changes in the Predecessor’s asset retirement obligations for the three months ended March 31, 2016 (in thousands):
| Asset retirement obligations, beginning of period |
$ | 2,288 | ||
| Additional liabilities incurred |
95 | |||
| Accretion expense |
40 | |||
| Revision of estimated liabilities |
47 | |||
|
|
|
|||
| Asset retirement obligations, end of period |
$ | 2,470 | ||
|
|
|
F-11
Table of Contents
CENTENNIAL RESOURCE PRODUCTION, LLC
(PREDECESSOR)
NOTES TO CONDENSED CONSOLIDATED FINANCIAL STATEMENTS
(Unaudited)—(Continued)
Note 5—Derivative Instruments
The Predecessor periodically uses derivative instruments to mitigate its exposure to a decline in commodity prices and the corresponding negative impact on cash flow available for reinvestment. While the use of these instruments limits the downside risk of adverse price changes, their use may also limit future revenues from favorable price changes. Depending on changes in oil and natural gas futures markets and the Predecessor’s view of underlying supply and demand trends, it may increase or decrease its hedging positions.
The following table summarizes the approximate volumes and average contract prices of swap and basis swap contracts the Predecessor had in place as of March 31, 2016 expiring during the periods indicated:
| Nine Months Ending December 31, 2016 |
Year Ending December 31, 2017 |
|||||||
| Crude Oil Swaps: |
||||||||
| Notional volume (Bbl) |
612,900 | 346,750 | ||||||
| Weighted average floor price ($/Bbl) |
$ | 61.58 | $ | 50.80 | ||||
| Crude Oil Basis Swaps: |
||||||||
| Notional volume (Bbl) |
942,750 | 127,750 | ||||||
| Weighted average floor price ($/Bbl) |
$ | (0.44 | ) | $ | (0.20 | ) | ||
In a typical commodity swap agreement, if the agreed upon published third-party index price (“index price”) is lower than the swap fixed price, the Predecessor receives the difference between the index price and the agreed upon swap fixed price. If the index price is higher than the swap fixed price, the Predecessor pays the difference. In addition, the Predecessor has entered into basis swap contracts in order to hedge the difference between the NYMEX index price and a local index price. When the actual differential exceeds the fixed price provided by the basis swap contract, the Predecessor receives the difference from the counterparty; when the differential is less than the fixed price provided by the basis swap contract, the Predecessor pays the difference to the counterparty.
The Predecessor’s oil and natural gas derivative instruments have not been designated as hedges for accounting purposes; therefore, all gains and losses were recognized in the Predecessor’s condensed consolidated statements of operations. The derivative instruments are measured at fair value and are included in the accompanying condensed consolidated balance sheets as derivative assets. The fair value of the commodity contracts was a net asset of $14.4 million and $21.1 million as of March 31, 2016 and December 31, 2015, respectively.
F-12
Table of Contents
CENTENNIAL RESOURCE PRODUCTION, LLC
(PREDECESSOR)
NOTES TO CONDENSED CONSOLIDATED FINANCIAL STATEMENTS
(Unaudited)—(Continued)
The following tables below summarize the gross fair value of derivative assets and liabilities and the effect of netting on the condensed consolidated and combined balance sheets (in thousands):
| Balance Sheet |
Gross Amounts | Netting Adjustments |
Net Amounts Presented on the Balance Sheet |
|||||||||||
| March 31, 2016: |
||||||||||||||
| Assets: |
||||||||||||||
| Derivative instruments |
Current assets | $ | 12,958 | $ | (301 | ) | $ | 12,657 | ||||||
| Derivative instruments |
Noncurrent assets | 1,854 | (109 | ) | 1,745 | |||||||||
|
|
|
|
|
|
|
|||||||||
| Total assets |
$ | 14,812 | $ | (410 | ) | $ | 14,402 | |||||||
|
|
|
|
|
|
|
|||||||||
| December 31, 2015: |
||||||||||||||
| Assets: |
||||||||||||||
| Derivative instruments |
Current assets | $ | 19,469 | $ | (426 | ) | $ | 19,043 | ||||||
| Derivative instruments |
Noncurrent assets | 2,071 | (1 | ) | 2,070 | |||||||||
|
|
|
|
|
|
|
|||||||||
| Total assets |
$ | 21,540 | $ | (427 | ) | $ | 21,113 | |||||||
|
|
|
|
|
|
|
|||||||||
The following table presents gains and losses for derivative instruments not designated as hedges for accounting purposes for the periods presented (in thousands):
| For the Three Months Ended March 31, | ||||||||
| 2016 | 2015 | |||||||
| Gain on derivative instruments |
$ | 1,918 | $ | 5,154 | ||||
The Predecessor is exposed to financial risks associated with its derivative contracts from non-performance by its counterparties. The Predecessor mitigates its exposure to any single counterparty by contracting with a number of financial institutions, each of which have a high credit rating and is a member of its bank credit facility. The Predecessor’s member banks do not require it to post collateral for its hedge liability positions.
Note 6—Fair Value Measurements
Assets and Liabilities Measured at Fair Value on a Recurring Basis
The Predecessor has categorized its assets and liabilities measured at fair value, based on the priority of inputs to the valuation technique, into a three-level fair value hierarchy. Level 1 inputs are the highest priority and consist of unadjusted quoted prices in active markets for identical assets and liabilities. Level 2 are inputs other than quoted prices that are observable for the asset or liability, either directly or indirectly. Level 3 are unobservable inputs for an asset or liability.
The following table is a listing of the Predecessor’s assets and liabilities that are measured at fair value and where they were classified within the fair value hierarchy as of March 31, 2016:
| Level 1 | Level 2 | Level 3 | ||||||||||
| Assets: |
||||||||||||
| Derivative instruments(1) |
$ | — | $ | 14,402 | $ | — | ||||||
F-13
Table of Contents
CENTENNIAL RESOURCE PRODUCTION, LLC
(PREDECESSOR)
NOTES TO CONDENSED CONSOLIDATED FINANCIAL STATEMENTS
(Unaudited)—(Continued)
| (1) | This represents a financial asset that is measured at fair value on a recurring basis. |
The following table is a listing of the Predecessor’s assets and liabilities that are measured at fair value and where they were classified within the fair value hierarchy as of December 31, 2015:
| Level 1 | Level 2 | Level 3 | ||||||||||
| Assets: |
||||||||||||
| Derivative instruments(1) |
$ | — | $ | 21,113 | $ | — | ||||||
| (1) | This represents a financial asset that is measured at fair value on a recurring basis. |
Both financial and non-financial assets and liabilities are categorized within the above fair value hierarchy based on the lowest level of input that is significant to the fair value measurement. The following is a description of the valuation methodologies used by the Predecessor as well as the general classification of such instruments pursuant to the above fair value hierarchy. There were no transfers between Level 1, Level 2 or Level 3 during any period presented.
Derivatives
The Predecessor uses Level 2 inputs to measure the fair value of oil and natural gas commodity derivatives. The Predecessor uses industry-standard models that considered various assumptions including current market and contractual prices for the underlying instruments, implied market volatility, time value, nonperformance risk, as well as other relevant economic measures. Substantially all of these inputs are observable in the marketplace throughout the full term of the instrument and can be supported by observable data. The Predecessor utilizes its counterparties’ valuations to assess the reasonableness of its own valuations.
Other Financial Instruments
The carrying amounts of the Predecessor’s cash, cash equivalents, accounts receivable, accounts payable, and accrued liabilities approximate fair value because of the short-term maturities and/or liquid nature of these assets and liabilities. The carrying values of the amounts outstanding under the credit agreement approximated fair value because the variable interest rates are reflective of current market conditions.
Note 7—Long-Term Debt
Credit Agreement
The amended and restated credit agreement (credit agreement), dated October 15, 2014, includes both a term loan commitment of $65.0 million (the “term loan”) and a revolving credit facility (the “revolving credit facility”) with commitments of $500.0 million (subject to the borrowing base), with a sublimit for letters of credit of $15.0 million. The revolving credit facility matures on October 19, 2019 and the term loan matures on April 15, 2018.
The borrowing base under the revolving credit facility is determined at the discretion of the lenders and depends on, among other things, the volumes of the Predecessor’s proved oil and natural gas reserves and estimated cash flows from these reserves and the Predecessor’s commodity hedge positions. The borrowing base was $140.0 million as of March 31, 2016 and was reaffirmed on April 29, 2016. The next scheduled borrowing base redetermination is expected in the fall of 2016. As of March 31, 2016, borrowings under the revolving credit facility were $77.0 million and $0.5 million of outstanding letters of credit, leaving $62.5 million in borrowing capacity under the revolving credit facility.
F-14
Table of Contents
CENTENNIAL RESOURCE PRODUCTION, LLC
(PREDECESSOR)
NOTES TO CONDENSED CONSOLIDATED FINANCIAL STATEMENTS
(Unaudited)—(Continued)
The term loan, net of unamortized deferred financing costs on the accompanying condensed consolidated balance sheets as of March 31, 2016 and December 31, 2015, consisted of the following:
| March 31, 2016 |
December 31, 2015 |
|||||||
| (in thousands) | ||||||||
| Term loan |
$ | 65,000 | $ | 65,000 | ||||
| Unamortized deferred financing costs |
(313 | ) | (351 | ) | ||||
|
|
|
|
|
|||||
| Term loan, net of unamortized deferred financing costs |
$ | 64,687 | $ | 64,649 | ||||
|
|
|
|
|
|||||
The credit agreement also has customary covenants with which the Predecessor was in compliance as of March 31, 2016.
Note 8—Incentive Unit Compensation
There have been no material changes in issued, forfeited or vested incentive units during the three months ended March 31, 2016. Please refer to Note 9—Incentive Unit Compensation in the Predecessor’s audited consolidated and combined financial statements for the year ended December 31, 2015, included in this prospectus.
Incentive units are accounted for as liability awards under FASB ASC Topic 718, Compensation-Stock Compensation, with compensation expense based on period-end fair value. The achievement of payout conditions is a performance condition that requires the Predecessor to assess, at each reporting period, the probability that an event of payout will occur. Compensation cost is required to be recognized at such time that the payout terms are probable of being met. At the grant dates and subsequent reporting periods, the Predecessor did not deem as probable that such payouts would be achieved.
Note 9—Transactions with Related Parties
The Predecessor is party to a 15-year gas gathering agreement with PennTex Permian, LLC (“PennTex”), an NGP affiliated company, which terminates on April 1, 2029 and is subject to one-year extensions at either party’s election. Under the agreement, PennTex gathers and processes the Predecessor’s gas. PennTex purchases the extracted natural gas liquids from the Predecessor, net of gathering fees and an agreed percentage of the actual proceeds from the sale of the residue natural gas and natural gas liquids. Net payments received from PennTex for the three months ended March 31, 2016 and 2015 were $0.03 million and $0.2 million, respectively. As of March 31, 2016, the Predecessor recorded a receivable of $0.05 million from PennTex.
In October 2014, the gas gathering agreement with PennTex was amended to construct an expansion of the gathering system and a receipt point. Please refer to Note 10—Commitments and Contingences.
During the three months ended March 31, 2016 and 2015, the Predecessor paid approximately $0.3 million and $0 million, respectively, to Cretic Energy Services, LLC, an NGP affiliated company, for services related to our drilling and completion activities.
During the three months ended March 31, 2016 and 2015, the Predecessor paid approximately $2.2 million and $0 million, respectively, to RockPile Energy Services, LLC, an NGP affiliated company, for services related to our drilling and completion activities.
F-15
Table of Contents
CENTENNIAL RESOURCE PRODUCTION, LLC
(PREDECESSOR)
NOTES TO CONDENSED CONSOLIDATED FINANCIAL STATEMENTS
(Unaudited)—(Continued)
During the three months ended March 31, 2016 and 2015, the Predecessor paid approximately $0.5 million and $0 million, respectively, to WildHorse Resources II, LLC, an NGP affiliated company, for certain oil and gas lease extensions.
Note 10—Commitments and Contingencies
Commitments
In October 2014, the Predecessor’s gas gathering agreement with PennTex was amended to construct an expansion of the gathering system and a receipt point. The Predecessor will reimburse PennTex for the total cost of the expansion project. The Predecessor shall pay a minimum fee of $7,000 per day until PennTex recoups the capital outlay for the expansion project. At March 31, 2016 a short-term liability of $1.3 million was included in Other current liabilities on the condensed consolidated balance sheets. For the three months ended March 31, 2016, the Predecessor made payments of $0.6 million, including interest.
There have been no other material changes in commitments during the three months ended March 31, 2016. Please refer to Note 11—Commitment and Contingencies in the Predecessor’s audited consolidated and combined financial statements for the year ended December 31, 2015, included in this prospectus.
Contract Termination and Rig Stacking
In light of the low commodity price environment, the Predecessor curtailed its drilling activity during 2015. For the three months ended March 31, 2015, the Predecessor incurred drilling rig termination fees of $1.5 million, which is recorded in the Contract termination and rig stacking line item in the accompanying condensed consolidated statements of operations.
Contingencies
In the ordinary course of business, the Predecessor may at times be subject to claims and legal actions. Management believes it is remote that the impact of such matters will have a material adverse effect on the Predecessor’s financial position, results of operations or cash flows. Management is unaware of any pending litigation brought against the Predecessor requiring the reserve of a contingent liability as of the date of these condensed consolidated financial statements.
F-16
Table of Contents
Report of Independent Registered Public Accounting Firm
The Board of Directors
Centennial Resource Development, Inc.:
We have audited the accompanying consolidated and combined balance sheets of Centennial Resource Production, LLC and Celero Energy Company, LP (Predecessor) as of December 31, 2015 and 2014, and the related consolidated and combined statements of operations, changes in owners’ equity, and cash flows for each of the years in the two-year period ended December 31, 2015. These consolidated and combined financial statements are the responsibility of the Company’s management. Our responsibility is to express an opinion on these consolidated and combined financial statements based on our audits.
We conducted our audits in accordance with the standards of the Public Company Accounting Oversight Board (United States). Those standards require that we plan and perform the audit to obtain reasonable assurance about whether the financial statements are free of material misstatement. An audit includes examining, on a test basis, evidence supporting the amounts and disclosures in the financial statements. An audit also includes assessing the accounting principles used and significant estimates made by management, as well as evaluating the overall financial statement presentation. We believe that our audits provide a reasonable basis for our opinion.
In our opinion, the consolidated and combined financial statements referred to above present fairly, in all material respects, the financial position of Centennial Resource Production, LLC and Celero Energy Company, LP (Predecessor) as of December 31, 2015 and 2014, and the results of their operations and their cash flows for each of the years in the two-year period ended December 31, 2015, in conformity with U.S. generally accepted accounting principles.
As discussed in Note 2 to the consolidated and combined financial statements, the balance sheets, and the related statements of operations, changes in equity, and cash flows have been prepared on a consolidated and combined basis of accounting as a result of the reorganization of interests under common control.
/s/ KPMG LLP
Denver, Colorado
April 5, 2016, except as to Note 14, which is as of May 17, 2016
F-17
Table of Contents
CENTENNIAL RESOURCE PRODUCTION, LLC AND CELERO ENERGY COMPANY, LP
(PREDECESSOR)
CONSOLIDATED AND COMBINED BALANCE SHEETS
| December 31, | ||||||||
| 2015 | 2014 | |||||||
| (in thousands) | ||||||||
| ASSETS |
||||||||
| Current assets |
||||||||
| Cash and cash equivalents |
$ | 1,768 | $ | 13,017 | ||||
| Accounts receivable, net |
13,012 | 23,117 | ||||||
| Derivative instruments, net |
19,043 | 30,422 | ||||||
| Prepaid and other current assets |
322 | 790 | ||||||
|
|
|
|
|
|||||
| Total current assets |
34,145 | 67,346 | ||||||
| Oil and natural gas properties, other property and equipment |
||||||||
| Oil and natural gas properties, successful efforts method |
651,596 | 541,119 | ||||||
| Accumulated depreciation, depletion and amortization |
(180,946 | ) | (91,735 | ) | ||||
| Unproved oil and natural gas properties |
105,897 | 90,645 | ||||||
| Other property and equipment, net of accumulated depreciation of $868 and $139, respectively |
2,240 | 595 | ||||||
|
|
|
|
|
|||||
| Total property and equipment, net |
578,787 | 540,624 | ||||||
| Noncurrent assets |
||||||||
| Derivative instruments, net |
2,070 | 6,365 | ||||||
| Other noncurrent assets |
1,293 | 1,434 | ||||||
|
|
|
|
|
|||||
| Total assets |
$ | 616,295 | $ | 615,769 | ||||
|
|
|
|
|
|||||
| LIABILITIES AND OWNERS’ EQUITY |
||||||||
| Current liabilities |
||||||||
| Accounts payable and accrued expenses |
$ | 19,985 | $ | 101,295 | ||||
| Other current liabilities |
2,148 | 2,217 | ||||||
|
|
|
|
|
|||||
| Total current liabilities |
22,133 | 103,512 | ||||||
| Noncurrent liabilities |
||||||||
| Revolving credit facility |
74,000 | 65,000 | ||||||
| Term loan, net of unamortized deferred financing costs |
64,649 | 64,568 | ||||||
| Asset retirement obligations |
2,288 | 1,824 | ||||||
| Deferred tax liability |
2,361 | 2,933 | ||||||
|
|
|
|
|
|||||
| Total liabilities |
165,431 | 237,837 | ||||||
| Owners’ equity |
450,864 | 377,932 | ||||||
|
|
|
|
|
|||||
| Total liabilities and owners’ equity |
$ | 616,295 | $ | 615,769 | ||||
|
|
|
|
|
|||||
The accompanying notes are an integral part of these consolidated and combined financial statements.
F-18
Table of Contents
CENTENNIAL RESOURCE PRODUCTION, LLC AND CELERO ENERGY COMPANY, LP
(PREDECESSOR)
CONSOLIDATED AND COMBINED STATEMENTS OF OPERATIONS
| For the Year Ended December 31, | ||||||||
| 2015 | 2014 | |||||||
| (in thousands, except per share amounts) |
||||||||
| Revenues |
||||||||
| Oil sales |
$ | 77,643 | $ | 114,955 | ||||
| Natural gas sales |
7,965 | 9,670 | ||||||
| NGL sales |
4,852 | 7,200 | ||||||
|
|
|
|
|
|||||
| Total revenues |
90,460 | 131,825 | ||||||
| Operating expenses |
||||||||
| Lease operating expenses |
21,173 | 17,690 | ||||||
| Severance and ad valorem taxes |
5,021 | 6,875 | ||||||
| Transportation, processing, gathering and other operating expense |
5,732 | 4,772 | ||||||
| Depreciation, depletion, amortization and accretion of asset retirement obligations. |
90,084 | 69,110 | ||||||
| Abandonment expense and impairment of unproved properties |
7,619 | 20,025 | ||||||
| Exploration |
84 | — | ||||||
| Contract termination and rig stacking |
2,387 | — | ||||||
| General and administrative expenses |
14,206 | 31,694 | ||||||
|
|
|
|
|
|||||
| Total operating expenses |
146,306 | 150,166 | ||||||
| (Gain) loss on sale of oil and natural gas properties |
(2,439 | ) | 2,096 | |||||
|
|
|
|
|
|||||
| Total operating loss |
(53,407 | ) | (20,437 | ) | ||||
| Other income (expense) |
||||||||
| Interest expense |
(6,266 | ) | (2,475 | ) | ||||
| Gain on derivative instruments |
20,756 | 41,943 | ||||||
| Other income |
20 | 281 | ||||||
|
|
|
|
|
|||||
| Total other income |
14,510 | 39,749 | ||||||
|
|
|
|
|
|||||
| (Loss) income before income taxes |
(38,897 | ) | 19,312 | |||||
| Income tax benefit (expense) |
572 | (1,524 | ) | |||||
|
|
|
|
|
|||||
| Net (loss) income |
(38,325 | ) | 17,788 | |||||
| Less net loss attributable to noncontrolling interest |
— | (2 | ) | |||||
|
|
|
|
|
|||||
| Net (loss) income attributable to Predecessor |
$ | (38,325 | ) | $ | 17,790 | |||
|
|
|
|
|
|||||
| Pro Forma Information (Unaudited) |
||||||||
| Net loss attributable to predecessor |
$ | (38,325 | ) | |||||
| Pro forma tax benefit for income taxes |
13,605 | |||||||
|
|
|
|||||||
| Pro forma net loss |
$ | (24,720 | ) | |||||
|
|
|
|||||||
| Pro forma net loss per common share |
||||||||
| Basic |
$ | |||||||
| Diluted |
$ | |||||||
| Weighted average pro forma common shares outstanding |
||||||||
| Basic |
||||||||
| Diluted |
||||||||
The accompanying notes are an integral part of these consolidated and combined financial statements.
F-19
Table of Contents
CENTENNIAL RESOURCE PRODUCTION, LLC AND CELERO ENERGY COMPANY, LP
(PREDECESSOR)
CONSOLIDATED AND COMBINED STATEMENTS OF CHANGES IN OWNERS’ EQUITY
| Total Owners’ Equity |
Noncontrolling Interest in Subsidiary |
Total Equity |
||||||||||
| (in thousands) | ||||||||||||
| Balance at December 31, 2013 |
$ | 389,859 | $ | 688 | $ | 390,547 | ||||||
| Contributions |
59,776 | 150 | 59,926 | |||||||||
| Repurchase of equity interests |
(119,272 | ) | — | (119,272 | ) | |||||||
| Deemed contribution from sale of assets |
21,489 | (836 | ) | 20,653 | ||||||||
| Deemed contribution from parent for payment of incentive units |
12,420 | — | 12,420 | |||||||||
| Deemed distribution in connection with common control acquisition |
(4,130 | ) | — | (4,130 | ) | |||||||
| Net income (loss) |
17,790 | (2 | ) | 17,788 | ||||||||
|
|
|
|
|
|
|
|||||||
| Balance at December 31, 2014 |
377,932 | — | 377,932 | |||||||||
| Contributions |
111,396 | — | 111,396 | |||||||||
| Deemed distribution from sale of assets |
(139 | ) | — | (139 | ) | |||||||
| Net loss |
(38,325 | ) | — | (38,325 | ) | |||||||
|
|
|
|
|
|
|
|||||||
| Balance at December 31, 2015 |
$ | 450,864 | $ | — | $ | 450,864 | ||||||
|
|
|
|
|
|
|
|||||||
The accompanying notes are an integral part of these consolidated and combined financial statements.
F-20
Table of Contents
CENTENNIAL RESOURCE PRODUCTION, LLC AND CELERO ENERGY COMPANY, LP
(PREDECESSOR)
CONSOLIDATED AND COMBINED STATEMENTS OF CASH FLOWS
| For the Year Ended December 31, | ||||||||
| 2015 | 2014 | |||||||
| (in thousands) | ||||||||
| Cash flows from operating activities |
||||||||
| Net (loss) income |
$ | (38,325 | ) | $ | 17,788 | |||
| Adjustments to reconcile net (loss) income to net cash provided by operating activities: |
||||||||
| Accretion of asset retirement obligations |
139 | 156 | ||||||
| Depreciation, depletion and amortization |
89,945 | 68,954 | ||||||
| Noncash incentive compensation expense |
— | 12,420 | ||||||
| Abandonment and impairment of unproved leases |
7,619 | 20,025 | ||||||
| Write-off of deferred S-1 related expense |
1,585 | — | ||||||
| Deferred tax (benefit) expense |
(572 | ) | 1,524 | |||||
| (Gain) loss on sale of oil and natural gas properties |
(2,439 | ) | 2,096 | |||||
| Gain on derivative instruments |
(20,756 | ) | (41,943 | ) | ||||
| Net cash received for derivative settlements |
35,493 | 4,611 | ||||||
| Recovery of bad debt |
— | (777 | ) | |||||
| Amortization of debt issuance costs |
482 | 316 | ||||||
| Changes in operating assets and liabilities: |
||||||||
| Decrease (increase) in accounts receivable |
5,244 | (6,322 | ) | |||||
| Increase in prepaid and other assets |
(864 | ) | (79 | ) | ||||
| (Decrease) increase in accounts payable and other liabilities |
(8,669 | ) | 18,479 | |||||
|
|
|
|
|
|||||
| Net cash provided by operating activities |
68,882 | 97,248 | ||||||
|
|
|
|
|
|||||
| Cash flows from investing activities |
||||||||
| Acquisition of oil and natural gas properties |
(43,223 | ) | (22,167 | ) | ||||
| Development of oil and natural gas properties |
(156,006 | ) | (275,683 | ) | ||||
| Purchases of other property and equipment |
(2,097 | ) | (453 | ) | ||||
| Proceeds from sales of oil and natural gas properties and other assets |
2,691 | 72,382 | ||||||
| Development of assets held for sale |
— | (14,240 | ) | |||||
| Proceeds from sale of Atlantic Midstream, net of cash sold |
— | 71,781 | ||||||
| Change in cash held in escrow |
— | 5,000 | ||||||
|
|
|
|
|
|||||
| Net cash used by investing activities |
(198,635 | ) | (163,380 | ) | ||||
|
|
|
|
|
|||||
| Cash flows from financing activities |
||||||||
| Proceeds from revolving credit facility |
92,000 | 196,000 | ||||||
| Repayment of revolving credit facility |
(83,000 | ) | (160,000 | ) | ||||
| Financing obligation |
(1,633 | ) | — | |||||
| Capital contributions |
111,396 | 59,776 | ||||||
| Debt issuance costs |
(259 | ) | (1,637 | ) | ||||
| Repurchase of equity |
— | (119,272 | ) | |||||
| Proceeds from term loan |
— | 65,000 | ||||||
| Distribution in connection with common control acquisition |
— | (3,051 | ) | |||||
| Contributions received from noncontrolling interest |
— | 150 | ||||||
|
|
|
|
|
|||||
| Net cash provided by financing activities |
118,504 | 36,966 | ||||||
|
|
|
|
|
|||||
| Net decrease in cash and cash equivalents |
(11,249 | ) | (29,166 | ) | ||||
| Cash and cash equivalents, beginning |
13,017 | 42,183 | ||||||
|
|
|
|
|
|||||
| Cash and cash equivalents, end |
$ | 1,768 | $ | 13,017 | ||||
|
|
|
|
|
|||||
| Supplemental disclosures of cash flow information: |
||||||||
| Cash paid for interest |
$ | 5,782 | $ | 1,935 | ||||
| Supplemental disclosures of noncash activity: |
||||||||
| Accrued capital expenditures included in accounts payable and accrued expenses |
$ | 13,124 | $ | 81,510 | ||||
| Financing obligation |
3,770 | — | ||||||
The accompanying notes are an integral part of these consolidated and combined financial statements.
F-21
Table of Contents
CENTENNIAL RESOURCE PRODUCTION, LLC AND CELERO ENERGY COMPANY, LP
(PREDECESSOR)
NOTES TO CONSOLIDATED AND COMBINED FINANCIAL STATEMENTS
Note 1—Organization and Nature of Operations
Centennial Resource Production, LLC, a Delaware limited liability company formerly named Atlantic Energy Holdings, LLC (“Centennial OpCo”), was formed on August 30, 2012 by its management members, third-party investors and NGP Natural Resources X, LP (“NGP X”), an affiliate of Natural Gas Partners (“NGP”), a family of energy-focused private equity investment funds. Centennial OpCo is engaged in the development and acquisition of unconventional oil and associated liquids-rich natural gas reserves, primarily in the Delaware Basin of West Texas.
Atlantic Midstream was formed on May 21, 2013, as a Delaware limited liability company and is constructing assets to gather and process natural gas in the Delaware Basin of West Texas. Centennial OpCo sold its interests in Atlantic Midstream on February 12, 2014 (refer to Note 4—Acquisitions and Divestitures).
On March 31, 2014, all of Centennial OpCo’s employee members sold their membership interests to Centennial OpCo. Contemporaneously, Centennial Resource Development, LLC, a Delaware limited liability company formed by NGP X and certain management members (“Centennial HoldCo”), agreed to purchase the entirety of Centennial OpCo’s issued and outstanding incentive units. On April 30, 2014, NGP X contributed and conveyed its membership interests in Centennial OpCo to Centennial HoldCo. On May 9, 2014, Centennial OpCo’s remaining members sold their membership interests to Centennial OpCo. As a result of these transactions, Centennial OpCo became a wholly-owned subsidiary of Centennial HoldCo. Centennial HoldCo is a holding company with no independent operations apart from its ownership interests in Centennial OpCo. NGP X controls Centennial HoldCo through ownership of 99.0% of its membership interests.
Celero Energy Company, LP, a Delaware limited partnership (“Celero”), was formed on September 22, 2006, by its general partner, Celero Energy Management, LLC (“Celero GP”), its management team and Natural Gas Partners VIII, L.P. (“NGP VIII”), also an affiliate of NGP. Celero is engaged in the development and acquisition of oil and natural gas properties in Texas and New Mexico, primarily in the Permian Basin in West Texas.
On October 15, 2014, Celero conveyed substantially all of its oil and gas properties and other assets to Centennial OpCo in exchange for membership interests in Centennial OpCo (the “Combination”). As a result of the transaction, Centennial HoldCo owned approximately 72% of Centennial OpCo, and Celero owned the remaining 28%.
In 2015, NGP Centennial Follow-On LLC (“Follow-On”), a Delaware limited liability company controlled by NGP but the economic interests in which are owned by unaffiliated third party investors and management, contributed $84.2 million to Centennial OpCo in exchange for membership interests in Centennial OpCo. In addition, Centennial HoldCo contributed approximately $27.2 million to Centennial OpCo in exchange for additional membership interests in Centennial OpCo. Accordingly, Centennial HoldCo, Celero and Follow-On own an approximate 61.2%, 21.2% and 17.6% membership interest in Centennial OpCo, respectively.
Note 2—Basis of Presentation, Significant Accounting Policies, and Recently Issued Accounting Standards
Basis of Presentation
Through the delegation of authority of the general partners of NGP X and NGP VIII to NGP Energy Capital Management, L.L.C. (“NGP ECM”), all power and authority of the respective fund limited partnership in effectuating its core investment, management and divestment function is controlled by NGP ECM. As all power and authority to control the core functions of Centennial OpCo and Celero (collectively, the “Predecessor”) are
F-22
Table of Contents
CENTENNIAL RESOURCE PRODUCTION, LLC AND CELERO ENERGY COMPANY, LP
(PREDECESSOR)
NOTES TO CONSOLIDATED AND COMBINED FINANCIAL STATEMENTS—(Continued)
controlled by NGP X and NGP VIII, respectively, the Combination has been accounted for as a reorganization of entities under common control in a manner similar to a pooling of interests. The results of Centennial OpCo and Celero have been combined for all periods in which common control existed for financial reporting purposes. All significant intercompany and intra-company balances and transactions have been eliminated.
Certain prior period amounts have been reclassified to conform to the current presentation on the accompanying consolidated and combined financial statements.
Under certain contracts, when NGLs are extracted from the gas stream, processors receive a portion of the sales value from both the residue gas and the NGLs as a processing fee and remit the contractual proceeds to us. Prior to 2015, revenue was recognized net of these processing fees for residue gas and NGLs sold under these contracts as allowed under Financial Accounting Standards Board (“FASB”) Accounting Standards Codification (“ASC”) Topic 605, Revenue Recognition. Increasing NGL production has resulted in processing costs becoming more significant. Accordingly, the Predecessor changed its policy to record these processing costs with operating costs as allowed under ASC 605. Beginning in 2015, the Predecessor’s realized prices for sales under these contracts reflect the value of 100% of the residue gas and NGLs yielded by processing, rather than the value associated with the contractual proceeds it received. The related processing fees now are included in Transportation, processing, gathering, and other operating expense. Financial statements for periods prior to 2015 have been reclassified to reflect this change in accounting treatment. There was no impact on operating income.
Assumptions, Judgments and Estimates
In the course of preparing the Predecessor’s consolidated and combined financial statements, the Predecessor’s management makes various assumptions, judgments and estimates to determine the reported amounts of assets, liabilities, revenues and expenses, and in the disclosures of commitments and contingencies. Changes in these assumptions, judgments, and estimates will occur as a result of the passage of time and the occurrence of future events and, accordingly, actual results could differ from amounts previously established.
The more significant areas requiring the use of assumptions, judgments and estimates include: (1) oil and natural gas reserves; (2) cash flow estimates used in impairment tests of long-lived assets; (3) depreciation, depletion and amortization; (4) asset retirement obligations; (5) determining fair value and allocating purchase price in connection with business combinations; (6) valuation of derivative instruments; and (7) accrued revenue and related receivables.
The accompanying financial statements have been prepared in accordance with accounting principles generally accepted in the United States of America (“U.S. GAAP”).
Significant Accounting Policies
Cash and Cash Equivalents
The Predecessor considers all highly liquid instruments with an original maturity of three months or less at the time of issuance to be cash equivalents.
F-23
Table of Contents
CENTENNIAL RESOURCE PRODUCTION, LLC AND CELERO ENERGY COMPANY, LP
(PREDECESSOR)
NOTES TO CONSOLIDATED AND COMBINED FINANCIAL STATEMENTS—(Continued)
Accounts Receivable
Accounts receivable consists mainly of receivables from oil and natural gas purchasers and from joint interest owners on properties the Predecessor operates. For receivables from joint interest owners, the Predecessor typically has the ability to withhold future revenue disbursements to recover non-payment of joint interest billings. Generally, oil and natural gas receivables are collected within two months and the Predecessor has had minimal bad debts. The Predecessor establishes an allowance for doubtful accounts equal to the estimable portions of accounts receivable for which failure to collect is probable. The Predecessor’s allowance for doubtful accounts totaled $0.1 million and $0.3 million as of December 31, 2015 and 2014, respectively.
Credit Risk and Other Concentrations
The Predecessor sells oil and natural gas to various third party purchasers. The future availability of a ready market for oil and natural gas depends on numerous factors outside the Predecessor’s control, none of which can be predicted with certainty. For the year ended December 31, 2015 and 2014, the Predecessor had one major customer, Plains Marketing, LP, which accounted for 64% and 78%, respectively, of total revenue. The Predecessor does not require collateral and does not believe the loss of any single purchaser would materially impact its operating results, as crude oil and natural gas are fungible products with well-established markets and numerous purchasers.
By using derivative instruments to economically hedge exposures to changes in commodity prices, the Predecessor exposes itself to credit risk and market risk. Credit risk is the failure of the counterparty to perform under the terms of the derivative contract. When the fair value of a derivative contract is positive, the counterparty owes the Predecessor, which creates credit risk. As of December 31, 2015, and through the filing date of this report, all of the Predecessor’s derivative counterparties were members of the Predecessor’s credit facility lender group. The credit facility is secured by the Predecessor’s proved oil and natural gas properties and therefore, the Predecessor is not required to post any collateral. The Predecessor does not receive collateral from its counterparties. The maximum amount of loss due to credit risk that the Predecessor would incur if its counterparties failed completely to perform according to the terms of the contracts, based on the gross fair value of financial instruments, was approximately $21.5 million at December 31, 2015. The Predecessor minimizes the credit risk in derivative instruments by: (i) limiting its exposure to any single counterparty; and (ii) monitoring the creditworthiness of the Predecessor’s counterparties on an ongoing basis. In accordance with the Predecessor’s standard practice, its commodity derivatives are subject to counterparty netting under agreements governing such derivatives and therefore the risk of loss due to counterparty nonperformance is somewhat mitigated.
The Predecessor places its temporary cash investments with high-quality financial institutions and does not limit the amount of credit exposure to any one financial institution. For the years ended December 31, 2015 and 2014, the Predecessor has not incurred losses related to these investments.
Oil and Natural Gas Properties
The Predecessor follows the successful efforts method of accounting for its oil and natural gas properties. Under the successful efforts method, the costs incurred to acquire, drill, and complete productive wells and development wells are capitalized. Oil and gas lease acquisition costs are also capitalized. Exploration costs, including personnel and other internal costs, geological and geophysical expenses, delay rentals for gas and oil leases, and costs associated with unsuccessful lease acquisitions are charged to expense as incurred. Costs of drilling exploratory wells are initially capitalized but are charged to expense if the well is determined to be
F-24
Table of Contents
CENTENNIAL RESOURCE PRODUCTION, LLC AND CELERO ENERGY COMPANY, LP
(PREDECESSOR)
NOTES TO CONSOLIDATED AND COMBINED FINANCIAL STATEMENTS—(Continued)
unsuccessful. As of December 31, 2015 and 2014, no costs were capitalized in connection with exploratory wells in progress. Net carrying values of retired, sold or abandoned properties that constitute less than a complete unit of depreciable property are charged or credited, net of proceeds, to accumulated depreciation, depletion and amortization unless doing so significantly affects the unit-of-production amortization rate, in which case a gain or loss is recognized in income. Gains or losses from the disposal of complete units of depreciable property are recognized to income.
Unproved properties consist of costs to acquire undeveloped leases as well as costs to acquire unproved reserves. The Predecessor evaluates significant unproved properties for impairment based on remaining lease term, drilling results, reservoir performance, seismic interpretation or future plans to develop acreage. Unproved properties and the related costs are transferred to proved properties when reserves are discovered on or otherwise attributed to the property. For the year ended December 31, 2015, the Predecessor recorded abandonment and impairment expense of $7.6 million for leases which have expired, or are expected to expire. For the year-ended December 31, 2014, the Predecessor recorded impairment expense of $20.0 million, of which $13.8 million was attributable to an impairment of unproved properties and $6.2 million was attributable to leases which had expired, or were expected to expire.
The Predecessor reviews its proved oil and natural gas properties for impairment when events and circumstances indicate a possible decline in the recoverability of the carrying amount of such property. The Predecessor estimates the expected future cash flows of its oil and natural gas properties and compares these undiscounted cash flows to the carrying amount of the oil and natural gas properties to determine if the carrying amount is recoverable. If the carrying amount exceeds the estimated undiscounted future cash flows, the Predecessor will write down the carrying amount of the oil and natural gas properties to fair value. The factors used to determine fair value include, but are not limited to, estimates of reserves, future commodity prices, future production estimates, estimated future capital expenditures and discount rates commensurate with the risk associated with realizing the projected cash flows. There were no impairments of proved oil and natural gas properties during the years ended December 31, 2015 and 2014.
Other Property and Equipment
Other property and equipment such as office furniture and equipment, buildings, vehicles, and computer hardware and software is recorded at cost. Depreciation is calculated using the straight-line method over the estimated useful lives of the assets ranging from three to twenty years. Major renewals and improvements are capitalized while expenditures for maintenance and repairs are expensed as incurred. When other property and equipment is sold or retired, the capitalized costs and related accumulated depreciation are removed from the accounts.
Deferred Loan Costs
Deferred loan costs related to the Predecessor’s revolving credit facility are included in the line item Other noncurrent assets in the consolidated and combined balance sheets and are stated at cost, net of amortization, and are amortized to interest expense on a straight line basis over the borrowing term. Please refer to Recently Issued Accounting Standards, for additional discussion of deferred loan costs related to the Predecessor’s term loan.
Derivative Financial Instruments
In order to manage its exposure to oil and natural gas price volatility, the Predecessor enters into derivative transactions from time to time, including commodity swap agreements, basis swap agreements, collar
F-25
Table of Contents
CENTENNIAL RESOURCE PRODUCTION, LLC AND CELERO ENERGY COMPANY, LP
(PREDECESSOR)
NOTES TO CONSOLIDATED AND COMBINED FINANCIAL STATEMENTS—(Continued)
agreements, and other similar agreements relating to the price risk associated with a portion of its production. To the extent legal right of offset exists with a counterparty, the Predecessor reports derivative assets and liabilities on a net basis.
The Predecessor records derivative instruments on the consolidated and combined balance sheets as either an asset or liability measured at fair value and records changes in the fair value of derivatives in current earnings as they occur. The Predecessor’s derivatives have not been designated as hedges for accounting purposes. For additional discussion on derivatives, please refer to Note 5—Derivative Financial Instruments.
Asset Retirement Obligations
The Predecessor recognizes an estimated liability for future costs associated with the abandonment of its oil and natural gas properties. A liability for the fair value of an asset retirement obligation and corresponding increase to the carrying value of the related long-lived asset are recorded at the time a well is drilled or acquired. The increase in carrying value is included in proved oil and natural gas properties in the accompanying consolidated and combined balance sheets. The Predecessor depletes the amount added to proved oil and natural gas property costs and recognizes expense in connection with the accretion of the discounted liability over the remaining estimated economic lives of the respective oil and natural gas properties. For additional discussion, please refer to Note 10—Asset Retirement Obligations.
Revenue Recognition
The Predecessor derives revenue primarily from the sale of produced oil, natural gas, and NGLs. Revenue is recognized when the Predecessor’s production is delivered to the purchaser, but payment is generally received between 30 and 90 days after the date of production. No revenue is recognized unless it is determined that title to the product has transferred to the purchaser. At the end of each month, the Predecessor estimates the amount of production delivered to the purchaser and the price it will receive. The Predecessor follows the sales method of accounting for its oil and natural gas revenue, whereby revenue is recorded based on the Predecessor’s share of volume sold, regardless of whether the Predecessor has taken its proportional share of volume produced. A receivable or liability is recognized only to the extent that the Predecessor has an imbalance on a specific property greater than the expected remaining proved reserves. The Predecessor had no significant imbalances as of December 31, 2015 or 2014.
Incentive Units
Incentive units are accounted for as liability awards under FASB ASC Topic 718, Compensation-Stock Compensation, with compensation expense based on period-end fair value. No incentive compensation expense was recorded at December 31, 2015 or 2014, because it was not probable that the performance criterion would be met. For additional discussion, please refer to Note 9—Incentive Unit Compensation.
Segment Reporting
The Predecessor operates in only one industry segment, which is the exploration and production of oil and natural gas. All of its operations are conducted in one geographic area of the United States. All revenues are derived from customers located in the United States.
F-26
Table of Contents
CENTENNIAL RESOURCE PRODUCTION, LLC AND CELERO ENERGY COMPANY, LP
(PREDECESSOR)
NOTES TO CONSOLIDATED AND COMBINED FINANCIAL STATEMENTS—(Continued)
Income Taxes
Centennial OpCo is organized as a Delaware limited liability company, and Celero is organized as a Delaware limited partnership. As such, the Predecessor is treated as a flow-through entity for U.S. federal income tax purposes and for purposes of certain state and local income taxes. For such purposes, the net taxable income of the Predecessor and any related tax credits are passed through to the owners and are included in their tax returns, even though such net taxable income or tax credits may not have actually been distributed. Accordingly, no provision has been made in the consolidated and combined financial statements of the Predecessor for such income taxes paid at the owner level.
The Predecessor is subject to the Texas franchise tax, at a statutory rate of 0.75% of taxable margin. Deferred tax assets and liabilities are recognized for future Texas franchise tax consequences attributable to differences between the financial statement carrying amount of existing assets and liabilities and their respective Texas franchise tax bases. As of December 31, 2015 and 2014, the Predecessor’s long-term deferred tax liability was $2.4 million and $2.9 million, respectively.
The Predecessor evaluates the tax positions taken or expected to be taken in the course of preparing its tax returns and disallows the recognition of tax positions not deemed to meet a “more-likely-than-not” threshold of being sustained by the applicable tax authority. The Predecessor’s management does not believe that any tax positions included in its tax returns would not meet this threshold. The Predecessor’s policy is to reflect interest and penalties related to uncertain tax positions as part of its income tax expense, when and if they become applicable.
As of December 31, 2015 the Predecessor has no current tax years under audit. The Predecessor remains subject to examination for federal income taxes and state income taxes for tax years 2012-2015.
Unaudited Pro Forma Income Taxes
These financial statements have been prepared in anticipation of a proposed initial public offering (the “Offering”) of the common stock of the Predecessor’s parent entity. In connection with the Offering, all interests in the Predecessor will be contributed to a Delaware corporation that will be taxed as a corporation under the Internal Revenue Code of 1986, as amended, and thus generally subject to U.S. federal, state and local income taxes. Accordingly, a pro forma income tax provision has been disclosed as if the Predecessor were a taxable corporation for all periods presented. The Predecessor has computed pro forma entity-level income tax expense using an estimated effective rate of 36%, inclusive of all applicable U.S. federal, state and local income taxes.
Unaudited Pro Forma Earnings Per Share
The Predecessor has presented pro forma earnings per share for the most recent period. Pro forma basic and diluted income per share was computed by dividing pro forma net income attributable to the Predecessor by the number of shares of common stock attributable to the Predecessor to be issued in the initial public offering described in the registration statement, as if such shares were issued and outstanding for the period ended December 31, 2014.
Recently Issued Accounting Standards
In May 2014, In May 2014, the FASB issued ASU 2014-09, Revenue from Contracts with Customers. This guidance is to be applied using a full retrospective method or a modified retrospective method, as outlined in the
F-27
Table of Contents
CENTENNIAL RESOURCE PRODUCTION, LLC AND CELERO ENERGY COMPANY, LP
(PREDECESSOR)
NOTES TO CONSOLIDATED AND COMBINED FINANCIAL STATEMENTS—(Continued)
guidance. In August 2015, the FASB deferred the effective date of the new revenue recognition standard by one year. The revenue recognition standard is now effective for annual periods, and interim periods within those annual periods, beginning after December 15, 2017. Early adoption is permitted but only for annual periods, and interim periods within those annual periods, beginning after December 15, 2016. The Predecessor is currently evaluating the impact, if any, that the adoption of this update will have on its consolidated and combined financial statements or disclosures.
In August 2014, the FASB issued ASU No. 2014-15, Disclosure of Uncertainties about an Entity’s Ability to Continue as a Going Concern. This update requires management to evaluate whether there are conditions or events that raise substantial doubt about an entity’s ability to continue as a going concern within one year after the date that the entity’s financial statements are issued, or within one year after the date the entity’s financial statements are available to be issued, and to provide disclosures when certain criteria are met. This guidance is effective for the annual period ending after December 15, 2016, and for annual periods and interim periods thereafter. Early application is permitted. The Predecessor is currently evaluating the impact, if any, that the adoption of this update will have on its consolidated and combined financial statements or disclosures.
Effective November 1, 2015, the Predecessor early adopted, on a retrospective basis, ASU No. 2015-03, Simplifying the Presentation of Debt Issuance Costs (“ASU 2015-03”). ASU 2015-03 requires deferred financing costs to be presented on the accompanying consolidated and combined balance sheets as a direct deduction from the carrying value of the related debt liability. In accordance, the Predecessor has reclassified $0.4 million of deferred financing costs related to its term loan, from the other noncurrent assets line item to the term loan, net of unamortized deferred financing costs line item. The December 31, 2014 accompanying balance sheet line items that were adjusted as a result of the adoption of ASU No. 2015-03 are presented in the following table:
| As of December 31, 2014 | ||||||||
| As Reported | As Adjusted | |||||||
| (in thousands) | ||||||||
| Other noncurrent assets |
$ | 1,866 | $ | 1,434 | ||||
| Total assets |
$ | 616,201 | $ | 615,769 | ||||
| Term loan |
$ | 65,000 | $ | — | ||||
| Term loan, net of unamortized deferred financing costs |
$ | — | $ | 64,568 | ||||
| Total liabilities |
$ | 238,269 | $ | 237,837 | ||||
| Total liabilities and owners’ equity |
$ | 616,201 | $ | 615,769 | ||||
ASU 2015-03 does not specifically address the accounting for deferred financing costs related to line-of-credit arrangements. In August 2015, the FASB issued ASU No. 2015-15, Presentation and Subsequent Measurement of Debt Issuance Costs Associated with Line-of-Credit Arrangements (“ASU 2015-15”) allowing for deferred financing costs associated with line-of-credit arrangements to continue to be presented as assets. ASU 2015-15 is consistent with how the Predecessor currently accounts for deferred financing costs related to the Predecessor’s revolving credit facility.
Effective January 1, 2015, the Predecessor early adopted, on a prospective basis, ASU No. 2015-01, Income Statement—Extraordinary and Unusual Items. This ASU simplifies income statement presentation by eliminating the concept of extraordinary items. There was no impact to the Predecessor’s consolidated and combined financial statements or disclosures from the adoption of this standard.
Effective December 1, 2015, the Predecessor early adopted, on a prospective basis, ASU No. 2015-17, Balance Sheet Classification of Deferred Taxes (“ASU 2015-17”). This ASU requires that deferred tax liabilities
F-28
Table of Contents
CENTENNIAL RESOURCE PRODUCTION, LLC AND CELERO ENERGY COMPANY, LP
(PREDECESSOR)
NOTES TO CONSOLIDATED AND COMBINED FINANCIAL STATEMENTS—(Continued)
and assets, along with any related valuation allowance, be classified as noncurrent on the balance sheet. The current requirement that deferred tax liabilities and assets of a tax-paying component of an entity be offset and presented as a single amount is not affected by the amendments in ASU 2015-17. As ASU 2015-17 was adopted on a prospective basis, the Predecessor did not retrospectively adjust prior periods.
Note 3—Accounts Receivable and Accounts Payable and Accrued Expenses
Accounts receivable are comprised of the following:
| December 31, 2015 |
December 31, 2014 |
|||||||
| (in thousands) | ||||||||
| Oil and natural gas |
$ | 5,789 | $ | 9,116 | ||||
| Joint interest billings |
1,514 | 11,116 | ||||||
| Hedge settlements |
3,956 | 3,141 | ||||||
| Other |
1,844 | — | ||||||
| Allowance for doubtful accounts |
(91 | ) | (256 | ) | ||||
|
|
|
|
|
|||||
| Accounts receivable, net |
$ | 13,012 | $ | 23,117 | ||||
|
|
|
|
|
|||||
Accounts payable and accrued expenses are comprised of the following:
| December 31, 2015 |
December 31, 2014 |
|||||||
| (in thousands) | ||||||||
| Accounts payable |
$ | 1,827 | $ | 30,224 | ||||
| Accrued capital expenditures |
11,700 | 59,675 | ||||||
| Revenues payable |
3,439 | 7,566 | ||||||
| Other |
3,019 | 3,830 | ||||||
|
|
|
|
|
|||||
| Accounts payable and accrued expenses |
$ | 19,985 | $ | 101,295 | ||||
|
|
|
|
|
|||||
Note 4—Acquisitions and Divestitures
2015 Acquisitions
On September 1, 2015, the Predecessor acquired additional interests in proved and unproved oil and natural gas properties in the Delaware Basin. Total cash consideration paid by the Predecessor was $16.0 million, net of closing adjustments.
On September 3, 2015, the Predecessor acquired a non-operated interest in 1,804 net acres in the Delaware Basin from an unrelated third party. Total cash consideration paid by the Predecessor was $6.4 million, net of closing adjustments.
F-29
Table of Contents
CENTENNIAL RESOURCE PRODUCTION, LLC AND CELERO ENERGY COMPANY, LP
(PREDECESSOR)
NOTES TO CONSOLIDATED AND COMBINED FINANCIAL STATEMENTS—(Continued)
The Predecessor determined that both of these acquisitions met the criteria for business combinations under FASB ASC Topic 805, Business Combinations. The Predecessor allocated the final purchase prices to the acquired assets and liabilities based on fair value as of the respective acquisition dates, as summarized in the table below. Refer to Note 6—Fair Value Measurements for additional discussion on the valuation techniques used in determining the fair value of the acquired properties.
| Acquisition #1 | Acquisition #2 | |||||||
| September 1, 2015 |
September 3, 2015 |
|||||||
| (in thousands) | ||||||||
| Cash Consideration |
$ | 16,006 | $ | 6,369 | ||||
|
|
|
|
|
|||||
| Fair value of assets and liabilities acquired: |
||||||||
| Proved oil and natural gas properties |
7,731 | 6,491 | ||||||
| Unproved oil and natural gas properties |
8,312 | — | ||||||
|
|
|
|
|
|||||
| Total fair value of oil and natural gas properties acquired |
16,043 | 6,491 | ||||||
| Asset retirement obligation |
(37 | ) | (122 | ) | ||||
|
|
|
|
|
|||||
| Total fair value of net assets acquired |
$ | 16,006 | $ | 6,369 | ||||
|
|
|
|
|
|||||
2014 Acquisitions
In June 2014, Centennial OpCo acquired 2,400 net acres in the Delaware Basin from an unrelated third party, for approximately $11.0 million, net of customary closing adjustments.
2014 Dispositions
In December 2014, the Centennial OpCo sold its interest in approximately 1,845 net acres in Ward County, Texas, including 18 vertical wells, to an NGP-controlled entity for proceeds of $12.5 million, which resulted in a gain of $1.5 million and was recorded as an equity contribution due to the entities being under common control.
In May 2014, Celero sold its Caprock field to an unrelated third party for $59.3 million, net of customary closing adjustments. A net loss of $2.2 million was recognized on the sale during the second quarter of 2014.
In February 2014, the Centennial OpCo sold its 98.5% interest in Atlantic Midstream to PennTex Permian, an NGP-controlled entity for net proceeds of $71.8 million, which resulted in a gain of $20.0 million and was recorded as an equity contribution due to the entities being under common control.
Note 5—Derivative Financial Instruments
The Predecessor has entered into various commodity derivative instruments to mitigate a portion of its exposure to potentially adverse market changes in commodity prices and the associated impact on cash flows. All contracts are entered into for other-than-trading purposes. The Predecessor’s derivative contracts include swap arrangements for oil.
In a typical commodity swap agreement, if the agreed upon published third-party index price (“index price”) is lower than the swap fixed price, the Predecessor receives the difference between the index price and the agreed upon swap fixed price. If the index price is higher than the swap fixed price, the Predecessor pays the difference. In addition, the Predecessor has entered into basis swap contracts in order to hedge the difference between the NYMEX index price and a local index price. When the actual differential exceeds the fixed price provided by the basis swap contract, the Predecessor receives the difference from the counterparty; when the differential is less than the fixed price provided by the basis swap contract, the Predecessor pays the difference to the counterparty.
F-30
Table of Contents
CENTENNIAL RESOURCE PRODUCTION, LLC AND CELERO ENERGY COMPANY, LP
(PREDECESSOR)
NOTES TO CONSOLIDATED AND COMBINED FINANCIAL STATEMENTS—(Continued)
The Predecessor’s derivative instruments have not been designated as hedges for accounting purposes; therefore, all gains and losses are recognized in the Predecessor’s consolidated and combined statements of operations. The Predecessor’s commodity derivatives are measured at fair value and are included in the accompanying consolidated and combined balance sheets as derivative assets. The fair value of the commodity contracts was a net asset of $21.1 million and $36.8 million as of December 31, 2015 and 2014, respectively.
As of December 31, 2015, the Predecessor had open crude oil derivative positions with respect to future production as set forth in the table below. When aggregating multiple contracts, the weighted average contract price is disclosed.
| 2016 | 2017 | |||||||
| Crude Oil Swaps: |
||||||||
| Notional volume (Bbl) |
729,000 | 127,750 | ||||||
| Weighted average floor price ($/Bbl) |
$ | 67.82 | $ | 61.36 | ||||
| Crude Oil Basis Swaps : |
||||||||
| Notional volume (Bbl) |
622,200 | 91,250 | ||||||
| Weighted average floor price ($/Bbl) |
$ | (0.71 | ) | $ | (0.20 | ) | ||
The following tables below summarize the gross fair value of derivative assets and liabilities and the effect of netting on the consolidated and combined balance sheets (in thousands):
| Balance Sheet Classification |
Gross Amounts |
Netting Adjustments |
Net Amounts Presented on the Balance Sheet |
|||||||||||
| December 31, 2015: |
||||||||||||||
| Assets: |
||||||||||||||
| Derivative instruments |
Current assets | $ | 19,469 | $ | (426 | ) | $ | 19,043 | ||||||
| Derivative instruments |
Noncurrent assets | 2,071 | (1 | ) | 2,070 | |||||||||
|
|
|
|
|
|
|
|||||||||
| Total assets |
$ | 21,540 | $ | (427 | ) | $ | 21,113 | |||||||
|
|
|
|
|
|
|
|||||||||
| Balance Sheet Classification |
Gross Amounts |
Netting Adjustments |
Net Amounts Presented on the Balance Sheet |
|||||||||||
| December 31, 2014: |
||||||||||||||
| Assets: |
||||||||||||||
| Derivative instruments |
Current assets | $ | 30,444 | $ | (22 | ) | $ | 30,422 | ||||||
| Derivative instruments |
Noncurrent assets | 6,365 | — | 6,365 | ||||||||||
|
|
|
|
|
|
|
|||||||||
| Total assets |
$ | 36,809 | $ | (22 | ) | $ | 36,787 | |||||||
|
|
|
|
|
|
|
|||||||||
The following table presents gains for derivative instruments not designated as hedges for accounting purposes for the periods presented (in thousands):
| For the Year Ended December 31, |
||||||||
| 2015 | 2014 | |||||||
| Gain on derivative instruments |
$ | 20,756 | $ | 41,943 | ||||
F-31
Table of Contents
CENTENNIAL RESOURCE PRODUCTION, LLC AND CELERO ENERGY COMPANY, LP
(PREDECESSOR)
NOTES TO CONSOLIDATED AND COMBINED FINANCIAL STATEMENTS—(Continued)
Note 6—Fair Value Measurements
Assets and Liabilities Measured at Fair Value on a Recurring Basis
The Predecessor has categorized its assets and liabilities measured at fair value, based on the priority of inputs to the valuation technique, into a three-level fair value hierarchy. Level 1 inputs are the highest priority and consist of unadjusted quoted prices in active markets for identical assets and liabilities. Level 2 are inputs other than quoted prices that are observable for the asset or liability, either directly or indirectly. Level 3 are unobservable inputs for an asset or liability.
The following table is a listing of the Predecessor’s assets and liabilities that are measured at fair value and where they were classified within the fair value hierarchy as of December 31, 2015:
| Level 1 | Level 2 | Level 3 | ||||||||||
| Assets: |
||||||||||||
| Derivative instruments, net(1) |
$ | — | $ | 21,113 | $ | — | ||||||
| (1) | This represents financial assets or liabilities that are measured at fair value on a recurring basis. |
The following table is a listing of the Predecessor’s assets and liabilities that are measured at fair value and where they were classified within the fair value hierarchy as of December 31, 2014:
| Level 1 | Level 2 | Level 3 | ||||||||||
| Assets: |
||||||||||||
| Derivative instruments, net(1) |
$ | — | $ | 36,787 | $ | — | ||||||
| Unproved oil and gas properties(2) |
$ | — | $ | — | $ | 5,705 | ||||||
| (1) | This represents a financial asset or liability that is measured at fair value on a recurring basis. |
| (2) | This represents a non-financial asset that is measured at fair value on a nonrecurring basis. |
Both financial and non-financial assets and liabilities are categorized within the above fair value hierarchy based on the lowest level of input that is significant to the fair value measurement. The following is a description of the valuation methodologies used by the Predecessor as well as the general classification of such instruments pursuant to the above fair value hierarchy. There were no transfers between Level 1, Level 2 or Level 3 during any period presented.
Derivatives
The Predecessor uses Level 2 inputs to measure the fair value the Predecessor’s derivative instruments. The fair value of all derivative instruments is estimated with industry-standard models that consider various assumptions, including quoted forward prices for commodities, time value, volatility factors and current market and contractual prices for the underlying instruments, as well as other relevant economic measures. The fair value of all derivative instruments is estimated using a combined income and market valuation methodology based upon forward commodity price and volatility curves. The curves are obtained from independent pricing services, and the Predecessor has made no adjustments to the obtained prices. The independent pricing services publish observable market information from multiple brokers and exchanges. All valuations were compared against counterparty valuations to verify the reasonableness of prices. The Predecessor also considers counterparty credit risk and its own credit risk in its determination of all estimated fair values. The Predecessor has consistently applied these valuation techniques in all periods presented and believes it has obtained the most accurate information available for the types of derivative contracts it holds. The Predecessor recognizes transfers between levels at the end of the reporting period for which the transfer has occurred.
F-32
Table of Contents
CENTENNIAL RESOURCE PRODUCTION, LLC AND CELERO ENERGY COMPANY, LP
(PREDECESSOR)
NOTES TO CONSOLIDATED AND COMBINED FINANCIAL STATEMENTS—(Continued)
Nonrecurring Fair Value Measurements
Unproved oil and natural gas property costs are evaluated for impairment and reduced to fair value when there is an indication that the carrying costs may not be recoverable. To measure the fair value of the unproved properties, the Predecessor uses a market approach, which takes into account further development plans, risk weighted potential resource recovery, and estimated reserve values (if any). The Predecessor recorded a $13.8 million impairment related to certain unproved oil and natural gas properties for the year ended December 31, 2014.
The fair value measurements of assets acquired and liabilities assumed are measured on a nonrecurring basis on the acquisition date using an income valuation technique based on inputs that are not observable in the market and therefore represent Level 3 inputs. Significant inputs to the valuation of acquired oil and gas properties include estimates of: (i) reserves; (ii) production rates; (iii) future operating and development costs; (iv) future commodity prices, including price differentials; (v) future cash flows; and (vi) a market participant-based weighted average cost of capital rate. These inputs require significant judgments and estimates by the Predecessor’s management at the time of the valuation. Refer to Note 4—Acquisitions and Divestitures for additional information on the fair value of assets acquired during 2015.
Other Financial Instruments
The carrying amounts of our cash, cash equivalents, accounts receivable, accounts payable, and accrued expenses approximate fair value due to the short-term maturities and/or liquid nature of these assets and liabilities. The carrying values of the amounts outstanding under the credit agreement approximate fair value because the variable interest rates are reflective of current market conditions.
Note 7—Long-Term Debt
Credit Agreement
In May 2015, the Predecessor entered into an amendment to its amended and restated credit agreement (“credit agreement”) dated as of October 15, 2014. The amendment extends the term loan maturity from April 15, 2017 to April 15, 2018. The credit agreement includes both a term loan commitment of $65.0 million (the “term loan”) and a revolving credit facility (the “revolving credit facility”) with commitments of $500.0 million (subject to the borrowing base), with a sublimit for letters of credit of $15.0 million. The borrowing base is subject to regular semi-annual redeterminations.
The borrowing base of the revolving credit facility under the credit agreement is determined at the discretion of the lenders, and is subject to regular redeterminations in each quarter of 2015 and on April 1 and October 1 in subsequent years. The borrowing base depends on, among other things, the volumes of the Predecessor’s proved oil and natural gas reserves and estimated cash flows from these reserves and the Predecessor’s commodity hedge positions. In August 2015, the Predecessor’s borrowing base was reaffirmed at $140.0 million. The next redetermination date is scheduled for April 1, 2016. Upon a redetermination of the borrowing base, if borrowings in excess of the revised borrowing capacity were outstanding, the Predecessor could be forced to immediately repay a portion of its debt outstanding under the credit agreement.
At December 31, 2015, outstanding borrowings under the revolving credit facility were $74.0 million and $0.6 million of outstanding letters of credit, leaving $65.4 million in borrowing capacity under the revolving credit facility.
F-33
Table of Contents
CENTENNIAL RESOURCE PRODUCTION, LLC AND CELERO ENERGY COMPANY, LP
(PREDECESSOR)
NOTES TO CONSOLIDATED AND COMBINED FINANCIAL STATEMENTS—(Continued)
Interest on the term loan is LIBOR plus 5.25%. Borrowings under the credit agreement bear interest at either (i) LIBOR plus a margin between 1.50% and 2.50% or (ii) the prime rate plus a margin between 0.50% and 1.50%, in each case, based on the amount utilized. The annual commitment fee on the unused portion of the credit facility ranges between 0.375% and 0.50% based on the amount utilized.
The term loan, net of unamortized deferred financing costs, line on the accompanying consolidated and combined balance sheets as of December 31, 2015 and 2014, consisted of the following:
| December 31, 2015 |
December 31, 2014 |
|||||||
| (in thousands) | ||||||||
| Term loan |
$ | 65,000 | $ | 65,000 | ||||
| Unamortized deferred financing costs |
(351 | ) | (432 | ) | ||||
|
|
|
|
|
|||||
| Term loan, net of unamortized deferred financing costs |
$ | 64,649 | $ | 64,568 | ||||
|
|
|
|
|
|||||
The Predecessor must comply with certain financial and non-financial covenants under the terms of its credit agreement, including limitations on distribution payments, disposition of assets and requirements to maintain certain financial ratios, which include:
| • | a requirement that the Predecessor’s current assets—including amounts available to be drawn under the credit agreement—must exceed current liabilities; |
| • | a requirement that the Predecessor maintain a ratio of consolidated funded debt to consolidated EBITDAX of not more than 4.0 to 1.0. |
At December 31, 2015 the Predecessor was in compliance with its financial covenants.
Note 8—Owners’ Equity
Centennial OpCo’s operations are governed by the provisions of the Fourth Amended and Restated Limited Liability Company Agreement (“Agreement”), effective April 15, 2015. As of December 31, 2015, members included Centennial HoldCo, Celero and Follow-On, owning an approximate 61.2%, 21.2% and 17.6% membership interest in Centennial OpCo, respectively.
In 2015 Follow-On contributed $84.2 million to Centennial OpCo in exchange for membership interests in Centennial OpCo. In addition, Centennial HoldCo contributed approximately $27.2 million to Centennial OpCo in exchange for additional membership interests in Centennial OpCo.
At December 31, 2015, Centennial OpCo has two classes of membership interests outstanding: Class A, which consist of membership interests held by Centennial HoldCo and Follow-On; and Class B, which consist of membership interests held by Celero. As of December 31, 2015, Centennial HoldCo had contributed $289.4 million and had a remaining capital commitment of $32.5 million, Follow-On had contributed $84.2 million and had a remaining capital commitment of $100.3 million, and Celero had contributed $125.4 million in conjunction with the Combination and does not have a remaining capital commitment. Under the terms of the Agreement, Centennial OpCo will dissolve upon the earlier of July 1, 2022; the sale, disposition or termination of all or substantially all of the property owned by Centennial OpCo; or consent in writing of Centennial HoldCo. Pursuant to the Agreement (and as is customary for limited liability companies), the liability of the members is limited to their contributed capital.
F-34
Table of Contents
CENTENNIAL RESOURCE PRODUCTION, LLC AND CELERO ENERGY COMPANY, LP
(PREDECESSOR)
NOTES TO CONSOLIDATED AND COMBINED FINANCIAL STATEMENTS—(Continued)
In December 2014, the Predecessor sold its interest in approximately 1,845 net acres in Ward County, Texas, including 18 vertical wells, to an NGP-controlled entity for proceeds of $12.5 million. Because the Predecessor and purchaser are considered entities under common control, the gain of $1.5 million was recorded as a deemed contribution from sale of assets.
On October 15, 2014, Celero conveyed substantially all of its oil and gas properties and other assets to Centennial OpCo in exchange for membership interests in Centennial OpCo. In connection with the transaction Centennial HoldCo made cash tender offers to Celero’s limited partners to purchase their interest in the Partnership for their respective share of the transaction value of $157.6 million. A total of 20.4% of the partners accepted the cash tender offer for a total of $32.2 million. Celero subsequently redeemed Celero limited partnership interests from Centennial HoldCo for $17.1 million in cash and $15.1 million in Centennial OpCo’s membership interest. Celero’s contribution in Centennial OpCo after the conveyance was $125.4 million. Furthermore, the Combination was accounted for as a reorganization of entities under common control in a manner similar to a pooling of interest which resulted in a deemed distribution of $4.1 million.
On April 30, 2014 NGP X contributed and conveyed its membership interest in Centennial OpCo to Centennial HoldCo. On May 9, 2014, Centennial OpCo’s remaining members sold their membership interests to Centennial OpCo for $75.7 million.
On March 31, 2014 all of Centennial OpCo’s employee members sold their membership interests in Centennial OpCo. Centennial OpCo paid $11.4 million, net of promissory notes from certain employee members, to acquire the membership interests. Contemporaneously, Centennial HoldCo, agreed to purchase the entirety of Centennial OpCo’s issued and outstanding incentive units. The total consideration paid by Centennial HoldCo to acquire the issued and outstanding incentive units was $12.4 million and is included in General and administration expense on the consolidated and combined statement of operations. Additionally, the Predecessor recorded a deemed contribution from parent for payment of incentive units from Centennial HoldCo of $12.4 million for funding the incentive unit purchase. All of the incentive unit purchases were fully settled and terminated as of August 31, 2014.
In February 2014, the Predecessor sold its 98.5% interest in Atlantic Midstream to PennTex Permian, an NGP-controlled entity for net proceeds of $71.8 million. Because the Predecessor and purchaser are considered entities under common control, the gain of $20.0 million was recorded as a deemed contribution from sale of assets.
Note 9—Incentive Unit Compensation
Follow-On Incentive Units
Under the Amended and Restated NGP Centennial Follow-On LLC Agreement (“Follow-On LLC Agreement”), Follow-On grants certain incentive units to certain employees of Centennial Resource Management, LLC (“Centennial Management”), a wholly-owned subsidiary of Centennial HoldCo. Employees of Centennial Management provide substantially all of their services to the Predecessor and in substance the incentive unit holders are employees of the Predecessor; therefore, Follow-On’s incentive units have been treated as obligations of the Predecessor for accounting purposes.
In April 2015, Tier I, Tier II, Tier III, Tier IV and Tier V incentive units were issued.
F-35
Table of Contents
CENTENNIAL RESOURCE PRODUCTION, LLC AND CELERO ENERGY COMPANY, LP
(PREDECESSOR)
NOTES TO CONSOLIDATED AND COMBINED FINANCIAL STATEMENTS—(Continued)
The following table summarizes Follow-On’s incentive unit activity for the year ended December 31, 2015:
| Tier I | Tier II | Tier III | Tier IV | Tier V | ||||||||||||||||
| Incentive units at December 31, 2014 |
— | — | — | — | — | |||||||||||||||
| Forfeited |
(5,000 | ) | (5,000 | ) | (5,000 | ) | (5,000 | ) | (5,000 | ) | ||||||||||
| Granted |
919,000 | 919,000 | 919,000 | 919,000 | 919,000 | |||||||||||||||
|
|
|
|
|
|
|
|
|
|
|
|||||||||||
| Incentive units at December 31, 2015 |
914,000 | 914,000 | 914,000 | 914,000 | 914,000 | |||||||||||||||
|
|
|
|
|
|
|
|
|
|
|
|||||||||||
| Vested at December 31, 2015 |
121,197 | 121,197 | — | — | — | |||||||||||||||
|
|
|
|
|
|
|
|
|
|
|
|||||||||||
All of the incentive units are non-voting and subject to certain vesting and performance conditions. The terms of the incentive units are as follows: Tier I and Tier II incentive units vest ratably over five years, but are subject to forfeiture if payout is not achieved. In addition, all unvested Tier I and Tier II incentive units vest immediately upon Tier I and Tier II payout, respectively. Tier III, IV and V incentive units vest only upon the achievement of certain payout thresholds for each such tier and each tier of incentive units is subject to forfeiture if the applicable required payouts are not achieved. In addition, vested and unvested incentive units are forfeited if an incentive unit holder’s employment is terminated for any reason or if the incentive unit holder voluntarily terminates their employment. Payouts for each Tier I through V are based upon achievement of specified rates of return on Follow-On’s invested capital.
The incentive units are issued to employees in return for services provided and cash payout is based, in part, on the value of Follow-On’s equity; therefore, the incentive units are accounted for as liability awards under FASB ASC Topic 718, Compensation-Stock Compensation, with compensation expense based on period-end fair value. The achievement of payout conditions is a performance condition that requires the Predecessor to assess, at each reporting period, the probability that an event of payout will occur. Compensation cost is required to be recognized at such time that the payout terms are probable of being met. No incentive compensation expense was recorded at December 31, 2015 or 2014, because it was not probable that the performance criterion would be met.
Centennial HoldCo Incentive Units
As of December 31, 2015 and 2014, Tier I, Tier II, Tier III, Tier IV and Tier V incentive units had been issued to certain employees of Centennial Management. Employees of Centennial Management provide substantially all of their services to the Predecessor and in substance the incentive unit holders are employees of the Predecessor. Therefore, Centennial HoldCo’s incentive units have been treated as obligations of the Predecessor for accounting purposes.
The following table summarizes Centennial HoldCo’s incentive unit activity for the year ended December 31, 2015:
| Tier I | Tier II | Tier III | Tier IV | Tier V | ||||||||||||||||
| Incentive units at December 31, 2014 |
909,000 | 909,000 | 909,000 | 909,000 | 909,000 | |||||||||||||||
| Forfeited |
(6,000 | ) | (6,000 | ) | (6,000 | ) | (6,000 | ) | (6,000 | ) | ||||||||||
| Granted |
11,000 | 11,000 | 11,000 | 11,000 | 11,000 | |||||||||||||||
|
|
|
|
|
|
|
|
|
|
|
|||||||||||
| Incentive units at December 31, 2015 |
914,000 | 914,000 | 914,000 | 914,000 | 914,000 | |||||||||||||||
|
|
|
|
|
|
|
|
|
|
|
|||||||||||
| Vested at December 31, 2015 |
370,517 | 370,517 | — | — | — | |||||||||||||||
|
|
|
|
|
|
|
|
|
|
|
|||||||||||
F-36
Table of Contents
CENTENNIAL RESOURCE PRODUCTION, LLC AND CELERO ENERGY COMPANY, LP
(PREDECESSOR)
NOTES TO CONSOLIDATED AND COMBINED FINANCIAL STATEMENTS—(Continued)
All of the incentive units are non-voting and subject to certain vesting and performance conditions. The terms of the incentive units are as follows: Tier I and Tier II incentive units vest ratably over five years, but are subject to forfeiture if payout is not achieved. In addition, all unvested Tier I and Tier II incentive units vest immediately upon Tier I and Tier II payout, respectively. Tier III, IV and V incentive units vest only upon the achievement of certain payout thresholds for each such tier and each tier of incentive units is subject to forfeiture if the applicable required payouts are not achieved. In addition, vested and unvested incentive units are forfeited if an incentive unit holder’s employment is terminated for any reason or if the incentive unit holder voluntarily terminates their employment. Payouts for each Tier I through Tier V are based upon achievement of specified rates of return on Centennial HoldCo’s invested capital.
The incentive units are issued to employees in return for services provided and cash payout is based, in part, on the value of Centennial HoldCo’s equity; therefore, the incentive units are accounted for as liability awards under FASB ASC Topic 718, Compensation-Stock Compensation, with compensation expense based on period-end fair value. The achievement of payout conditions is a performance condition that requires the Predecessor to assess, at each reporting period, the probability that an event of payout will occur. Compensation cost is required to be recognized at such time that the payout terms are probable of being met. No incentive compensation expense was recorded at December 31, 2015 or 2014, because it was not probable that the performance criterion would be met.
Note 10—Asset Retirement Obligations
The Predecessor recognizes an estimated liability for future costs associated with the plugging and abandonment of its oil and natural gas properties. A liability for the fair value of an asset retirement obligation (“ARO”) and a corresponding increase to the carrying value of the related long-lived asset are recorded at the time a well is drilled or acquired. The increase in carrying value is included in proved oil and natural gas properties in the accompanying consolidated and combined balance sheets. The Predecessor depletes the amount added to proved oil and gas property costs and recognizes expense in connection with the accretion of the discounted liability over the remaining estimated economic lives of the respective oil and gas properties. Cash paid to settle asset retirement obligations is included in the operating section of the Predecessor’s accompanying consolidated and combined statements of cash flows.
The Predecessor’s estimated asset retirement obligation liability is based on historical experience in plugging and abandoning wells, estimated economic lives, estimated plugging and abandonment cost, and federal and state regulatory requirements. The liability is discounted using the credit-adjusted risk-free rate estimated at the time the liability is incurred or revised. In periods subsequent to the initial measurement of the ARO, the Predecessor must recognize period-to-period changes in the liability resulting from the passage of time and revisions to either the timing or the amount of the original estimate of undiscounted cash flows.
F-37
Table of Contents
CENTENNIAL RESOURCE PRODUCTION, LLC AND CELERO ENERGY COMPANY, LP
(PREDECESSOR)
NOTES TO CONSOLIDATED AND COMBINED FINANCIAL STATEMENTS—(Continued)
The following table summarizes the changes in the Predecessor’s asset retirement obligations for the periods indicated (in thousands):
| For the Year Ended December 31, | ||||||||
| 2015 | 2014 | |||||||
| Asset retirement obligations, beginning of year |
$ | 1,824 | $ | 3,557 | ||||
| Additional liabilities incurred |
133 | 670 | ||||||
| Liabilities acquired |
178 | — | ||||||
| Liabilities disposed(1) |
— | (2,820 | ) | |||||
| Accretion expense |
139 | 156 | ||||||
| Revision of estimated liabilities |
14 | 261 | ||||||
|
|
|
|
|
|||||
| Asset retirement obligations, end of year |
$ | 2,288 | $ | 1,824 | ||||
|
|
|
|
|
|||||
| (1) | Refer to Note 4—Acquisitions and Divestitures. |
Note 11—Commitments and Contingencies
Commitments
The following is a schedule of minimum future lease payments with commitments that have initial or remaining noncancelable lease terms in excess of one year as of December 31, 2015:
| Years Ending December 31, |
Amount (in thousands) |
|||
| 2016 |
$ | 2,676 | ||
| 2017 |
477 | |||
| 2018 |
485 | |||
| 2019 |
419 | |||
| 2020 |
— | |||
| Thereafter |
— | |||
|
|
|
|||
| Total |
$ | 4,057 | ||
|
|
|
|||
Drilling Rig Contracts
As of December 31, 2015, the Predecessor is not party to any long-term drilling rig contracts.
In light of the low commodity price environment, the Predecessor curtailed its drilling activity during 2015. For the year ended December 31, 2015, the Predecessor incurred drilling rig termination fees of $2.4 million, which are recorded in the Contract termination and rig stacking line item in the accompanying consolidated and combined statement of operations.
Office Leases
The Predecessor leases office space in Denver, Colorado and Midland, Texas. Rent expense for the years ended December 31, 2015 and 2014 was $0.4 million and $0.5 million, respectively.
F-38
Table of Contents
CENTENNIAL RESOURCE PRODUCTION, LLC AND CELERO ENERGY COMPANY, LP
(PREDECESSOR)
NOTES TO CONSOLIDATED AND COMBINED FINANCIAL STATEMENTS—(Continued)
Financing Obligation
The Predecessor is party to a contract with PennTex Permian, LLC (“PennTex”), an NGP-controlled entity, to construct an expansion of the gathering system and a receipt point. The Predecessor will reimburse the gas gatherer for the total cost of the expansion project. The Predecessor shall pay a minimum fee of $7,000 per day until the gas gatherer recoups the capital outlay for the expansion project. The Predecessor determined that the agreement contains an embedded lease and the transaction was accounted for as a financing obligation. The Predecessor recorded an asset and a liability of $3.8 million attributable to this agreement. The asset is being depreciated over its estimated remaining life. At December 31, 2015, a short-term liability of $2.1 million was included in Other current liabilities on the consolidated and combined balance sheets. The Predecessor has made payments of $1.7 million as of December 31, 2015, including interest.
Contingencies
The Predecessor is subject to litigation and claims arising in the ordinary course of business. The Predecessor accrues for such items when a liability is both probable and the amount can be reasonably estimated. In the opinion of management, the results of such pending litigation and claims will not have a material effect on the results of operations, the financial position, or the cash flows of the Predecessor.
Note 12—Transactions with Related Parties
In December 2014, the Predecessor sold its interest in approximately 1,845 net acres in Ward County, Texas, including 18 vertical wells, to an NGP-controlled entity for proceeds of $12.5 million. For additional discussion, please refer to Note 4—Acquisitions and Divestitures.
In October 2014, Celero, an NGP-controlled entity, conveyed substantially all of its oil and gas properties and other assets to Centennial OpCo in exchange for membership interests in Centennial OpCo. As a result of the transaction, Centennial HoldCo owned approximately 72% of Centennial OpCo, and Celero owned the remaining 28%. For additional discussion, please refer to Note 2—Basis of Presentation.
Effective October 14, 2014, the Predecessor entered into a Management Services Agreement with Centennial Management, a wholly-owned subsidiary of Centennial HoldCo. Employees of Centennial Management provide substantially all of their services to the Predecessor.
In February 2014, the Predecessor entered into a gas gathering agreement with Atlantic Midstream. At the time this agreement was entered into, the Predecessor had a 98.5% interest in Atlantic Midstream. In February 2014, subsequent to entry into this gas gathering agreement, the Predecessor sold its 98.5% interest in Atlantic Midstream to PennTex Permian, LLC, an NGP-controlled entity for net proceeds of $71.8 million. PennTex paid the Predecessor $1.2 million and $2.2 million for purchases of residue gas and NGLs (net of gathering, processing and other fees) for the years ended December 31, 2015 and 2014.
In October 2014, the gas gathering agreement with PennTex Permian was amended to construct an expansion of the gathering system and a receipt point. The Predecessor will reimburse PennTex Permian for the total cost of the expansion project. The Predecessor shall pay a minimum fee of $7,000 per day until PennTex Permian recoups the capital outlay for the expansion project. At December 31, 2015, a short-term liability of $2.1 million was included in Other current liabilities on the consolidated and combined balance sheets. As of December 31, 2015, the Predecessor has made payments of $1.7 million, including interest.
F-39
Table of Contents
CENTENNIAL RESOURCE PRODUCTION, LLC AND CELERO ENERGY COMPANY, LP
(PREDECESSOR)
NOTES TO CONSOLIDATED AND COMBINED FINANCIAL STATEMENTS—(Continued)
Note 13—Subsequent Events
We have evaluated all subsequent events through April 4, 2016, the date the financial statements were issued and have nothing additional to disclose.
Note 14—Supplemental Oil and Gas Information (unaudited)
Costs Incurred For Oil and Natural Gas Producing Activities
The following table sets forth the capitalized costs incurred in the Predecessor’s oil and gas production, exploration, and development activities:
| For the Years Ended December 31, |
||||||||
| 2015 | 2014 | |||||||
| (in thousands) | ||||||||
| Acquisition costs: |
||||||||
| Proved properties |
$ | 14,268 | $ | 5,758 | ||||
| Unproved properties |
28,955 | 16,409 | ||||||
| Development costs |
87,452 | 324,802 | ||||||
|
|
|
|
|
|||||
| Total |
$ | 130,675 | $ | 346,969 | ||||
|
|
|
|
|
|||||
Oil and Gas Reserve Quantities
The reserve estimates presented below were made in accordance with U.S. GAAP requirements for disclosures about oil and natural gas producing activities and Securities and Exchange Commission (“SEC”) rules for oil and natural gas reporting reserves estimation and disclosure.
Estimates of the Predecessor’s proved oil and natural gas reserves at December 31, 2015 and 2014 were prepared by Netherland, Sewell & Associates, Inc. There are numerous uncertainties inherent in estimating quantities of proved oil and natural gas reserves. Oil and natural gas reserve engineering is a subjective process of estimating underground accumulations of oil and natural gas that cannot be precisely measured and the accuracy of any reserve estimate is a function of the quality of available data and of engineering and geological interpretation and judgment. Results of drilling, testing and production subsequent to the date of the estimate may justify revision of such estimate. Accordingly, reserve estimates are often different from the quantities of oil and natural gas that are ultimately recovered.
The following table summarizes the trailing 12-month index prices used in the reserve estimates for the years ended December 31, 2015 and 2014. The following prices, as adjusted for transportation, quality, and basis differentials, were used in the calculation of the standardized measure of discounted future net cash flows (“standardized measure”):
| For the Years Ended December 31, | ||||||||
| 2015 | 2014 | |||||||
| Oil (per Bbl) |
$ | 41.85 | $ | 84.94 | ||||
| Gas (per Mcf) |
$ | 1.71 | $ | 4.70 | ||||
| NGLs (per Bbl) |
$ | 13.94 | $ | 22.70 | ||||
F-40
Table of Contents
CENTENNIAL RESOURCE PRODUCTION, LLC AND CELERO ENERGY COMPANY, LP
(PREDECESSOR)
NOTES TO CONSOLIDATED AND COMBINED FINANCIAL STATEMENTS—(Continued)
The table below presents a summary of changes in the Predecessor’s estimated proved reserves:
| For the Years Ended December 31, | ||||||||||||||||||||||||
| 2015 | 2014 | |||||||||||||||||||||||
| Crude Oil (MBbls) |
Natural Gas (MMcf) |
Natural Gas Liquids (MBbls) |
Crude Oil (MBbls) |
Natural Gas (MMcf) |
Natural Gas Liquids (MBbls) |
|||||||||||||||||||
| Total Proved Reserves: |
||||||||||||||||||||||||
| Beginning of the year |
19,850 | 27,414 | 1,551 | 18,510 | 6,968 | 525 | ||||||||||||||||||
| Extensions and discoveries |
9,444 | 11,927 | 1,432 | 16,122 | 22,575 | 1,127 | ||||||||||||||||||
| Revisions of previous estimates |
(5,109 | ) | (5,204 | ) | 995 | 56 | 178 | 180 | ||||||||||||||||
| Purchases of reserves in place |
844 | 1,363 | 204 | 162 | 192 | 23 | ||||||||||||||||||
| Divestitures of reserves in place |
— | — | — | (13,572 | ) | (387 | ) | (69 | ) | |||||||||||||||
| Production |
(1,830 | ) | (3,058 | ) | (331 | ) | (1,428 | ) | (2,112 | ) | (235 | ) | ||||||||||||
|
|
|
|
|
|
|
|
|
|
|
|
|
|||||||||||||
| End of the year |
23,199 | 32,442 | 3,851 | 19,850 | 27,414 | 1,551 | ||||||||||||||||||
|
|
|
|
|
|
|
|
|
|
|
|
|
|||||||||||||
| Proved Developed Reserves: |
||||||||||||||||||||||||
| Beginning of the year |
8,026 | 11,959 | 766 | 6,021 | 4,837 | 382 | ||||||||||||||||||
| End of the year |
9,347 | 12,711 | 1,603 | 8,026 | 11,959 | 766 | ||||||||||||||||||
| Proved Undeveloped Reserves: |
||||||||||||||||||||||||
| Beginning of the year |
11,823 | 15,455 | 785 | 12,489 | 2,131 | 143 | ||||||||||||||||||
| End of the year |
13,852 | 19,731 | 2,248 | 11,823 | 15,455 | 785 | ||||||||||||||||||
Proved reserves at December 31, 2015 increased 25% to 32,457 MBoe, compared to 25,970 MBoe at December 31, 2014.
During 2015, the Predecessor added 12,864 MBoe of proved reserves through extensions, primarily due to our drilling activity.
During 2015, the Predecessor had net negative revisions of 4,981 MBoe. The significant decrease in commodity prices seen in 2015 resulted in negative revisions related to the conversion of approximately 6,794 MBoe from PUDs to unproved reserves, partially offset by a positive revision in performance.
During 2015, the Predecessor acquired 1,275 MBoe of proved reserves. Refer to Note 4—Acquisitions and Divestitures.
During 2014, the Predecessor added 21,012 MBoe of proved reserves through extensions and discoveries, primarily due to its continued development drilling program and 265 MBoe of proved reserves, due to better than expected performance of its proved developed reserves.
During 2014, the Predecessor divested of 13,706 MBoe of proved reserves. Refer to Note 4—Acquisitions and Divestitures.
Standardized Measure of Discounted Future Net Cash Flows
The Predecessor computes a standardized measure of discounted future net cash flows and changes therein relating to estimated proved reserves in accordance with authoritative accounting guidance. Future cash inflows and production and development costs are determined by applying prices and costs, including transportation, quality, and basis differentials, to the year-end estimated future reserve quantities. The resulting future net cash flows are reduced to present value amounts by applying a 10% annual discount factor.
F-41
Table of Contents
CENTENNIAL RESOURCE PRODUCTION, LLC AND CELERO ENERGY COMPANY, LP
(PREDECESSOR)
NOTES TO CONSOLIDATED AND COMBINED FINANCIAL STATEMENTS—(Continued)
Future operating costs are determined based on estimates of expenditures to be incurred in developing and producing the proved reserves in place at the end of the period using year-end costs and assuming continuation of existing economic conditions.
The assumptions used to compute the standardized measure are those prescribed by the FASB and the SEC. These assumptions do not necessarily reflect the Predecessor’s expectations of actual revenues to be derived from those reserves, nor their present value amount. The limitations inherent in the reserve quantity estimation process, as discussed previously, are equally applicable to the standardized measure computations since these reserve quantity estimates are the basis for the valuation process.
The following table presents the Predecessor’s standardized measure of discounted future net cash flows:
| December 31, | ||||||||
| 2015 | 2014 | |||||||
| (in thousands) | ||||||||
| Future cash inflows |
$ | 1,079,962 | $ | 1,850,205 | ||||
| Future development costs |
(277,837 | ) | (440,366 | ) | ||||
| Future production costs |
(450,058 | ) | (457,236 | ) | ||||
| Future income tax expenses(1) |
(6,643 | ) | (10,834 | ) | ||||
|
|
|
|
|
|||||
| Future net cash flows |
345,424 | 941,769 | ||||||
| 10% discount to reflect timing of cash flows |
(210,355 | ) | (575,886 | ) | ||||
|
|
|
|
|
|||||
| Standardized measure of discounted future net cash flows |
$ | 135,069 | $ | 365,883 | ||||
|
|
|
|
|
|||||
| (1) | Although the Predecessor was subject to franchise tax in the State of Texas (at less than 1% of modified pre-tax earnings), it generally passed through its taxable income to its owners for other income tax purposes and thus was not subject to U.S. federal income taxes or other state or local income taxes as of December 31, 2015 and 2014. Accordingly, future income tax expenses do not include the effects of U.S. federal income taxes or income taxes in any state or locality other than franchise tax in the State of Texas . Had the Predecessor been subject to U.S. federal, state and local income taxes for the years ended December 31, 2015 and 2014, the future income tax expenses at December 31, 2015 and 2014 would have been approximately $70.7 million and $280.3 million, respectively, and the unaudited standardized measure at December 31, 2015 and December 31, 2014 would have been approximately $115.7 million and $256.4 million, respectively. |
F-42
Table of Contents
CENTENNIAL RESOURCE PRODUCTION, LLC AND CELERO ENERGY COMPANY, LP
(PREDECESSOR)
NOTES TO CONSOLIDATED AND COMBINED FINANCIAL STATEMENTS—(Continued)
A summary of changes in the standardized measure of discounted future net cash flows is as follows:
| For the Years Ended December 31, |
||||||||
| 2015 | 2014 | |||||||
| (in thousands) | ||||||||
| Standardized measure of discounted future net cash flows, beginning of the period |
$ | 365,883 | $ | 371,307 | ||||
| Sales of oil, natural gas and NGLs, net of production costs |
(58,534 | ) | (102,488 | ) | ||||
| Purchase of minerals in place |
14,416 | 5,650 | ||||||
| Divestiture of minerals in place |
— | (242,344 | ) | |||||
| Extensions and discoveries, net of future development costs |
57,894 | 312,532 | ||||||
| Change in estimated development costs |
16,100 | 10,386 | ||||||
| Net change in prices and production costs |
(494,734 | ) | (3,027 | ) | ||||
| Change in estimated future development costs |
247,642 | 2,935 | ||||||
| Revisions of previous quantity estimates |
(51,342 | ) | 924 | |||||
| Accretion of discount |
37,517 | 13,561 | ||||||
| Net change in income taxes |
1,601 | (2,762 | ) | |||||
| Net change in timing of production and other |
(1,374 | ) | (791 | ) | ||||
|
|
|
|
|
|||||
| Standardized measure of discounted future net cash flows, end of the period |
$ | 135,069 | $ | 365,883 | ||||
|
|
|
|
|
|||||
F-43
Table of Contents
GLOSSARY OF OIL AND NATURAL GAS TERMS
The following are abbreviations and definitions of certain terms used in this document, which are commonly used in the oil and natural gas industry:
3-D seismic. Geophysical data that depict the subsurface strata in three dimensions. 3-D seismic typically provides a more detailed and accurate interpretation of the subsurface strata than 2-D, or two-dimensional, seismic.
Analogous reservoir. Analogous reservoirs, as used in resources assessments, have similar rock and fluid properties, reservoir conditions (depth, temperature, and pressure) and drive mechanisms, but are typically at a more advanced stage of development than the reservoir of interest and thus may provide concepts to assist in the interpretation of more limited data and estimation of recovery. When used to support proved reserves, an analogous reservoir refers to a reservoir that shares the following characteristics with the reservoir of interest: (i) same geological formation (but not necessarily in pressure communication with the reservoir of interest); (ii) same environment of deposition; (iii) similar geological structure; and (iv) same drive mechanism. For a complete definition of analogous reservoir, refer to the SEC’s Regulation S-X, Rule 4-10(a)(2).
Basin. A large natural depression on the earth’s surface in which sediments generally brought by water accumulate.
Bbl. One stock tank barrel of 42 U.S. gallons liquid volume used herein in reference to crude oil, condensate or NGLs.
Bbl/d. One Bbl per day.
Bcf. One billion cubic feet of natural gas.
Boe. One barrel of oil equivalent, calculated by converting natural gas to oil equivalent barrels at a ratio of six Mcf of natural gas to one Bbl of oil. This is an energy content correlation and does not reflect a value or price relationship between the commodities.
Boe/d. One Boe per day.
British thermal unit or Btu. The quantity of heat required to raise the temperature of a one-pound mass of water from 58.5 to 59.5 degrees Fahrenheit.
Completion. Installation of permanent equipment for production of oil or gas, or, in the case of a dry well, to reporting to the appropriate authority that the well has been abandoned.
Condensate. A mixture of hydrocarbons that exists in the gaseous phase at original reservoir temperature and pressure, but that, when produced, is in the liquid phase at surface pressure and temperature.
Delineation. The process of placing a number of wells in various parts of a reservoir to determine its boundaries and production characteristics.
Developed acreage. The number of acres that are allocated or assignable to productive wells or wells capable of production.
Development costs. Costs incurred to obtain access to proved reserves and to provide facilities for extracting, treating, gathering and storing the oil and natural gas. For a complete definition of development costs refer to the SEC’s Regulation S-X, Rule 4-10(a)(7).
A-1
Table of Contents
Development project. The means by which petroleum resources are brought to the status of economically producible. As examples, the development of a single reservoir or field, an incremental development in a producing field or the integrated development of a group of several fields and associated facilities with a common ownership may constitute a development project.
Development well. A well drilled within the proved area of an oil or natural gas reservoir to the depth of a stratigraphic horizon known to be productive.
Differential. An adjustment to the price of oil or natural gas from an established spot market price to reflect differences in the quality and/or location of oil or natural gas.
Downspacing. Additional wells drilled between known producing wells to better develop the reservoir.
Dry well. A well found to be incapable of producing hydrocarbons in sufficient quantities such that proceeds from the sale of such production exceed production expenses and taxes.
Economically producible. The term economically producible, as it relates to a resource, means a resource which generates revenue that exceeds, or is reasonably expected to exceed, the costs of the operation. For a complete definition of economically producible, refer to the SEC’s Regulation S-X, Rule 4-10(a)(10).
Estimated ultimate recovery or EUR. The sum of reserves remaining as of a given date and cumulative production as of that date.
Exploration costs. Costs incurred in identifying areas that may warrant examination and in examining specific areas that are considered to have prospects of containing oil and natural gas reserves, including costs of drilling exploratory wells and exploratory-type stratigraphic test wells. For a complete definition of exploration costs, refer to the SEC’s Regulation S-X, Rule 4-10(a)(12).
Exploratory well. A well drilled to find a new field or to find a new reservoir in a field previously found to be productive of oil or natural gas in another reservoir.
Field. An area consisting of a single reservoir or multiple reservoirs all grouped on, or related to, the same individual geological structural feature or stratigraphic condition. The field name refers to the surface area, although it may refer to both the surface and the underground productive formations. For a complete definition of field, refer to the SEC’s Regulation S-X, Rule 4-10(a)(15).
Formation. A layer of rock which has distinct characteristics that differs from nearby rock.
Gross acres or gross wells. The total acres or wells, as the case may be, in which a working interest is owned.
Held by production. Acreage covered by a mineral lease that perpetuates a company’s right to operate a property as long as the property produces a minimum paying quantity of oil or gas.
Horizontal drilling. A drilling technique used in certain formations where a well is drilled vertically to a certain depth and then drilled at a right angle within a specified interval.
MBbl. One thousand barrels of crude oil, condensate or NGLs.
MBoe. One thousand Boe.
Mcf. One thousand cubic feet of natural gas.
Mcf/d. One Mcf per day.
A-2
Table of Contents
MMBbl. One million barrels of crude oil, condensate or NGLs.
MMBoe. One million Boe.
MMBtu. One million British thermal units.
MMcf. One million cubic feet of natural gas.
Net acres. The percentage of total acres an owner has out of a particular number of acres, or a specified tract. An owner who has 50% interest in 100 acres owns 50 net acres.
Net production. Production that is owned less royalties and production due to others.
Net revenue interest. A working interest owner’s gross working interest in production less the royalty, overriding royalty, production payment and net profits interests.
NGLs. Natural gas liquids. Hydrocarbons found in natural gas which may be extracted as liquefied petroleum gas and natural gasoline.
NYMEX. The New York Mercantile Exchange.
Offset operator. Any entity that has an active lease on an adjoining property for oil, natural gas or NGLs purposes.
Operator. The individual or company responsible for the development and/or production of an oil or natural gas well or lease.
Play. A geographic area with hydrocarbon potential.
Present value of future net revenues or PV-10. The estimated future gross revenue to be generated from the production of proved reserves, net of estimated production and future development and abandonment costs, using prices and costs in effect at the determination date, before income taxes, and without giving effect to non-property-related expenses, discounted to a present value using an annual discount rate of 10% in accordance with the guidelines of the SEC.
Production costs. Costs incurred to operate and maintain wells and related equipment and facilities, including depreciation and applicable operating costs of support equipment and facilities and other costs of operating and maintaining those wells and related equipment and facilities. For a complete definition of production costs, refer to the SEC’s Regulation S-X, Rule 4-10(a)(20).
Productive well. A well that is found to be capable of producing hydrocarbons in sufficient quantities such that proceeds from the sale of the production exceed production expenses and taxes.
Prospect. A specific geographic area which, based on supporting geological, geophysical or other data and also preliminary economic analysis using reasonably anticipated prices and costs, is deemed to have potential for the discovery of commercial hydrocarbons.
Proved area. Part of a property to which proved reserves have been specifically attributed.
Proved developed reserves. Reserves that can be expected to be recovered through (i) existing wells with existing equipment and operating methods or in which the cost of the required equipment is relatively minor compared with the cost of a new well or (ii) through installed extraction equipment and infrastructure operational at the time of the reserves estimate if the extraction is by means not involving a well.
A-3
Table of Contents
Proved properties. Properties with proved reserves.
Proved reserves. Those quantities of oil, natural gas and NGLs, which, by analysis of geoscience and engineering data, can be estimated with reasonable certainty to be economically producible—from a given date forward, from known reservoirs, and under existing economic conditions, operating methods, and government regulations—prior to the time at which contracts providing the right to operate expire, unless evidence indicates that renewal is reasonably certain, regardless of whether deterministic or probabilistic methods are used for the estimation. The project to extract the hydrocarbons must have commenced or the operator must be reasonably certain that it will commence the project within a reasonable time. For a complete definition of proved oil and natural gas reserves, refer to the SEC’s Regulation S-X, Rule 4-10(a)(22).
Proved undeveloped reserves or PUDs. Proved reserves that are expected to be recovered from new wells on undrilled acreage or from existing wells where a relatively major expenditure is required for recompletion. Undrilled locations can be classified as having proved undeveloped reserves only if a development plan has been adopted indicating that such locations are scheduled to be drilled within five years, unless specific circumstances justify a longer time.
Realized price. The cash market price less all expected quality, transportation and demand adjustments.
Reasonable certainty. A high degree of confidence. For a complete definition of reasonable certainty, refer to the SEC’s Regulation S-X, Rule 4-10(a)(24).
Recompletion. The completion for production of an existing wellbore in another formation from that which the well has been previously completed
Reliable technology. Reliable technology is a grouping of one or more technologies (including computational methods) that has been field tested and has been demonstrated to provide reasonably certain results with consistency and repeatability in the formation being evaluated or in an analogous formation.
Reserves. Estimated remaining quantities of oil and natural gas and related substances anticipated to be economically producible, as of a given date, by application of development projects to known accumulations. In addition, there must exist, or there must be a reasonable expectation that there will exist, the legal right to produce or a revenue interest in the production, installed means of delivering oil and natural gas or related substances to market and all permits and financing required to implement the project. Reserves should not be assigned to adjacent reservoirs isolated by major, potentially sealing, faults until those reservoirs are penetrated and evaluated as economically producible. Reserves should not be assigned to areas that are clearly separated from a known accumulation by a non-productive reservoir (i.e., absence of reservoir, structurally low reservoir or negative test results). Such areas may contain prospective resources (i.e., potentially recoverable resources from undiscovered accumulations).
Reservoir. A porous and permeable underground formation containing a natural accumulation of producible oil and/or natural gas that is confined by impermeable rock or water barriers and is individual and separate from other reservoirs.
Resources. Quantities of oil and natural gas estimated to exist in naturally occurring accumulations. A portion of the resources may be estimated to be recoverable and another portion may be considered to be unrecoverable. Resources include both discovered and undiscovered accumulations.
Royalty. An interest in an oil and natural gas lease that gives the owner the right to receive a portion of the production from the leased acreage (or of the proceeds from the sale thereof), but does not require the owner to pay any portion of the production or development costs on the leased acreage. Royalties may be either landowner’s royalties, which are reserved by the owner of the leased acreage at the time the lease is granted, or overriding royalties, which are usually reserved by an owner of the leasehold in connection with a transfer to a subsequent owner.
A-4
Table of Contents
Service well. A well drilled or completed for the purpose of supporting production in an existing field.
Spacing. The distance between wells producing from the same reservoir. Spacing is often expressed in terms of acres, e.g., 40-acre spacing, and is often established by regulatory agencies.
Spot market price. The cash market price without reduction for expected quality, transportation and demand adjustments.
Spud. Commenced drilling operations on an identified location.
Standardized measure. Discounted future net cash flows estimated by applying year-end prices to the estimated future production of year-end proved reserves. Future cash inflows are reduced by estimated future production and development costs based on period-end costs to determine pre-tax cash inflows. Future income taxes, if applicable, are computed by applying the statutory tax rate to the excess of pre-tax cash inflows over our tax basis in the oil and natural gas properties. Future net cash inflows after income taxes are discounted using a 10% annual discount rate.
Stratigraphic test well. A drilling effort, geologically directed, to obtain information pertaining to a specific geologic condition. Such wells customarily are drilled without the intent of being completed for hydrocarbon production. The classification also includes tests identified as core tests and all types of expendable holes related to hydrocarbon exploration. Stratigraphic tests are classified as “exploratory type” if not drilled in a known area or “development type” if drilled in a known area.
Success rate. The percentage of wells drilled which produce hydrocarbons in commercial quantities.
Undeveloped acreage. Lease acreage on which wells have not been drilled or completed to a point that would permit the production of commercial quantities of oil and natural gas regardless of whether such acreage contains proved reserves.
Unit. The joining of all or substantially all interests in a reservoir or field, rather than a single tract, to provide for development and operation without regard to separate property interests. Also, the area covered by a unitization agreement.
Unproved properties. Properties with no proved reserves.
Wellbore. The hole drilled by the bit that is equipped for natural gas production on a completed well. Also called well or borehole.
Wellbore only rights. A working interest that limits the working interest to the production and equipment associated with a specific wellbore only and does not include ownership in the acreage outside of the regulatory proration unit for that wellbore.
Working interest. The right granted to the lessee of a property to develop and produce and own natural gas or other minerals. The working interest owners bear the exploration, development and operating costs on either a cash, penalty or carried basis.
Workover. Operations on a producing well to restore or increase production.
WTI. West Texas Intermediate.
A-5
Table of Contents

Until , 2016 (25 days after commencement of this offering), all dealers that effect transactions in our common stock, whether or not participating in this offering, may be required to deliver a prospectus. This is in addition to the dealer’s obligation to deliver a prospectus when acting as an underwriter and with respect to unsold allotments or subscriptions.
Table of Contents
Part II
INFORMATION NOT REQUIRED IN PROSPECTUS
Item 13. Other Expenses of Issuance and Distribution
The following table sets forth an itemized statement of the amounts of all expenses (excluding underwriting discounts and commissions) payable by us in connection with the registration of the common stock offered hereby. With the exception of the SEC registration fee and the FINRA filing fee, the amounts set forth below are estimates.
| SEC registration fee |
$ | * | ||
| FINRA filing fee |
* | |||
| NASDAQ listing fee |
* | |||
| Accounting fees and expenses |
* | |||
| Legal fees and expenses |
* | |||
| Printing and engraving expenses |
* | |||
| Transfer agent and registrar fees |
* | |||
| Miscellaneous |
* | |||
|
|
|
|||
| Total |
$ | * | ||
|
|
|
| * | To be provided by amendment |
Item 14. Indemnification of Directors and Officers
Section 145 of the DGCL provides that a corporation may indemnify any person who was or is a party, or is threatened to be made a party, to any threatened, pending or completed action, suit or proceeding, whether civil, criminal, administrative or investigative (other than an action by or in the right of the corporation by reason of the fact that he is or was a director, officer, employee or agent of the corporation, or is or was serving at the request of the corporation as a director, officer, employee or agent of another corporation, partnership, joint venture, trust or other enterprise), against expenses (including attorneys’ fees), judgments, fines and amounts paid in settlement actually and reasonably incurred by him in connection with such action, suit or proceeding if he acted in good faith and in a manner he reasonably believed to be in or not opposed to the best interests of the corporation and, with respect to any criminal action or proceeding, had no reasonable cause to believe his conduct was unlawful. A similar standard is applicable in the case of derivative actions (i.e., actions by or in the right of the corporation), except that indemnification extends only to expenses, including attorneys’ fees, incurred in connection with the defense or settlement of such action and the statute requires court approval before there can be any indemnification where the person seeking indemnification has been found liable to the corporation.
Our amended and restated certificate of incorporation and our amended and restated bylaws will contain provisions that limit the liability of our directors and officers for monetary damages to the fullest extent permitted by the DGCL. Consequently, our directors will not be personally liable to us or our stockholders for monetary damages for breach of fiduciary duty as a director, except liability:
| • | for any breach of the director’s duty of loyalty to our company or our stockholders; |
| • | for any act or omission not in good faith or that involve intentional misconduct or knowing violation of law; |
| • | under Section 174 of the DGCL regarding unlawful dividends and stock purchases; or |
| • | for any transaction from which the director derived an improper personal benefit. |
Any amendment to, or repeal of, these provisions will not eliminate or reduce the effect of these provisions in respect of any act, omission or claim that occurred or arose prior to that amendment or repeal. If the DGCL is
II-1
Table of Contents
amended to provide for further limitations on the personal liability of directors or officers of corporations, then the personal liability of our directors and officers will be further limited to the fullest extent permitted by the DGCL.
In addition, we intend to enter into indemnification agreements with our current directors and officers containing provisions that are in some respects broader than the specific indemnification provisions contained in the DGCL. The indemnification agreements will require us, among other things, to indemnify our directors against certain liabilities that may arise by reason of their status or service as directors and to advance their expenses incurred as a result of any proceeding against them as to which they could be indemnified. We also intend to enter into indemnification agreements with our future directors and officers.
We intend to maintain liability insurance policies that indemnify our directors and officers against various liabilities, including certain liabilities under arising under the Securities Act and the Exchange Act, that may be incurred by them in their capacity as such.
The proposed form of Underwriting Agreement to be filed as Exhibit 1.1 to this registration statement provides for indemnification of our directors and officers by the underwriters against certain liabilities arising under the Securities Act or otherwise in connection with this offering.
Insofar as indemnification for liabilities arising under the Securities Act may be permitted to directors, officers or persons controlling us pursuant to the foregoing provisions, we have been informed that in the opinion of the SEC, such indemnification is against public policy as expressed in the Securities Act and is therefore unenforceable.
Item 15. Recent Sales of Unregistered Securities
Prior to the closing of this offering, based on the assumed initial public offering price of $ per share of common stock (the midpoint of the price range set forth on the cover of this prospectus), we will issue shares of our common stock to the members of Centennial Resource Production, LLC in connection with our corporate reorganization. The shares of our common stock described in this Item 15 will be issued in reliance upon the exemption from the registration requirements of the Securities Act provided by Section 4(2) of the Securities Act as sales by an issuer not involving any public offering.
II-2
Table of Contents
Item 16. Exhibits and Financial Statement Schedules
(a) Exhibits
| Exhibit |
Description | |||
| *1.1 | Form of Underwriting Agreement | |||
| 3.1 | Certificate of Incorporation of Centennial Resource Development, Inc. | |||
| *3.2 | Form of Amended and Restated Certificate of Incorporation of Centennial Resource Development, Inc. | |||
| 3.3 | Bylaws of Centennial Resource Development, Inc. | |||
| *3.4 | Form of Amended and Restated Bylaws of Centennial Resource Development, Inc. | |||
| *4.1 | Form of Common Stock Certificate | |||
| *4.2 | Form of Registration Rights Agreement among Centennial Resource Development, Inc., Centennial Resource Development, LLC, Celero Energy Company, LP and NGP Centennial Follow-On LLC | |||
| *4.3 | Form of Voting Agreement among Centennial Resource Development, Inc., Centennial Resource Development LLC and Celero Energy Company, LP | |||
| *5.1 | Form of opinion of Vinson & Elkins L.L.P. as to the legality of the securities being registered | |||
| 10.1 | Amended and Restated Credit Agreement, dated as of October 15, 2014, among Centennial Resource Production, LLC, as borrower, and JPMorgan Chase Bank, N.A., as administrative agent, and the lenders party thereto | |||
| 10.2 | First Amendment to Amended and Restated Credit Agreement, dated as of May 6, 2015, among Centennial Resource Production, LLC, as borrower, and JPMorgan Chase Bank, N.A., as administrative agent, and the lenders and guarantors party thereto | |||
| *10.3 | † | Form of Centennial Resource Development, Inc. 2016 Long Term Incentive Plan | ||
| *10.4 | † | Form of Restricted Stock Agreement | ||
| *10.5 | Form of Indemnification Agreement between Centennial Resource Development, Inc. and each of the directors and officers thereof | |||
| *10.6 | Form of Second Amended and Restated Limited Liability Company Agreement of Centennial Resource Development, LLC | |||
| *10.7 | Form of Master Contribution Agreement among Centennial Resource Development, Inc., Centennial Resource Development, LLC, Celero Energy Company, LP and NGP Centennial Follow-On LLC | |||
| *21.1 | Subsidiaries of Centennial Resource Development, Inc. | |||
| 23.1 | Consent of KPMG LLP | |||
| 23.2 | Consent of KPMG LLP | |||
| 23.3 | Consent of Netherland, Sewell & Associates, Inc. | |||
| *23.4 | Consent of Vinson & Elkins L.L.P. (included as part of Exhibit 5.1 hereto) | |||
| 24.1 | Power of Attorney (included on the signature page of this Registration Statement) | |||
| 99.1 | Netherland, Sewell & Associates, Inc., Summary of Reserves at December 31, 2014 | |||
| 99.2 | Netherland, Sewell & Associates, Inc., Summary of Reserves at December 31, 2015 | |||
| * | To be filed by amendment. |
| † | Compensatory plan or arrangement. |
(b) Financial Statement Schedules. Financial statement schedules are omitted because the required information is not applicable, not required or included in the financial statements or the notes thereto included in the prospectus that forms a part of this registration statement.
II-3
Table of Contents
Item 17. Undertakings
The undersigned registrant hereby undertakes to provide to the underwriters at the closing specified in the underwriting agreement certificates in such denominations and registered in such names as required by the underwriters to permit prompt delivery to each purchaser.
Insofar as indemnification for liabilities arising under the Securities Act may be permitted to directors, officers and controlling persons of the registrant pursuant to the foregoing provisions, or otherwise, the registrant has been advised that in the opinion of the SEC such indemnification is against public policy as expressed in the Securities Act and is, therefore, unenforceable. In the event that a claim for indemnification against such liabilities (other than the payment by the registrant of expenses incurred or paid by a director, officer or controlling person of the registrant in the successful defense of any action, suit or proceeding) is asserted by such director, officer or controlling person in connection with the securities being registered, the registrant will, unless in the opinion of its counsel the matter has been settled by controlling precedent, submit to a court of appropriate jurisdiction the question whether such indemnification by it is against public policy as expressed in the Securities Act and will be governed by the final adjudication of such issue.
The undersigned registrant hereby undertakes that:
| (1) | For purposes of determining any liability under the Securities Act, the information omitted from the form of prospectus filed as part of this registration statement in reliance upon Rule 430A and contained in a form of prospectus filed by the registrant pursuant to Rule 424(b)(1) or (4) or 497(h) under the Securities Act shall be deemed to be part of this registration statement as of the time it was declared effective. |
| (2) | For the purpose of determining any liability under the Securities Act, each post-effective amendment that contains a form of prospectus shall be deemed to be a new registration statement relating to the securities offered therein, and the offering of such securities at that time shall be deemed to be the initial bona fide offering thereof. |
II-4
Table of Contents
SIGNATURES
Pursuant to the requirements of the Securities Act, the registrant has duly caused this registration statement to be signed on its behalf by the undersigned, thereunto duly authorized, in the City of Denver, State of Colorado, on June 22, 2016.
| CENTENNIAL RESOURCE DEVELOPMENT, INC. | ||
| By: | /s/ Ward Polzin | |
| Name: | Ward Polzin | |
| Title: | Chief Executive Officer | |
Each person whose signature appears below appoints George Glyphis and Jamie Wheat, and each of them, any of whom may act without the joinder of the other, as his or her true and lawful attorneys-in-fact and agents, with full power of substitution and resubstitution, for him or her and in his name, place and stead, in any and all capacities, to sign any and all amendments (including post-effective amendments) to this registration statement and any registration statement (including any amendment thereto) for this offering that is to be effective upon filing pursuant to Rule 462(b) under the Securities Act of 1933, as amended, and to file the same, with all exhibits thereto, and all other documents in connection therewith, with the Securities and Exchange Commission, granting unto said attorneys-in-fact and agents full power and authority to do and perform each and every act and thing requisite and necessary to be done, as fully to all intents and purposes as he or she might or would do in person, hereby ratifying and confirming all that said attorneys-in-fact and agents or any of them or their or his substitute or substitutes, may lawfully do or cause to be done by virtue hereof.
Pursuant to the requirements of the Securities Act, this registration statement has been signed by the following persons in the capacities and on the dates indicated.
| Signature |
Title |
Date | ||
| /s/ Ward Polzin |
Chief Executive Officer and Director (Principal Executive Officer) |
June 22, 2016 | ||
| Ward Polzin | ||||
| /s/ George Glyphis |
Vice President and Chief Financial Officer (Principal Financial Officer) |
June 22, 2016 | ||
| George Glyphis | ||||
| /s/ Jamie Wheat |
Vice President and Chief Accounting Officer (Principal Accounting Officer) |
June 22, 2016 | ||
| Jamie Wheat | ||||
| /s/ Chris Carter |
Director | June 22, 2016 | ||
| Chris Carter | ||||
| /s/ David Hayes |
Director | June 22, 2016 | ||
| David Hayes | ||||
| /s/ Christopher Ray |
Director | June 22, 2016 | ||
| Christopher Ray | ||||
|
|
Director | |||
| Martin Sumner | ||||
| /s/ Tony Weber |
Director | June 22, 2016 | ||
| Tony Weber | ||||
II-5
Table of Contents
INDEX TO EXHIBITS
| Exhibit |
Description | |||
| *1.1 | Form of Underwriting Agreement | |||
| 3.1 | Certificate of Incorporation of Centennial Resource Development, Inc. | |||
| *3.2 | Form of Amended and Restated Certificate of Incorporation of Centennial Resource Development, Inc. | |||
| 3.3 | Bylaws of Centennial Resource Development, Inc. | |||
| *3.4 | Form of Amended and Restated Bylaws of Centennial Resource Development, Inc. | |||
| *4.1 | Form of Common Stock Certificate | |||
| *4.2 | Form of Registration Rights Agreement among Centennial Resource Development, Inc., Centennial Resource Development, LLC, Celero Energy Company, LP and NGP Centennial Follow-On LLC | |||
| *4.3 | Form of Voting Agreement among Centennial Resource Development, Inc., Centennial Resource Development, LLC and Celero Energy Company, LP | |||
| *5.1 | Form of opinion of Vinson & Elkins L.L.P. as to the legality of the securities being registered | |||
| 10.1 | Amended and Restated Credit Agreement, dated as of October 15, 2014, among Centennial Resource Production, LLC, as borrower, and JPMorgan Chase Bank, N.A., as administrative agent, and the lenders party thereto | |||
| 10.2 | First Amendment to Amended and Restated Credit Agreement, dated as of May 6, 2015, among Centennial Resource Production, LLC, as borrower, and JPMorgan Chase Bank, N.A., as administrative agent, and the lenders and guarantors party thereto | |||
| *10.3† | Form of Centennial Resource Development, Inc. 2016 Long Term Incentive Plan | |||
| *10.4† | Form of Restricted Stock Agreement | |||
| *10.5 | Form of Indemnification Agreement between Centennial Resource Development, Inc. and each of the directors and officers thereof | |||
| *10.6 | Form of Second Amended and Restated Limited Liability Company Agreement of Centennial Resource Development, LLC | |||
| *10.7 | Form of Master Contribution Agreement among Centennial Resource Development, Inc., Centennial Resource Development, LLC, Celero Energy Company, LP and NGP Centennial Follow-On LLC | |||
| *21.1 | Subsidiaries of Centennial Resource Development, Inc. | |||
| 23.1 | Consent of KPMG LLP | |||
| 23.2 | Consent of KPMG LLP | |||
| 23.3 | Consent of Netherland, Sewell & Associates, Inc. | |||
| *23.4 | Consent of Vinson & Elkins L.L.P. (included as part of Exhibit 5.1 hereto) | |||
| 24.1 | Power of Attorney (included on the signature page of this Registration Statement) | |||
| 99.1 | Netherland, Sewell & Associates, Inc., Summary of Reserves at December 31, 2014 | |||
| 99.2 | Netherland, Sewell & Associates, Inc., Summary of Reserves at December 31, 2015 | |||
| * | To be filed by amendment. |
| † | Compensatory plan or arrangement. |
II-6