Attached files
| file | filename |
|---|---|
| 8-K - FORM 8-K - Ready Capital Corp | v442688_8k.htm |
Exhibit 99.1

Investor Presentation June 2016

Disclaimer Forward - Looking Statements ▪ This presentation contains statements that constitute “forward - looking statements,” as such term is defined in Section 27A of th e Securities Act of 1933, as amended, and Section 21E of the Securities Exchange Act of 1934, as amended, and such statements are intended to be covered by the safe harbors provid ed by the same. These statements are based on current expectations and beliefs of management of Sutherland Asset Management Corporation (“SAM”) and Zais Financial Corp. (“ZFC”) an d a re subject to a number of trends and uncertainties that could cause actual results to differ materially from those described in the forward - looking statements; neith er SAM nor ZFC can give any assurance that expectations will be attained. ▪ Factors that could cause actual results to differ materially from expectations include, but are not limited to, the risk that th e merger will not be consummated within the expected time period or at all; the occurrence of any event, change or other circumstances that could give rise to the termination of the m erg er agreement; the inability to obtain stockholder approvals relating to the merger or the failure to satisfy the other conditions to completion of the merger; fluctuations in the adjust ed book value per share of the shares of both SAM and ZFC; risks related to disruption of management attention from the companies’ ongoing business operations due to the proposed merge r; the effect of the announcement of the proposed merger on SAM’s and ZFC’s operating results and businesses generally; the outcome of any legal proceedings relating to the me rge r; changes in future loan production; the ability to retain key managers of GMFS; availability of suitable investment opportunities; changes in interest rates; changes in the yie ld curve; changes in prepayment rates; the availability and terms of financing; general economic conditions; market conditions; conditions in the market for mortgage - related investments; l egislative and regulatory changes that could adversely affect the businesses of ZFC and SAM; and other factors, including those set forth in the Risk Factors section of ZFC’s most rec ent Annual Report on Form 10 - K and Quarterly Report on Form 10 - Q filed with the U.S. Securities and Exchange Commission (the “SEC”), and other reports filed by ZFC with the SEC, co pies of which are available on the SEC’s website, www.sec.gov. Neither SAM nor ZFC assumes any responsibility for information relating to the other, and neither ZFC nor SAM un der takes any obligation to update these statements for revisions or changes after the date of this presentation, except as required by law. Additional Information About the Merger ▪ In connection with the merger, ZFC filed a registration statement on Form S - 4 (File No. 333 - 211251) with the SEC that included a preliminary joint proxy statement/prospectus, and will file other relevant documents concerning the proposed merger. The registration statement has not yet been declared effec tiv e by the SEC and is subject to revisions, some of which may be significant. The registration statement and joint proxy statement/prospectus contain important information about the pro posed merger and related matters. BEFORE MAKING ANY VOTING OR INVESTMENT DECISION, INVESTORS ARE URGED TO READ THE DEFINITIVE JOINT PROXY STATEMENT/PROSPECTUS AND ANY OTHER DOCUMENTS TO BE FILED WITH THE SEC IN CONNECTION WITH THE MERGER OR INCORPORATED BY REFERENCE IN THE DEFINITIVE JOINT PROXY STATEMENT/PROSPECTUS BECAUSE THEY WILL CONTAIN IMPORTANT INFORMATION ABOUT ZFC, SAM AND THE MERGER. ▪ Investors and stockholders of ZFC and SAM may obtain free copies of the registration statement and other relevant documents f ile d by ZFC with the SEC (as they become available) through the website maintained by the SEC at www.sec.gov. Copies of the documents filed by ZFC with the SEC are also availabl e f ree of charge on ZFC’s website at www.zaisfinancial.com . ZFC stockholders may also contact ZFC Investor Services for additional information by calling 212 - 827 - 3773 or emailing mmeek@ mww.com. ▪ This communication shall not constitute an offer to sell or the solicitation of an offer to buy any securities, nor shall the re be any sale of securities in any jurisdiction in which such offer, solicitation or sale would be unlawful prior to registration or qualification under the securities laws of any such ju ris diction. No offering of securities shall be made except by means of a prospectus meeting the requirements of Section 10 of the U.S. Securities Act of 1933, as amended. Participants in Solicitation Relating to the Merger ▪ ZFC, SAM and their respective directors and executive officers may be deemed to be participants in the solicitation of proxie s f rom ZFC’s and SAM’s stockholders in respect of the proposed merger. Information regarding ZFC’s directors and executive officers can be found in ZFC’s Annual Report on Form 10 - K f iled with the SEC on March 10, 2016, as amended by its Form 10 - K/A filed on April 29, 2016. Information regarding SAM’s directors and executive officers can be found in ZFC’s r egistration statement on Form S - 4 filed with the SEC. Additional information regarding the interests of such potential participants will be included in the joint proxy statem ent /prospectus and other relevant documents filed with the SEC in connection with the merger if and when they become available. These documents are available free of charge on the SEC' s w ebsite and from ZFC or SAM, as applicable, using the sources indicated above. 2
▪ In October 2015, ZAIS Financial Corp. (“ZFC”) launched a strategic review of its business and with the assistance of Houlihan Lokey contacted 63 potential strategic and financial buyers ▪ ZFC and Sutherland Asset Management (“SAM”) entered into a definitive merger agreement dated April 6, 2016, as amended as of May 9, 2016 (the “Merger”) ▪ Following ZFC and SAM stockholder approval and prior to consummation of the merger, ZFC stockholders will be eligible to receive cash aggregating approximately $64 million in a tender offer to be made by ZFC prior to the combination date ▪ SAM will merge with a newly formed wholly - owned subsidiary of ZFC (“Merger Sub”) , with Merger Sub continuing as the surviving entity and a wholly - owned subsidiary of ZFC ▪ SAM stockholders will receive newly issued ZFC shares; holders of operating partnership (“OP”) units of SAM will receive OP units of the surviving operating partnership and ZFC stockholders will continue to be stockholders of the surviving company ▪ ZFC will terminate its existing management agreement with ZAIS Group LLC and enter into a new management agreement with Waterfall Asset Management (“Waterfall”) ▪ Assuming the tender offer is 100% subscribed, ZFC and SAM stockholders will own, upon closing, approximately 15% and 85% of the combined company, respectively (based on March 31, 2016 reported book values) ▪ ZFC will change its name to “Sutherland Asset Management Corporation” and will continue to be listed on the NYSE, under the symbol “SLD ” Transaction Overview Executive Summary – Transaction Overview 3

▪ ZFC will become a diversified commercial mortgage REIT with a unique focus on small balance commercial (“SBC”) conventional and owner occupied loans including Small Business Administration (“SBA”) ▪ The combined company will operate four primary segments: 1) SAM: acquires and manages distressed SBC loans (1) 2) ReadyCap Commercial: wholly - owned subsidiary of SAM, which originates SBC loans ▪ Originated $421.7 million of SBC loans in 2015 and $235.1 million YTD 2016 3) ReadyCap Lending: wholly - owned subsidiary of SAM, which originates and services SBA loans ▪ Granted Preferred Lender Status by the SBA in Q4 2015; originated $24.0 million since inception ▪ Serviced $1.2 billion as of March 31, 2016 ▪ Holds 1 of only 14 non - bank SBA licenses issued in the U.S. (acquired platform and portfolio from CIT in 2014) 4) GMFS: wholly - owned subsidiary of ZFC which originates, sells and services residential mortgage loans ▪ Originated $1.8 billion in 2015 and $432.1 million YTD March 2016 (excluding reverse mortgages); serviced an MSR portfolio of $4.4 billion in UPB as of March 31, 2016 Combined Business Overview Executive Summary – Business Overview & Investment Highlights 4 Transaction Highlights x Creates a REIT with an expanded capital base of over $560 million in stockholder’s equity to be deployed into attractive small balance commercial real estate assets, which include newly originated and distressed legacy mortgages x Ability to generate compelling risk - adjusted returns with a focus on the underserved and fragmented small balance commercial mortgage market x Uniquely positioned to source high yielding assets from acquisitions and self - originated products driving growth x Creates a highly scalable, fully integrated REIT platform generating small balance commercial assets through multiple origination channels We believe this is a compelling transaction and represents the best overall outcome for ZFC stockholders (1) Since 2008 and through March 31, 2016, Waterfall has acquired more than 9,000 SBC and SBA loans with aggregate UPB of approximately $3.5 billion for an aggregate purchase price of approximately $2.6 billion.

Summary of ZFC Strategic Review 5 ▪ As part of the ZFC strategic review beginning in October 2015, ZFC conducted a full process, with the assistance of Houlihan Lok ey, which involved a targeted group of potential strategic and financial buyers ▪ Contacted 63 potential strategic and financial buyers, 44 of which entered into confidentiality agreements ▪ In late November 2015, ZFC received 14 proposals proposing various transactions involving all or a part of the company ▪ After a review of all of the bids received, ZFC decided to invite 3 parties to the second round to complete further due dilig enc e ▪ In January 2016, ZFC received proposals from the 3 parties that were invited to the second round ▪ Party A submitted a proposal for a purchase price of $90 million to acquire ZFC exclusive of GMFS ▪ Party B submitted a proposal to acquire ZFC’s conduit loans, RMBS portfolio, re - performing loan portfolio and GMFS, but proposed a $65 million holdback in the form of an escrow until final resolution of potential indemnification claims arising out of sales of mor tgage loans by GMFS from 1999 to 2006 (“potential claims”) ▪ Sutherland submitted an indication of interest which proposed that ZFC acquire SAM in a stock for stock merger, with an excha nge ratio being computed based on the companies’ respective book value ▪ ZFC and Houlihan Lokey conducted a liquidation analysis and compared this analysis to the proposals received in the second ro und of the process ▪ Taking into account this analysis and negotiations with SAM, ZFC decided to move forward with the Merger

Situation Overview 6 ▪ Given a variety of factors, we believe that the merger with SAM is the more compelling option for ZFC stockholders: ▪ Net liquidation proceeds are estimated to return 52.3% - 80.5% of book value whereas a merger with SAM will provide 87.5% of boo k value (1) ▪ Provides a 7% - 35% upside versus liquidation, assuming the combined company trades in line with commercial mortgage REIT peers ▪ Based on SAM’s historical operating performance and dividend track record, we believe that the combined company should trade in line with the commercial mortgage REIT peer group, which currently trades at 1.00x of book value (2) vs. residential mortgage REITs which trades at 0.87x of book value (2) ▪ The sale of GMFS at an attractive valuation could prove to be difficult based on the current trading levels of public mortgag e c ompanies (56% of book value (3) ) and GMFS book value could be eroded if potential claims lead to losses beyond established reserves ▪ All of the recently announced mortgage REIT transactions occurred below book value, while none of the targets opted for liqui dat ion — signaling that the sale was the optimal solution for shareholders (1) Calculated as ZFC adjusted book value per share less deal expenses per the merger agreement ($16.80) divided by ZFC book valu e p er share as of 3/31/16. (2) Source: FactSet. The commercial mortgage REIT peer group includes: STWD, CLNY, ARI, BXMT, ACRE, and LADR. Residential mortgag e R EITs include: NLY, AGNC, ARR, CYS, CMO, ANH, ORC, TWO, CIM, MFA, IVR, MTGE, NYMT, EFC, WMC, MITT, AI, DX, OAKS, EARN, and ZFC. Market data as of 6/20/ 16. (3) Source: FactSet. Mortgage companies include NSM, PFSI, PHH, OCN, WAC, and SGM. Market data as of 6/20/16.
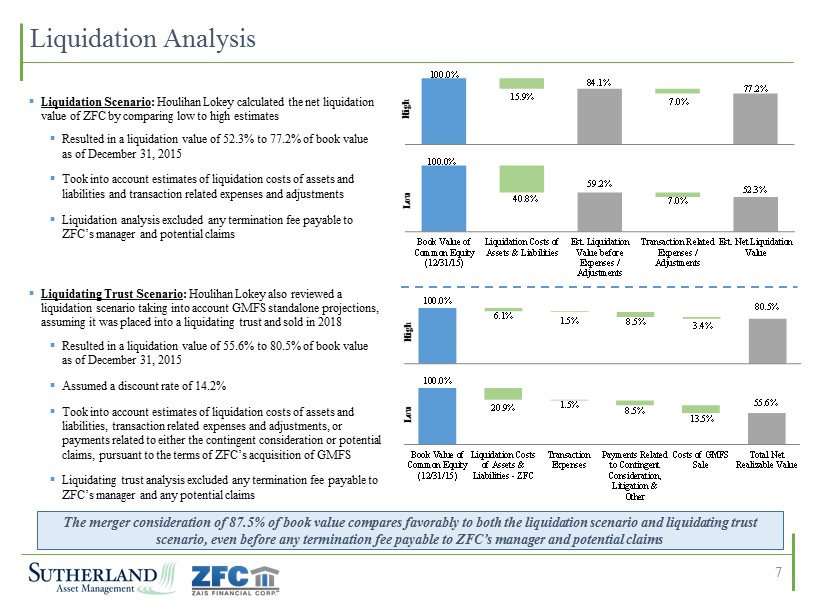
100.0% 55.6% 20.9% 1.5% 8.5% 13.5% Book Value of Common Equity (12/31/15) Liquidation Costs of Assets & Liabilities - ZFC Transaction Expenses Payments Related to Contingent Consideration, Litigation & Other Costs of GMFS Sale Total Net Realizable Value 100.0% 80.5% 6.1% 1.5% 8.5% 3.4% Book Value of Common Equity (12/31/15) Liquidation Costs of Assets & Liabilities - ZFC Transaction Expenses Payments Related to Contingent Consideration, Litigation & Other GMFS Sale Total Net Realizable Value Liquidation Analysis 7 100.0% 15.9% 84.1% 7.0% 77.2% Book Value of Common Equity (12/31/15) Liquidation Costs of Assets & Liabilities Est. Liquidation Value before Expenses / Adjustments Transaction Related Expenses / Adjustments Est. Net Liquidation Value 100.0% 40.8% 59.2% 7.0% 52.3% Book Value of Common Equity (12/31/15) Liquidation Costs of Assets & Liabilities Est. Liquidation Value before Expenses / Adjustments Transaction Related Expenses / Adjustments Est. Net Liquidation Value ▪ Liquidation Scenario : Houlihan Lokey calculated the net liquidation value of ZFC by comparing low to high estimates ▪ Resulted in a liquidation value of 52.3% to 77.2% of book value as of December 31, 2015 ▪ Took into account estimates of liquidation costs of assets and liabilities and transaction related expenses and adjustments ▪ Liquidation analysis excluded any termination fee payable to ZFC’s manager and potential claims ▪ Liquidating Trust Scenario : Houlihan Lokey also reviewed a liquidation scenario taking into account GMFS standalone projections, assuming it was placed into a liquidating trust and sold in 2018 ▪ Resulted in a liquidation value of 55.6% to 80.5% of book value as of December 31, 2015 ▪ Assumed a discount rate of 14.2 % ▪ Took into account estimates of liquidation costs of assets and liabilities, transaction related expenses and adjustments, or payments related to either the contingent consideration or potential claims, pursuant to the terms of ZFC’s acquisition of GMFS ▪ Liquidating trust analysis excluded any termination fee payable to ZFC’s manager and any potential claims The merger consideration of 87.5% of book value compares favorably to both the liquidation scenario and liquidating trust scenario, even before any termination fee payable to ZFC’s manager and potential claims High Low High Low

8.4% 8.6% 8.8% 9.3% 9.3% 10.4% 11.1% 11.2% ACRE LADR BXMT STWD CLNY SAM ZFC ARI 11.1% 10.8% 9.0% 9.0% 8.6% 8.1% 8.0% 7.8% (2.9%) 1.00x 0.87x 0.60x 0.80x 1.00x 1.20x Jun - 13 Jan - 14 Sep - 14 Apr - 15 Nov - 15 Jun - 16 Commercial Residential Commercial 3 - Year Average: 1.07x Residential 3 - Year Average: 0.86x 8 The Merger Transitions ZFC into a Commercial Mortgage REIT The combined company is expected to generate strong ROAEs and dividend yields warranting a premium valuation vs. commercial mortgage REITs, which trade at a premium to residential mortgage REITs Historical Price to Book Value Per Share Source: SNL Financial and Fact Set, Market data as of 6/20/16. Note: Commercial includes STWD, CLNY, ARI, BXMT, ACRE, and LADR. Residential includes: NLY, AGNC, ARR, CYS, CMO, ANH, ORC, TWO, CIM, MFA, IVR, MTGE, NYMT, EFC, WMC, MITT, AI, DX, OAKS, EARN, and ZFC. (1) Represents the ROAE for the last twelve months ended 3/31/16. (2) SAM dividend yield calculated as Q1’16 annualized declared dividend to common stockholders divided by Q1’16 book value per s har e. Return on Average Equity (Last Twelve Months (1) ) Most Recent Quarter Dividend Yield (2) Pro Forma

Source: SNL Financial. Note: Commercial includes STWD, CLNY ARI, ACRE and BXMT. Residential includes: AGNC, CYS, CMO, ARR, ORC, NLY, TWO, CIM, MFA, IVR, MTGE, NYMT, EFC, ANH, MITT, WMC, DX, AI, ZFC, EARN and OAKS. Figures represent the median of each respective peer set. All figures represent holding period returns (not annualized). 9 3.8% 12.1% 0.9% 16.5% 3.6% 0.0% (1.2%) 2.5% 5.3% 9.3% 1.7% 16.3% 2H '14 2015 2016 YTD 2H '14 - 2016 YTD Commercial Residential SAM Delivering Strong Returns Relative to Peers SAM was not fully invested until Q3 2014 Total Economic Return Based on Book Value per Share and Dividends SAM has performed in line with its commercial mREIT peers and consistently outperformed residential mREITs

10 SAM Economics by Business Line Acquired Portfolio Q1 2016 Q4 2015 Q3 2015 Q2 2015 Q1 2015 Unlevered yield 8.5% 9.9% 8.9% 9.7% 9.1% Cost of funds 4.4 % 4.1 % 4.1 % 4.0 % 4.5 % Net interest spread 4.1 % 5.8 % 4.8 % 3.7 % 4.6 % Leverage ratio 3.3x 2.6x 2.8x 2.2x 2.0x Levered yield 22.2% 25.0% 22.3% 22.5% 18.2% SBC Conventional and Investor Originations Unlevered yield 7.4% 6.3% 5.8% 5.8% 5.5% Cost of funds 4.3 % 3.6 % 3.1 % 3.3 % 3.1 % Net interest spread 3.1 % 2.7 % 2.7 % 2.5 % 2.4 % Leverage ratio 2.4x 2.7x 2.4x 2.7x 2.2x Levered yield 15.0% 13.5% 12.3% 12.5% 10.8% SBA Originations, Acquisitions and Servicing Unlevered yield 6.7% 5.1% 7.1% 11.4% 12.9% Cost of funds 3.2 % 3.1 % 3.4 % 5.2 % 4.7 % Net interest spread 3.5 % 2.0 % 3.7 % 6.2 % 8.2 % Leverage ratio 7.0x 7.7x 8.7x 3.2x 2.0x Levered yield 31.2% 21.1% 39.3% 31.3% 29.0%

11 SAM Return on Equity – Q1 2016 (1) Core Earnings is a non - GAAP measure. Please refer to page 28 in the Appendix for a reconciliation of GAAP to Core Earnings. (2) ROE based on annualized return for quarter ended March 31, 2016. Business Line Levered Yield Equity Allocation Net ROE Core Earnings Acquisitions 22.2% 33.0% SBC Conventional Originations 15.0 45.2 SBA Originations, Acquisitions & Servicing 31.2 21.8 (3.8) (3.8) 1.6 2.5 (10.9) (10.9) (0.3) – 7.5% 8.7% Return on Equity 20.9% 20.9% Cash and Other Non-Earning Assets, Net Non-Earning Equity Realized & Unrealized Gains, Net Operating Expenses & Fees, Net Loss on Discontinued Operations (2) (2) (1)

(% of average equity) SAM LTM PF LTM Net interest income 12.6% 12.2% Realized gains 6.4 5.3 Total 19.0 17.5 Unrealized loss (0.6) (0.5) Other income -- 1.0 Operating expenses (9.4) (7.3) Return on average equity (%) 9.0% 10.8% Balance Sheet Averages ($mm) Assets $2,208 $2,506 Liabilities 1,718 1,914 Equity 490 592 Leverage (L/E) 3.5x 3.2x Note: LTM as of 3/31/16. (1) Assumes a tax rate of 35% on GMFS earnings. Illustrative Pro Forma Return on Average Equity 12 Pro Forma Assumptions ▪ Liquidation of ZFC assets ex - GMFS (post - tender) and reinvest proceeds at SAM’s historical gross leveraged return of 15% ▪ Reduction in SAM operating expenses by $3 million ▪ Issuance of $100 million of senior notes @ 6.00% cost of debt (after tax): ▪ $57.5 million used to pay off ZFC convertible notes ▪ Remainder of proceeds reinvested into assets generating assumed 15% return on equity ▪ GMFS LTM after - tax GAAP earnings of $4.5 million with an ROAE of 9.7% (1) ▪ Leverage MSR portfolio to 30%, producing $15 million in additional investable assets which generate a gross leveraged return of 15%
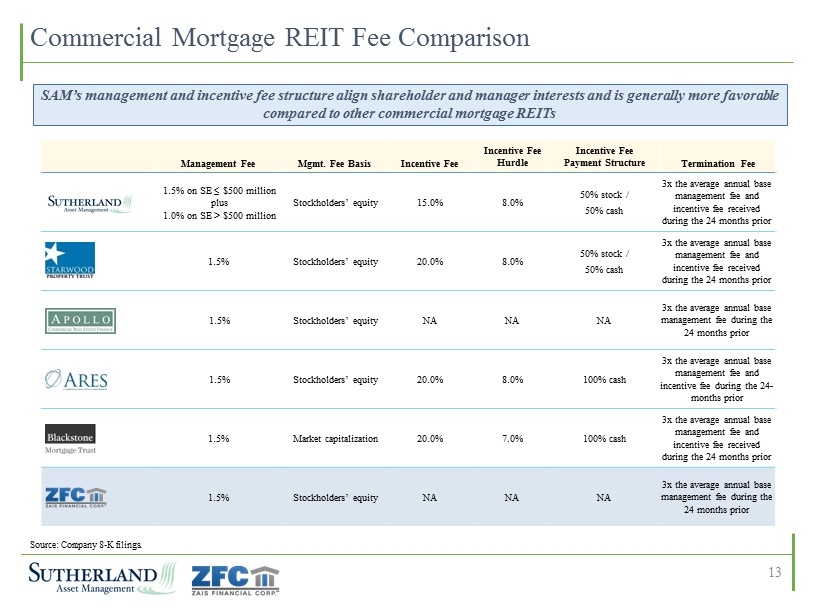
Management Fee Mgmt. Fee Basis Incentive Fee Incentive Fee Hurdle Incentive Fee Payment Structure Termination Fee 1.5% on SE ≤ $500 million plus 1.0% on SE > $500 million Stockholders’ equity 15.0% 8.0% 50% stock / 50% cash 3x the average annual base management fee and incentive fee received during the 24 months prior 1.5% Stockholders’ equity 20.0% 8.0% 50% stock / 50% cash 3x the average annual base management fee and incentive fee received during the 24 months prior 1.5% Stockholders’ equity NA NA NA 3x the average annual base management fee during the 24 months prior 1.5% Stockholders’ equity 20.0% 8.0% 100% cash 3x the average annual base management fee and incentive fee during the 24 - months prior 1.5% Market capitalization 20.0% 7.0% 100% cash 3x the average annual base management fee and incentive fee received during the 24 months prior 1.5% Stockholders’ equity NA NA NA 3x the average annual base management fee during the 24 months prior Commercial Mortgage REIT Fee Comparison SAM’s management and incentive fee structure align shareholder and manager interests and is generally more favorable compared to other commercial mortgage REITs Source: Company 8 - K filings. 13
Appendix

▪ As per SAM, the combined company will use the remaining cash proceeds from the sale of ZFC’s remaining assets to invest in Commercial Real Estate Assets Transaction Structure Summary Waterfall Asset Management SAM Pro Forma Combined Company ZAIS REIT Management ZFC Management Agreement Pre - Transaction Post - Transaction Transaction Adjustments Management Agreement ▪ ZFC will use cash proceeds from the sale of mortgage loans only to purchase up to $64.3 million worth of ZFC shares via stock tender ▪ Residential Loans and Securities ▪ GMFS 2 1 ▪ Commercial Real Estate Assets ▪ Small Business Lending Waterfall Asset Management SAM ZAIS REIT Management Management Agreement Newly - Formed Merger Sub 2 3 4 ▪ ZFC will form a merger sub and SAM will merge into the merger sub, which will be the surviving entity; SAM stock holders will receive shares in ZFC based on the Exchange Ratio; ZFC will change its name to “Sutherland Asset Management Corporation” and remain listed on the NYSE with the ticker “SLD” ▪ Effective at the close of merger, SLD will terminate its management agreement with its current manager ▪ Concurrently, SLD will enter into a management agreement with Waterfall whereby Waterfall becomes the manager of the combined company Waterfall Asset Management Management Agreement ▪ Commercial Real Estate Assets ▪ Small Business Lending ▪ GMFS 1 5 5 ZFC (new ticker: SLD) Termination Fee 2 3 4 15
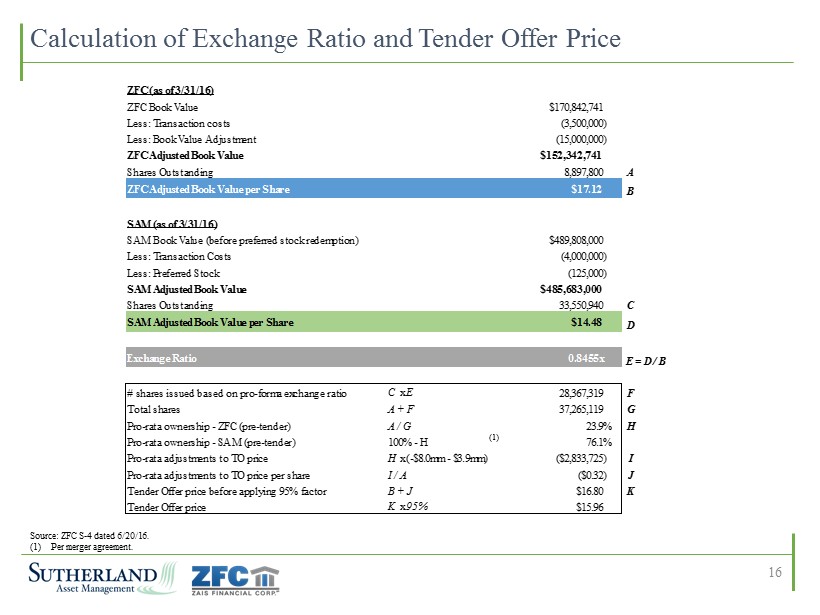
Calculation of Exchange Ratio and Tender Offer Price Source: ZFC S - 4 dated 6/20/16. (1) Per merger agreement. 16 ZFC (as of 3/31/16) ZFC Book Value $170,842,741 Less: Transaction costs (3,500,000) Less: Book Value Adjustment (15,000,000) ZFC Adjusted Book Value $152,342,741 Shares Outstanding 8,897,800 A ZFC Adjusted Book Value per Share $17.12 B SAM (as of 3/31/16) SAM Book Value (before preferred stock redemption) $489,808,000 Less: Transaction Costs (4,000,000) Less: Preferred Stock (125,000) SAM Adjusted Book Value $485,683,000 Shares Outstanding 33,550,940 C SAM Adjusted Book Value per Share $14.48 D Exchange Ratio 0.8455x E = D / B # shares issued based on pro-forma exchange ratio C x E 28,367,319 F Total shares A + F 37,265,119 G Pro-rata ownership - ZFC (pre-tender) A / G 23.9% H Pro-rata ownership - SAM (pre-tender) 100% - H 76.1% Pro-rata adjustments to TO price H x (-$8.0mm - $3.9mm) ($2,833,725) I Pro-rata adjustments to TO price per share I / A ($0.32) J Tender Offer price before applying 95% factor B + J $16.80 K Tender Offer price K x 95% $15.96 (1)

Name Background Thomas E. Capasse Jack J. Ross Frederick C. Herbst, CPA Thomas Buttacavoli Management Team of the Combined Company ▪ CEO and Chairman of SAM ▪ Manager and Co - Founder of Waterfall Asset Management ▪ 34 years of structured credit experience globally ▪ Co - founded Merrill Lynch’s ABS group in the 1980’s ▪ President and Director of SAM ▪ Manager and Co - Founder of Waterfall Asset Management ▪ 31 years of ABS and structured credit experience ▪ Co - founded Merrill Lynch’s ABS group in the 1980’s ▪ CFO of SAM ▪ Managing Director of Waterfall Asset Management ▪ Previously served as CFO of Arbor Realty Trust (NYSE: ABR) and Clayton Holdings (NASD: CLAY) ▪ Chief Investment Officer of SAM ▪ Manager and Managing Director of Waterfall Asset Management ▪ Previously served as a structured finance analyst at Licent Capital, strategic planning analyst at BNY Capital Markets and Financial Analyst at Merrill Lynch 17 Chief Executive Officer Chairman President Chief Financial Officer Chief Investment Officer Source: ZFC S - 4 dated 6/20/16.

Board of Directors of the Combined Company Name Background Thomas E. Capasse Jack J. Ross Frank P. Filipps Todd M. Sinai J. Mitchell Reese David L. Holman ▪ Manager and Co - Founder of Waterfall Asset Management ▪ 34 years of structured credit experience globally ▪ Co - founded Merrill Lynch’s ABS group in the 1980’s ▪ Manager and Co - Founder of Waterfall Asset Management ▪ 31 years of ABS and structured credit experience ▪ Co - founded Merrill Lynch’s ABS group in the 1980’s ▪ Served as Chairman and CEO of Clayton Holdings. And Radian Group ▪ Director of Impac Mortgage Holdings since 1995, and Director of Orchid Island Capital since 2013 ▪ Professor of Real Estate and Business Economics and Public Policy at Wharton ▪ Holds a Ph.D. in Economics from MIT, and B.A. in Economics and Math from Yale ▪ Currently serves as a Managing Member of Cintra Capital ▪ Previously served as a Managing Director of The Carlyle Group, where he headed the firm’s U.S. venture capital fund ▪ Previously served as a Partner, and the Americas Director of Accounting Standards at Ernst & Young ▪ Director of ZFC, Chair of ZFC Audit Committee 18 Chief Executive Officer Chairman President Director (SAM Designee) Director (SAM Designee) Director (SAM Designee) Director (ZAIS Financial Designee) Source: ZFC S - 4 dated 6/20/16.

SAM Company Overview

Residential Housing Large Balance Commercial Loans Small Balance Commercial Loans Average Initial Principal Balance ~$225,000 At least $20 million ~$2.0 million Loan To Value ~80% ~65% ~60% Yield ~4.0% ~4.0% ~7.0% Debt Service Coverage Ratio N/A ~1.4x ~1.6x Cap Rate ~5.0% ~6.0% ~8.0% Personal Guarantee Yes No Yes 60.00 80.00 100.00 120.00 140.00 2006 2007 2008 2009 2010 2011 2012 2013 2014 2015 Residential (S&P/Case-Shiller Index) Commercial (CPPI) SBC (Boxwood Means Index) % Peak - to - Trough % Recovery Residential (35.1)% 35.3% Commercial (40.5)% 62.5% SBC (22.3)% 16.3% SBC Market Offers Compelling Risk - adjusted Returns ▪ SBC property market has lagged the larger CRE/housing markets over the last ~2 years due to limited institutional investment ▪ Provides strong relative value versus other real estate classes Historical Price Performance Asset Class Comparison Source: Boxwood Means Inc., Moody’s / RCA and S&P / Case - Shiller. SBC loans generate superior returns versus residential and large balance commercial loans Typical Asset Characteristics ▪ SBC loans generate higher yields with less credit exposure compared to residential and large balance commercial loans and are backed by personal guarantee ▪ SBC loans are secured by first liens on commercial real estate properties valued under $5 million 20
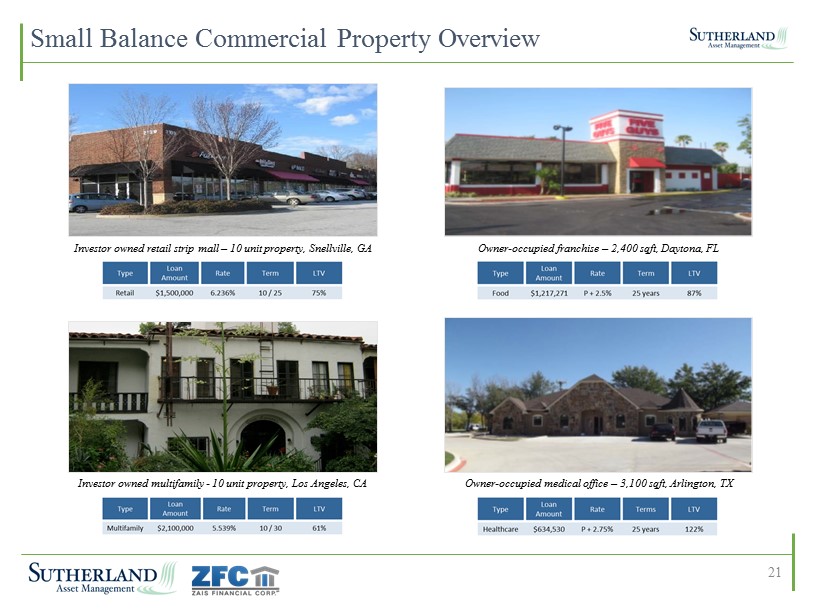
21 Small Balance Commercial Property Overview Investor owned retail strip mall – 10 unit property, Snellville, GA Owner - occupied franchise – 2,400 sqft, Daytona, FL Investor owned multifamily - 10 unit property, Los Angeles, CA Owner - occupied medical office – 3,100 sqft, Arlington, TX

SAM Business Overview 22 Loan Acquisition Business Origination Business(es) Conventional Loans Bridge Loans Freddie Mac SBL Program SBA 7(a) Booking Entity: Sutherland ReadyCap Commercial ReadyCap Lending Principal Business Activity / Secured by: Acquires pools of performing, sub - performing, and non - performing SBC loans from banks, other lenders, the FDIC, special servicers and others First mortgages on investor - owned commercial, multi - family or mixed - use properties. Multifamily properties with five units or more First mortgages on owner - occupied commercial properties that are 75% guaranteed by the SBA Typical Size: $500K - $10M $750K - $10M $1M to $15M $1M to $5M Up to $5M Rate: Fixed / floating Fixed / floating Fixed / floating Fixed / floating Typically floating Original Term: 5 - 30 years (18 - 36 months hold) 5 - 10 years 24 - 36 months 5 - 20 years 25 years Amortization: Fully amortizing 15 - 30 years Interest only Up to 30 years Fully amortizing Personal Guarantee: Typically Personal and / or carve - out guarantee Personal and / or carve - out guarantee No Yes Loan Assets (1) $1.2B $245.3M $707.8M Stockholders’ Equity (1) $335.2M $77.4M $76.7M Funding Strategy Credit Facilities and Securitizations Credit Facilities and Securitizations Guaranteed portion (75%) sold to unaffiliated parties, non - guaranteed portion retained (1) As of 3/31/2016.

Sourcing Strategy: Acquisition and Origination Acquired Loans ▪ Top 5 acquirer of SBC loans since crisis ▪ ~$1.3 billion acquisition pipeline from a variety of sources including regional banks, SBC special servicers, specialty finan ce financial firms, etc. ▪ Reviewed over $142 billion of UPB, representing ~250,000 loans since 2008, supported by 77 professionals ▪ Represents 33.0% of SAM’s equity allocation ▪ ReadyCap Lending is a market leader in SBA 7(a) loan origination and servicing ▪ ReadyCap Lending holds one of only 14 non - bank SBLC licenses which provides a unique advantage in origination and acquisition of 7(a) loans. Of the 14 license holders, only four are actively originating ▪ The Company commenced ReadyCap Lending SBA 7(a) originations in 3Q15 ▪ Represents 21.8% of SAM’s equity allocation Originated Loans SAM either acquires a loan or originates a loan through its ReadyCap businesses ▪ ReadyCap Commercial is a TRS and market - leading nationwide originator, focused solely on providing SBC loans (First mortgage loans, "Mini - perm" loans, Bridge loans, and Mezzanine loans) ▪ Originated more than $1.0 billion in loans across 31 states since inception in Sep. 2012 ▪ Represents 45.2% of SAM’s equity allocation 23
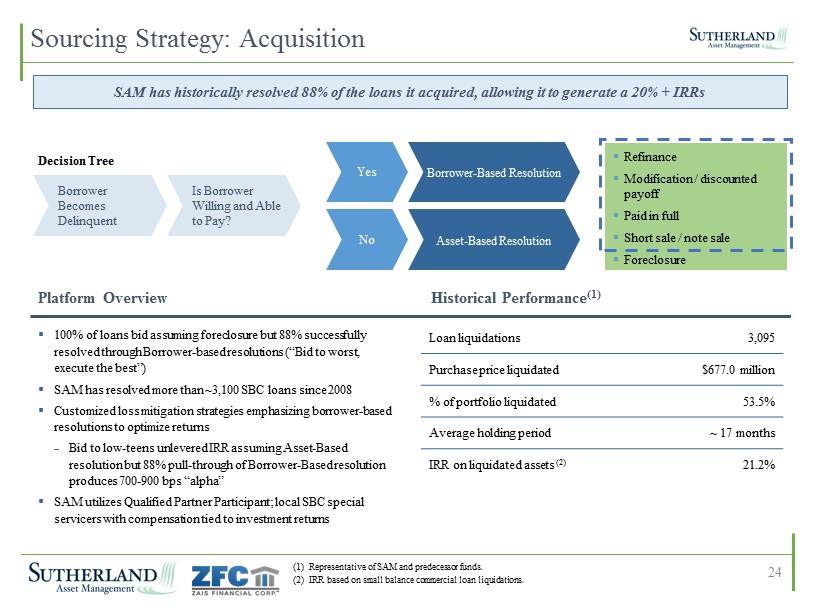
Yes No Borrower - Based Resolution Asset - Based Resolution Is Borrower Willing and Able to Pay? Borrower Becomes Delinquent Preferred Outcomes 88% ▪ Refinance ▪ Modification / discounted p ayoff ▪ Paid in full ▪ Short sale / note sale ▪ Foreclosure Decision Tree ▪ 100% of loans bid assuming foreclosure but 88% successfully resolved through Borrower - based resolutions (“Bid to worst, execute the best”) ▪ SAM has resolved more than ~ 3,100 SBC loans since 2008 ▪ Customized loss mitigation strategies emphasizing borrower - based resolutions to optimize returns – Bid to low - teens unlevered IRR assuming Asset - Based resolution but 88% pull - through of Borrower - Based resolution produces 700 - 900 bps “alpha” ▪ SAM utilizes Qualified Partner Participant; local SBC special servicers with compensation tied to investment returns Loan liquidations 3,095 Purchase price liquidated $677.0 million % of portfolio liquidated 53.5% Average holding period ~ 17 months IRR on liquidated assets (2) 21.2% (1) Representative of SAM and predecessor funds. (2) IRR based on small balance commercial loan liquidations. Sourcing Strategy: Acquisition Platform Overview Historical Performance (1) SAM has historically resolved 88% of the loans it acquired, allowing it to generate a 20% + IRRs 24
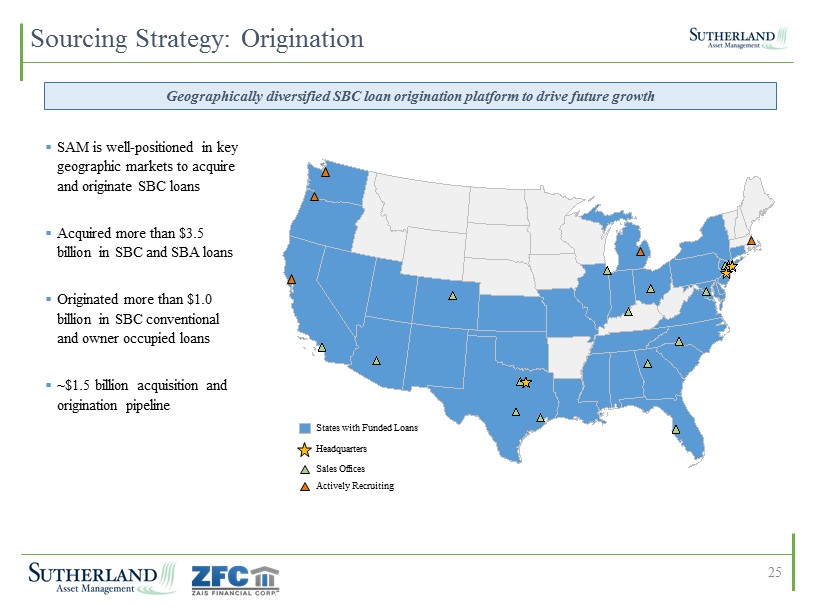
25 Geographically diversified SBC loan origination platform to drive future growth NY008HT3 / 807214_1.wor NY008HT3 / 807214_1.wor NY008HT3 / 807214_1.wor NY008HT3 / 807214_1.wor NY008HT3 / 807214_1.wor NY008HT3 / 807214_1.wor NY008HT3 / 807214_1.wor NY008HT3 / 807214_1.wor NY008HT3 / 807214_1.wor NY008HT3 / 807214_1.wor NY008HT3 / 807214_1.wor NY008HT3 / 807214_1.wor NY008HT3 / 807214_1.wor NY008HT3 / 807214_1.wor NY008HT3 / 807214_1.wor NY008HT3 / 807214_1.wor NY008HT3 / 807214_1.wor NY008HT3 / 807214_1.wor NY008HT3 / 807214_1.wor NY008HT3 / 807214_1.wor NY008HT3 / 807214_1.wor NY008HT3 / 807214_1.wor NY008HT3 / 807214_1.wor NY008HT3 / 807214_1.wor NY008HT3 / 807214_1.wor NY008HT3 / 807214_1.wor NY008HT3 / 807214_1.wor NY008HT3 / 807214_1.wor NY008HT3 / 807214_1.wor NY008HT3 / 807214_1.wor NY008HT3 / 807214_1.wor NY008HT3 / 807214_1.wor NY008HT3 / 807214_1.wor NY008HT3 / 807214_1.wor NY008HT3 / 807214_1.wor NY008HT3 / 807214_1.wor NY008HT3 / 807214_1.wor NY008HT3 / 807214_1.wor NY008HT3 / 807214_1.wor NY008HT3 / 807214_1.wor NY008HT3 / 807214_1.wor NY008HT3 / 807214_1.wor NY008HT3 / 807214_1.wor NY008HT3 / 807214_1.wor NY008HT3 / 807214_1.wor NY008HT3 / 807214_1.wor NY008HT3 / 807214_1.wor NY008HT3 / 807214_1.wor NY008HT3 / 807214_1.wor Sourcing Strategy: Origination States with Funded Loans Headquarters Sales Offices Actively Recruiting ▪ SAM is well - positioned in key geographic markets to acquire and originate SBC loans ▪ Acquired more than $3.5 billion in SBC and SBA loans ▪ Originated more than $1.0 billion in SBC conventional and owner occupied loans ▪ ~$1.5 billion acquisition and origination pipeline
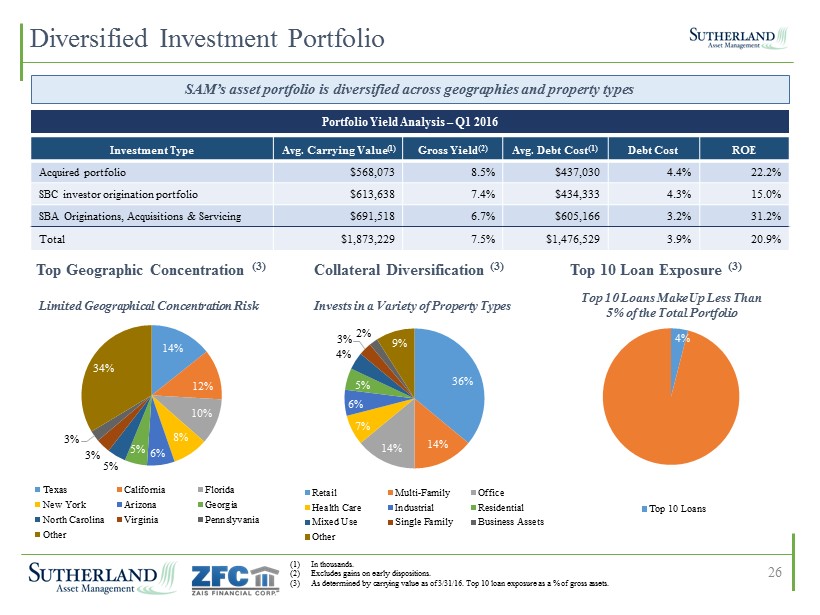
14% 12% 10% 8% 6% 5% 5% 3% 3% 34% Texas California Florida New York Arizona Georgia North Carolina Virginia Pennslyvania Other Portfolio Yield Analysis – Q1 2016 Investment Type Avg. Carrying Value (1) Gross Yield (2) Avg. Debt Cost (1) Debt Cost ROE Acquired portfolio $568,073 8.5% $437,030 4.4% 22.2% SBC investor origination portfolio $613,638 7.4% $434,333 4.3% 15.0% SBA Originations, Acquisitions & Servicing $691,518 6.7% $605,166 3.2% 31.2% Total $1,873,229 7.5% $1,476,529 3.9% 20.9% 36% 14% 14% 7% 6% 5% 4% 3% 2% 9% Retail Multi-Family Office Health Care Industrial Residential Mixed Use Single Family Business Assets Other Top Geographic Concentration (3) Collateral Diversification (3) (1) In thousands. (2) Excludes gains on early dispositions. (3) As determined by carrying value as of 3/31/16. Top 10 loan exposure as a % of gross assets. 26 Diversified Investment Portfolio 4% Top 10 Loans Top 10 Loan Exposure (3) Limited Geographical Concentration Risk Invests in a Variety of Property Types Top 10 Loans Make Up Less Than 5% of the Total Portfolio SAM’s asset portfolio is diversified across geographies and property types
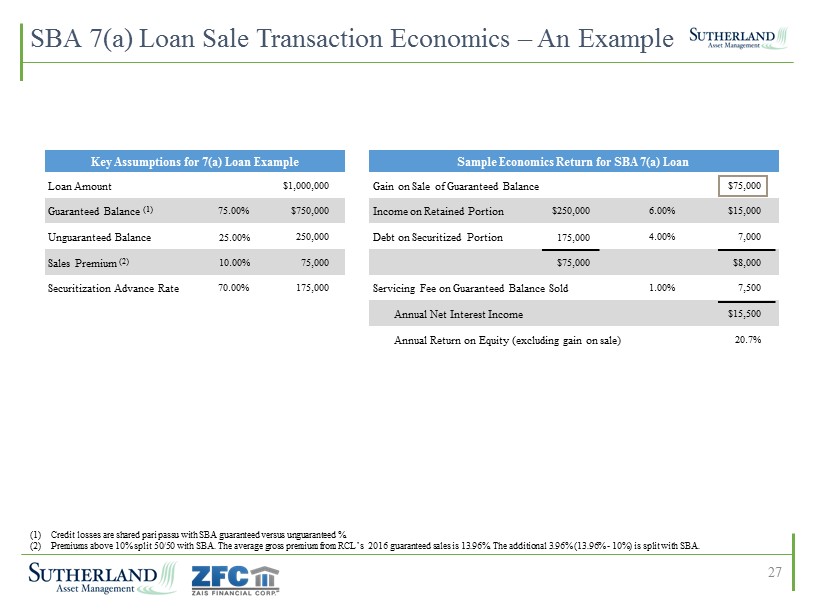
SBA 7(a) Loan Sale Transaction Economics – An Example (1) Credit losses are shared pari passu with SBA guaranteed versus unguaranteed %. (2) Premiums above 10% split 50/50 with SBA. The average gross premium from RCL’s 2016 guaranteed sales is 13.96%. The additiona l 3 .96% (13.96% - 10%) is split with SBA. Key Assumptions for 7(a) Loan Example Loan Amount $1,000,000 Guaranteed Balance (1) 75.00% $750,000 Unguaranteed Balance 25.00% 250,000 Sales Premium (2) 10.00% 75,000 Securitization Advance Rate 70.00% 175,000 Sample Economics Return for SBA 7(a) Loan Gain on Sale of Guaranteed Balance $75,000 Income on Retained Portion $250,000 6.00% $15,000 Debt on Securitized Portion 175,000 4.00% 7,000 $75,000 $8,000 Servicing Fee on Guaranteed Balance Sold 1.00% 7,500 Annual Net Interest Income $15,500 Annual Return on Equity (excluding gain on sale) 20.7% 27
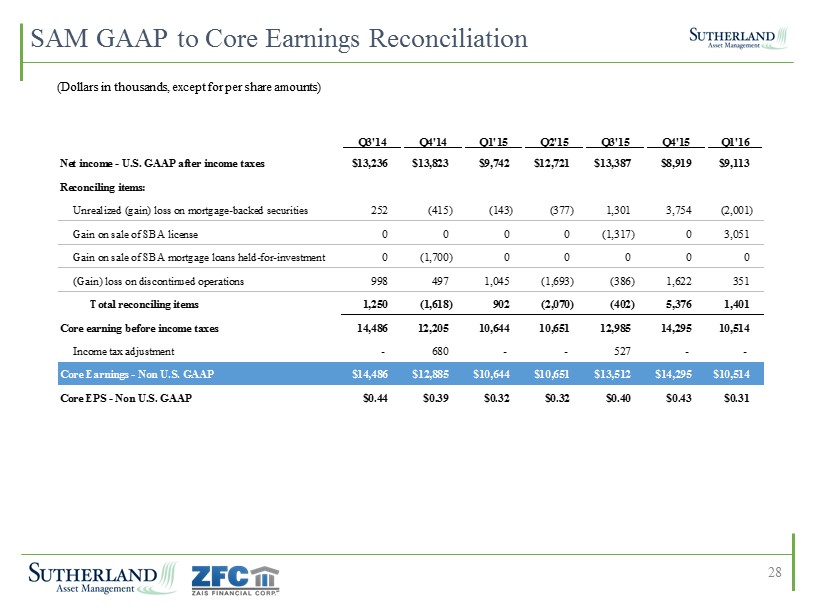
SAM GAAP to Core Earnings Reconciliation 28 Q3'14 Q4'14 Q1'15 Q2'15 Q3'15 Q4'15 Q1'16 Net income - U.S. GAAP after income taxes $13,236 $13,823 $9,742 $12,721 $13,387 $8,919 $9,113 Reconciling items: Unrealized (gain) loss on mortgage-backed securities 252 (415) (143) (377) 1,301 3,754 (2,001) Gain on sale of SBA license 0 0 0 0 (1,317) 0 3,051 Gain on sale of SBA mortgage loans held-for-investment 0 (1,700) 0 0 0 0 0 (Gain) loss on discontinued operations 998 497 1,045 (1,693) (386) 1,622 351 Total reconciling items 1,250 (1,618) 902 (2,070) (402) 5,376 1,401 Core earning before income taxes 14,486 12,205 10,644 10,651 12,985 14,295 10,514 Income tax adjustment - 680 - - 527 - - Core Earnings - Non U.S. GAAP $14,486 $12,885 $10,644 $10,651 $13,512 $14,295 $10,514 Core EPS - Non U.S. GAAP $0.44 $0.39 $0.32 $0.32 $0.40 $0.43 $0.31 (Dollars in thousands, except for per share amounts)