Attached files
| file | filename |
|---|---|
| EX-99.1 - EX-99.1 - OSI SYSTEMS INC | a16-13736_1ex99d1.htm |
| EX-2.1 - EX-2.1 - OSI SYSTEMS INC | a16-13736_1ex2d1.htm |
| 8-K - 8-K - OSI SYSTEMS INC | a16-13736_18k.htm |
Exhibit 99.2
Acquisition of American Science & Engineering Investor Briefing June 21, 2016
Forward-Looking Statements Certain statements made herein are “forward-looking statements” intended to qualify for the safe harbor from liability established by the Private Securities Litigation Reform Act of 1995. All statements other than historical facts included in this presentation, including, but not limited to, statements regarding the timing and the closing of the transaction, the financing for the transaction, the expected benefits of the transaction, prospective performance and future business plans, and any assumptions underlying any of the foregoing, are forward-looking statements. These statements are based on current expectations and projections of future events and reflect beliefs and assumptions that are based on OSI Systems’ perception of historical trends, current conditions and expected future developments as well as other factors management believes are appropriate in the circumstances. If underlying assumptions prove inaccurate or unknown, or unknown risks or uncertainties materialize, actual results could vary materially from the parties’ expectations and projections. Risks and uncertainties include, among other things, uncertainties regarding the timing of the closing of the transaction; uncertainties as to how many of AS&E’s shareholders will vote in favor of the transaction; the possibility that various closing conditions to the merger and related transactions may not be satisfied or waived, including that a governmental entity may prohibit, delay, or refuse to grant approval for the consummation of the transaction; that there is a material adverse change to AS&E’s business; the outcome of any legal proceedings that may be instituted with respect to the transaction; that the integration of AS&E’s business into OSI Systems is not as successful as expected; the failure to realize anticipated synergies and cost-savings; the failure of OSI Systems to achieve the expected financial and commercial results from the transaction; other business effects, including effects of industry, economic or political conditions outside either company’s control; transaction costs; actual or contingent liabilities; as well as other cautionary statements contained elsewhere herein and in the reports filed by OSI Systems with the Securities and Exchange Commission, including OSI Systems’ annual report for the year ended June 30, 2015 and subsequent quarterly reports. These forward-looking statements reflect OSI Systems’ expectations and projections as of the date of this presentation. OSI Systems undertakes no obligation to update the information provided herein to reflect any change in OSI Systems’ expectations or projections with regard thereto or any change in events, conditions or circumstances on which any such information is based.
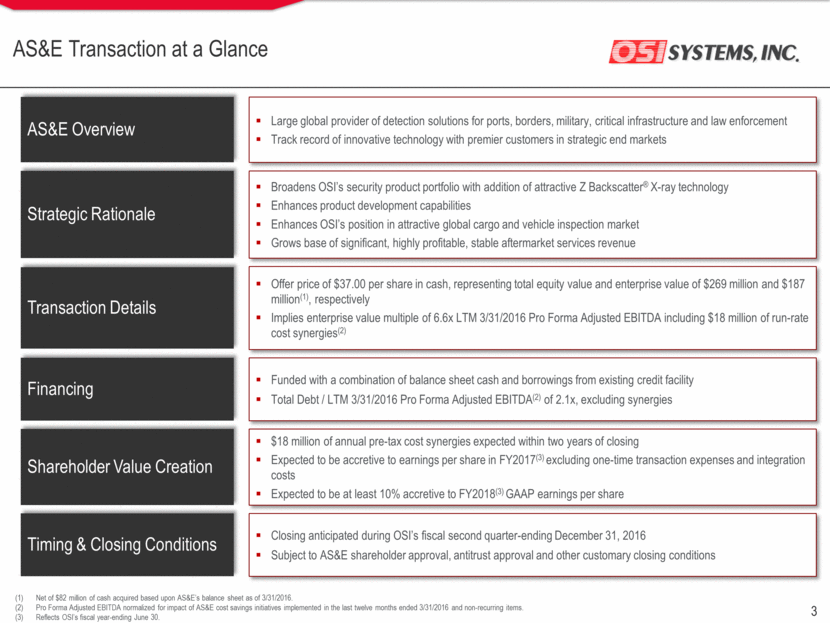
AS&E Transaction at a Glance AS&E Overview Large global provider of detection solutions for ports, borders, military, critical infrastructure and law enforcement Track record of innovative technology with premier customers in strategic end markets Strategic Rationale Broadens OSI’s security product portfolio with addition of attractive Z Backscatter® X-ray technology Enhances product development capabilities Enhances OSI’s position in attractive global cargo and vehicle inspection market Grows base of significant, highly profitable, stable aftermarket services revenue Transaction Details Offer price of $37.00 per share in cash, representing total equity value and enterprise value of $269 million and $187 million(1), respectively Implies enterprise value multiple of 6.6x LTM 3/31/2016 Pro Forma Adjusted EBITDA including $18 million of run-rate cost synergies(2) Shareholder Value Creation $18 million of annual pre-tax cost synergies expected within two years of closing Expected to be accretive to earnings per share in FY2017(3) excluding one-time transaction expenses and integration costs Expected to be at least 10% accretive to FY2018(3) GAAP earnings per share Net of $82 million of cash acquired based upon AS&E’s balance sheet as of 3/31/2016. Pro Forma Adjusted EBITDA normalized for impact of AS&E cost savings initiatives implemented in the last twelve months ended 3/31/2016 and non-recurring items. Reflects OSI’s fiscal year-ending June 30. Timing & Closing Conditions Closing anticipated during OSI’s fiscal second quarter-ending December 31, 2016 Subject to AS&E shareholder approval, antitrust approval and other customary closing conditions Financing Funded with a combination of balance sheet cash and borrowings from existing credit facility Total Debt / LTM 3/31/2016 Pro Forma Adjusted EBITDA(2) of 2.1x, excluding synergies
AS&E: Large Global Provider of X-Ray Detection Technology and Services Cutting edge detection technology with large installed base of advanced cargo, parcel and personnel inspection systems Protection of high-threat facilities, ports and borders against explosive devices, narcotics and weapons smuggling, human trafficking and trade fraud LTM 3/31/2016 Revenue: $103.0 million LTM 3/31/2016 Pro Forma Adj. EBITDA: $10.4 million(1) Significant Backlog Trusted provider of total security solutions for counter-terror and critical security challenges to premier customers in strategic global markets Significant and growing services platform leveraging exceptional customer satisfaction and domain expertise with new value added offerings Pro Forma Adjusted EBITDA normalized for impact of AS&E cost savings initiatives implemented in the last twelve months ended 3/31/2016 and non-recurring items.
Strategic Rationale The acquisition of AS&E enhances OSI’s Security platform with leading X-ray inspection technology and services for critical security end markets Broadens security product portfolio with addition of Z Backscatter® X-ray technology Product Offerings On Strategy Consistent with OSI’s expansion strategy in security and detection market R&D Enhances product development capabilities Scale Broadens position in attractive global cargo and vehicle inspection market Profitability Grows base of significant, highly-profitable aftermarket services revenue Synergy Cost synergies expected to generate attractive financial returns
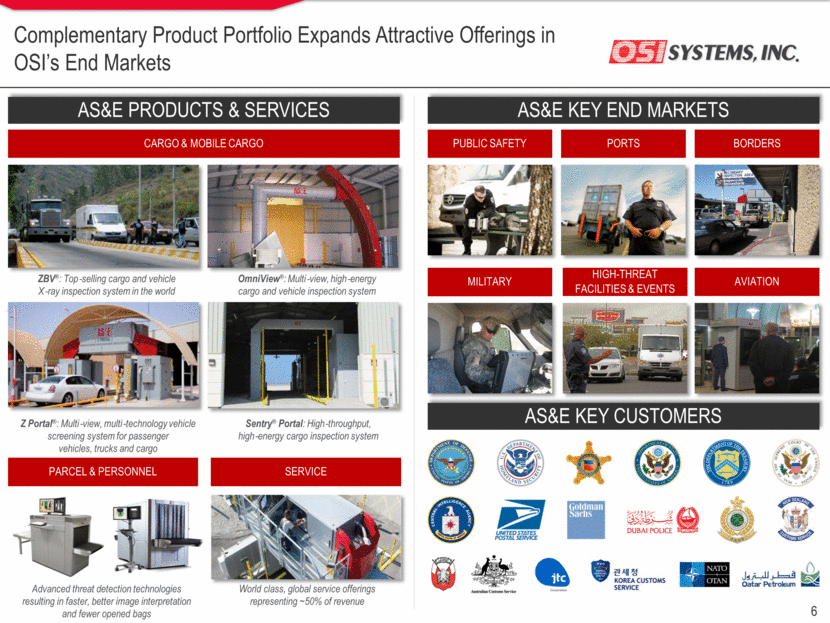
Complementary Product Portfolio Expands Attractive Offerings in OSI’s End Markets AS&E KEY END MARKETS AS&E KEY CUSTOMERS AS&E PRODUCTS & SERVICES CARGO & MOBILE CARGO PARCEL & PERSONNEL SERVICE Z Portal®: Multi-view, multi-technology vehicle screening system for passenger vehicles, trucks and cargo Sentry® Portal: High-throughput, high-energy cargo inspection system ZBV®: Top-selling cargo and vehicle X-ray inspection system in the world OmniView®: Multi-view, high-energy cargo and vehicle inspection system Advanced threat detection technologies resulting in faster, better image interpretation and fewer opened bags World class, global service offerings representing ~50% of revenue PUBLIC SAFETY PORTS BORDERS MILITARY HIGH-THREAT FACILITIES & EVENTS AVIATION
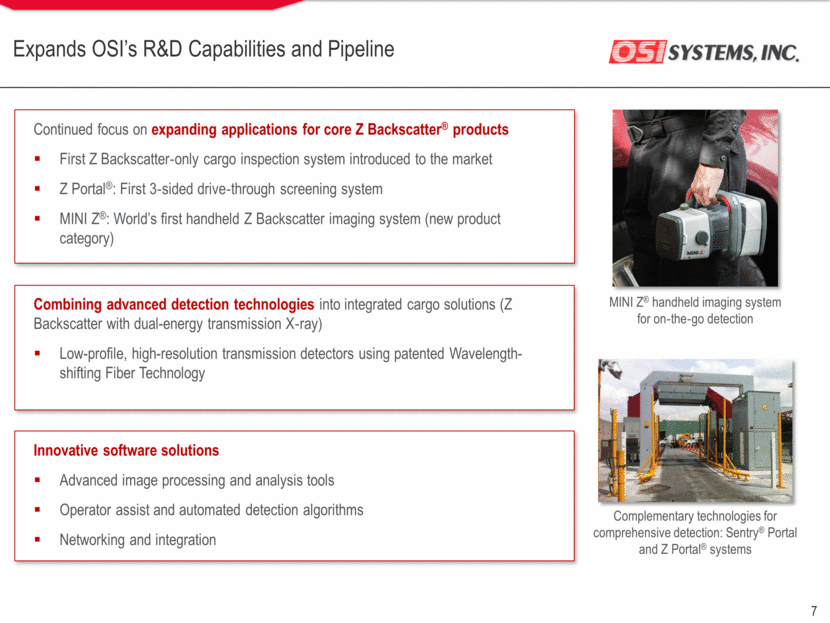
Expands OSI’s R&D Capabilities and Pipeline Continued focus on expanding applications for core Z Backscatter® products First Z Backscatter-only cargo inspection system introduced to the market Z Portal®: First 3-sided drive-through screening system MINI Z®: World’s first handheld Z Backscatter imaging system (new product category) MINI Z® handheld imaging system for on-the-go detection Complementary technologies for comprehensive detection: Sentry® Portal and Z Portal® systems Combining advanced detection technologies into integrated cargo solutions (Z Backscatter with dual-energy transmission X-ray) Low-profile, high-resolution transmission detectors using patented Wavelength-shifting Fiber Technology Innovative software solutions Advanced image processing and analysis tools Operator assist and automated detection algorithms Networking and integration
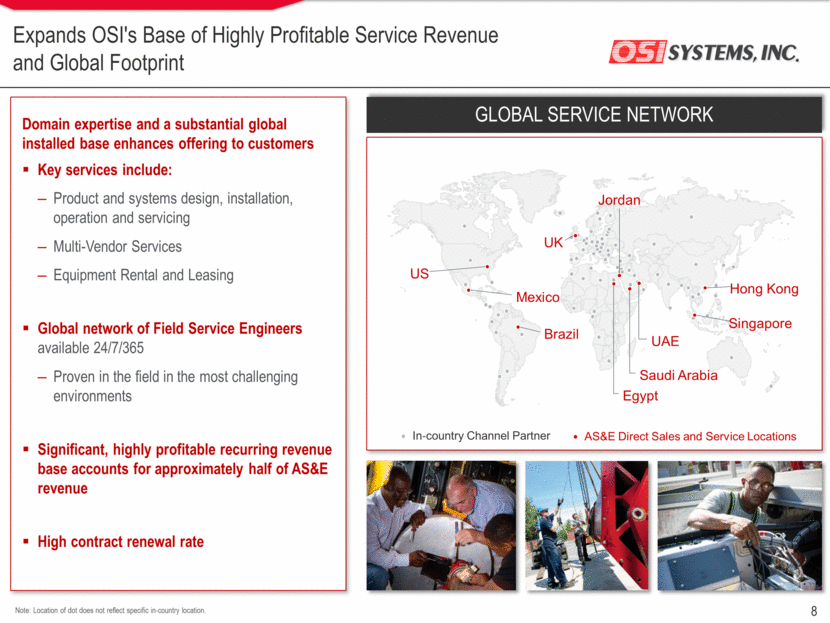
Expands OSI's Base of Highly Profitable Service Revenue and Global Footprint Note: Location of dot does not reflect specific in-country location. Domain expertise and a substantial global installed base enhances offering to customers Key services include: Product and systems design, installation, operation and servicing Multi-Vendor Services Equipment Rental and Leasing Global network of Field Service Engineers available 24/7/365 Proven in the field in the most challenging environments Significant, highly profitable recurring revenue base accounts for approximately half of AS&E revenue High contract renewal rate US Mexico Brazil Egypt Saudi Arabia UK Jordan Hong Kong Singapore UAE AS&E Direct Sales and Service Locations In-country Channel Partner GLOBAL SERVICE NETWORK
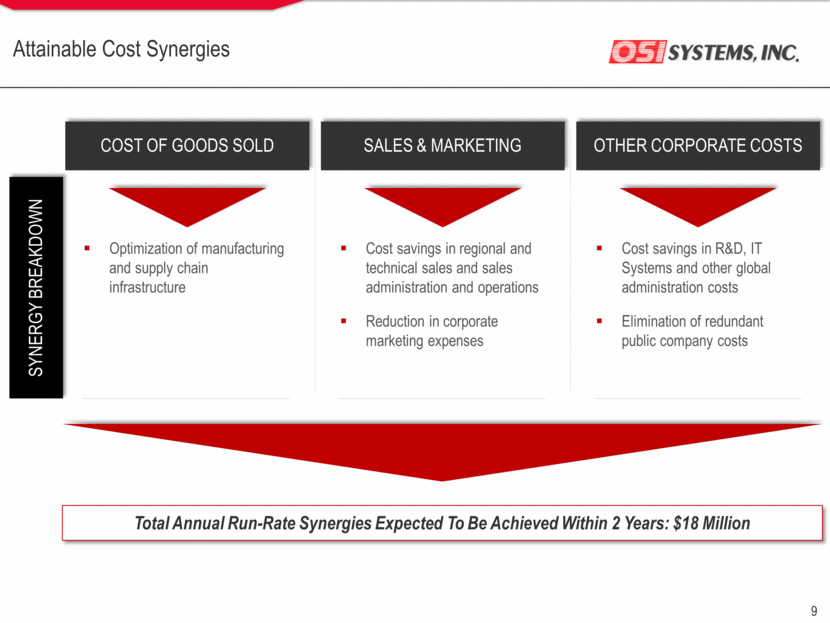
Attainable Cost Synergies COST OF GOODS SOLD SALES & MARKETING OTHER CORPORATE COSTS SYNERGY BREAKDOWN Optimization of manufacturing and supply chain infrastructure Cost savings in regional and technical sales and sales administration and operations Reduction in corporate marketing expenses Cost savings in R&D, IT Systems and other global administration costs Elimination of redundant public company costs Total Annual Run-Rate Synergies Expected To Be Achieved Within 2 Years: $18 Million
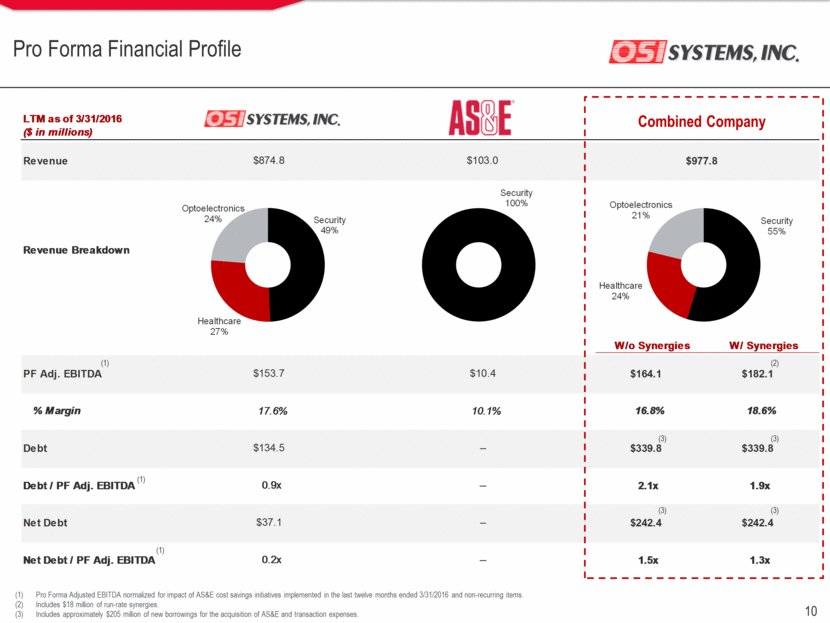
Pro Forma Financial Profile (2) Pro Forma Adjusted EBITDA normalized for impact of AS&E cost savings initiatives implemented in the last twelve months ended 3/31/2016 and non-recurring items. Includes $18 million of run-rate synergies. Includes approximately $205 million of new borrowings for the acquisition of AS&E and transaction expenses. Combined Company (1) (1) (1) (3) (3) (3) (3) LTM as of 3/31/2016 ($ in millions) Revenue $874.8 $103.0 Revenue Breakdown W/o Synergies W/ Synergies PF Adj. EBITDA $153.7 $10.4 $164.1 $182.1 % Margin 17.6% 10.1% 16.8% 18.6% Debt $134.5 -- $339.8 $339.8 Debt / PF Adj. EBITDA 0.9x -- 2.1x 1.9x Net Debt $37.1 -- $242.4 $242.4 Net Debt / PF Adj. EBITDA 0.2x -- 1.5x 1.3x $977.8 Security 49% Healthcare 27% Optoelectronics 24% Security 100% Security 55% Healthcare 24% Optoelectronics 21%
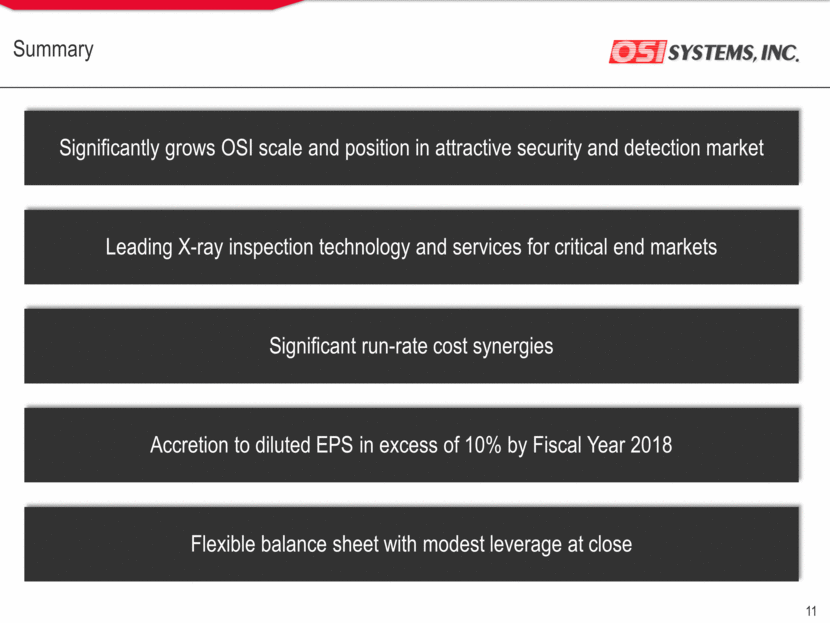
Summary Leading X-ray inspection technology and services for critical end markets Accretion to diluted EPS in excess of 10% by Fiscal Year 2018 Significant run-rate cost synergies Flexible balance sheet with modest leverage at close Significantly grows OSI scale and position in attractive security and detection market
Appendix
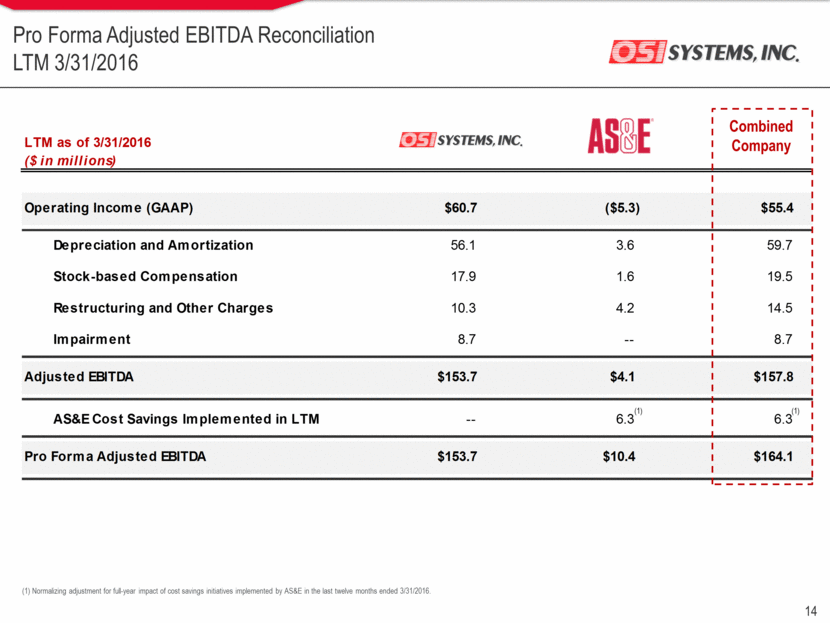
Non-GAAP Measures This presentation includes references to adjusted EBITDA and non-GAAP diluted earnings per share, both of which are non-GAAP financial measures. Adjusted EBITDA is defined as net income, plus net interest and other expense, provision for income taxes, and depreciation and amortization, as further adjusted to eliminate the impact of stock-based compensation, and impairment, restructuring and other charges. Not all companies use identical calculations and, accordingly, OSI Systems’ calculation of adjusted EBITDA may not be comparable to similarly titled measures of other companies. Adjusted EBITDA is not a recognized term under accounting principles generally accepted in the United States (GAAP) and does not purport to be a substitute for net income as an indicator of operating performance or cash flows from operating activities as a measure of liquidity. OSI Systems uses adjusted EBITDA to evaluate the effectiveness of OSI Systems’ business strategies and because OSI Systems’ credit agreement uses measures similar to adjusted EBITDA to measure compliance with certain covenants. Non-GAAP diluted earnings per share excludes the impact of impairment, restructuring and other charges, net of tax. OSI Systems believes that the inclusion of non-GAAP diluted earnings per share figures and adjusted EBITDA provides additional insight into the operations of OSI Systems. Non-GAAP financial measures should not be considered in isolation or as a substitute for measures of financial performance prepared in accordance with GAAP. OSI Systems also believes that these non-GAAP financial measures provide meaningful supplemental information because they exclude amounts that it does not view as reflective of ongoing operating results when planning and forecasting and when assessing the performance of OSI Systems’ business.
Pro Forma Adjusted EBITDA Reconciliation LTM 3/31/2016 (1) Normalizing adjustment for full-year impact of cost savings initiatives implemented by AS&E in the last twelve months ended 3/31/2016. Combined Company (1) (1) LTM as of 3/31/2016 ($ in millions) Operating Income (GAAP) $60.7 ($5.3) $55.4 Depreciation and Amortization 56.1 3.6 59.7 Stock-based Compensation 17.9 1.6 19.5 Restructuring and Other Charges 10.3 4.2 14.5 Impairment 8.7 -- 8.7 Adjusted EBITDA $153.7 $4.1 $157.8 AS&E Cost Savings Implemented in LTM -- 6.3 6.3 Pro Forma Adjusted EBITDA $153.7 $10.4 $164.1
