Attached files
| file | filename |
|---|---|
| EX-99.1 - EX-99.1 - HP INC | a16-13753_1ex99d1.htm |
| 8-K - 8-K - HP INC | a16-13753_18k.htm |
Exhibit 99.2
HP Inc. Printing Update June 21, 2016 http://www.hp.com/investor/home 1 © Copyright 2015 HP Development Company, L.P. The information contained herein is subject to change without notice.

Forward-looking statements 2 © Copyright 2015 HP Development Company, L.P. The information contained herein is subject to change without notice. This presentation contains forward-looking statements that involve risks, uncertainties and assumptions. If the risks or uncertainties ever materialize or the assumptions prove incorrect, the results of HP Inc. and its consolidated subsidiaries (“HP”) may differ materially from those expressed or implied by such forward-looking statements and assumptions. All statements other than statements of historical fact are statements that could be deemed forward-looking statements, including but not limited to any projections of net revenue, margins, expenses, effective tax rates, net earnings, net earnings per share (“EPS”), cash flows, currency exchange rates or other financial items; any projections of the amount, timing or impact of cost savings or restructuring charges; any statements of the plans, strategies and objectives of management for future operations, including the execution of the restructuring plans and any resulting cost savings, revenue or profitability improvements; any statements concerning the expected development, performance, market share or competitive performance relating to products or services; any statements regarding current or future macroeconomic trends or events and the impact of those trends and events on HP and its financial performance; any statements regarding pending investigations, claims or disputes; any statements of expectation or belief; and any statements of assumptions underlying any of the foregoing. Risks, uncertainties and assumptions include the need to address the many challenges facing HP’s businesses; the competitive pressures faced by HP’s businesses; risks associated with executing HP’s strategy; the impact of macroeconomic and geopolitical trends and events; the need to manage third-party suppliers and the distribution of HP’s products and the delivery of HP’s services effectively; the protection of HP’s intellectual property assets, including intellectual property licensed from third parties; risks associated with HP’s international operations; the development and transition of new products and services and the enhancement of existing products and services to meet customer needs and respond to emerging technological trends; the execution and performance of contracts by HP and its suppliers, customers, clients and partners; the hiring and retention of key employees; integration and other risks associated with business combination and investment transactions; the results of the restructuring plans, including estimates and assumptions related to the cost (including any possible disruption of HP’s business) and the anticipated benefits of the restructuring plans; the resolution of pending investigations, claims and disputes; and other risks that are described in HP’s Annual Report on Form 10-K for the fiscal year ended October 31, 2015, HP's Quarterly Report on Form 10-Q for its fiscal quarter ended April 30, 2016 and HP’s other filings with the Securities and Exchange Commission. As in prior periods, the financial information set forth in this presentation, including any tax-related items, reflects estimates based on information available at this time. These amounts could differ materially from the amounts that will ultimately be reported in HP’s Quarterly Report on Form 10-Q for the fiscal quarter ending July 31, 2016 and Form 10-K for the fiscal year ending October 31, 2016. HP assumes no obligation and does not intend to update these forward-looking statements. HP’s Investor Relations website at http://www.hp.com/investor/home contains a significant amount of information about HP, including financial and other information for investors. HP encourages investors to visit its website from time to time, as information is updated and new information is posted.

Use of non-GAAP financial information 3 © Copyright 2015 HP Development Company, L.P. The information contained herein is subject to change without notice. HP has included non-GAAP financial measures in this presentation to supplement HP’s consolidated financial statements presented on a GAAP basis. Definitions of these non-GAAP financial measures and reconciliations of these non-GAAP financial measures, to the most directly comparable GAAP financial measures are included elsewhere in this presentation. HP’s management uses net revenue on a constant currency basis and non-GAAP diluted net earnings per share from continuing operations to evaluate and forecast HP’s performance before gains, losses or other charges that are considered by HP’s management to be outside of HP’s core business segment operating results. Free cash flow is a liquidity measure that provides useful information to management about the amount of cash available for investment in HP’s businesses, funding acquisitions, repurchasing stock and other purposes. These non-GAAP financial measures may have limitations as analytical tools, and these measures should not be considered in isolation or as a substitute for analysis of HP’s results as reported under GAAP. For example, items such as amortization of intangible assets, though not directly affecting HP’s cash position, represent the loss in value of intangible assets over time. The expense associated with this change in value is not included in non-GAAP diluted net earnings per share from continuing operations and therefore does not reflect the full economic effect of the change in value of those intangible assets. In addition, items such as restructuring charges, defined benefit plan settlement charges, non-operating retirement-related credits/charges and tax indemnifications that are excluded from non-GAAP diluted net earnings per share from continuing operations can have a material impact on the equivalent GAAP earnings measure and cash flow. Free cash flow, which includes net capital expenditures, does not represent the total increase or decrease in cash for the period. The non-GAAP financial information that we provide also may differ from the non-GAAP information provided by other companies. We compensate for the limitations on our use of these non-GAAP financial measures by relying primarily on our GAAP financial statements and using non-GAAP financial measures only supplementally. We also provide robust and detailed reconciliations of each non-GAAP financial measure to the most directly comparable GAAP measure, and we encourage investors to review those reconciliations carefully. We believe that providing these non-GAAP financial measures in addition to the related GAAP measures provides investors with greater transparency to the information used by HP’s management in its financial and operational decision-making and allows investors to see HP’s results “through the eyes” of management. We further believe that providing this information better enables investors to understand HP’s operating performance and financial condition and to evaluate the efficacy of the methodology and information used by HP’s management to evaluate and measure such performance and financial condition. HP’s Investor Relations website at http://www.hp.com/investor/home contains a significant amount of information about HP, including financial and other information for investors. HP encourages investors to visit its website from time to time, as information is updated and new information is posted.

Highlights 4 © Copyright 2015 HP Development Company, L.P. The information contained herein is subject to change without notice. A description and reconciliation of adjustments to GAAP results is included on slide 5 of this presentation. A description of HP’s use of non-GAAP information is provided on slide 3 under “Use of non-GAAP financial information” Gains from sale of Marketing Optimization assets, announced on June 21th, of approximately $245 million in Q316 and $40 million in Q416, to be re-invested into the Printing business to reduce supplies channel inventory and to increase marketing Supplies net revenue impact estimate of ($250 million) in Q316 and ($260 million) in Q416 in reported currency Payback period on investment estimated to be 3 years Supplies net revenue in constant currency(1) remains on track to stabilize by end of 2017, even without these investments Full year fiscal 2016 non-GAAP and GAAP diluted net earnings per share from continuing operations(1) remains unchanged Free cash flow(1) expected to be within the updated range of $2.0 to $2.3 billion

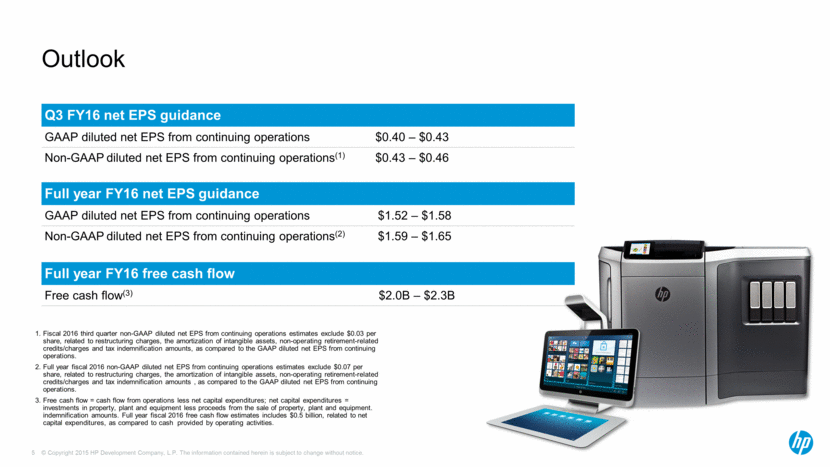
Outlook 5 Fiscal 2016 third quarter non-GAAP diluted net EPS from continuing operations estimates exclude $0.03 per share, related to restructuring charges, the amortization of intangible assets, non-operating retirement-related credits/charges and tax indemnification amounts, as compared to the GAAP diluted net EPS from continuing operations. Full year fiscal 2016 non-GAAP diluted net EPS from continuing operations estimates exclude $0.07 per share, related to restructuring charges, the amortization of intangible assets, non-operating retirement-related credits/charges and tax indemnification amounts , as compared to the GAAP diluted net EPS from continuing operations. Free cash flow = cash flow from operations less net capital expenditures; net capital expenditures = investments in property, plant and equipment less proceeds from the sale of property, plant and equipment. indemnification amounts. Full year fiscal 2016 free cash flow estimates includes $0.5 billion, related to net capital expenditures, as compared to cash provided by operating activities. Q3 FY16 net EPS guidance GAAP diluted net EPS from continuing operations $0.40 – $0.43 Non-GAAP diluted net EPS from continuing operations(1) $0.43 – $0.46 Full year FY16 net EPS guidance GAAP diluted net EPS from continuing operations $1.52 – $1.58 Non-GAAP diluted net EPS from continuing operations(2) $1.59 – $1.65 Full year FY16 free cash flow Free cash flow(3) $2.0B – $2.3B © Copyright 2015 HP Development Company, L.P. The information contained herein is subject to change without notice.

Thank you 6 © Copyright 2015 HP Development Company, L.P. The information contained herein is subject to change without notice.

