Attached files
| file | filename |
|---|---|
| 8-K - CHINA FUND INC | fp0019996_8k.htm |

Data as of 5/31/16
Manager’s Commentary
Market Review
There was increased profit taking and stock rotation in May after the gains in March and April. Previously weak sectors, including technology and health care, rallied, while more cyclical sectors, such as materials and energy, pulled back. Chinese equities quickly weakened at the beginning of May, on concerns that the improvement in recent economic data releases was not sustainable. Towards the end of the month, the equity markets regained momentum as a result of stronger US economic data and resilient oil prices.
Taiwan equities also enjoyed a rally during the month which was driven by technology stocks. There was a recovery in component orders for companies in the Apple supply chain ahead of the iPhone 7 launch. Taiwan's new President, Tsai Ing-wen, was inaugurated during the month. Fears that Taiwan's relationship with China would deteriorate have been unfounded in the short term, which has led to a degree of relief in the capital markets.
Fund Review
During the month, the Fund's Net Asset Value ("NAV”) return underperformed the MSCI Golden Dragon Index (the "Benchmark Index”). Stock selection in the financials sector, in particular mid-sized Chinese banks, detracted from performance. This was partly offset by strong stock selection in the information technology sector.
The top detractor during the month was Li & Fung Ltd., one of the world's largest sourcing companies with a global network and customer base. With almost 80% of its revenue coming from the United States and Europe, the company is sensitive to retail demand in developed markets. While we do not expect a strong recovery from developed markets, we believe the current valuation has already priced in the challenging outlook. As one of the largest sourcing suppliers, with a good track record of gaining clients, the company's business model and market positioning is difficult to replicate. As the stock is trading at 10x PE, and has a dividend yield of 7%, we expect the low valuation to provide a floor for the share price.
After a pullback in April, Digital China Holdings Ltd., a small-cap Chinese technology service provider, rebounded strongly in May and was the Fund's top contributor. We believe that the previous correction was overdone as investors took profits after the payment of a special dividend from the sale of its low margin IT distribution business. Now the company is shifting its focus towards higher value added IT services businesses such as cloud, big data, agricultural IT, and smart city initiatives. We believe this business transition will add significant value, but will also take time, so patience is required before the market reflects the long-term growth potential.
Key Transactions
Within the technology sector, we exited Baidu, Inc. due to concerns about the impact of the government's investigation into this company, and increased our existing exposure to Alibaba Group Holding Ltd. The potential for tighter regulation regarding Baidu's core advertising business is likely to be an overhang for its share price. We therefore chose to switch our Baidu exposure to Alibaba, which we like for its accelerating revenue growth from e-commerce and improving investor disclosure, which we believe will improve sentiment.
Outlook
As we have mentioned in earlier reports, the overall economic outlook in China will remain challenging as the Chinese government has to strike a delicate balance between keeping reforms on track and setting a floor for economic growth. We believe the risk of a systematic collapse is low and that following the market declines earlier in 2016, there are a number of stocks that offer good long-term opportunities.
We remain positive on China's technological transformation. The rise of e-commerce, for example, has been accelerating and also encompasses other areas, such as strong demand for mobile data. We prefer internet companies with diversified sources of revenue, as well as telecom service providers that see improving free cash flow as 4G CAPEX spending starts to decline. Another long-term theme is China's manufacturing upgrade. With the improvement of technology and product quality, Chinese companies are becoming competitive on a global scale and gaining market share from overseas competitors, particularly in the industrial and information technology sectors.
We believe the Greater China equity space will continue to be a market for stock pickers. We will utilize the market volatility to our advantage, adding to stocks that have overcorrected but still have good structural growth potential. One example is our recent addition of Brilliance China Automotive Holdings Ltd., an automotive company that has a joint venture in China with BMW, after price weakness year-to-date. Its high-end product positioning, strong model pipeline, and high quality management team with a proven execution track record, should help the company gain market share in coming years.
|
In Brief
|
|
|
Fund Data
|
|
|
Description
|
Seeks to achieve longterm capital appreciation through investments in China companies.
|
|
Listing Date (NYSE)
|
July 10, 1992
|
|
Total Fund Assets (millions)
|
$259.7
|
|
Median Market Cap (in billions)
|
$6.6
|
|
Distribution Frequency
|
Annual
|
|
Management Firm
|
Allianz Global Investors U.S. LLC
|
|
Portfolio Management
|
Christina Chung, CFA, CMA Lead Portfolio Manager
|
|
Performance (US$ Returns)
(as of 5/31/16)
|
||
| Fund | Benchmark1 | |
|
One Month
|
-1.14%
|
-0.14%
|
|
Three Month
|
6.58%
|
8.92%
|
|
One Year
|
-28.33%
|
-21.94%
|
|
Three Year
|
1.15%
|
1.72%
|
|
Net Asset Value / Market Price
|
|
|
Net Asset Value / (NAV) Market Price at Inception
|
$13.15 / $14.26
|
|
NAV / Market Price (as of 5/31/16)
|
$16.52 / $14.30
|
|
High / Low Ranges (52-Week)
|
|
|
High / Low NAV
|
$25.59 / $14.65
|
|
High / Low Market Price
|
$21.89 / $12.85
|
|
Premium/Discount to NAV (as of 5/31/16)
|
-13.44%
|
|
Fund Data (Common Shares)
|
|
|
Shares Outstanding
|
15,722,675
|
|
Average Daily Volume
|
39,194
|
|
Expense Ratio
|
1.34%
|
Fund Manager

Christina Chung, CFA, CMA
Lead Portfolio Manager
|
1
|
MSCI Golden Dragon Index.
|

The China Fund, Inc.
Investment Objective
The investment objective of the Fund is to achieve long-term capital appreciation. The Fund seeks to achieve its objective through investment in the equity securities of companies and other entities with significant assets, investments, production activities, trading or other business interests in China or which derive a significant part of their revenue from China.
The Fund has an operating policy that the Fund will invest at least 80% of its assets in China companies. For this purpose, 'China companies' are (i) companies for which the principal securities trading market is in China; (ii) companies for which the principal securities trading market is outside of China or in companies organized outside of China, that in both cases derive at least 50% of their revenues from goods or services sold or produced, or have a least 50% of their assets in China; or (iii) companies organized in China. Under the policy, China means the People's Republic of China, including Hong Kong, and Taiwan. The Fund will provide its stockholders with at least 60 days' prior notice of any change to this policy.
|
Returns For Periods Ending May 31, 2016*
|
||||||||
|
1 Month
|
3 Month
|
YTD
|
1 Year
|
3 Year
|
5 Year
|
10 Year
|
Inception | |
|
NAV
|
-1.14%
|
6.58%
|
-6.98%
|
-28.33%
|
1.15%
|
-0.35%
|
9.49%
|
9.67%
|
|
Market Price
|
-1.65%
|
6.24%
|
-7.86%
|
-27.33%
|
1.16%
|
-1.07%
|
7.85%
|
8.64%
|
|
MSCI Golden Dragon Index
|
-0.14%
|
8.92%
|
-2.23%
|
-21.94%
|
1.72%
|
0.38%
|
5.93%
|
—
|
|
Calendar Year Returns
|
||||||||
|
2008
|
2009
|
2010
|
2011
|
2012
|
2013
|
2014
|
2015
|
|
|
NAV
|
-46.95%
|
72.83%
|
27.26%
|
-24.37%
|
12.12%
|
18.31%
|
7.82%
|
-5.51%
|
|
Market Price
|
-40.65%
|
72.19%
|
23.60%
|
-27.51%
|
20.52%
|
12.70%
|
5.29%
|
-6.38%
|
|
MSCI Golden Dragon Index
|
-49.37%
|
67.12%
|
13.60%
|
-18.35%
|
22.65%
|
7.25%
|
8.06%
|
-7.12%
|
Past performance is not a guide to future returns.
*Annualized for periods greater than one year.
Source: State Street Bank and Trust Company. Source for index data: MSCI as at May 31,2016. Investment returns are historical and do not guarantee future results. Investment returns reflect changes in net asset value and market price per share during each period and assumes that dividends and capital gains distributions, if any, were reinvested. The net asset value (NAV) percentages are not an indication of the performance of a shareholder's investment in the Fund, which is based on market price. NAV performance includes the deduction of management fees and other expenses. Market price performance does not include the deduction of brokerage commissions and other expenses of trading shares and would be lower had such commissions and expenses been deducted. It is not possible to invest directly in an index.
Premium/Discount

|
Sector Allocation
|
||
|
Fund
|
Benchmark1
|
|
|
Information Technology
|
30.51%
|
31.13%
|
|
Financials
|
23.63%
|
33.14%
|
|
Industrials
|
17.57%
|
6.87%
|
|
Consumer Discretionary
|
11.31%
|
7.57%
|
|
Telecom Services
|
6.05%
|
6.46%
|
|
Energy
|
3.12%
|
3.77%
|
|
Consumer Staples
|
1.87%
|
2.39%
|
|
Health Care
|
1.45%
|
1.27%
|
|
Materials
|
0.26%
|
2.88%
|
|
Utilities
|
0.00%
|
4.51%
|
|
Other assets & liabilities
|
4.22%
|
0.00%
|
Source: IDS GmbH - Analysis and Reporting Services, a subsidiary of Allianz SE.
|
Country Allocation
|
||
|
Fund
|
Benchmark1
|
|
|
China
|
74.94%
|
75.61%
|
|
Hong Kong Red Chips
|
31.88%
|
10.51%
|
|
Hong Kong 'H' shares
|
11.74%
|
21.12%
|
|
Equity linked securities ('A' shares)
|
1.90%
|
0.00%
|
|
China 'A' & 'B' shares
|
0.00%
|
0.15%
|
|
Other Hong Kong securities
|
29.42%
|
31.16%
|
|
Others
|
0.00%
|
12.66%
|
|
Taiwan
|
20.84%
|
24.39%
|
|
Other assets & liabilities
|
4.22%
|
0.00%
|
|
Top 10 Holdings
|
|
|
TAIWAN SEMIC CO LTD (Taiwan)
|
8.23%
|
|
TENCENT HOLDINGS LTD (China)
|
6.47%
|
|
CK HUTCHISON HOLDINGS LTD (H.K.)
|
4.74%
|
|
SUN HUNG KAI PROPERTIES LTD (H.K.)
|
4.61%
|
|
HONG KONG EXCHANGES AND CLEARING LTD (H.K.)
|
4.39%
|
|
CHINA OVERSEAS LAND & INV (China)
|
4.26%
|
|
CHINA MERCHANTS BANK CO LTD (China)
|
3.72%
|
|
QINGLING MOTORS CO LTD (China)
|
3.66%
|
|
ALIBABA GROUP HOLDING LTD (China)
|
3.62%
|
|
CHINA MOBILE LTD (China)
|
3.52%
|
|
Portfolio Characteristics
|
||
|
Fund
|
Benchmark1
|
|
|
P/E Ratio
|
13.06
|
11.97
|
|
P/B Ratio
|
1.44
|
1.25
|
|
Issues in Portfolio
|
39
|
284
|
|
Foreign Holdings (%)
|
95.78
|
100.00
|
|
Other assets & liabilities (%)
|
4.22
|
0.00
|
|
Yield (%)
|
2.99
|
2.96
|
1. MSCI Golden Dragon Index.
The China Fund, Inc.
Distribution History (10 Year)
|
Declaration Date
|
Ex-dividend Date
|
Record Date
|
Payable Date
|
Distribution/
Share
|
Income
|
Long-term
Capital Gain |
Short-term
Capital Gain |
|
12/8/06
|
12/19/06
|
12/21/06
|
12/29/06
|
$4.01170
|
$0.29960
|
$2.73090
|
$0.98120
|
|
12/7/07
|
12/19/07
|
12/21/07
|
1/25/08
|
$12.12000
|
$0.28000
|
$9.00000
|
$2.84000
|
|
12/8/08
|
12/22/08
|
12/24/08
|
1/23/09
|
$5.81740
|
$0.48130
|
$5.33610
|
—
|
|
12/9/09
|
12/22/09
|
12/24/09
|
12/29/09
|
$0.25570
|
$0.25570
|
—
|
—
|
|
12/8/10
|
12/21/10
|
12/24/10
|
12/29/10
|
$2.27420
|
$0.37460
|
$1.89960
|
—
|
|
12/8/11
|
12/21/11
|
12/23/11
|
12/29/11
|
$2.99640
|
$0.17420
|
$2.82220
|
—
|
|
12/10/12
|
12/20/12
|
12/24/12
|
12/28/12
|
$3.25170
|
$0.34730
|
$2.90440
|
—
|
|
12/13/13
|
12/19/13
|
12/23/13
|
12/27/13
|
$3.31400
|
$0.43870
|
$2.87530
|
—
|
|
12/8/14
|
12/18/14
|
12/22/14
|
1/5/15
|
$3.76510
|
$0.29820
|
$3.46690
|
—
|
|
12/16/15
|
12/23/15
|
12/28/15
|
1/6/16
|
$1.49580
|
$0.21330
|
$0.84620
|
$0.43630
|
Distribution/Share includes Income, Long-term Capital gains and Short-term Capital gains.
The China Fund NAV Performance of $10,000 since inception
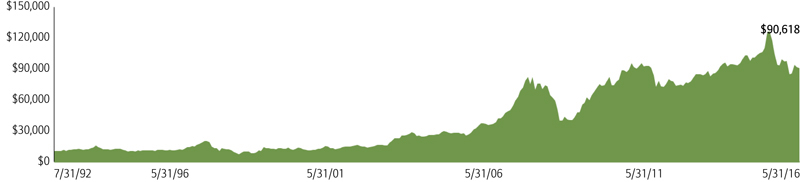
Past performance is not a guide to future returns.
Index Description
MSCI Golden Dragon Index
The MSCI Golden Dragon Index captures the equity market performance of large and mid cap China securities (H shares, B shares, Red-Chips and P-Chips) and non-domestic China securities listed in Hong Kong and Taiwan.
It is not possible to invest directly in an index.
The China Fund, Inc.
|
Portfolio in Full
|
|||||
|
Sector
|
Company
(exchange ticker)
|
Market Price
|
Holding
|
Value US$
|
% of
net assets
|
|
Information Technology
|
30.47
|
||||
|
TAIWAN SEMICONDUCTOR MANUFACTURING CO LTD
|
2330
|
156.50
|
4,461,000
|
21,407,328
|
8.23
|
|
TENCENT HOLDINGS LTD
|
700
|
172.60
|
757,500
|
16,829,108
|
6.47
|
|
ALIBABA GROUP HOLDING LTD
|
BABA
|
82.00
|
114,718
|
9,406,876
|
3.62
|
|
DELTA ELECTRONICS INC
|
2308
|
150.00
|
1,680,359
|
7,728,750
|
2.97
|
|
DIGITAL CHINA HOLDINGS LTD
|
861
|
6.40
|
9,360,000
|
7,710,695
|
2.96
|
|
ADVANTECH CO LTD
|
2395
|
241.00
|
798,841
|
5,903,279
|
2.27
|
|
SEMICONDUCTOR MANUFACTURING INTERNATIONAL CORP
|
981
|
0.65
|
56,362,000
|
4,715,605
|
1.81
|
|
LARGAN PRECISION CO LTD
|
3008
|
2,720.00
|
41,000
|
3,419,548
|
1.31
|
|
GOLDPAC GROUP LTD
|
3315
|
3.04
|
5,521,000
|
2,160,374
|
0.83
|
|
Financials
|
23.59
|
||||
|
SUN HUNG KAI PROPERTIES LTD
|
16
|
91.20
|
1,022,000
|
11,997,297
|
4.61
|
|
HONG KONG EXCHANGES AND CLEARING LTD
|
388
|
185.70
|
477,900
|
11,423,169
|
4.39
|
|
CHINA OVERSEAS LAND & INVESTMENT LTD
|
688
|
23.30
|
3,698,000
|
11,090,739
|
4.26
|
|
CHINA MERCHANTS BANK CO LTD
|
3968
|
15.90
|
4,731,500
|
9,683,529
|
3.72
|
|
PING AN INSURANCE GROUP CO OF CHINA LTD
|
2318
|
34.75
|
1,819,500
|
8,138,503
|
3.13
|
|
FUBON FINANCIAL HOLDING CO LTD
|
2881
|
38.50
|
4,270,000
|
5,040,859
|
1.94
|
|
CATHAY FINANCIAL HOLDING CO LTD
|
2882
|
37.70
|
3,462,000
|
4,002,067
|
1.54
|
|
Industrials
|
17.49
|
||||
|
CK HUTCHISON HOLDINGS LTD
|
1
|
90.05
|
1,064,000
|
12,332,838
|
4.74
|
|
ZHUZHOU CRRC TIMES ELECTRIC CO LTD
|
3898
|
43.35
|
1,468,000
|
8,191,300
|
3.15
|
|
CHINA EVERBRIGHT INTERNATIONAL LTD
|
257
|
8.30
|
7,256,000
|
7,751,987
|
2.98
|
|
BEIJING ENTERPRISES HOLDINGS LTD
|
392
|
40.35
|
1,182,500
|
6,141,612
|
2.36
|
|
QINGDAO PORT INTERNATIONAL CO LTD
|
6198
|
3.73
|
6,596,000
|
3,166,848
|
1.22
|
|
ZHENGZHOU YUTONG BUS CO A
|
600066
|
19.60
|
910,530
|
2,710,158
|
1.04
|
|
CN STATE CONSTRUCTION INTERNATIONAL HOLDINGS LTD
|
3311
|
9.88
|
2,110,000
|
2,683,348
|
1.03
|
|
KING SLIDE WORKS CO LTD
|
2059
|
345.00
|
239,000
|
2,528,325
|
0.97
|
|
Consumer Discretionary
|
11.31
|
||||
|
QINGLING MOTORS CO LTD
|
1122
|
2.55
|
28,960,000
|
9,505,532
|
3.66
|
|
SANDS CHINA LTD
|
1928
|
29.70
|
1,634,800
|
6,249,694
|
2.40
|
|
LI & FUNG LTD
|
494
|
3.95
|
9,798,000
|
4,981,638
|
1.92
|
|
CITIGROUP GLOBAL MARKETS HOLD (exch. for CHINA CYTS TOURS HOLDIN)
|
N/A
|
3.02
|
1,635,575
|
4,939,437
|
1.90
|
|
BRILLIANCE CHINA AUTOMOTIVE HOLDINGS LTD
|
1114
|
7.52
|
2,224,000
|
2,152,734
|
0.83
|
|
TUNG THIH ELECTRONIC CO LTD
|
3552
|
456.00
|
111,000
|
1,552,043
|
0.60
|
|
Telecom Services
|
6.06
|
||||
|
CHINA MOBILE LTD
|
941
|
88.70
|
801,000
|
9,145,213
|
3.52
|
|
CHINA UNICOM HONG KONG LTD
|
762
|
8.37
|
3,762,000
|
4,053,050
|
1.56
|
|
CHUNGHWA TELECOM CO LTD
|
2412
|
110.00
|
755,000
|
2,546,570
|
0.98
|
|
Energy
|
3.11
|
||||
|
CNOOC LTD
|
883
|
9.27
|
6,788,000
|
8,099,519
|
3.11
|
|
Consumer Staples
|
1.87
|
||||
|
WANT WANT CHINA HOLDINGS LTD
|
151
|
5.49
|
4,418,000
|
3,122,020
|
1.20
|
|
VINDA INTERNATIONAL HOLDINGS LTD
|
3331
|
13.72
|
984,000
|
1,737,748
|
0.67
|
|
Health Care
|
1.45
|
||||
|
CSPC PHARMACEUTICAL GROUP LTD
|
1093
|
7.07
|
2,892,000
|
2,631,815
|
1.01
|
|
3SBIO INC
|
1530
|
7.70
|
1,156,000
|
1,145,740
|
0.44
|
|
Materials
|
0.26
|
||||
|
TIANGONG INTERNATIONAL CO LTD
|
826
|
0.48
|
11,240,000
|
687,223
|
0.26
|
Source: State Street Bank and Trust Company, IDS GmbH - Analysis and Reporting Services, a subsidiary of Allianz SE.
The China Fund, Inc.
Important Information:
Holdings are subject to change daily. The Fund seeks to achieve its objective through investment in the equity securities of companies and other entities with significant assets, investments, production activities, trading or other business interests in China or which derive a significant part of their revenue from China. Investing in non-U.S. securities entails additional risks, including political and economic risk and the risk of currency fluctuations, as well as lower liquidity. These risks, which can result in greater price volatility, will generally be enhanced in less diversified funds that concentrate investments in a particular geographic region.
The information contained herein has been obtained from sources believed to be reliable but Allianz Global Investors U.S. LLC and its affiliates do not warrant the information to be accurate, complete or reliable. The opinions expressed herein are subject to change at any time and without notice. Past performance is not indicative of future results. This material is not intended as an offer or solicitation for the purchase or sale of any financial instrument. Investors should consider the investment objectives, risks, charges and expenses of any mutual fund carefully before investing. This and other information is contained in the fund's annual and semiannual reports, proxy statement and other fund information, which may be obtained by contacting your financial advisor or visiting the fund's website at www.chinafundinc.com. This information is unaudited and is intended for informational purposes only. It is presented only to provide information on the Fund's holdings, performance and strategies. The Fund is a closed-end exchange traded management investment company. This material is presented only to provide information and is not intended for trading purposes. Closed-end funds, unlike open-end funds, are not continuously offered. After the initial public offering by a closed-end fund, its shares can be purchased and sold on the open market through a stock exchange, where shares may trade at a premium or a discount. The market price of holdings is subject to change daily.
P/E is a ratio of security price to earnings per share. Typically, an undervalued security is characterized by a low P/E ratio, while an overvalued security is characterized by a high P/E ratio. P/B is a ratio of the current stock price to the book value. This is used to identify undervalued stocks. Dividend yield is the annual percentage of return earned by an investor on a common or preferred stock. The average dividend yield is the dividend rate divided by current share price.
©2016 Allianz Global Investors Distributors LLC.
|
Investment Products: Not FDIC Insured | May Lose Value | Not Bank Guaranteed
|
FS-CHN-0516
|