Attached files
| file | filename |
|---|---|
| 8-K - SWISS HELVETIA FUND, INC. | p16-0303_8k.htm |

Portfolio and Performance ReviewThe Swiss Helvetia Fund, Inc. Date: June 23, 2016 November 2014 | For professional investors only. This material is not suitable for retail clients Stefan Frischknecht, CFA Fund Manager

Agenda The case for Swiss equitiesWhy consider The Swiss Helvetia Fund, Inc.PerformancePortfolio positioningOutlook * Source: Schroders

The case for Swiss equities
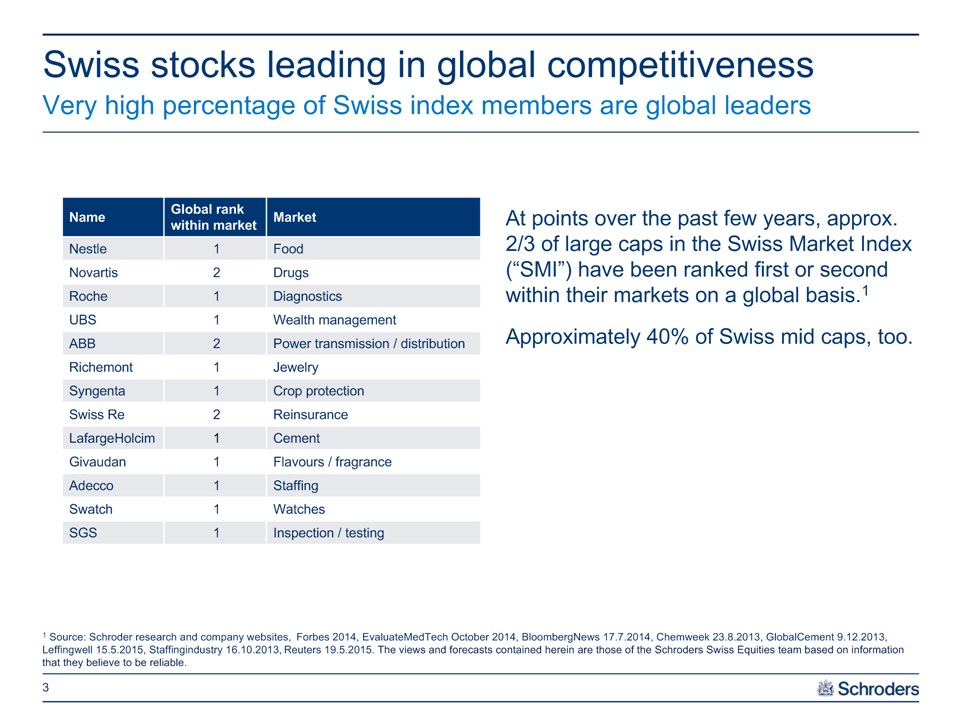
Swiss stocks leading in global competitiveness Very high percentage of Swiss index members are global leaders 1 Source: Schroder research and company websites, Forbes 2014, EvaluateMedTech October 2014, BloombergNews 17.7.2014, Chemweek 23.8.2013, GlobalCement 9.12.2013, Leffingwell 15.5.2015, Staffingindustry 16.10.2013, Reuters 19.5.2015. The views and forecasts contained herein are those of the Schroders Swiss Equities team based on information that they believe to be reliable. * Name Global rank within market Market Nestle 1 Food Novartis 2 Drugs Roche 1 Diagnostics UBS 1 Wealth management ABB 2 Power transmission / distribution Richemont 1 Jewelry Syngenta 1 Crop protection Swiss Re 2 Reinsurance LafargeHolcim 1 Cement Givaudan 1 Flavours / fragrance Adecco 1 Staffing Swatch 1 Watches SGS 1 Inspection / testing At points over the past few years, approx. 2/3 of large caps in the Swiss Market Index (“SMI”) have been ranked first or second within their markets on a global basis.1Approximately 40% of Swiss mid caps, too.

How is global leadership of Swiss stocks possible? Switzerland offers an attractive business environment * Source: World Economic Forum, Global Competitiveness Report 2015-16, rank out of 140 economies. See also: http://www.prosperity.comThe Legatum Institute, a London based think tank, on November 2, 2015, published its annual global prosperity index. Switzerland ranked number 2 based on 89 variables split into 8 subindexes (economy, entrepreneurship & opportunity, governance, education, health, safety & security, personal freedom, and social capital). The World Economic Forumhas been looking into drivers of competitiveness and prosperity in 140 economies. Amongst others, the following help explain the strong position of Switzerland:- innovation- infrastructure- education- labor market efficiency- macroeconomic environment- business sophistication

Swiss companies are innovation leaders Leading innovation score driven by high per capita patent fillings Source: Innovation Union Scoreboard 2015 (EU) *
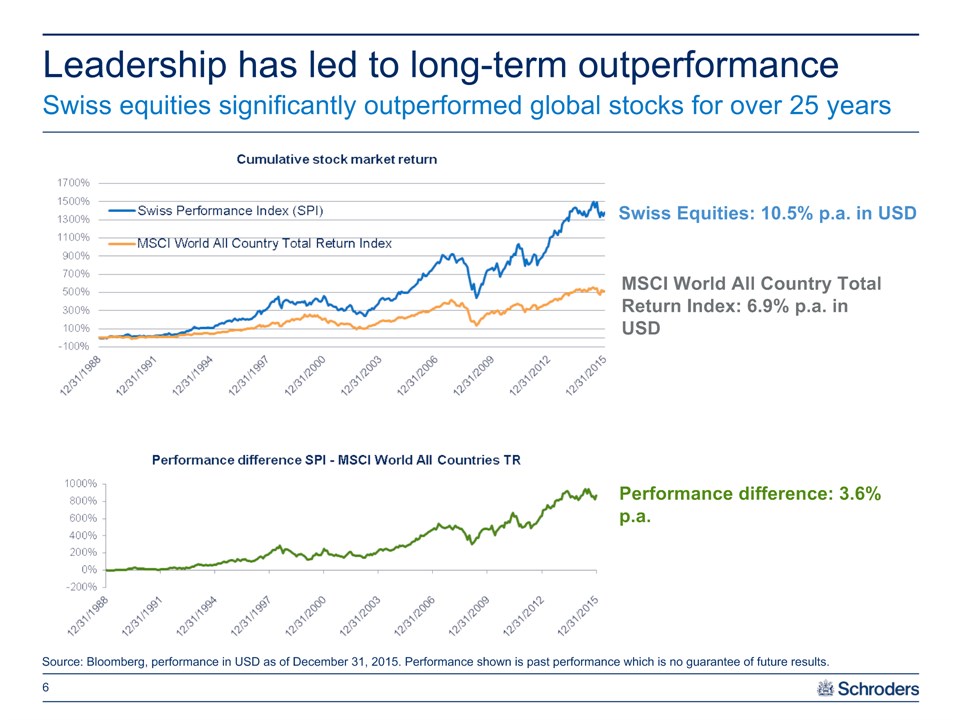
Leadership has led to long-term outperformance * Source: Bloomberg, performance in USD as of December 31, 2015. Performance shown is past performance which is no guarantee of future results. Performance difference: 3.6% p.a. Swiss Equities: 10.5% p.a. in USD MSCI World All Country Total Return Index: 6.9% p.a. in USD Swiss equities significantly outperformed global stocks for over 25 years

Swiss companies are geographically diversified Swiss companies’ regional sales exposure * Source: HSBC, July 3, 2014; *UBS February 10, 2015, data based on averages. Europeex domestic MEA Unclassified APAC Americas Domestic Europeex domestic MEA Unclassified APAC Americas Domestic Europe ex domestic MEA Unclassified APAC Americas Domestic Europe Unclassified APAC Americasex US Domestic

Swiss Equity Market Valuation versus other Indexes Swiss P/E ratio higher than European, but not an outlier * Source: Bloomberg as at May 19, 2016; Thomson Datastream, UBS as at April 13, 2016. P/E = price to earnings ratio. Country Index P/E est. 2016 Switzerland SMI 16.6 UK FTSE 100 16.5 France CAC 40 14.4 Germany DAX 12.5 Spain IBEX 35 13.7 Italy FTSE MIB 14.7 Netherlands AEX 16.8 Europe STOXX 600 15.5 US S&P 500 17.4 Japan NIKKEI 16.1 Brazil IBOV 13.3

Why Consider The Swiss Helvetia Fund, Inc.

The Swiss Helvetia Fund, Inc. * Allows US investors access to the fund management team’s capabilitiesThe fund has better diversification compared to the Swiss Performance Index (SPI)A closed-end fund allows a longer-term investment horizon (not managed based on future in/outflows)Currently the fund trades at a discount to NAV Source: Schroders, Bloomberg, March 31, 2016. Views expressed reflect those of the portfolio management team as of today’s date and do not necessarily reflect the views of Schroders. These views may change. Why invest in Swiss equities through a closed–end fund? Portfolio weight SWZ SPI Top 3 positions 34% 49% Top 5 positions 43% 58% Top 10 positions 59% 71%

Performance FY 2015 and YTD 2016

Net Asset Value Performance FY 2015 and YTD 2016 * NAV and share price performance in USD Performance in USD % FY 2015 Q1 2016 Apr-May 16 YTD 16 NAV (US GAAP) as per quarterly filings 2.96% -3.50% 1.85% -1.71% SWZ NAV as published* 2.89% -3.73% 1.85% -1.95% Swiss Performance Index, SPI 2.58% -5.58% 3.18% -2.58% Difference NAV as per quarterly filings +0.38% +2.08% -1.33% +0.87% Source: Schroders, Citi and JPM for fund performance, Bloomberg for Index performance; year-to-date performance as at May 31, 2016.Past performance is no guarantee of future results. Performance in USD % FY 2015 Q1 2016 Apr-May 16 YTD 16 Share price SWZ 1.41% -3.60% 1.67% -1.99% Swiss Performance Index, SPI 2.58% -5.58% 3.18% -2.58% Difference -1.17% +1.98% -1.51% +0.59% Share Price * published on website, Bloomberg, etc.

Performance commentary Driving factors behind relative performance Relative performance for Q1 and for Jan-May (YTD) has been positive: small & mid cap overweight was positive as they outperformed the overall market performance contribution from Kuros (former direct private equity investment): approx. 1% (YTD)Relative performance in April & May has been negative: small & mid cap overweight was a minor negative as they underperformed the overall market stock selection was negative due to: underweight in pharma, as Roche and Novartis recovered from Q1 underperformance zero weights in Zurich Insurance and ABB overweight in Swatch, which suffered from weak watch market data * Source: Schroders, JPM, Bloomberg as of May 31, 2016

Portfolio positioning

Top ten holdings - absolute basis Portfolio positioning As of 31 May 2016 * Source: Schroders, JP Morgan, Bloomberg, May 31, 2016 Name Absolute weight Novartis 12.5% Roche 11.8% Nestlé 11.2% Lindt & Sprüngli (Reg.) 4.4% Syngenta 4.1% UBS 3.2% Richemont 2.9% Burckhardt Compression 2.7% Logitech 2.5% Belimo 2.5% Total 57.8% Top holdings - relative basis Name Relative weight Lindt & Sprüngli (Reg.) +3.7% Burckhardt Compression +2.6% Belimo +2.4% Logitech +2.3% Swatch (Reg.) +2.0% Nestlé -8.1% Novartis -4.0% ABB -3.5% Roche -3.4% Zurich Insurance -3.0%
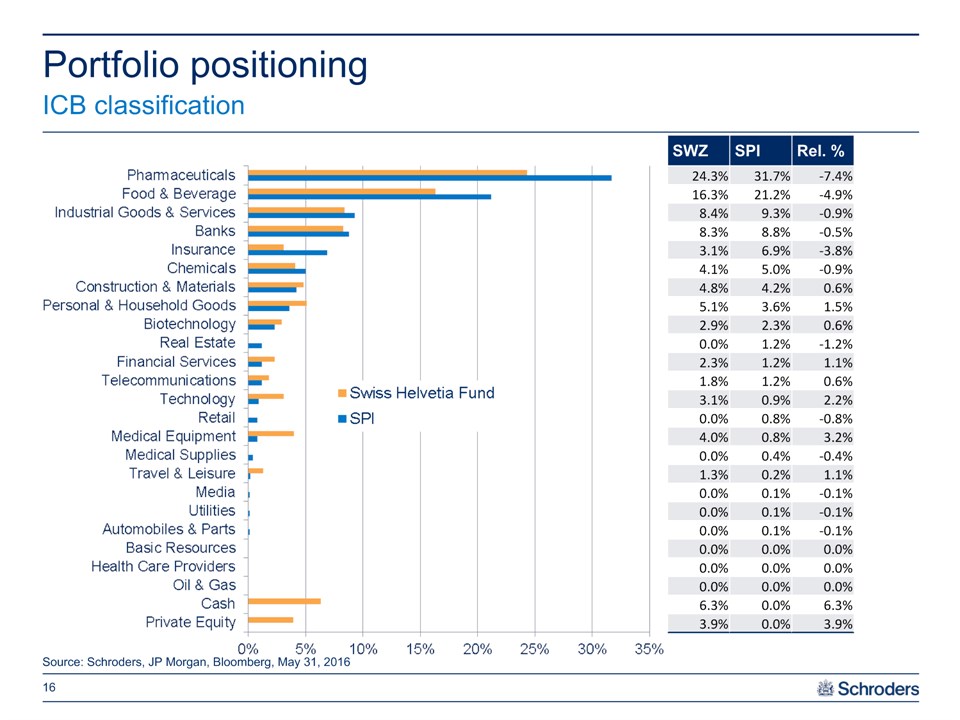
Portfolio positioning ICB classification * Source: Schroders, JP Morgan, Bloomberg, May 31, 2016 SWZ SPI Rel. % 24.3% 31.7% -7.4% 16.3% 21.2% -4.9% 8.4% 9.3% -0.9% 8.3% 8.8% -0.5% 3.1% 6.9% -3.8% 4.1% 5.0% -0.9% 4.8% 4.2% 0.6% 5.1% 3.6% 1.5% 2.9% 2.3% 0.6% 0.0% 1.2% -1.2% 2.3% 1.2% 1.1% 1.8% 1.2% 0.6% 3.1% 0.9% 2.2% 0.0% 0.8% -0.8% 4.0% 0.8% 3.2% 0.0% 0.4% -0.4% 1.3% 0.2% 1.1% 0.0% 0.1% -0.1% 0.0% 0.1% -0.1% 0.0% 0.1% -0.1% 0.0% 0.0% 0.0% 0.0% 0.0% 0.0% 0.0% 0.0% 0.0% 6.3% 0.0% 6.3% 3.9% 0.0% 3.9%

Portfolio positioning Changes in positioning Q1 2016 and 31.03.16 – 30.05.2016 * Source: Schroders, May 31, 2016; names in blue coloured text relate to portfolio actions in Q1 2016, in orange to the months of April and May 2016 New Positions Julius Baer Swiss Re Valiant Increased Positions Aryzta Cembra Money Bank Credit Suisse Sunrise Syngenta UBS Decreased Positions Actelion Belimo Bucher Industries DKSH Dufry Evolva Implenia Kuros Biosciences Lonza Nestlé OC Oerlikon Sold Positions Adecco Syngenta Valiant DKSH Sunrise Lindt & Spruengli Reg. Credit Suisse UBS Basilea Kuros Lonza Belimo Implenia Gategroup VAT Evolva Dufry Leonteq

Portfolio characteristics Portfolio positioning Moderate value tilt, high balance sheet quality, clear small & mid cap bias * Source: Bloomberg consensus estimates, Schroders, May 31, 2016 Swiss Performance Index Swiss Helvetia Fund P/E 2016e 19.5x 19.1x P/E 2017e 17.1x 17.2x P/B 4.4x 4.5x Net debt / EBITDA 74.8% 13.1% Goodwill / equity 37.5% 32.7% Small & Mid Cap wgt 17.3% 38.3%

Portfolio positioning Development of characteristics using StyleResearch * Source: Schroders Prism Report as from 30.06.14 – 31.05.2016, numbers show ‘’standard tilt’’, i.e. a statistically normalized measure for the Fund relative to benchmark

Risk measures (ex private equity) Portfolio positioning Key statistical measures * Source: Schroders, Charles River, Prism, May 31, 2016 Swiss Helvetia Fund 31.05.2016 31.03.2016 Tracking error 3.1% 3.1% Beta 0.88 0.93 Relative VaR (95%) 1.5% 1.4% Volatility 11.7% 11.6% Active share 44.8% 42.9% Portfolio turnover Swiss Helvetia Fund Turnover in % of AuM Q1 2016 12% Turnover in % of AuM YTD 2016 18% Turnover calculation method: (Buys + Sells) / (average AuM);periods of less than 12 months are not annualised

Outlook
Investment Outlook Global stock market valuations have become more expensive since 2010But equity markets are likely to benefit further from attractive / increasing dividendsSwiss spread of dividend yield vs. 10 year government bond yield highest among major stock marketsSwiss stocks have also delivered superior earnings growthWe believe that Swiss equities will be among the best performing equity markets in the long-term- global leaders of industry- long-term evidence of superior earnings growth (which is likely to persist)- in spite of strong Swiss franc (despite making news headlines in 2015, it is rather “business as usual”)Simultaneously, investors should be aware of shorter-term risks/volatility (due to politics, central banks, economic data, contagion from other asset classes, global tensions etc.) * Views expressed reflect those of the portfolio management team as of today’s date and do not necessarily reflect the views of Schroders. These views are subject to change.

Investment Outlook Global comparison of dividend yield versus government bond yield * Source: Bloomberg, as at May 31, 2016

Investment Outlook Global comparison of earnings expectations * Source: Bloomberg: as at May 31, 2016, all earnings converted into US dollars

Investment Outlook * Swiss small & mid caps look strong compared with other small & mid cap markets Source: Bloomberg: as at May 31, 2016, all earnings converted into US dollars Swiss small & mid caps versus other small & mid cap indices

Conclusion

Conclusion Swiss-listed companies are often global leadersTheir level of internationalization makes them less dependent on domestic economy(they can outgrow the Swiss economy, which is solid but mature)Swiss equities have a history of outperformance versus global and European equitiesThey are highly attractive from a long-term total return perspectiveThe Fund is currently a way to invest in Swiss stocks at a discountSchroders has a proven philosophy, process and track record for Swiss equities * Views expressed reflect those of the portfolio management team and do not necessarily reflect the views of Schroders. These views are subject to change. Past performance is no guarantee of future results.

Important Information * The Fund is a closed-end investment product. Common shares of the Fund are only available for purchase/sale on the NYSE at the current market price. An investment in the Fund is not a deposit of a bank and is not insured or guaranteed by the Federal Deposit Insurance Corporation or any other government agency.This presentation is intended to be for information purposes only and it is not intended as promotional material in any respect. The material is not intended as an offer or solicitation for the purchase or sale of any financial instrument. The material is not intended to provide, and should not be relied on for, accounting, legal or tax advice, or investment recommendations. Information herein is believed to be reliable but Schroder Investment Management North America Inc. does not warrant its completeness or accuracy.The returns presented represent past performance and are not necessarily representative of future returns, which may vary. The value of investments can fall as well as rise as a result of market or currency movements.All investments, domestic and foreign, involve risks, including the risk of possible loss of principal. The market value of a fund’s portfolio may decline as a result of a number of factors, including adverse economic and market conditions, prospects of stocks in the portfolio, changing interest rates, and real or perceived adverse competitive industry conditions. Investing overseas involves special risks including among others risks related to political or economic instability, foreign currency (such as exchange, valuation, and fluctuation) risk, market entry or exit restrictions, illiquidity, and taxation. The Swiss securities markets have substantially less trading volume than the U.S. securities markets. Additionally, the capitalization of the Swiss securities markets is highly concentrated. Securities of some companies located in Switzerland will be less liquid and more volatile than securities of comparable U.S. companies. This combination of lower volume and greater concentration in the Swiss securities markets may create a risk of greater price volatility than in the U.S. securities markets. The views and forecasts contained herein are those of the Schroders Swiss Equities team and are subject to change. The information and opinions contained in this document have been obtained from sources we consider to be reliable. No responsibility can be accepted for errors of facts obtained from third parties. Reliance should not be placed on the views and information in the document when taking individual investment and/or strategic decisions.Definitions: Active share represents the proportion of stock holdings in the fund that is different from the composition found in the benchmark. Beta measures the sensitivity of the fund to the movements of its benchmark. Volatility is measured by Standard deviation, which is the risk or volatility of an investment’s return over a particular time period; the greater the number, the greater the risk. Tracking error is the difference between the price behavior of a position or a portfolio and the price behavior of a benchmark. VaR is Value at Risk, a widely used risk measure of the risk of loss on a specific portfolio of financial exposures.For more information, visit www.swzfund.comSchroder Investment Management North America Inc.875 Third Avenue, New York, NY 10022-6225(212) 641-3800www.schroders.com/us