Attached files
| file | filename |
|---|---|
| 8-K - FORM 8-K - Uniti Group Inc. | dp66589_8k.htm |
Exhibit 99.1

June 20, 2016 Acquisition of
Safe Harbor Certain statements in this presentation may constitute forward - looking statements within the meaning of the Private Securities L itigation Reform Act of 1995, as amended from time to time. Those forward - looking statements include all statements that are not historical statements of fact an d those regarding our business strategies, growth prospects, industry trends, Tower Cloud sales opportunities, and operating and financial performance. Words such as "anticipate(s)," "expect(s)," "intend(s)," “estimate(s),” “foresee(s),” "plan(s)," "believe(s)," "may," "will," "w ould," "could," "should," "seek(s)" and similar expressions, or the negative of these terms, are intended to identify such forward - looking statements. These statements are base d on management's current expectations and beliefs and are subject to a number of risks and uncertainties that could lead to actual results differing m ate rially from those projected, forecasted or expected. Although we believe that the assumptions underlying the forward - looking statements are reasonable, we can give no assu rance that our expectations will be attained. Factors which could materially alter our expectations include, but are not limited to our ability to achieve som e o r all the benefits that we expect to achieve from the spin - off from Windstream; the ability and willingness of Windstream and future customers to meet and/or perform their obligations under any contractual arrangements entered into with us, including master lease arrangements, and any of their obligations to indemnify , d efend and hold us harmless from and against various claims, litigation and liabilities; the ability of Windstream and future customers to comply with laws, rules an d regulations in the operation of the assets we lease to them; the ability and willingness of Windstream and our future customers to renew their leases with us upo n t heir expiration, and the ability to reposition our properties on the same or better terms in the event of nonrenewal or in the event we replace an existing tenan t; the availability of and our ability to identify suitable acquisition opportunities and our ability to acquire and lease the respective properties on favorable terms or operate and integrate the acquired business; our ability to generate sufficient cash flows to service our outstanding indebtedness; our ability to access debt a nd equity capital markets; credit rating downgrades; fluctuating interest rates; our ability to retain our key management personnel; our ability to qualify or maintai n o ur status as a real estate investment trust (“REIT”); changes in the U.S. tax law and other state, federal or local laws, whether or not specific to REITs; covenan ts in our debt agreements that may limit our operational flexibility; other risks inherent in the communications industry and in the ownership of communications distr ibu tion systems, including potential liability relating to environmental matters and illiquidity of real estate investments; the possibility that the terms of the transacti on with Tower Cloud as described in this presentation are modified; the risk that the Tower Cloud transaction agreements may terminate prior to expiration; risks rela ted to satisfying the conditions of the Tower Cloud transaction, including timing (including possible delays) and receipt of regulatory approvals from various govern men tal entities (including any conditions, limitations or restrictions placed on these approvals) and the risk that one or more governmental entities may deny approval; th e risk that we fail to fully realize the potential benefits of the Tower Cloud transaction or have difficulty integrating PEG and/or Tower Cloud; the possibility that To wer Cloud’s first quarter 2016 results differ from our current expectations; and additional factors discussed in the risk factors section of our Annual Report on Fo rm 10 - K for the year ended December 31, 2015, as well as those described from time to time in our reports filed with the SEC. CS&L expressly disclaims any obligation to release publicly any updates or revisions to any of the forward looking statements set forth in this presentation to reflect any change in its expectations o r a ny change in events, conditions or circumstances on which any statement is based. First quarter 2016 unaudited results for Tower Cloud are preliminary and subject to audit and purchase accounting adjustments . A ctual results for the period could differ materially. Investors should not place undue reliance on such numbers. Tower Cloud operating metrics have been provide d b y Tower Cloud without verification and investors should not place undue reliance on those operating metrics. This presentation includes projected results for Tower Cloud for 2016. Such projections have been provided by Tower Cloud and are sub ject to significant risks and uncertainty including, without limitation, risks relating to Tower Cloud’s ability to renew or obtain new contracts on antici pat ed terms or at all, Tower Cloud’s ability to attract new customers, current economic trends, reception of new products and technologies in the wireless infrastructure ind ust ry, and the strength of Tower Cloud’s competitors. Given these risks and uncertainties, any projection is inherently unreliable and Tower Cloud’s actual results ar e l ikely to differ materially from those listed in this presentation. This presentation contains certain supplemental measures of performance that are not required by, or presented in accordance wit h, U.S. GAAP. Such measures should not be considered as alternatives to GAAP. Further information with respect to and reconciliations of such measures to th e nearest GAAP measure can be found in the appendix hereto. 1

Agenda and Speakers 2 Strategic Vision & Investment Thesis Transaction and Financial Structure Mark A. Wallace Executive Vice President, Chief Financial Officer and Treasurer Kenny Gunderman President and Chief Executive Officer

3 ▪ Building Unique REIT Investment Platform Across Communication Infrastructure Assets ▪ Taking Advantage of Favorable Industry Dynamics Driving Capital Investments ▪ Exponential Network T raffic Growth Accelerating Architecture & Technology Changes ▪ Communication Infrastructure Converging Around Fiber - Centric Data Transport Ecosystem ▪ Fiber is Becoming the Focal Point in the New Ecosystem ▪ Tower Cloud Accelerates CS&L’s Diversification Strategy Leading Strategic Capital Partner to the Communications Industry CS&L Vision and Strategy

Tower Cloud Investment Thesis 4 Drives Scale and Growth within CS&L Fiber Infrastructure Group ▪ Capitalizes on the Rising Demand by Carriers and Enterprises for Dark Fiber ▪ Establishes CS&L as a Proven Small Cell Systems Provider ▪ Grows Relationships with National Wireless Carriers ▪ Advances Diversification with High Quality Long Term Contractual Revenues ▪ Accelerates Ongoing Wholesale and Enterprise Initiatives ▪ Veteran Leadership Team with Deep Operational Experience ▪ Attractive Valuation ▪ Pre - Synergy Multiple of ~12.4x Based on 4Q16 Annualized Adjusted EBITDA (1) ▪ Expect to Achieve $ 6 million of Annual Run Rate Cost Synergies within 3 Years (1) Projected Adjusted EBITDA is subject to purchase price accounting and other adjustments . Actual results could differ materially. Tower Cloud’s future results are subject to significant uncertainty . Any projection is inherently unreliable and Tower Cloud’s actual results are likely to differ materially from those listed in thi s p resentation. Adjusted EBITDA for 4Q16 has not been adjusted for synergies or the costs anticipated to be incurred to achieve the synergies.

5 Fiber is Mission Critical to Serving C arriers and Enterprises Macro Cell Small Cell Distributed Antenna System C - RAN Baseband Processing Fiber is Critical to All Network Infrastructure

6 Significantly Extends CS&L Fiber Network Enhanced Combined Network Footprint PRODUCT REVENUES (1) E - Rate 3% Other 2% Wholesale & Enterprise 9% Lit Backhaul 85% CUSTOMER REVENUES (1 ) Dark Fiber & Small Cells 1% E - Rate 1% REVENUES UNDER CONTRACT Wholesale & Enterprise 5% Dark Fiber & Small Cells 20% Lit Backhaul 75% LEGEND PEG Bandwidth Tower Cloud (In - Service) Tower Cloud (In Progress) Triple Net National Carrier A 44% National Carrier B 23% National Carrier C 14% National Carrier D 3% Others 16% • Pro Forma Combined Fiber Strand Miles In Service: • Pro Forma Combined Fiber Route Miles In Service: 4,200,000 85,000

7 CS&L Pro Forma Revenue Diversification Achieving Diversification with High Quality Tenants 15% Talk America 3 % National Carrier A 44% National Carrier B 23% National Carrier D 14% National Carrier C 3% Other 16% Revenues (1) PEG / Tower Cloud 19% Talk America 3% Windstream Lease 82% Revenues (1) Note: Data based on 1Q16 results. (1) First quarter results for Tower Cloud are preliminary and unaudited. Actual results could differ materially. Investors should not p lac e undue reliance on such numbers. Operating metrics have been provided by Tower Cloud without verification and investors should not place undue reliance on those operating metrics.

Tower Cloud At A Glance 8 Financial Data (1) Lit Backhaul Connections (4) 1,889 Revenue Under Contract (5) > $225M Average Remaining Contract Term (6) 56 months Employees ~70 $ in Millions 1Q16 LQA LQA Revenue $41 LQA Adjusted EBITDA (2) $14 Maintenance Capex to Revenues ~6% Monthly Revenue (3) – MRR and MAR $4 Operating Metrics (1) High Growth FTTT Backhaul Provider National Carrier A 66% National Carrier B 16% National Carrier C 9% National Carrier D 3% Other 6% Customer Revenues (1 ) Revenues Under Contract Wholesale & Enterprise 3% Dark Fiber & Small Cells 48% Lit Backhaul 49% Product Revenues (1) Wholesale & Enterprise 4% Dark Fiber & Small Cells 2% Lit Backhaul 94% (1) First quarter results for Tower Cloud are preliminary and unaudited. Actual results could differ materially. Investors should no t place undue reliance on such numbers. Operating metrics have been provided by Tower Cloud without verification and investors should not place undue reliance on those operating metrics. (2) Adjusted EBITDA defined as EBITDA less stock - based compensation expense and the impact, which may be recurring in nature, of acquisition and transaction related expenses, the write off of unamortized deferred financing costs, costs incurred as a result of the early repayment of debt, changes in the fair value of co ntingent consideration and financial instruments, and other similar items (3) Monthly Recurring Revenue (MRR) and Monthly Amortized Revenue (MAR) expected at closing. (4) Includes 70 microwave connections. (5) Revenue under contract expected at closing. Contracts are subject to termination under certain conditions and/or may not be renewed, so actual revenue under contract could vary materially. (6) Includes contracts for Lit Backhaul, Dark Fiber, Wholesale and Enterprise.

$8 $15 $27 $33 $41 2011 2012 2013 2014 2015 Strong Growth Track Record With Attractive Sales Funnel 9 Dark Fiber & Small Cells Driving Sales Momentum Tower Cloud Sales Funnel (1) - $1 $2 $5 $9 $13 2011 2012 2013 2014 2015 Revenue ($ in Millions) Adjusted EBITDA ($ in Millions) (2) MRR CONTRACT VALUE CONNECTIONS Wholesale & Enterprise 3% Dark Fiber & Small Cells 95% Lit Backhaul 2% Dark Fiber & Small Cells 83% Dark Fiber & Small Cells 95% Wholesale & Enterprise 13% Lit Backhaul 4% Wholesale & Enterprise 3% Lit Backhaul 2% (1) Represents sales opportunities currently being pursued by Tower Cloud as of June 2016, and does not represent contractual backlog or com mit ted revenue. There can be no assurances that any of these opportunities will be realized. (2) Excludes certain non - recurring items.
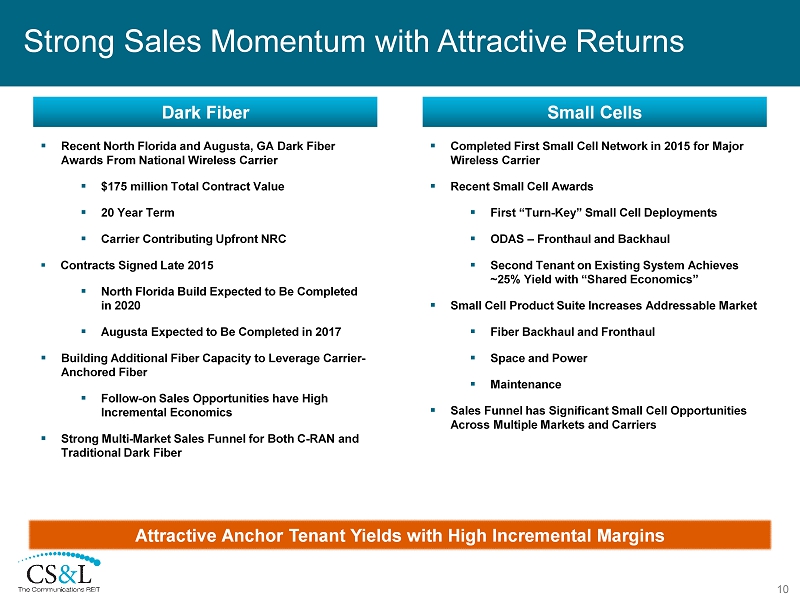
Strong Sales Momentum with Attractive Returns 10 ▪ Recent North Florida and Augusta, GA Dark Fiber Awards From National Wireless Carrier ▪ $175 million Total Contract Value ▪ 20 Year Term ▪ Carrier Contributing Upfront NRC ▪ Contracts Signed Late 2015 ▪ North Florida Build Expected to Be Completed in 2020 ▪ Augusta Expected to Be Completed in 2017 ▪ Building Additional Fiber Capacity to Leverage Carrier - Anchored Fiber ▪ Follow - on Sales Opportunities have High Incremental Economics ▪ Strong Multi - Market Sales Funnel for Both C - RAN and Traditional Dark Fiber Attractive Anchor Tenant Yields with High Incremental Margins Dark Fiber ▪ Completed First Small Cell Network in 2015 for Major Wireless Carrier ▪ Recent Small Cell Awards ▪ First “Turn - Key” Small Cell Deployments ▪ ODAS – Fronthaul and Backhaul ▪ Second Tenant on Existing System Achieves ~25 % Yield with “Shared Economics” ▪ Small Cell Product Suite Increases Addressable Market ▪ Fiber Backhaul and Fronthaul ▪ Space and Power ▪ Maintenance ▪ Sales Funnel has Significant Small Cell Opportunities Across Multiple Markets and Carriers Small Cells

Significant S ynergy O pportunities 11 ▪ Integrate Sales Organizations and Marketing Coverage ▪ Automation of Manual Processes and Consolidation of Duplicative Administrative Processes ▪ Best Practice Approach to OSS/BSS Systems ▪ Implement Best Practices in Service Delivery, Service Assurance, and Back Office to Drive Efficiencies in the Fiber Infrastructure Group ▪ Enhanced Efficiencies throughout Network Operations ▪ Access to 11 States Across the Eastern and Midwestern U.S. ▪ Expand Network Reach by Nearly 30,000 Near - Net Connection Opportunities ▪ Increase Ability to Serve Multi - location Wholesale & Enterprise Customers with Larger Geographic Reach ▪ Pool Shared Relationships to Better Engage Strategic Customers Expected Annual Run Rate Cost Synergies of $6 million within 3 Years Revenue Synergies Operational Synergies SG&A Synergies

Transaction Summary 12 Consideration ▪ Initial Consideration of $230 million ▪ $180 million Cash Consideration ▪ 1.9 million Shares of CS&L Common Stock ▪ Additional Contingent Consideration upon Tower Cloud Achieving Certain Defined Operational and Financial Milestones Over the Next 4 Years Synergies ▪ Up to $6 million of Annual Run Rate Cost Synergies to Be Achieved Within 3 Years Financing ▪ Cash Consideration to Be Funded with Available Cash on Hand and Borrowings Under CS&L’s $500 million Revolver Closing Conditions and Timing ▪ Regulatory and Other Approvals Required; Customary Closing Conditions ▪ Expect to Close by Early 4Q16

Current & Pro Forma Capitalization 13 $ in Millions 3/31/2016 As Reported PEG Transaction Adjustments Recent Senior Secured Notes Adjustments Pro Forma as Adjusted before Tower Cloud Transc . Tower Cloud Transaction Adjustments Pro Forma as Adjusted for Tower Cloud Transaction Cash $ 1 65 $ 12 $ (2) $ 175 $ (5) $ 170 Revolver – 321 (148) (1) 173 185 (2) 358 Term Loan B 2,124 -- -- 2,124 -- 2,124 Secured Notes 400 -- 150 550 -- 550 Unsecured Notes 1,110 -- -- 1,110 -- 1,110 Capital Leases (3) – 41 -- 41 7 48 Total Debt $ 3,634 $ 362 $ 2 $ 3,998 $ 192 $ 4,190 Convertible Preferred at Fair Value -- 79 -- 79 -- 79 LQA Adjusted EBITDA (4) 663 36 -- 699 16 (5) 715 Net Debt $ 3,469 $ 3,823 $ 4,020 Net Debt / LQA Adjusted EBITDA 5.2x 5.5x 5.6x Note: Presented in accordance with Debt Agreements and not GAAP accounting standards. Amounts may not foot due to rounding. A mou nts not adjusted for unamortized discount and debt issuance costs. (1) Represents Revolver paydown with proceeds from the offering, net of fees and expenses. (2) Cash portion of Tower Cloud consideration expected to be funded on revolver. Includes estimated transaction fees and expenses of $ 5 m illion. (3) Capital leases are related to IRUs. (4) LQA Adjusted EBITDA is calculated as the pro forma Adjusted EBITDA for the three months ended March 31, 2016 multiplied by 4. (5) Includes approximately $2 million of synergies expected to be realized within 12 months of the acquisition close date.

Key Customers REITable ? x x x x (A) x Initial Yields 6% – 8% 5% – 10 %+ 5% – 7% 5% – 7% 10% – 2 0% 8% - 12% Multi Tenant Leased Up “Shared Economics” x x x x x Initial Term (Years) 50 – 99 5 – 10 10 – 20 10 – 20 5 – 10 15 – 20 Escalators 1% – 4% 1% – 3% 0% – 3% 0% – 3% N/A 1% – 3% Characteristics CS&L Is Building a Unique REIT Investment Platform Infrastructure S ervices Component Small Cells Dark Fiber Ground Leases Macro Towers Lit Fiber Attractive Return Profiles A cross a ll Asset Classes 14 Consumer Broadband Infrastructure ( A) Lit fiber is generally not “ REITable ”; however, TRS structure and tax attributes for PEG and Tower Cloud expected to provide substantial tax benefits. Future con ver sions of lit fiber to dark fiber may result in assets becoming REIT eligible.

CS&L Facts – Pro Forma Spinoff Formation April 2015 NASDA Q: “CSAL” Contractual Net Lease Revenues (1) $ 10B Revenues Under Contract Fiber Infrastructure Group > $500M Revenues Under Contract S&P 400 Mid - Cap Company > $7B Enterprise Value Annual Revenue ≈ $ 800M Net Leverage (2) 5.6x Net Secured Leverage (2) 4.1x Near Term Debt Maturity 0% Fiber Strand Miles (3) 4.2M Leasing Segment EBITDA Margin 95% YTD Investments (3) ≈ $650M Annual Maintenance Capex (3) ≈ $7 M First Diversified Communication Infrastructure REIT 15 (1) Lease payments under the Master Lease with Windstream to be received over initial term of 15 years. (2) Net Debt or Net Secured Debt, as applicable, to Annualized Adjusted EBITDA (based on last quarter annualized) pro forma for the a cqu isition of PEG and Tower Cloud (Annualized Adjusted EBITDA includes approximately $2 million of synergies expected to be realized within 12 months of the acquisition close date). Adjus ted EBITDA does not reflect costs that will be incurred to achieve synergies. (3) Pro forma for acquisition of Tower Cloud. Fiber strand miles include 181,000 awarded for deployment.

16 Q&A

Appendix 17

Reconciliation of Non - GAAP Historical Financials Unaudited , $ in Millions CS&L PEG Bandwidth 1Q16 Net Income $ 8.0 Depreciation & amortization 86.3 Interest expense 66.0 Income tax expense 0.4 EBITDA $ 160.8 Stock - based compensation 0.9 Transaction related costs 3.9 Adjusted EBITDA 165.7 Annualized Adjusted EBITDA (1) $ 662.8 18 Tower Cloud 1Q16 Net Income $ (5.4) Depreciation & amortization 8.2 Interest expense 6.1 Income tax expense - EBITDA $ 8.9 Stock - based compensation 0.2 Transaction related costs - Adjusted EBITDA 9.1 Annualized Adjusted EBITDA (1) $ 36.3 1Q16E (2) Net Income $ (2.3) Depreciation & amortization 4.7 Interest expense 1.1 Income tax expense - EBITDA $ 3.4 Stock - based compensation 0.1 Transaction related costs - Adjusted EBITDA 3.5 Annualized Adjusted EBITDA (1) $ 13.7 Note: Subtotals may not foot due to rounding. (1) Annualized Adjusted EBITDA is calculated as Adjusted EBITDA multiplied by 4. (2) First quarter results for Tower Cloud are preliminary and unaudited. Actual results could differ materially. Investors should no t place undue reliance on such numbers.

Reconciliation of Tower Cloud Historical Financials 19 $ in Millions 2013 (1) 2014 (1) 2015 (1) Net loss $ (8.9) $ (10.8) $ (10.1) Depreciation and amortization 11.6 15.9 18.6 Interest expense 1.6 3.4 4.4 Income tax expense - - - EBITDA $ 4.3 $ 8.5 $ 13.0 Stock - based compensation 0.4 0.4 0.3 Adjusted EBITDA $ 4.7 $ 8.9 $ 13.3 (1) Amounts may not subtotal due to rounding

We refer to EBITDA, Adjusted EBITDA, Funds From Operations (“FFO”) as defined by the National Association of Real Estate Investment Trusts (“NAREIT”), NFFO and AFFO in our analysis of our results of operations, which are not required by, or prese nte d in accordance with, accounting principles generally accepted in the United States (“GAAP”). While we believe that net income, as de fined by GAAP, is the most appropriate earnings measure, we also believe that EBITDA, Adjusted EBITDA, FFO, NFFO and AFFO are important non - GAAP supplemental measures of operating performance for a real estate investment trust (“REIT ”). We define “EBITDA” as net income, as defined by GAAP, before interest expense, provision for income taxes and depreciation an d amortization. We define “Adjusted EBITDA” as EBITDA less stock - based compensation expense and the impact, which may be recurring in nature, of acquisition and transaction related expenses, the write off of unamortized deferred financing costs, cos ts incurred as a result of the early repayment of debt, changes in the fair value of contingent consideration and financial instruments, and other similar items. We believe EBITDA and Adjusted EBITDA are important supplemental measures to net income because they provide additional information to evaluate our operating performance on an unleveraged basis, and serve as an indicator of our abilit y t o service debt. Adjusted EBITDA is calculated similar to defined terms in our material debt agreements used to determine compli anc e with specific financial covenants. Since EBITDA and Adjusted EBITDA are not measures calculated in accordance with GAAP, they should not be considered as an alternative to net income determined in accordance with GAAP. Non - GAAP Financial Measures 20

Because the historical cost accounting convention used for real estate assets requires the recognition of depreciation expens e e xcept on land, such accounting presentation implies that the value of the real estate assets diminishes predictably over time. Howe ver , since real estate values have historically risen or fallen with market and other conditions, presentations of operating results for a REIT that uses historical cost accounting for depreciation could be less informative. Thus, NAREIT created FFO, as a supplemental measu re of operating performance for REITs that excludes historical cost depreciation and amortization, among other items, from net inco me, as defined by GAAP. FFO is defined by NAREIT as net income applicable to common shareholders computed in accordance with GAAP, excluding gains or losses from real estate dispositions, plus real estate depreciation and amortization and impairment charge s. We compute FFO in accordance with NAREIT’s definition . The Company defines NFFO, as FFO excluding the impact, which may be recurring in nature, of transaction related costs. The Company defines AFFO, as NFFO excluding (i) non - cash revenues and expenses such as stock - based compensation expense, amortization of debt and equity discounts, amortization of deferred financing costs, depreciation and amortization of non - real e state assets, straight line rental revenues, revenue associated with the amortization of tenant funded capital improvements and (ii ) t he impact, which may be recurring in nature, of maintenance capital expenditures, the write - off of unamortized deferred financing f ees, additional costs incurred as a result of early repayment of debt, changes in the fair value of contingent consideration and f ina ncial instruments and similar items. We believe that the use of FFO, NFFO and AFFO, combined with the required GAAP presentations, improves the understanding of operating results of REITs among investors and analysts, and makes comparisons of operating res ult s among such companies more meaningful. We consider FFO, NFFO and AFFO to be useful measures for reviewing comparative operating and financial performance. In particular, we believe AFFO, by excluding certain revenue and expense items, can help investors compare our operating performance between periods and to other REITs on a consistent basis without having to accoun t f or differences caused by unanticipated items and events, such as acquisition and transaction related costs. However, FFO, NFFO a nd AFFO do not purport to be indicative of cash available to fund our future cash requirements . Annualized Adjusted EBITDA is calculated by multiplying Adjusted EBITDA for the three months ended March 31, 2016 by four. Ou r computation of Adjusted EBITDA and Annualized Adjusted EBITDA may differ from the methodology used by other REITs to calculat e these measures, and, therefore, may not be comparable to such other REITs. Annualized Adjusted EBITDA has not been prepared o n a proforma basis in accordance with Article 11 of Regulation S - X . Further, our computations of EBITDA, Adjusted EBITDA, FFO, NFFO and AFFO may not be comparable to that reported by other REITs or companies that do not define FFO in accordance with the current NAREIT definition or that interpret the current NARE IT definition or define EBITDA, Adjusted EBITDA, NFFO and AFFO differently than we do. Non - GAAP Financial Measures 21

Other Reporting Definitions ▪ Adjusted EBITDA Margin: Adjusted EBITDA divided by consolidated revenue. Adjusted EBITDA margin is a supplemental measure of our operating margin that should be considered along with, but not as an alternative to our operating margins ▪ Contract Value: MRR and MAR under contract multiplied by the remaining contract term in months ▪ Contractual Annual Revenue: MRR and MAR under contract multiplied by 12 months ▪ Enterprise Value: Net Debt plus market value of outstanding common stock ▪ Monthly Amortized Revenue (MAR): Revenue related to the amortized portion of upfront charges and IRU’s ▪ Monthly Recurring Revenue (MRR): Revenues for ongoing service from both contractual and month - to - month customer arrangements ▪ Net Debt: Carrying amount of debt outstanding, net of discounts, less unrestricted cash and cash equivalents ▪ Net Leverage Ratio: Net debt divided by Annualized Adjusted EBITDA ▪ Revenue Under Contract: Total revenue contract value that the Company is entitled to receive pursuant to existing contracts, some of which may be past their expiration date and currently on a month to month basis. A portion of these contracts is subject to renewal each year, and there can be no assurances that the contracts will be renewed at all or, if they are renewe d, that the renewal will not provide for lower rates. Accordingly , our presentation of contractual revenue is not a guarantee of future revenues and should not be viewed as a predictor of future annual revenues 22