Attached files
| file | filename |
|---|---|
| 8-K - 8-K - BOK FINANCIAL CORP | a201606208-k.htm |

1 Energy Portfolio Information NASDAQ: BOKF

2 Forward-Looking Statements: This presentation contains statements that are based on management’s beliefs, assumptions, current expectations, estimates, and projections about BOK Financial Corporation, the financial services industry, and the economy generally. These remarks constitute forward-looking statements within the meaning of the Private Securities Litigation Reform Act of 1995. Words such as “anticipates”, “believes”, “estimates”, “expects”, “forecasts”, “plans”, “projects”, variations of such words, and similar expressions are intended to identify such forward-looking statements. Management judgments relating to, and discussion of the provision and allowance for credit losses involve judgments as to future events and are inherently forward-looking statements. Assessments that BOK Financial’s acquisitions and other growth endeavors will be profitable are necessary statements of belief as to the outcome of future events, based in part on information provided by others which BOKF has not independently verified. These statements are not guarantees of future performance and involve certain risks, uncertainties, and assumptions which are difficult to predict with regard to timing, extent, likelihood and degree of occurrence. Therefore, actual results and outcomes may materially differ from what is expressed, implied or forecasted in such forward-looking statements. Internal and external factors that might cause such a difference include, but are not limited to, changes in commodity prices, interest rates and interest rate relationships, demand for products and services, the degree of competition by traditional and non-traditional competitors, changes in banking regulations, tax laws, prices, levies, and assessments, the impact of technological advances, and trends in customer behavior as well as their ability to repay loans. For a discussion of risk factors that may cause actual results to differ from expectations, please refer to BOK Financial Corporation’s most recent annual and quarterly reports. BOK Financial Corporation and its affiliates undertake no obligation to update, amend, or clarify forward-looking statements, whether as a result of new information, future events, or otherwise. Non-GAAP Financial Measures: This presentation may refer to non-GAAP financial measures. Additional information on these financial measures is available in BOK Financial’s 10-Q and 10-K filings with the Securities and Exchange Commission which can be accessed at www.BOKF.com.

3 Energy Portfolio Highlights 100 year history in energy lending and expertise to manage through downturns Only 16 basis points of average annualized gross losses in energy for the 15 years ended December 31, 2015 As of March 31, 2016: $5.3bn commitments and $3.0bn outstanding ~60 / 40 split between oil and gas SNCs: 54% of commitments, 45% of outstandings E&P line utilization: 64% ACL to period end loans: 3.19% Q1 energy chargeoffs totaled $22.1mm 2015 totaled $5.3mm ($mm) June 30, 2015 September 30, 2015 December 31, 2015 March 31, 2016 Pass Performing Loans $2,658.4 91.6% $2,527.6 89.1% $2,580.7 83.3% $2,197.8 72.6% Special Mention 112.8 3.9% 196.3 6.9% 325.6 10.5% 269.0 8.9% Potential Problem Loans 124.1 4.3% 96.4 3.4% 129.8 4.2% 403.0 13.3% Nonaccrual Loans 6.8 0.2% 17.9 0.6% 61.2 2.0% 159.6 5.3% Total Energy Loans $2,902.1 $2,838.2 $3,097.3 $3,029.4 Portfolio breakdown Summary highlights Oil & Gas Producers 82% Midstream & Other 9% Energy Services 9%

4 Stress test assumptions Stress test results Quarterly Energy Stress Test 2016: $1.65 / mmbtu, $34 / bbl 2017: $2.00 / mmbtu, $37 / bbl 2018: $2.20 / mmbtu, $38 / bbl 2019: $2.40 / mmbtu, $39 / bbl 2020 and thereafter: $2.50 / mmbtu, $40 / bbl The results of the April 2016 Energy stress test were consistent with the prior quarter Borrowers have largely taken steps to position themselves to perform throughout the downturn by reducing expenses, cutting capital expenditure budgets, and attempting to raise additional capital We anticipate continued grade migration in the Energy portfolio, and the inherent loss content in this scenario factored into a loan loss provision guidance of $60–$80mm for 2016

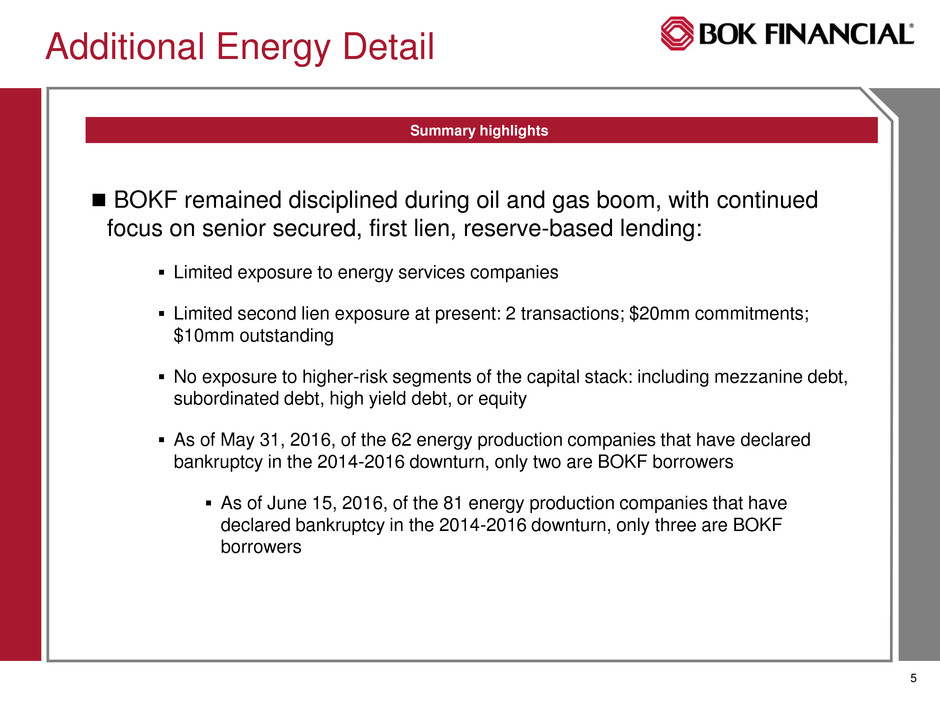
5 BOKF remained disciplined during oil and gas boom, with continued focus on senior secured, first lien, reserve-based lending: Limited exposure to energy services companies Limited second lien exposure at present: 2 transactions; $20mm commitments; $10mm outstanding No exposure to higher-risk segments of the capital stack: including mezzanine debt, subordinated debt, high yield debt, or equity As of May 31, 2016, of the 62 energy production companies that have declared bankruptcy in the 2014-2016 downturn, only two are BOKF borrowers As of June 15, 2016, of the 81 energy production companies that have declared bankruptcy in the 2014-2016 downturn, only three are BOKF borrowers Summary highlights Additional Energy Detail

6 Should Stress Losses Exceed our Estimates, Bank Still Maintains Robust Capital Levels 10.3% 9.6% Bank level standalone Bank level pro forma for Moody's implied energy stress losses Illustrative stress loss assumptions (Moody's “Severe Stress" – April 14, 2016)¹ Unexpected incremental losses, if they arise, would have a nominal impact on capital Bank level Moody’s implied energy stress loss adjusted CET1 (%) (3) Assuming Moody’s implied energy stress losses: 70 basis points of capital erosion without offsetting income Less than three quarters of projected² pre- provision net revenue to fully offset capital erosion Source: Company filings; SNL Financial; Moody’s; Note: Financial data as of March 31, 2016 ¹ Services equivalent to Energy Services, Exploration & Production equivalent to Oil & Gas Producers, and Midstream equivalent to Midstream & Other 2 Based on analyst projections 3 Based on 35% federal income tax Total energy Services Exploration & Production Midstream Downstream Other Probability of default (PD) 42.9% 42.9% 18.2% 28.0% 18.2% Weighted average loss given default (LGD) 76.0% 21.0% 76.0% 76.0% 19.8% Cumulative loss (PD x LGD) 32.6% 9.0% 13.9% 21.3% 3.6% BOK Financial energy loan concentration (% of gross loans) 1.7% 15.2% 1.7% – – Moody's implied stress losses (% of energy loans) 11.6% Energy loan loss reserve (% of energy loans) 3.2% After-tax Moody's implied stress loss ($mm) ($166)
