Attached files
| file | filename |
|---|---|
| EX-99.4 - EX-99.4 - GRANT PARK FUTURES FUND LIMITED PARTNERSHIP | d199971dex994.htm |
| EX-99.3 - EX-99.3 - GRANT PARK FUTURES FUND LIMITED PARTNERSHIP | d199971dex993.htm |
| EX-99.1 - EX-99.1 - GRANT PARK FUTURES FUND LIMITED PARTNERSHIP | d199971dex991.htm |
| 8-K - 8-K - GRANT PARK FUTURES FUND LIMITED PARTNERSHIP | d199971d8k.htm |
Class A, B, Legacy 2, Global Grant 2 and Park Global Fund 3 Units
Monthly Performance Report • May 2016
DCM Brokers, LLC Member FINRA/SIPC Servicing Agent
555 W. Jackson Blvd., Ste 600 Chicago, IL 60661
This sales and advertising literature must be read in conjunction with the prospectus in order to understand fully all of the implications and risks of the offering of securities to which it relates. A copy of the prospectus must be made available to you in connection with this offering. This is neither an offer to sell nor a solicitation of an offer to buy the securities described herein. An offering is made only by the prospectus. The information in this document is valid only as of the date hereof and may be changed without notice. This communication is confidential and is intended solely for the information of the person to whom it has been delivered.
2 Grant Park Fund Performance Report • May 2016
Market Commentary: May 2016
Currencies: The U.S. dollar strengthened against its global counterparts due to
speculation about an interest rate increase and on disappointing international
economic data which is suggestive of sluggish global growth. The Japanese
yen declined ahead of the G7 meeting which discussed potential Japanese
plans to weaken their currency. The Canadian dollar fell on disappointing
economic data.
Energy: Crude oil prices rose as demand increased and risks to future supplies
were reinforced by a pipeline disruption in Nigeria and wildfires in Alberta,
Canada. A decline in the number of active U.S. oil rigs and in U.S. crude
stockpiles also moved crude oil markets higher. Natural gas prices rose as
forecasts for warm weather raised expectations of increased demand.
Equities: Global equity markets finished higher on increasing oil prices, better
than expected earnings and positive global cues.
Fixed Income: U.S. fixed income markets were mixed, with shorter-term
treasuries down slightly on growing expectations of a possible interest rate
hike. U.K fixed income markets rose on increased demand and as investors
await a vote over a possible British exit from the European Union.
Grains/Foods: Corn and soybean markets rose on improving demand, on
USDA reports of slower planting progress in the U.S. and on smaller crop
yields from South America. The USDA also reported soybean supplies were
much lower than expected, which bolstered the markets. Cocoa prices fell
in anticipation the current ideal crop-growing conditions could cause a
potential surplus. Sugar markets rose on increased demand and continued
weak supplies.
Metals: Precious metals markets declined due to three factors: strength in
the U.S. dollar, strength in the equity markets and indications the Federal
Reserve may increase interest rates in the near term. Copper and base
metals prices moved lower amidst concerns over mounting debt and slowing
growth in China.
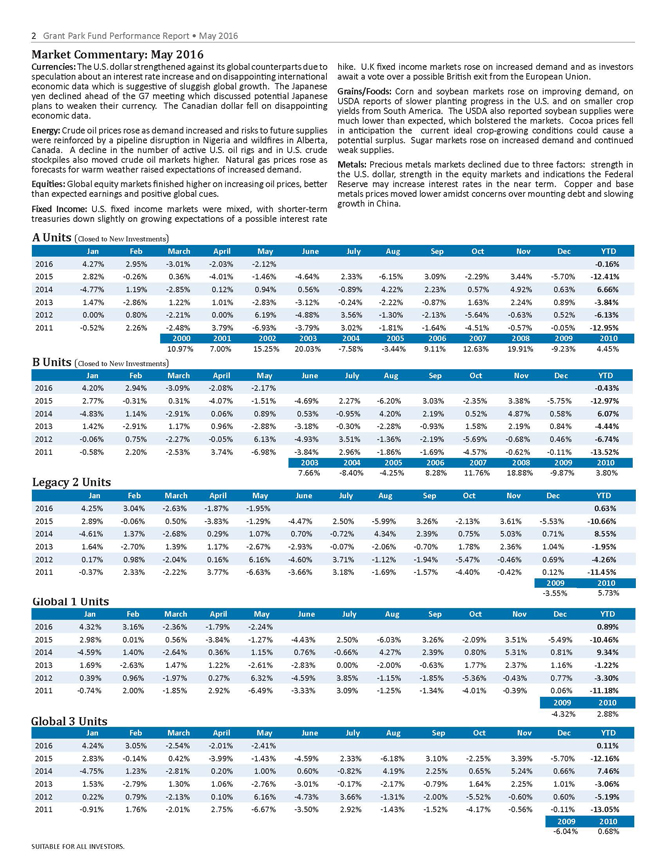
A Units
Jan Feb March April May June July Aug Sep Oct Nov Dec YTD
2016 4.27% 2.95% -3.01% -2.03% -2.12% -0.16%
2015 2.82% -0.26% 0.36% -4.01% -1.46% -4.64% 2.33% -6.15% 3.09% -2.29% 3.44% -5.70% -12.41%
2014 -4.77% 1.19% -2.85% 0.12% 0.94% 0.56% -0.89% 4.22% 2.23% 0.57% 4.92% 0.63% 6.66%
2013 1.47% -2.86% 1.22% 1.01% -2.83% -3.12% -0.24% -2.22% -0.87% 1.63% 2.24% 0.89% -3.84%
2012 0.00% 0.80% -2.21% 0.00% 6.19% -4.88% 3.56% -1.30% -2.13% -5.64% -0.63% 0.52% -6.13%
2011 -0.52% 2.26% -2.48% 3.79% -6.93% -3.79% 3.02% -1.81% -1.64% -4.51% -0.57% -0.05% -12.95%
2000 2001 2002 2003 2004 2005 2006 2007 2008 2009 2010
(Closed to New Investments)10.97% 7.00% 15.25% 20.03% -7.58% -3.44% 9.11% 12.63% 19.91% -9.23% 4.45%
B Units
Jan Feb March April May June July Aug Sep Oct Nov Dec YTD
2016 4.20% 2.94% -3.09% -2.08% -2.17% -0.43%
2015 2.77% -0.31% 0.31% -4.07% -1.51% -4.69% 2.27% -6.20% 3.03% -2.35% 3.38% -5.75% -12.97%
2014 -4.83% 1.14% -2.91% 0.06% 0.89% 0.53% -0.95% 4.20% 2.19% 0.52% 4.87% 0.58% 6.07%
2013 1.42% -2.91% 1.17% 0.96% -2.88% -3.18% -0.30% -2.28% -0.93% 1.58% 2.19% 0.84% -4.44%
2012 -0.06% 0.75% -2.27% -0.05% 6.13% -4.93% 3.51% -1.36% -2.19% -5.69% -0.68% 0.46% -6.74%
2011 -0.58% 2.20% -2.53% 3.74% -6.98% -3.84% 2.96% -1.86% -1.69% -4.57% -0.62% -0.11% -13.52%
2003 2004 2005 2006 2007 2008 2009 2010
7.66% -8.40% -4.25% 8.28% 11.76% 18.88% -9.87% 3.80%
Legacy 2 Units
Jan Feb March April May June July Aug Sep Oct Nov Dec YTD
2016 4.25% 3.04% -2.63% -1.87% -1.95% 0.63%
2015 2.89% -0.06% 0.50% -3.83% -1.29% -4.47% 2.50% -5.99% 3.26% -2.13% 3.61% -5.53% -10.66%
2014 -4.61% 1.37% -2.68% 0.29% 1.07% 0.70% -0.72% 4.34% 2.39% 0.75% 5.03% 0.71% 8.55%
2013 1.64% -2.70% 1.39% 1.17% -2.67% -2.93% -0.07% -2.06% -0.70% 1.78% 2.36% 1.04% -1.95%
2012 0.17% 0.98% -2.04% 0.16% 6.16% -4.60% 3.71% -1.12% -1.94% -5.47% -0.46% 0.69% -4.26%
2011 -0.37% 2.33% -2.22% 3.77% -6.63% -3.66% 3.18% -1.69% -1.57% -4.40% -0.42% 0.12% -11.45%
2009 2010
-3.55% 5.73%
Global 1 Units
Jan Feb March April May June July Aug Sep Oct Nov Dec YTD
2016 4.32% 3.16% -2.36% -1.79% -2.24% 0.89%
2015 2.98% 0.01% 0.56% -3.84% -1.27% -4.43% 2.50% -6.03% 3.26% -2.09% 3.51% -5.49% -10.46%
2014 -4.59% 1.40% -2.64% 0.36% 1.15% 0.76% -0.66% 4.27% 2.39% 0.80% 5.31% 0.81% 9.34%
2013 1.69% -2.63% 1.47% 1.22% -2.61% -2.83% 0.00% -2.00% -0.63% 1.77% 2.37% 1.16% -1.22%
2012 0.39% 0.96% -1.97% 0.27% 6.32% -4.59% 3.85% -1.15% -1.85% -5.36% -0.43% 0.77% -3.30%
2011 -0.74% 2.00% -1.85% 2.92% -6.49% -3.33% 3.09% -1.25% -1.34% -4.01% -0.39% 0.06% -11.18%
2009 2010
Global 3 Units -4.32% 2.88%
Jan Feb March April May June July Aug Sep Oct Nov Dec YTD
2016 4.24% 3.05% -2.54% -2.01% -2.41% 0.11%
2015 2.83% -0.14% 0.42% -3.99% -1.43% -4.59% 2.33% -6.18% 3.10% -2.25% 3.39% -5.70% -12.16%
2014 -4.75% 1.23% -2.81% 0.20% 1.00% 0.60% -0.82% 4.19% 2.25% 0.65% 5.24% 0.66% 7.46%
2013 1.53% -2.79% 1.30% 1.06% -2.76% -3.01% -0.17% -2.17% -0.79% 1.64% 2.25% 1.01% -3.06%
2012 0.22% 0.79% -2.13% 0.10% 6.16% -4.73% 3.66% -1.31% -2.00% -5.52% -0.60% 0.60% -5.19%
2011 -0.91% 1.76% -2.01% 2.75% -6.67% -3.50% 2.92% -1.43% -1.52% -4.17% -0.56% -0.11% -13.05%
2009 2010
-6.04% 0.68%
ALL PERFORMANCE REPORTED IS NET OF FEES AND EXPENSES. PAST PERFORMANCE IS NOT INDICATIVE OF FUTURE RESULTS. FUTURES TRADING INVOLVES A HIGH DEGREE OF RISK AND IS NOT
SUITABLE FOR ALL INVESTORS.
Grant Park Fund Performance Report • May 2016 3
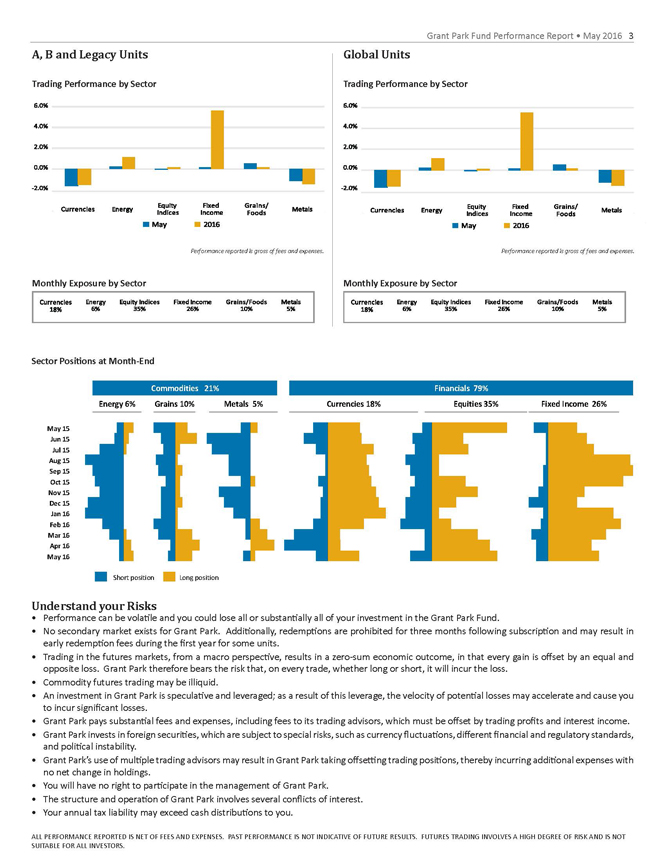
A, B and Legacy Units Global Units
Trading Performance by Sector Trading Performance by Sector
Performance reported is gross of fees and expenses. Performance reported is gross of fees and expenses.
Monthly Exposure by Sector Monthly Exposure by Sector
Sector Positions at Month-End
Commodities 21% Financials 79%
Energy 6% Grains 10% Metals 5% Currencies 18% Equities 35% Fixed Income 26%
May 15 Jun 15 Jul 15 Aug 15 Sep 15 Oct 15 Nov 15 Dec 15 Jan 16 Feb 16 Mar 16 Apr 16 May 16
Short position Long position
Understand • Performance can your be Risks volatile and you could lose all or substantially all of your investment in the Grant Park Fund.
No secondary market exists for Grant Park. Additionally, redemptions are prohibited for three months following subscription and may result in early redemption fees during the first year for some units.
Trading in the futures markets, from a macro perspective, results in a zero-sum economic outcome, in that every gain is offset by an equal and opposite loss. Grant Park therefore bears the risk that, on every trade, whether long or short, it will incur the loss.
Commodity futures trading may be illiquid.
An investment in Grant Park is speculative and leveraged; as a result of this leverage, the velocity of potential losses may accelerate and cause you to incur significant losses.
Grant Park pays substantial fees and expenses, including fees to its trading advisors, which must be offset by trading profits and interest income.
Grant Park invests in foreign securities, which are subject to special risks, such as currency fluctuations, different financial and regulatory standards, and political instability.
Grant Park’s use of multiple trading advisors may result in Grant Park taking offsetting trading positions, thereby incurring additional expenses with no net change in holdings.
You will have no right to participate in the management of Grant Park.
The structure and operation of Grant Park involves several conflicts of interest.
Your annual tax liability may exceed cash distributions to you.
ALL PERFORMANCE REPORTED IS NET OF FEES AND EXPENSES. PAST PERFORMANCE IS NOT INDICATIVE OF FUTURE RESULTS. FUTURES TRADING INVOLVES A HIGH DEGREE OF RISK AND IS NOT SUITABLE FOR ALL INVESTORS.
4 Grant Park Fund Performance Report • May 2016
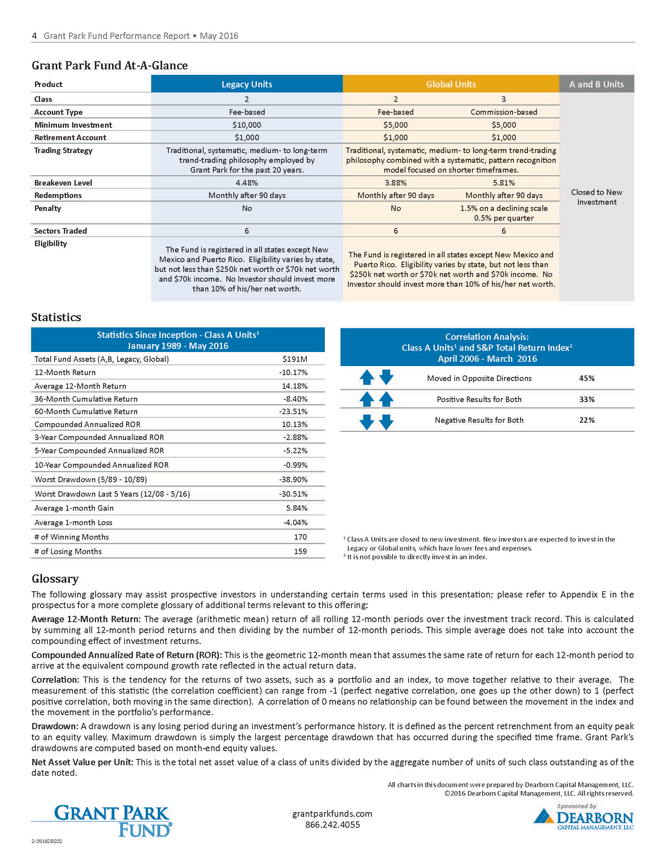
Grant Park Fund At-A-Glance
Product Legacy Units Global Units A and B Units
Class 2 2 3
Account Type Fee-based Fee-based Commission-based
Minimum Investment $10,000 $5,000 $5,000
Retirement Account $1,000 $1,000 $1,000
Trading Strategy Traditional, systematic, medium- to long-term trend-trading philosophy employed by Grant Park for the past 20 years. Traditional, systematic, medium- to long-term trend-trading philosophy combined with a systematic, pattern recognition model focused on shorter timeframes.
Breakeven Level 4.48% 3.88% 5.81%
Redemptions Monthly after 90 days Monthly after 90 days Monthly after 90 days Closed to New
Penalty No No 1.5% on a declining scale 0.5% per quarter Investment
Sectors Traded 6 6 6
Eligibility The Fund is registered in all states except New Mexico and Puerto Rico. Eligibility varies by state, but not less than $250k net worth or $70k net worth and $70k income. No Investor should invest more than 10% of his/her net worth. The Fund is registered in all states except New Mexico and Puerto Rico. Eligibility varies by state, but not less than $250k net worth or $70k net worth and $70k income. No Investor should invest more than 10% of his/her net worth.
Statistics
Statistics Since Inception—Class A Units1
January 1989—May 2016
Total Fund Assets (A,B, Legacy, Global) $191M
12-Month Return -10.17%
Average 12-Month Return 14.18%
36-Month Cumulative Return -8.40%
60-Month Cumulative Return -23.51%
Compounded Annualized ROR 10.13%
3-Year Compounded Annualized ROR -2.88%
5-Year Compounded Annualized ROR -5.22%
10-Year Compounded Annualized ROR -0.99%
Worst Drawdown (5/89—10/89) -38.90%
Worst Drawdown Last 5 Years (12/08—5/16) -30.51%
Average 1-month Gain 5.84%
Average 1-month Loss -4.04%
# of Winning Months 170
# of Losing Months 159
Correlation Analysis:
Class A Units1 and S&P Total Return Index2
April 2006—March 2016
Moved in Opposite Directions 45%
Positive Results for Both 33%
Negative Results for Both 22%
1 Class A Units are closed to new investment. New investors are expected to invest in the Legacy or Global units, which have lower fees and expenses.
2 It is not possible to directly invest in an index.
Glossary
The following glossary may assist prospective investors in understanding certain terms used in this presentation; please refer to Appendix E in the prospectus for a more complete glossary of additional terms relevant to this offering: Average 12-Month Return: The average (arithmetic mean) return of all rolling 12-month periods over the investment track record. This is calculated by summing all 12-month period returns and then dividing by the number of 12-month periods. This simple average does not take into account the compounding effect of investment returns.
Compounded Annualized Rate of Return (ROR): This is the geometric 12-month mean that assumes the same rate of return for each 12-month period to arrive at the equivalent compound growth rate reflected in the actual return data. Correlation: This is the tendency for the returns of two assets, such as a portfolio and an index, to move together relative to their average. The measurement of this statistic (the correlation coefficient) can range from -1 (perfect negative correlation, one goes up the other down) to 1 (perfect positive correlation, both moving in the same direction). A correlation of 0 means no relationship can be found between the movement in the index and the movement in the portfolio’s performance. Drawdown: A drawdown is any losing period during an investment’s performance history. It is defined as the percent retrenchment from an equity peak to an equity valley. Maximum drawdown is simply the largest percentage drawdown that has occurred during the specified time frame. Grant Park’s drawdowns are computed based on month-end equity values.
Net Asset Value per Unit: This is the total net asset value of a class of units divided by the aggregate number of units of such class outstanding as of the date noted.
All charts in this document were prepared by Dearborn Capital Management, LLC. ©2016 Dearborn Capital Management, LLC. All rights reserved.
grantparkfunds.com
866.242.4055
2-0516DB232
DEARBORN
CAPITAL MANAGEMENT, LLC