Attached files
| file | filename |
|---|---|
| EX-32.2 - EX-32.2 - SMITH & WESSON BRANDS, INC. | swhc-ex322_14.htm |
| EX-32.1 - EX-32.1 - SMITH & WESSON BRANDS, INC. | swhc-ex321_15.htm |
| EX-31.2 - EX-31.2 - SMITH & WESSON BRANDS, INC. | swhc-ex312_10.htm |
| EX-31.1 - EX-31.1 - SMITH & WESSON BRANDS, INC. | swhc-ex311_8.htm |
| EX-23.2 - EX-23.2 - SMITH & WESSON BRANDS, INC. | swhc-ex232_9.htm |
| EX-23.1 - EX-23.1 - SMITH & WESSON BRANDS, INC. | swhc-ex231_7.htm |
| EX-21.1 - EX-21.1 - SMITH & WESSON BRANDS, INC. | swhc-ex211_13.htm |
UNITED STATES
SECURITIES AND EXCHANGE COMMISSION
Washington, D.C. 20549
Form 10-K
x ANNUAL REPORT PURSUANT TO SECTION 13 OR 15(d) OF THE SECURITIES EXCHANGE ACT OF 1934
For the fiscal year ended April 30, 2016
Commission file number 1-31552
SMITH & WESSON HOLDING CORPORATION
(Exact Name of Registrant as Specified in Its Charter)
|
Nevada |
|
87-0543688 |
|
(State or Other Jurisdiction of Incorporation or Organization) |
|
(I.R.S. Employer Identification No.) |
2100 Roosevelt Avenue
Springfield, Massachusetts 01104
(800) 331-0852
(Address including zip code, and telephone number,
including area code, of principal executive offices)
Securities registered pursuant to Section 12(b) of the Act:
|
(Title of Class) |
|
(Name of Each Exchange on Which Registered) |
|
Common Stock, Par Value $.001 per Share |
|
Nasdaq Global Select Market |
Securities registered pursuant to Section 12(g) of the Act:
None
Indicate by check mark if the registrant is a well-known seasoned issuer, as defined in Rule 405 of the Securities Act. Yes ¨ No x
Indicate by check mark if the registrant is not required to file reports pursuant to Section 13 or Section 15(d) of the Act. Yes ¨ No x
Indicate by check mark whether the registrant (1) has filed all reports required to be filed by Section 13 or 15(d) of the Securities Exchange Act of 1934 during the preceding 12 months (or for such shorter period that the registrant was required to file such reports), and (2) has been subject to such filing requirements for the past 90 days. Yes x No ¨
Indicate by check mark whether the registrant has submitted electronically and posted on its corporate Web site, if any, every Interactive Data File required to be submitted and posted pursuant to Rule 405 of Regulation S-T (§232.405 of this chapter) during the preceding 12 months (or for such shorter period that the registrant was required to submit and post such files). Yes x No ¨
Indicate by check mark if disclosure of delinquent filers pursuant to Item 405 of Regulation S-K (§229.405) is not contained herein, and will not be contained, to the best of registrant’s knowledge, in definitive proxy or information statements incorporated by reference in Part III of this Form 10-K or any amendment to this Form 10-K. x
Indicate by check mark whether the registrant is a large accelerated filer, an accelerated filer, a non-accelerated filer, or a smaller reporting company. See the definitions of “large accelerated filer,” “accelerated filer,” and “smaller reporting company” in Rule 12b-2 of the Exchange Act. (Check one):
|
Large accelerated filer |
|
x |
|
|
Accelerated filer |
|
¨ |
|
Non-accelerated filer |
|
¨ |
(Do not check if a smaller reporting company) |
|
Smaller reporting company |
|
¨ |
Indicate by check mark whether the registrant is a shell company (as defined in Rule 12b-2 of the Act). Yes ¨ No x
The aggregate market value of Common Stock held by non-affiliates of the registrant (53,608,394 shares) based on the last reported sale price of the registrant’s Common Stock on the Nasdaq Global Select Market on October 31, 2015, which was the last business day of the registrant’s most recently completed second fiscal quarter, was $957,445,917. For purposes of this computation, all officers, directors, and 10% beneficial owners of the registrant are deemed to be affiliates. Such determination should not be deemed to be an admission that such officers, directors, or 10% beneficial owners are, in fact, affiliates of the registrant.
As of June 14, 2016, there were outstanding 55,998,795 shares of the registrant’s Common Stock, par value $.001 per share.
Documents Incorporated by Reference
Portions of the registrant’s definitive proxy statement for the 2016 Annual Meeting of Stockholders are incorporated by reference into Part III of this Form 10-K.
SMITH & WESSON HOLDING CORPORATION
ANNUAL REPORT ON FORM 10-K
For the Fiscal Year Ended April 30, 2016
TABLE OF CONTENTS
|
|
|
|
|
Page |
|
|
|
PART I |
|
|
|
ITEM 1. |
|
|
1 |
|
|
ITEM 1A. |
|
|
13 |
|
|
ITEM 1B. |
|
|
26 |
|
|
ITEM 2. |
|
|
26 |
|
|
ITEM 3. |
|
|
27 |
|
|
ITEM 4. |
|
|
27 |
|
|
|
|
|
|
|
|
|
|
PART II |
|
|
|
ITEM 5. |
|
|
28 |
|
|
ITEM 6. |
|
|
30 |
|
|
ITEM 7. |
|
MANAGEMENT’S DISCUSSION AND ANALYSIS OF FINANCIAL CONDITION AND RESULTS OF OPERATIONS |
|
31 |
|
ITEM 7A. |
|
|
43 |
|
|
ITEM 8. |
|
|
43 |
|
|
ITEM 9. |
|
CHANGES IN AND DISAGREEMENTS WITH ACCOUNTANTS ON ACCOUNTING AND FINANCIAL DISCLOSURE |
|
43 |
|
ITEM 9A. |
|
|
44 |
|
|
ITEM 9B. |
|
|
46 |
|
|
|
|
|
|
|
|
|
|
PART III |
|
|
|
ITEM 10. |
|
|
46 |
|
|
ITEM 11. |
|
|
46 |
|
|
ITEM 12. |
|
SECURITY OWNERSHIP OF CERTAIN BENEFICIAL OWNERS AND MANAGEMENT AND RELATED STOCKHOLDER MATTERS |
|
46 |
|
ITEM 13. |
|
CERTAIN RELATIONSHIPS AND RELATED TRANSACTIONS, AND DIRECTOR INDEPENDENCE |
|
46 |
|
ITEM 14. |
|
|
46 |
|
|
|
|
|
|
|
|
|
|
PART IV |
|
|
|
ITEM 15. |
|
|
47 |
|
|
|
50 |
|||
|
|
F-1 |
|||
|
|
|
|
|
|
|
EX-21.1 |
|
|
|
|
|
EX-23.1 |
|
|
|
|
|
EX-23.2 |
|
|
|
|
|
EX-31.1 |
|
|
|
|
|
EX-31.2 |
|
|
|
|
|
EX-32.1 |
|
|
|
|
|
EX-32.2 |
|
|
|
|
Smith & Wesson®, S&W®, M&P®, Performance Center®, Bodyguard®, Governor®, SW22 Victory®, T/C®, America’s Master Gunmaker®, Contender®, Dimension®, Encore®, Triumph®, Caldwell®, Delta Series®, Wheeler ®, Tipton ®, Frankford Arsenal®, Lockdown®, BOG-POD® , Golden Rod®, and Hooyman® are some of the registered U.S. trademarks of our company or one of our subsidiaries. Thompson/Center ArmsTM, Compass™, Impact!™, T/C Strike™, M&P ShieldTM, T/C VentureTM, Smith & Wesson CONNECTTM, and Mag Charger™ are some of the unregistered trademarks of our company or one of our subsidiaries. This report also contains trademarks and trade names of other companies.
This report includes market and industry data that we obtained from periodic industry publications, third-party studies and surveys, government agency sources, filings of public companies in our industry, and internal company surveys. Industry publications and surveys generally state that the information contained therein has been obtained from sources believed to be reliable. Although we believe the foregoing industry and market data to be reliable at the date of the report, this information could prove to be inaccurate as a result of a variety of matters.
Statement Regarding Forward-Looking Information
The statements contained in this annual report on Form 10-K that are not purely historical are forward-looking statements within the meaning of applicable securities laws. Forward-looking statements include statements regarding our “expectations,” “anticipations,” “intentions,” “beliefs,” or “strategies” regarding the future. Forward-looking statements also include statements regarding our objectives, strategies, plans, and focus; net sales, margins, expenses, earnings, royalties, and capital expenditures for fiscal 2017 and thereafter; the amount of environmental and other reserves; estimates of fair value; goodwill and intangible assets; the effect of a variety of economic, social, and political factors on our business; the outcome of the lawsuits to which we are subject and their effect on us; future investments for capital expenditures; future products and product developments; the features and performance of our products; the success of particular product or marketing programs; any manufacturing partnerships, strategic alliances, or acquisitions we may enter into or make; future enterprise resource planning implementations and system improvements; future enhancements to our manufacturing capabilities; and liquidity and anticipated cash needs and availability. All forward-looking statements included in this report are based on information available to us as of the filing date of this report, and we assume no obligation to update any such forward-looking statements. Our actual results could differ materially from the forward-looking statements. Among the factors that could cause actual results to differ materially are the factors discussed under Item 1A, “Risk Factors.”
Introduction
We are one of the world’s leading manufacturers of firearms and a provider of quality accessory products for the shooting, hunting, and rugged outdoor enthusiast. We manufacture a wide array of handguns (including revolvers and pistols), long guns (including modern sporting rifles, bolt action rifles, and single shot rifles), handcuffs, and firearm-related products and accessories for sale to a wide variety of customers, including gun enthusiasts, collectors, hunters, sportsmen, competitive shooters, individuals desiring home and personal protection, law enforcement and security agencies and officers, and military agencies in the United States and throughout the world. We are one of the largest manufacturers of handguns, modern sporting rifles, and handcuffs in the United States and an active participant in the hunting rifle market. We are also a leading provider of shooting, hunting, and outdoor accessories, including reloading, gunsmithing, gun cleaning supplies, tree saws, and vault accessories. We sell our products under the Smith & Wesson, M&P, Thompson/Center Arms, Caldwell Shooting Supplies, Wheeler Engineering, Tipton Gun Cleaning Supplies, Frankford Arsenal Reloading Tools, Lockdown Vault Accessories, Hooyman Premium Tree Saws, BOG-POD, and Golden Rod Moisture Control brands.
We manufacture our firearm products at our facilities in Springfield, Massachusetts; Houlton, Maine; and Deep River, Connecticut; and we develop and market our accessories products at our facility in Columbia, Missouri. We plan to continue to capitalize on the goodwill developed through our historic 164 year old “Smith & Wesson” brand as well as our other well-known brands by expanding consumer awareness of the products we produce.
Our objective is to continue to enhance our position as one of the world’s leading firearm manufacturers and to become a leading provider of quality accessory products for the shooting, hunting, and rugged outdoor enthusiast. Key elements of our strategy to achieve this objective are as follows:
|
|
· |
develop, produce, and market high-quality, innovative products that meet the needs and desires of consumers and professionals; |
|
|
· |
protect and grow our core firearm business; |
|
|
· |
continue to expand our rapidly growing accessories business with the ongoing introduction of new products; |
|
|
· |
focus on profitable growth opportunities, including those in the shooting, hunting, and rugged outdoor markets; |
|
|
· |
streamline and standardize our business operations; |
|
|
· |
emphasize customer satisfaction and loyalty; and |
|
|
· |
expand our pursuit of strategic relationships and acquisitions that are synergistic with our current business, particularly through acquisitions of businesses involved in the shooting, hunting, and rugged outdoor markets. |
We estimate that the domestic non-military firearm market based on industry shipments is approximately $2.2 billion for handguns and $1.5 billion for long guns, excluding shotguns, with our market share in calendar 2015 being approximately 19% and 5%, respectively. According to 2014 reports by the U.S. Bureau of Alcohol, Tobacco, Firearms and Explosives, or ATF, the U.S. firearm manufacturing industry has grown at a compound annual growth rate in units of 10% from 2009 through 2014.
We estimate that the domestic firearm accessories and equipment market based on hunting-related expenditures is approximately $1.5 billion.
Our wholly owned subsidiary, Smith & Wesson Corp., was founded in 1852 by Horace Smith and Daniel B. Wesson. Mr. Wesson purchased Mr. Smith’s interest in 1873. The Wesson family sold Smith & Wesson Corp. to Bangor Punta Corp. in 1965. Lear Siegler Corporation purchased Bangor Punta in 1984, thereby acquiring ownership of Smith & Wesson Corp. Forstmann Little & Co. purchased Lear Siegler in 1986 and sold Smith & Wesson Corp. shortly thereafter to Tomkins Corporation, an affiliate of U.K.-based Tomkins PLC. We purchased Smith & Wesson Corp. from Tomkins in May 2001 and changed our name to Smith & Wesson Holding Corporation in February 2002.
On January 3, 2007, we acquired all of the outstanding capital stock of Thompson Center Holding Corporation and its subsidiaries, including Thompson/Center Arms Company, Inc. (now Thompson/Center Arms Company, LLC), or collectively TCA, which is a brand name recognized by hunting enthusiasts and which holds a leading position in the black powder segment of the long gun market. In addition, TCA possesses expertise in long gun barrel manufacturing, which is important to our manufacture of long
1
guns. TCA entered the bolt-action rifle market in June 2007 by launching internally developed new products with key differentiating features and benefits, such as certified accuracy, integral sight bases, and a three position safety.
On July 20, 2009, we acquired all of the outstanding capital stock of Universal Safety Response, Inc. (since renamed SWSS LLC, formerly Smith & Wesson Security Solutions, Inc. and referred to herein as SWSS). Based on a combination of factors occurring after the acquisition, including federal and corporate budgetary constraints, increased price competition, and a fundamental change in strategic direction, we completed the disposition of SWSS on July 26, 2012. The operating results of SWSS are classified as discontinued operations and are presented in a separate line in the consolidated statements of income for all periods presented. Reference is made to Note 4 to our consolidated financial statements for a discussion of discontinued operations. Prior to the decision to divest the business, we had reported this business as a separate division under the heading of security solutions. Unless otherwise indicated, amounts reported throughout this Form 10-K represent only our continuing operations.
Effective as of April 30, 2014, our manufacturing agreement with Carl Walther GmbH under which we produced the Walther PPK and PPK/S pistols in the United States at our Houlton, Maine facility expired. In addition, as of April 30, 2013, we did not extend our distribution agreement to serve as the exclusive U.S. importer and distributor of Walther firearms. Walther manufactures our full size M&P22 pistols and will continue to do so through the end of fiscal 2017.
On May 5, 2014, we acquired substantially all of the net assets of Tri-Town Precision Plastics, Inc., or TTPP, a provider of custom injection molding services, rapid prototyping, and tooling, which we refer to as the DRP Acquisition. TTPP was a long-standing supplier of polymer frames and related components for a large number of our firearms, including nearly all of our popular M&P models. The DRP Acquisition was designed to vertically integrate a key component of our manufacturing operations and provide us with increased flexibility within our supply chain.
On December 11, 2014, we acquired all of the issued and outstanding stock of Battenfeld Acquisition Company Inc., including its wholly owned subsidiary, Battenfeld Technologies, Inc., or BTI, a leading provider of hunting and shooting accessories, which we refer to as the BTI Acquisition. The BTI Acquisition was designed to allow us to expand our presence in the firearm accessories and rugged outdoor markets and leverage BTI’s broad portfolio of hunting and shooting accessories brands that are popular with consumers.
We maintain our principal executive offices at 2100 Roosevelt Avenue, Springfield, Massachusetts 01104. Our telephone number is (800) 331-0852. Our website is located at www.smith-wesson.com. Through our website, we make available free of charge our annual reports on Form 10-K, our proxy statements, our quarterly reports on Form 10-Q, our current reports on Form 8-K, and amendments to any of them filed or furnished pursuant to Section 13(a) or 15(d) of the Securities Exchange Act of 1934, as amended, or the Exchange Act. These documents are available as soon as reasonably practicable after we electronically file them with the Securities and Exchange Commission, or the SEC. We also post on our website the charters of our Audit, Compensation, and Nominations and Corporate Governance Committees; our Corporate Governance Guidelines, our Code of Conduct, and any amendments or waivers thereto; and any other corporate governance materials contemplated by the regulations of the SEC and the Nasdaq Global Select Market. The documents are also available in print by contacting our corporate secretary at our executive offices.
Strategy
Our objective is to continue to enhance our position as one of the world’s leading firearm manufacturers and to become a leading provider of quality accessory products for the shooting, hunting, and rugged outdoor markets. Key elements of our strategy to achieve this objective are as follows:
Develop, Produce, And Market High Quality, Innovative Products
We are focused on developing, producing, and marketing high-quality, innovative products that meet the needs and desires of consumers and professionals. Our ongoing research and development, product engineering, and marketing activities are critical components of our ability to develop, introduce, produce, and sell successful products.
Protect and Grow Our Core Firearm Business
We plan to protect and grow our core firearm business by continuing to enhance our presence in our existing domestic and international markets by capitalizing on our brands such as Smith & Wesson, M&P, and Thompson/Center Arms and introducing innovative new products. We continually seek to introduce new products to increase our current market share, especially in the polymer handgun market as represented by our M&P brand. In addition, the largest portion of our business historically resulted from the sale of handguns in the domestic sporting goods market. With the acquisition of Thompson/Center Arms in fiscal 2007 and the
2
introduction of our modern sporting rifles, we expanded our business into multiple segments of the long gun market. During the last two fiscal years, we have introduced numerous new handgun and long gun models, including our M&P22 Compact pistol; product extensions of our M&P9, M&P40, and M&P45 pistols; M&P10; non-laser M&P Bodyguard .380; Model 66 Combat Magnum revolver; and the Model 69 Magnum revolver. We plan to continue to introduce new firearm products in fiscal 2017.
Continue to Expand Our Rapidly Growing Accessories Business
We plan to continue to expand our rapidly growing accessories business with the ongoing introduction of new products that support the shooting, hunting, and rugged outdoor markets. We will continue to enhance our presence in our existing domestic and international markets as well as new markets, capitalizing on our brands such as Caldwell Shooting Supplies, Wheeler Engineering, Tipton Gun Cleaning Supplies, Thompson/Center Arms, Frankford Arsenal Reloading Tools, Lockdown Vault Accessories, Hooyman Premium Tree Saws, BOG-POD, and Golden Rod Moisture Control.
Focus on Profitable Growth Opportunities
We plan to focus on growth, but only in those areas that provide an acceptable rate of return, within the shooting, hunting, and rugged outdoor markets. In order to meet those profitability goals, we are primarily focused on leveraging existing products and introducing new products when appropriate. In addition, we are continuing our focus on capacity utilization, strategic pricing and marketing initiatives, flexible manufacturing, standardized process, and vertical integration for efficiency and scalability. With the acquisition of BTI in fiscal 2015, we expanded our business into the shooting accessories and rugged outdoor markets. During fiscal 2016, we introduced a variety of new shooting, hunting, and outdoor products, and we plan to continue to introduce new products in fiscal 2017.
Streamline and Standardize Our Business Operations
We are continuing our efforts to enhance our manufacturing productivity in terms of increased daily production quantities, increased operational availability of equipment, reduced machinery down time, extended machinery useful life, reduced overtime, increased efficiency, enhanced product quality, and expanded outsourcing. We plan to continue to seek gains in manufacturing efficiency and capacity to assure that we can meet customer demand for our most popular products. We also plan to continue to streamline and standardize our business, which includes investing in an integrated and configurable technology infrastructure in areas such as enterprise resource planning, or ERP, and compliance. During fiscal 2016, we continued to improve and enhance our ERP systems as we converted our Deep River, Connecticut facility to SAP, and we intend to continue investing in improving our systems in order to enhance our efficiency, improve information reporting, and strengthen internal controls. These system improvements include implementing SAP at our additional facilities if we believe such an implementation would help us achieve these objectives. We intend to convert our Columbia, Missouri facility to SAP in fiscal 2017.
Emphasize Customer Satisfaction and Loyalty
We plan to continue to emphasize customer satisfaction and loyalty by offering high-quality products and services on a timely and cost-effective basis and by offering customer service, training, and support. We regard our high quality, innovative products as the most important aspect of our customer satisfaction and loyalty, but we also offer customer service and support with various programs, such as toll free customer support numbers, email customer question and answer communication, broad service policies, and product warranties.
Expand Our Pursuit of Strategic Relationships and Acquisitions that are Synergistic with Our Current Business
We plan to expand our pursuit of strategic relationships and acquisitions that expand our manufacturing capabilities or are involved in the shooting, hunting, or rugged outdoor markets. For example, in fiscal 2015, the DRP Acquisition was designed for vertical integration and the BTI Acquisition was designed to allow us to expand our presence in the accessories and outdoors markets and to leverage BTI’s broad portfolio of hunting and shooting accessories brands. In addition, our strategic alliance with General Dynamics Ordnance and Tactical Systems is primarily designed to assist us in the pursuit of the U.S. Army’s Modular Handgun System solicitation.
3
Firearm Products and Services
General
Our firearm products combine our legacy of 164 years of American manufacturing and engineering expertise with modern technological advances. We strive to leverage our tradition of innovation in materials, performance, and engineering, along with our proven history of reliability, to produce feature-rich, safe, durable, accurate, and high-performing firearms that satisfy the needs of our broad range of customers. Our introduction of new firearm products is intended to enhance our competitive position and broaden our participation in the overall firearm market.
We have substantially enhanced the breadth and quality of our portfolio of firearm products over the years. We have always been a leader in the revolver market. The introduction of our popular M&P branded pistol in January 2005 resulted in our company becoming one of the leaders in the polymer pistol market serving both law enforcement agencies and the consumer sporting goods market. The launch of our M&P branded modern sporting rifle in January 2006 has enabled us to capture what we estimate is the leading share of the modern sporting rifle market. The addition of our Thompson/Center Arms brand of hunting firearms and interchangeable firearm systems into our product portfolio in January 2007 also enhanced our long gun barrel manufacturing capabilities for our modern sporting rifles. We currently participate in three categories of the long gun market: bolt action rifles, muzzleloaders, and modern sporting rifles; and both core categories of the handgun market, namely semi-automatic pistols and revolvers.
All of our firearms are currently sold under our Smith & Wesson, M&P, and Thompson/Center Arms brands. Our Performance Center offers specialized and enhanced models sold under the Smith & Wesson and M&P brands. Depending upon the product or service, our customers include distributors; federal, state, and municipal law enforcement agencies and officers; government and military agencies; businesses; retailers; and consumers.
Our product development strategy is to understand our customers’ needs and then design and develop products to uniquely meet those needs. Throughout the process, we test multiple concepts with firearm owners and potential purchasers. We compare these test results against a growing database of prior concepts to identify those with the greatest market potential. Additional market research is completed to optimize the desired features and benefits. While this development process is ongoing, our launch timing for new products depends on market conditions to maximize sales across the entire product portfolio. In fiscal 2016, we launched several new products and product line extensions under our Smith & Wesson, M&P, and Thompson/Center Arms brands as well as several new products from our Performance Center.
The demand for our concealed carry products continued to increase in fiscal 2016. We have capitalized on that demand by shipping our one millionth M&P Shield during fiscal 2016, less than four years since the product’s introduction in 2012. We also introduced a variety of new products in fiscal 2016 by expanding our M&P branded products to include new models with tritium night sights. In addition, we partnered with Crimson Trace to launch new M&P models with Crimson Trace green Laserguards on our M&P Bodyguard 380, M&P Shield, as well as our compact and full size M&P pistols.
Within our M&P branded products, we introduced the next generation models of our popular M&P modern sporting rifle series, including our center-fire and rimfire models. Our M&P®15 SPORT™ II is an opening price point modern sporting rifle and comes complete with a forward bolt assist and dust cover. Our M&P®15-22 SPORT™ series of .22LR rifles feature an enhanced M&P slim handguard with Magpul M-LOK accessory mounting capability and also includes Magpul MBUS front and rear sights as standard equipment.
In fiscal 2016, we expanded our Smith & Wesson branded products with the introduction of the newest generation .22LR target pistol, the SW22 Victory. This firearm is engineered as a modern interpretation of the classic target pistol. The SW22 Victory is a highly versatile, accurate, and affordable .22LR target pistol suitable for multiple sporting applications.
Our customers continue to demand premium firearms that provide a competitive edge in sport shooting and handgun hunting. Our Performance Center products are engineered and manufactured to meet this need with many custom features not found on our standard products, such as enhanced triggers for smoother trigger pull, ported barrels for better muzzle control, and specialty sights for quicker target acquisition. During fiscal 2016, we expanded our Performance Center M&P pistols with the introduction of our M&P Shield with factory ported slide and barrel, the M&P C.O.R.E with a factory threaded barrel, and our M&P full-size 9mm with a ported and threaded barrel. We also introduced our Performance Center M&P 15-22 SPORT that includes a two stage trigger, match grade barrel, new slim handguard with Magpul M-LOK mounting capability and Magpul MBUS folding sights.
We continued to focus on growing our bolt action rifle business while maintaining our leadership in muzzleloaders and interchangeable systems within our Thompson/Center Arms brand. In fiscal 2016, we introduced two new Thompson/Center Arms firearms: the Compass and the T/C Strike. The Compass is an opening price point bolt action rifle available in ten different calibers
4
that features a free floating, threaded barrel that is available in two lengths, as well as an adjustable trigger, and a removable rotary magazine. The Compass, as with all of our Thompson/Center Arms bolt action rifles, incorporates 5R rifling, which provides accuracy and bullet stability over multiple shots. Our T/C Strike is a muzzleloader that offers innovative features, such as a striker fire system, a breach system that allows the consumer to utilize different powder types, and a Stealth StrikerTM system that reduces the noise when the hammer is pulled back to cock the firearm. The primer adapter threads on our T/C Strike are on the outside of the barrel, thus preventing seized breech plugs and assisting in cleaning.
Our firearm business is seasonal with revenue generally peaking in our fourth fiscal quarter ending April 30 as a result of most industry events and distributor shows being scheduled during the early spring months. In addition, because of our operating schedule, which includes a summer and a winter shutdown of our firearm facilities, we have increased operating days during our fourth fiscal quarter, which allows our shipping and production volumes to exceed other quarters.
Our firearm net sales for the years ended April 30, 2016, 2015, and 2014 were $657.6 million, $531.2 million, and $626.6 million, respectively. Firearms gross profit for the years ended April 30, 2016, 2015, and 2014 totaled $261.2 million, $188.6 million, and $259.1 million, respectively. Total assets for our firearm business totaled $458.1 million and $345.3 million as of April 30, 2016 and 2015, respectively. Reference is made to our consolidated financial statements, commencing on page F-1 of this report, for more information regarding our firearm business.
Sales of our handguns accounted for $485.4 million in net sales, or 67.1% of our net sales, for the fiscal year ended April 30, 2016, $395.5 million in net sales, or 71.7% of our net sales, for the fiscal year ended April 30, 2015, and $423.0 million in net sales, or 67.5% of our net sales, for the fiscal year ended April 30, 2014. Sales of long guns accounted for $127.6 million in net sales, or 17.7% of our net sales, for the fiscal year ended April 30, 2016, $90.2 million in net sales, or 16.3% of our net sales, for the fiscal year ended April 30, 2015, and $155.3 million in net sales, or 24.8% of our net sales, for the fiscal year ended April 30, 2014. Sales of other products and services accounted for $44.6 million in net sales, or 6.2% of our net sales, for the fiscal year ended April 30, 2016, $45.0 million in net sales, or 8.2% of our net sales, for the fiscal year ended April 30, 2015, and $42.7 million in net sales, or 6.8% of our net sales, for the fiscal year ended April 30, 2014.
Handguns
We currently manufacture an extensive variety of handgun models that include revolvers and pistols. A revolver is a handgun with a cylinder that holds the ammunition in a series of rotating chambers that are successively aligned with the barrel of the firearm during each firing cycle. There are two general types of revolvers: single-action and double-action. To fire a single-action revolver, the hammer is pulled back to cock the firearm and align the cylinder before the trigger is pulled. To fire a double-action revolver, a single trigger pull advances the cylinder as it cocks and releases the hammer. A pistol is a handgun in which the ammunition chamber is an integral part of the barrel and which is fed ammunition from a magazine contained in the grip. The firing cycle ejects the spent casings and loads a new round into the chamber.
We have long been known as an innovator and a leader in the revolver market and most of our revolvers are currently marketed under the Smith & Wesson brand. We sell a wide range of sizes from small-frame, concealed carry revolvers used primarily for personal protection to large-frame revolvers used primarily for recreational and competitive sport shooting. Our extra-large frame revolvers are designed primarily to address the handgun-hunting market.
Our small-frame revolvers have been carried by law enforcement personnel and personal defense-minded citizens for 164 years. We hold a number of patents on various firearm applications, including the use of scandium, a material that possesses many of the same attributes as titanium but at a more reasonable cost. Our revolvers are available in a variety of models and calibers, with applications in virtually all professional and consumer markets.
We offer pistols under both our Smith & Wesson brand and our M&P brand. Our full size and compact M&P pistol products have been engineered with input from the professional users and are designed to offer performance, safety, and durability that meet the standards of global law enforcement and military personnel, as well as to contain features attractive to consumers. We believe that our M&P branded pistol products are the most ergonomic, feature-rich, and innovative products on the market today. Our range of full size and compact M&P pistol products are made with a polymer frame, a rigid stainless steel chassis, and a black, through-hardened corrosion resistant finished stainless steel barrel and slide for durability. Our M&P pistol products feature patented and easily changed palmswell grips in three sizes, allowing the user to customize grips in a matter of seconds; a passive trigger safety to prevent the pistol from firing if dropped; an enlarged trigger guard to accommodate gloved hands; a sear lever release that eliminates the need to press the trigger in order to disassemble the firearm; an ambidextrous slide stop and reversible magazine release to accommodate right- and left-handed shooters; an optional internal locking system and magazine safety; and a universal equipment rail to allow the addition of accessories, including lights and lasers.
5
In fiscal 2012, we launched the M&P Shield pistol to address the growing personal protection and concealed carry market. The M&P Shield features a slim concealable profile, 9mm and .40S&W calibers, and M&P ergonomics. We introduced additional M&P Shield models during fiscal 2016. We consider the M&P Shield pistol to be one of the most popular firearms in the market, having surpassed the one million unit shipment mark in fiscal 2016.
Our Performance Center has been providing specialized products and services for the most demanding shooting sports enthusiasts since 1990. To meet the requirements of law enforcement professionals, competitive shooters, collectors, and discriminating sport enthusiasts who demand superior firearm products, our Performance Center personnel conceptualize, engineer, and craft firearm products from the ground up. Our craftsmen, many of whom are actively involved in competitive shooting, are highly skilled and experienced gunsmiths. Performance Center products are offered under both the Smith & Wesson brand and the M&P brand and are typically made in limited production quantities, although we offer a number of catalog variations in order to enhance product availability.
Our “Classics” department makes it possible to own historic firearms that are manufactured today but modeled after original favorites, such as the Model 29, the firearm made famous by the movie character Dirty Harry. These firearms are newly crafted with designs that take advantage of some of the most famous and collectible guns that we have ever made. Our Classics department also makes commemorative firearms and employs master engravers to craft one-of-a-kind custom firearms. These custom-made applications reflect the skill and vision of the master engraver and the artistic expression of the owner. We offer a number of catalog variations of Classics and engraved Classics to our customers.
Long Guns
Our M&P branded modern sporting rifles are specifically designed to satisfy the functionality and reliability needs of global military, law enforcement, and security personnel. These long guns are also popular as hunting and sporting target rifles and are sold to consumers through our sporting good distributors, retailers, and dealers. We offer M&P modern sporting rifles in four different calibers (.22LR, 5.56mm NATO (.223), .300 Whisper, and .308 Winchester (7.62x51mm)) for multiple recreational and professional uses. We also offer upper assemblies so gun owners can easily modify their M&P to suit the needs and tasks of the various forms of sport shooting and hunting. Our broad product portfolio of modern sporting rifles includes a .22 caliber model, an opening price-point sport model, a hunting caliber for longer range effectiveness, and several models designed for the exclusive use of military and law enforcement agencies throughout the world.
We manufacture three lines of bolt-action rifles under our Thompson/Center Arms brand consisting of several models in each line. These long guns are offered in up to 15 different calibers. Bolt-action rifles operate by the cycling of a bolt handle that allows for both the loading and unloading of rounds via a magazine fed system. This design allows for multi-round capacity and a level of strength that permits larger calibers. Bolt action rifles are the most popular firearm among hunters because of their reputation for accuracy, reliability, and relatively light-weight design.
Under our Thompson/Center Arms brand, we also offer five lines of high-quality American-made single shot “black powder,” or “muzzleloader,” firearms. Ammunition for our black powder firearms are loaded through the muzzle rather than the breech, as is the case with conventional firearms. Our black powder firearms are highly accurate, dependable rifles configured with muzzleloading barrels for hunting. Black powder firearms are purchased by hunting enthusiasts, primarily for use during exclusive black powder hunting seasons for hunting big game, such as deer and elk.
We offer two models of interchangeable, single shot firearm systems that deliver numerous gun, barrel, caliber configurations, and finishes. These firearm systems can be purchased fully assembled or as frame assemblies that can be configured by the owner as a center-fire rifle, rim-fire rifle, shotgun, black powder firearm, or single-shot handgun for use across the entire range of big- and small-game hunting. As a result, a firearm owner can easily change barrels, stocks, and forends, resulting in “one gun for all seasons” that can be continuously modified to suit the needs and tasks of the owner for various forms of sport shooting and hunting.
Other Firearm Products and Services
Our other firearm products and services include the following:
Parts: We sell parts to support our firearm business. The major products include barrels and magazines that are manufactured at our facilities or purchased through third parties.
Handcuffs: We are one of the largest manufacturers of handcuffs and restraints in the United States. We fabricate these products from the highest grade carbon or stainless steel. Our patented Lever Lock cuffs offer a new, double-locking system for added security
6
and comfort, without extra tools or keys. Double heat-treated internal locks help prevent tampering and smooth ratchets allow for swift cuffing and an extra measure of safety. We have the ability to customize handcuffs to fit customer specifications.
Smith & Wesson Academy: Established in 1969, the Smith & Wesson Academy is the nation’s oldest private law enforcement training facility. The Smith & Wesson Academy has trained law enforcement personnel from all 50 states and more than 50 foreign countries. Classes are conducted at our facility in Springfield, Massachusetts or on location around the world. Through the Smith & Wesson Academy, we offer state-of-the-art-instruction designed to meet the training needs of law enforcement and security customers worldwide.
Specialty Services: We utilize our substantial capabilities in metal processing and finishing to provide services to third-party customers. Our services include forging, heat treating, finishing, plating, and plastic injection molding.
Licensing: Several of our registered trademarks, including the “S&W” logo, the script “Smith & Wesson”, the “M&P” logo, the script “Thompson/Center Arms”, and the script “Performance Center” are well known and have a reputation for quality, value, and trustworthiness. As a result, we license our trademarks to third parties for use in connection with their products and services. Products of our licensees are distributed throughout the world. As of April 30, 2016, we licensed our trademarks to 10 different companies that market and sell products complementing our products, four less than in fiscal 2015. Three of these license agreements were cancelled as a result of our accessories division being able to source, produce, and market the same products.
Accessories Products
We are a leading provider of shooting, hunting, reloading, gunsmithing, and gun cleaning supplies and accessories. We develop, produce, and deliver innovative, high-quality products under several brands. We offer an extensive array of products, including shooting and field rests, gunsmithing tools, gun vises, hearing protection, ammo tumblers, and vault accessories. Since 2011, we have introduced over 300 variations of accessories products and we currently hold over 40 patents. Our accessories business has grown primarily through organic initiatives focusing on new product introductions each year as well as through strategic acquisitions. Our brand portfolio includes the highly regarded Caldwell line of shooting supplies, which has provided shooting accessories for more than 14 years. We also sell products under other brand names, including Wheeler Engineering, Tipton Gun Cleaning Supplies, Frankford Arsenal Reloading Tools, Lockdown Vault Accessories, Hooyman Premium Tree Saws, BOG-POD, and Golden Rod Moisture Control.
Our accessories net sales for the year ended April 30, 2016 were $65.3 million. For the period from December 11, 2014, the date of the BTI Acquisition, to April 30, 2015, net sales of our accessories products were $20.6 million, and accessories gross profit for the year ended April 30, 2016 and 2015 totaled $32.6 million and $6.4 million, respectively.
Marketing, Sales, and Distribution
General
We go to market in three primary ways in our firearm division: two-step distribution, strategic retailers, and buying groups consisting of certain large, regional retailers utilizing a direct sales force to service these customers. We also sell firearms directly to law enforcement agencies. In our accessories division, we go to market through two-step distribution, strategic retailers, and direct-to-dealer sales utilizing a combination of direct sales and sales representatives. We make our overseas sales primarily through distributors, which in turn sell to retail stores and government agencies. Our top five commercial distributors in the United States accounted for a total of 34.1% and 34.3%, respectively, of our net sales for the fiscal years ended April 30, 2016 and 2015. Those commercial distributors are not regional and have many of the same dealer customers. Therefore, we believe that the loss of one or more of the distributors would not materially impact sales, as the remaining distributors would be allocated additional sales.
We market our products to consumers primarily through independent dealers, large retailers, in-store retail channels, and range operations utilizing consumer-focused product marketing and promotional campaigns, which include print, broadcast, and digital advertising campaigns; social and electronic media; and in-store retail merchandising systems and strategies. We are also an industry leader in vertical print media as gauged by our regular tracking of editorial coverage in numerous outdoor magazines, including such leaders as Guns & Ammo, American Rifleman, Shooting Times, American Handgunner, Shooting Illustrated, Outdoor Life, American Hunter, and Field & Stream. We also sponsor numerous outdoor television and radio programs that generate significant editorial exposure.
We sponsor a significant number of firearm safety, shooting, and hunting events and organizations. We print various product catalogs that are distributed to our dealers and mailed directly, on a limited basis, to consumers. We also attend various trade shows,
7
such as the Shooting, Hunting, Outdoor Trade (SHOT) Show, the NRA Annual Meeting & Exhibits, the National Association of Sporting Goods Wholesalers Show, the International Association of Chiefs of Police Show, the AUSA Show, the IWA Show in Europe, and various distributor, buying group, and consumer shows.
For the fiscal years ended April 30, 2016, 2015, and 2014, advertising and promotion expenses amounted to $21.8 million, $20.2 million, and $19.5 million, respectively, excluding the cost of rebates and promotions reflected in gross profit.
We sell our products worldwide. International sales accounted for 3%, 4%, and 3% of our net sales for the fiscal years ended April 30, 2016, 2015, and 2014, respectively. Our firearm business had no assets located outside the United States during any of the periods presented; our accessories business owns tooling that is located at various suppliers in Asia.
E-Marketing
We utilize our www.smith-wesson.com, www.tcarms.com, and www.btibrands.com websites to market our products and services and to provide a wide range of information regarding our company to customers, consumers, dealers, distributors, investors, and government and law enforcement agencies worldwide. We utilize e-marketing, including social and digital marketing such as Facebook, Twitter, YouTube, and e-blasts to our consumer and trade customers to provide additional product and service information to such customers.
Retail
We operate online retail stores from which we sell hunting and shooting accessories under the Smith & Wesson, M&P, Thompson/Center Arms, Caldwell, Wheeler, Tipton, Frankford Arsenal, Lockdown, Hooyman, BOG-POD, and Golden Rod branded products, apparel, and related hunting and shooting supplies. Firearms are not sold through the online retail stores.
Service and Support
Our firearm division operates a toll free customer service number from 8:00 a.m. to 8:00 p.m. Eastern Time, Monday through Friday, and offers a customer service e-mail option to answer questions and resolve issues regarding our firearm products. In addition, we offer a limited one year warranty program and a lifetime service policy under which we repair defects in material or workmanship in our firearm products without charge for as long as the original purchaser owns the firearm. We also maintain a number of authorized warranty centers throughout the world and provide both warranty and charge repair services at our facilities.
Our accessories division operates a toll free customer service number from 8:00 a.m. to 5:00 p.m. Central Time, Monday through Friday to answer questions and resolve issues regarding our accessories products. We offer a limited one year or a limited lifetime warranty program to the original purchaser of our accessories products, depending on the product purchased.
Manufacturing
We have three manufacturing facilities for our firearm products: a 575,000 square-foot facility located in Springfield, Massachusetts; a 38,000 square-foot facility located in Houlton, Maine; and a 150,000 square-foot facility located in Deep River, Connecticut. We conduct our handgun and long gun manufacturing and most of our specialty service activities at our Springfield facility. We historically utilized our Houlton facility for the production of metal pistols, handcuffs, and other restraint devices, but in fiscal 2015, our Houlton facility was converted into a machining center and all its assembly, finishing, and small parts operations were transferred to our Springfield facility. We continue to produce handcuffs and other restraint devices at our Houlton facility. Our Deep River facility is utilized for custom plastic injection molding services, rapid prototyping, and tooling. We have a 145,000 square-foot warehousing and assembly facility for our accessories products located in Columbia, Missouri. All of our facilities are ISO 9001 certified. In addition, we source a significant portion of the shooting, hunting, and outdoor accessories that we sell from third-party contract manufacturers including those located in Asia.
We perform most of the machining and all of the assembly, inspection, and testing of the firearms manufactured at our facilities. Every firearm is test fired before shipment. Our major firearm components are cut by computer-assisted machines, and we employ sophisticated automated testing equipment to assist our skilled employees to ensure the proper functioning of our firearms. Our Springfield and Houlton facilities are currently operating on two shift patterns; a four shift, 168 hour per week schedule and a three shift, 120 hour per week schedule. We seek to minimize inventory costs through an integrated planning and production system. During fiscal 2014, we transitioned to a new ERP system in our Springfield and Houlton facilities to SAP, and we transitioned our Deep River facility to SAP during fiscal 2016. We intend to continue investing in improving our systems in order to enhance efficiency, improve information reporting, and strengthen internal controls. We also intend to convert our Columbia, Missouri facility to SAP in fiscal 2017.
8
Suppliers
Although we manufacture most of the components for our firearms, we purchase certain components and parts, including bolt carriers, rifle receivers, magazines, slides, small parts, barrels, and rifle stocks, from third parties. We also purchase ammunition for product testing. Most of our major suppliers for our firearm-division products are U.S.-based and provide materials, components, and parts, such as raw steel, polymer components, and metal-injected-molded components. The costs of these materials, components, and parts are at competitive rates. We have become increasingly dependent on a small number of key vendors that supply components and parts for our firearms as a result of our decision to enhance our manufacturing flexibility by using third parties that can supplement our internal capacity to better react to changes in market conditions. We also use numerous raw materials, such as steel, wood, lead, brass, and plastics, in producing and testing our products. We have alternative sources for these raw materials. Most of our major suppliers for our accessories-division products are based in Asia.
Research and Development; New Product Introductions
Through our advanced products engineering departments, we enhance existing products and develop new firearm and accessories products. In fiscal 2016, 2015, and 2014, our gross spending on research activities relating to the development of new products was $10.0 million, $6.9 million, and $5.6 million, respectively. As of April 30, 2016, we had 56 employees at our Springfield, Massachusetts and Columbia, Missouri facilities engaged in ongoing research and development activities for both our firearm and accessories products as part of their responsibilities.
Patents, Trademarks, and Copyrights
We recognize the importance of innovation and the importance of protecting our intellectual property. Accordingly, we own numerous patents related to our firearm, handcuff, and accessories products. We apply for patents whenever we develop new products or processes deemed commercially viable. We do not believe that our business is materially dependent on any single patent.
Because of the significance of our brand names, trademarks, trade dress, and copyrights also are important to our business. We have an active global program of trademark registration, monitoring, and enforcement. We believe that our SMITH & WESSON and S&W monogram trademarks, as well as our M&P and Thompson/Center Arms brands are known and recognized by the public worldwide and are important to our business. In addition, we market our accessories products under several brand names, including Caldwell Shooting Supplies, Wheeler Engineering, Tipton Gun Cleaning Supplies, Frankford Arsenal Reloading Tools, Lockdown Vault Accessories, Hooyman Premium Tree Saws, BOG-POD, and Golden Rod Moisture Control, among others.
We intend to vigorously pursue and challenge infringements of our patents, trademarks, trade dress, copyrights, and service marks, as we believe the goodwill associated with them is a cornerstone of our branding and licensing strategy.
Competition
The firearm industry is dominated by a small number of well-known companies. We encounter competition from both domestic and foreign manufacturers. Some competitors manufacture a wide variety of firearms as we do, while the majority of our competitors manufacture only certain types of firearms. We are one of the largest manufacturers of handguns, modern sporting rifles, and handcuffs in the United States and an active participant in the hunting rifle market. We compete primarily based upon innovation, quality, reliability, durability, price, performance, consumer brand awareness, and customer service and support. Our customer service organization is proactive in offering timely responses to customer inquiries. We believe we can effectively compete with all our present competitors.
Our primary competitors are Ruger and Taurus in the revolver market and Glock, Ruger, Sig Sauer, and Springfield Armory in the pistol market. We compete primarily with Colt, Sig Sauer, Ruger, Bushmaster, Daniel Defense, and DPMS in the modern sporting rifle market and Browning, Marlin, Remington, Ruger, Savage, Weatherby, CVA, Traditions, and Winchester in the hunting rifle market.
Peerless Handcuff Company is the only major handcuff manufacturer with significant market share in the United States that directly competes with us. As a result of competitive foreign pricing, we sell nearly 90% of our handcuffs and restraints in the United States.
Our competitors in the accessories market are not as clearly defined as the firearms market because of the broad range of brand names and products. Our primary competitor in the accessories market is Vista Outdoors. Other notable competitors to our accessories brands include Hyskore, Hornady, Laserlyte, Lyman, Birchwood Casey, and MTM Case-Gard.
9
Customers
We sell our firearm products and services through a variety of federally licensed distribution channels. Depending upon the product or service, our firearm customers include distributors; federal, state, and municipal law enforcement agencies and officers; government and military agencies; businesses; retailers; and consumers. Our accessories customers are generally businesses, retailers, and consumers. The ultimate users of our firearm and accessories products include shooting and outdoor enthusiasts, collectors, sportsmen, competitive shooters, hunters, individuals desiring home and personal protection, law enforcement and military personnel and agencies, and other government organizations.
During fiscal 2016, 6.5% of our firearm net sales were to state and local law enforcement agencies and the federal government, 3.1% of our firearm net sales were to international customers; and the remaining 90.4% of our firearm net sales were through federal firearm licensees to domestic consumers. Our domestic firearm net sales are primarily made to distributors that sell to licensed dealers that in turn sell to the end users. In some cases, we sell directly to large retailers and dealers.
Net sales of our accessories products during fiscal 2016 were 6.6% to international customers and 93.4% to domestic customers.
We grant payment terms to most commercial customers ranging from 30 to 90 days. However, in some instances, we provide longer payment terms, particularly as it relates to our hunting dating programs.
Governmental Regulations
Our firearm business is primarily regulated by the ATF, which licenses the manufacture, sale, and import of firearms in the United States. The ATF conducts periodic audits of our firearm facilities. The U.S. Department of State currently oversees the export of firearms, and we must obtain an export permit for all international firearm shipments.
There are also various state laws, regulations, and local ordinances relating to firearm characteristics, features, and sales, as well as firearm magazine capacities. Local firearm dealers must comply with state and local laws, regulations, and ordinances pertaining to firearms and magazine sales within their jurisdictions. We manufacture several firearm models and magazines with various capacities that comply with those laws, regulations, and ordinances for sales in those states and localities. In Massachusetts, for example, there are regulations related to the weight of the trigger pull, barrel length, material strength, and independent testing of handguns. California, Connecticut, Maryland, New Jersey, and New York, as well as other states, the District of Columbia, and other localities, have similar laws, ordinances, and restrictions. In addition, California requires new pistols to contain a microstamping mechanism, which must be able to etch or imprint, in two locations, a microstamp array of characters that identify the make, model, and serial number of the pistols onto each cartridge case when the pistol is fired. No commercially produced firearm has utilized the microstamping process, which is considered by many to be unfeasible, and we have no plans to utilize any microstamping feature in our firearms. Therefore, we will not sell into the state of California any pistol that is subject to the microstamping feature requirement.
Warnings and instructions concerning the safe operation of our firearms are contained in Safety & Instruction Manuals included in all boxes in which firearms are shipped and are also available for download from our Smith & Wesson and Thompson/Center Arms websites.
Our accessories business is subject to various standard business regulations that apply to all companies whose products are used by consumers.
Environmental Health and Safety
We are subject to numerous federal, state, and local laws that regulate both the health and safety of our workforce as well as our environmental liability, including, but not limited to, those regulations monitored by the Occupational Health and Safety Administration (OSHA), the National Fire Protection Association, and the Department of Public Health. Though not exhaustive, examples of applicable regulations include confined space safety, walking and working surfaces, machine guarding, and life safety.
We are required to comply with regulations that mitigate any release into the environment. These laws require us to make significant expenditures of both a capital and expense nature. Several of the more significant federal laws applicable to our operations include the Clean Air Act; the Clean Water Act; the Comprehensive Environmental Response, Compensation and Liability Act, or CERCLA; and the Solid Waste Disposal Act, as amended by the Resource Conservation and Recovery Act, or RCRA.
We are required to remediate hazardous waste at our facilities. Currently, we own a designated site in Springfield, Massachusetts that contains two release areas, which are the focus of remediation projects as part of the Massachusetts Contingency Plan, or MCP. The MCP provides a structured environment for the voluntary remediation of regulated releases. We may be required to
10
remove hazardous waste or remediate the alleged effects of hazardous substances on the environment associated with past disposal practices at sites not owned by us. We have received notice that we are a potentially responsible party from the Environmental Protection Agency and/or individual states under CERCLA or a state equivalent at two sites.
In our efforts to satisfy our environmental responsibilities and to comply with environmental laws and regulations, we have established, and periodically update, policies relating to the environmental standards of performance for our operations. We have in place programs that monitor compliance with various federal, state, and local environmental regulations. However, in the normal course of our manufacturing operations, we are subject to governmental proceedings and orders pertaining to waste disposal, air emissions, and water discharges from our operations into the environment. We regularly incur substantial capital and operating costs to comply with environmental laws, including remediation of known environmental conditions at our main facility in Springfield, Massachusetts, which we fund through cash flows from operations. We spent $782,000 in fiscal 2016 on environmental compliance, consisting of $474,000 for disposal fees and containers, $224,000 for remediation, $49,000 for DEP analysis and fees, and $35,000 for air filtration maintenance. Although we have potential liability with respect to the future remediation of certain pre-existing sites, we believe that we are in compliance with applicable material environmental laws, regulations, and permits.
In the normal course of our business, we may become involved in various proceedings relating to environmental health and safety matters, and we are currently engaged in an environmental investigation and remediation. Our manufacturing facilities are located on properties with a long history of industrial use, including the use of hazardous substances. We have identified soil and groundwater contamination at our Springfield, Massachusetts plant that we are investigating, monitoring, or remediating, as appropriate. As of April 30, 2016, we had recorded a $694,000 environmental reserve in non-current liabilities. Our estimate of these costs is based upon currently enacted laws and regulations, currently available facts, experience in remediation efforts, existing technology, and the ability of other potentially responsible parties or contractually liable parties to pay the allocated portions of any environmental obligations.
When the available information is sufficient to estimate the amount of liability, that estimate has been used; when the information is only sufficient to establish a range of probable liability and no point within the range is more likely than any other, the lower end of the range has been used. We may not have insurance coverage for our environmental remediation costs. We have not recognized any gains from probable recoveries or other gain contingencies. We calculated the environmental reserve using undiscounted amounts based on independent environmental remediation reports obtained.
On May 5, 2014, we acquired substantially all of the net assets of TTPP for $22.8 million, plus a $1.0 million working capital adjustment, for a total purchase price of $23.8 million, utilizing cash on hand. Under the asset purchase agreement, the former stockholder of TTPP indemnified us for losses arising from, among other things, environmental conditions related to its manufacturing activities. Of the purchase price, $3.0 million was placed in an escrow account, of which $250,000 remains available. A portion of the remaining escrow account will be applied to environmental remediation at the manufacturing site in Deep River, Connecticut. We believe the likelihood of environmental remediation costs exceeding the amount available in escrow to be remote.
Based on information known to us, we do not expect current environmental regulations or environmental proceedings and claims to have a material adverse effect on our consolidated financial position, results of operations, or cash flows. However, it is not possible to predict with certainty the impact on us of future environmental compliance requirements or of the cost of resolution of future environmental health and safety proceedings and claims, in part because the scope of the remedies that may be required is not certain, liability under federal environmental laws is joint and several in nature, and environmental laws and regulations are subject to modification and changes in interpretation. There can be no assurance that additional or changing environmental regulation will not become more burdensome in the future and that any such development would not have a material adverse effect on our company.
Employees
As of May 31, 2016, we had 1,853 employees, including 31 part-time employees. Of these employees, 1,462 were engaged in manufacturing, 86 in sales and marketing, 40 in finance and accounting, 57 in research and development, 34 in information services, and 174 in various executive or other administrative functions. None of our employees are represented by a union in collective bargaining with us. Of our employees, 18.6% have 10 or more years of service with our company and 11.9% have greater than 25 years of service with our company. We believe that our employee relations are good and that the high quality of our employee base is instrumental to our success.
Backlog
As of April 30, 2016 and 2015, we had a backlog of orders for our firearm business of $304.4 million and $169.4 million, respectively. Our accessories business had a backlog of orders of $6.6 million and $9.8 million as of April 30, 2016 and 2015, respectively. Our backlog consists of orders for which purchase orders have been received and which are generally scheduled for
11
shipment within six months and subject to capacity constraints. We allow orders received that have not yet shipped to be cancelled, with cancellations being more likely in periods following surges in demand. Therefore, our backlog may not be indicative of future sales.
Executive Officers
The following table sets forth certain information regarding our executive officers:
|
Name |
|
Age |
|
Position |
|
P. James Debney |
|
48 |
|
President and Chief Executive Officer |
|
Jeffrey D. Buchanan |
|
60 |
|
Executive Vice President, Chief Financial Officer, and Treasurer |
|
Robert J. Cicero |
|
49 |
|
Vice President, General Counsel, Chief Compliance Officer, and Secretary |
|
Mark P. Smith |
|
40 |
|
President of Manufacturing Services |
|
Matthew W. Buckingham |
|
41 |
|
President of Firearms |
P. James Debney has served as President and Chief Executive Officer of our company and as a member of our board of directors since September 2011. He was Vice President of our company from April 2010 until September 2011, and President of our firearm division from November 2009 until September 2011. Mr. Debney was President of Presto Products Company, a $500 million business unit of Alcoa Consumer Products, a manufacturer of plastic products, from December 2006 until February 2009. He was Managing Director of Baco Consumer Products, a business unit of Alcoa Consumer Products, a manufacturer of U.K.-branded and private label foil, film, storage, food, and trash bag consumer products, from January 2006 until December 2006; Manufacturing and Supply Chain Director from August 2003 until December 2005; and Manufacturing Director from April 1998 until July 2003. Mr. Debney joined Baco Consumer Products in 1989 and held various management positions in operations, production, conversion, and materials.
Jeffrey D. Buchanan has served as Executive Vice President, Chief Financial Officer, and Treasurer of our company since January 2011 and has served as Chief Administrative Officer of our company since September 2015. Mr. Buchanan served as Secretary of our company from January 2011 until April 2012. Mr. Buchanan served as a director of our company from November 2004 until December 2010. He was of counsel to the law firm of Ballard Spahr LLP from May 2010 until December 2010. Mr. Buchanan served as a Senior Managing Director of CKS Securities, LLC, a registered broker-dealer, from August 2009 until May 2010 and as a Senior Managing Director of Alare Capital Securities, L.L.C., a registered broker-dealer, from November 2006 until July 2009. From 2005 to 2006, Mr. Buchanan was principal of Echo Advisors, Inc., a corporate consulting and advisory firm focusing on mergers, acquisitions, and strategic planning. Mr. Buchanan served in various positions for Three-Five Systems, Inc., a publicly traded electronic manufacturing services company, including Executive Vice President, Chief Financial Officer, and Treasurer, from May 1996 until February 2005. Mr. Buchanan was a business attorney from 1986 until 1996 for the law firm of O’Connor, Cavanagh, Anderson, Killingsworth & Beshears and for the law firm of Davis Wright Tremaine LLP from 1984 until 1986. He was a senior staff person at Deloitte & Touche LLP from 1982 to 1984. Mr. Buchanan is a director of Synaptics Incorporated, a publicly traded company that develops custom user interface solutions.
Robert J. Cicero has served as Vice President and General Counsel of our company since October 2011 and Chief Compliance Officer and Secretary of our company since April 2012. Mr. Cicero was Associate General Counsel, Compliance Officer and Assistant Secretary of Chemtura Corporation, a global specialty chemicals company, from March 2009 until October 2011; Assistant General Counsel from July 2005 until March 2009; and Chief Counsel from September 2003 until July 2005. He was an Associate in the Executive Compensation and Employee Benefits Group for the law firm of Shearman & Sterling LLP from May 2000 until September 2003; an Associate in the Labor and Employment Section for the law firm of Morgan, Lewis & Bockius, LLP, from May 1998 until May 2000; and an Associate in the Labor and Employment Section for the law firm of Akin Gump Strauss Hauer & Feld, LLP from June 1996 until May 1998. Mr. Cicero was an Assistant Corporation Counsel in the New York City Office of the Corporation Counsel from September 1993 until June 1996.
Mark P. Smith has served as Senior Vice President of the Manufacturing Services Division of our company and as President of Manufacturing Services for Smith & Wesson Corp., a subsidiary of our company, since March 2016. Mr. Smith served as Vice President of Manufacturing and Supply Chain Management of our company from May 2011 until March 2016and served as Vice President of Supply Chain Management of our company from May 2010 until May 2011. He was Director- Supply Chain Solutions for Alvarez & Marsal Business Consulting, LLC from April 2007 until April 2010. Mr. Smith held various positions for Ecolab, Inc., a developer and marketer of programs, products, and services for the hospitality, foodservice, healthcare, industrial, and energy markets, from March 2001 until April 2007, including Program Manager, Acquisition Integration Manager, Senior Manufacturing Planner, Plant Engineer, and Senior Production / Quality Supervisor. Mr. Smith was a Production Supervisor for Bell Aromatics, a manufacturer of flavors and fragrances, from August 1999 until March 2001.
12
Matthew W. Buckingham has served as Senior Vice President of the Firearm Division of our company and as President of Firearms for Smith & Wesson Corp., a subsidiary of our company, since April 2016. Mr. Buckingham held various positions for Brownells Inc., a 75-year old provider of gunsmithing tools, firearm parts, and services to the firearm industry, from May 2004 until April 2016, including President and Chief Operations Officer from November 2012 until April 2016; Chief Operations Officer from January 2006 until November 2012; and Director of Operations from May 2004 until January 2006. Prior to his service with Brownells Inc., Mr. Buckingham held various positions with Pella Corporation, a large manufacturer of windows and doors, from June 1997 until May 2004, including Supply Chain Manager, Production Manager, Business Process Continuous Improvement Manager, Materials/Scheduling Supervisor, and Department Manager.
Investors should carefully consider the following risk factors, together with all the other information included in the Form 10-K, in evaluating our company, our business, and our prospects.
Our performance is influenced by a variety of economic, social, and political factors.
Our performance is influenced by a variety of economic, social, and political factors. General economic conditions and consumer spending patterns can negatively impact our operating results. Economic uncertainty, unfavorable employment levels, declines in consumer confidence, increases in consumer debt levels, increased commodity prices, and other economic factors may affect consumer spending on discretionary items and adversely affect the demand for our products. Economic conditions also affect governmental political and budgetary policies. As a result, economic conditions also can have an effect on the sale of our products to law enforcement, government, and military customers.
Political and other factors also can affect our performance. Concerns about presidential, congressional, and state elections and legislature and policy shifts resulting from those elections can affect the demand for our products. For example, we experienced strong consumer demand for our firearm products following a new administration taking office in Washington, D.C. in 2009. Assessments regarding the current Presidential campaign and the results of that election and congressional races could affect our business or perceptions about our business. In addition, speculation surrounding increased gun control at the federal, state, and local level and heightened fears of terrorism and crime can affect consumer demand for our products. Often, such concerns result in an increase in near-term consumer demand and subsequent softening of demand when such concerns subside.
Federal and state legislatures frequently consider legislation relating to the regulation of firearms. These proposed bills are often varied, but may seek to restrict the makeup of a firearm, including limitations on magazine capacity; mandate the use of certain technologies in a firearm; or ban the sale and, in some cases, the ownership of various types of firearms. If such restrictive legislation is enacted, we could find it difficult, expensive, or even impossible to comply with them, impeding new product development and distribution of existing products.
We remain dependent on the sale of our firearm and firearm-related products in the sporting goods distribution channel.
We manufacture a wide array of handguns, modern sporting rifles, hunting rifles, black powder firearms, handcuffs, and firearm-related products and accessories for sale to a wide variety of customers, including gun enthusiasts, collectors, hunters, sportsmen, competitive shooters, individuals desiring home and personal protection, law enforcement and security agencies and officers, and military agencies in the United States and throughout the world. We have made substantial efforts during the last several years to increase our sales to law enforcement and military agencies in the United States and throughout the world. Our efforts to increase firearms sales to law enforcement agencies has been successful to date with a number of agencies in the United States and agencies abroad selecting or approving for carry our firearms. We have not, however, yet secured any major contracts to supply firearms to any large domestic military agencies. Although we believe that we now are able to offer a broad array of competitive products to the military, we cannot predict whether or when we will be able to secure any major military supply contracts. As a result, approximately 90.1% of our net firearm sales in fiscal 2016 remained in the sporting goods distribution channel.
From time to time, we have been capacity constrained.
From time to time, we have been capacity constrained and have been unable to satisfy on a timely basis the demand for some of our products. Overall, capacity constraints were factors in fiscal 2014 and 2016, despite our achieving significant improvements in our production throughput as a result of enhanced production methods, the purchase of additional equipment, and the expansion of our supply base for capacity relief on targeted constrained processes. In fiscal 2015, we were capacity constrained with respect to certain of our popular products. During the last several fiscal years, we also have enhanced our manufacturing productivity by adding capacity, increasing daily production quantities, increasing operational availability of equipment, reducing machinery down time,
13
extending machinery useful life, and increasing manufacturing efficiency. Future significant increases in consumer demand for our products or increased business from law enforcement or military agencies may require us to expand further our manufacturing capacity, particularly through the purchase of additional manufacturing equipment and the addition of manufacturing space. We may not be able to increase our capacity in time to satisfy increases in demand that may occur from time-to-time, and we may not have adequate financial resources to increase capacity to meet demand. Capacity constraints may prevent us from satisfying customer orders and result in a loss of market share to competitors that are not capacity constrained. In addition, we may suffer excess capacity and increased overhead costs if we increase our capacity to meet actual or anticipated demand and that demand decreases or does not materialize.
Our manufacturing facilities are critical to our success.
Our Springfield, Massachusetts facility is critical to our success, as we currently produce the majority of our firearm products at this facility.
The facility also houses our principal research, development, engineering, design, shipping, sales, marketing, finance, and management functions. Any event that causes a disruption of the operation of this facility for even a relatively short period of time would adversely affect our ability to produce and ship many of our firearm products and to provide service to our firearm customers. We frequently make certain changes in our manufacturing operations to modernize the facility and associated equipment and systems as a result of the age of the facility and the need to introduce certain efficiencies in manufacturing and other processes in order to produce our anticipated volume of products in a more efficient and cost-effective manner. We anticipate that we will continue to incur significant capital and other expenditures with respect to the facility, but we may not be successful in continuing to improve efficiencies.
We also depend on our Houlton, Maine and Deep River, Connecticut facilities. Our Houlton facility is used primarily as a machining facility for our firearms as well as our handcuffs and restraints, and our Deep River facility is used primarily for custom plastic injection molding services, rapid prototyping, and tooling. A disruption in the activities of these facilities would adversely affect our firearm manufacturing operations.
Our efforts to develop new products may be costly and ineffective.
Our efforts to develop new products may not be successful, and any new product that we develop may not result in customer or market acceptance. The development of new products is a lengthy and costly process. Any new products that we develop and introduce to the marketplace may be unsuccessful or achieve success that does not meet our expectations for a variety of reasons, including delays in introduction, unfavorable cost comparisons with alternative products, and unfavorable performance. Significant expenses related to proposed new products that prove to be unsuccessful for any reason will adversely affect our operating results.
We rely on outsourcing for a portion of our production and any interruptions in these arrangements could disrupt our ability to fill our customers’ orders.
We utilize contract manufacturers for a portion of our production requirements, particularly during periods of very high customer demand, in order to increase our manufacturing capacity and reduce our capital expenditures for facilities that may not always operate at peak capacity. Qualifying new contract manufacturers is time consuming and might result in unforeseen manufacturing and operations problems. The loss of our relationships with our contract manufacturers or their inability to conduct their services for us as anticipated in terms of capacity, cost, quality, and timeliness could adversely affect our ability to fill customer orders in accordance with required delivery, quality, and performance requirements. If this were to occur, the resulting decline in revenue could harm our business.
We source a significant portion of the accessories products that we sell from third-party contract manufacturers, primarily located in Asia. Our ability to secure qualified suppliers that meet our quality and other standards, and to receive these products in a timely and efficient manner, represents a challenge, especially with suppliers located and products sourced outside the United States. Political and economic instability in countries in which foreign suppliers are located, the financial and managerial instability of suppliers, the failure by suppliers to meet our standards, labor problems experienced by our suppliers, the availability of raw materials to our suppliers, product quality issues, currency exchange rates, transport availability and cost, inflation, and other factors relating to suppliers and the countries in which they are located are beyond our control. The United States’ foreign trade policies, tariffs, and other impositions on imported goods, trade sanctions imposed on certain counties, the limitation on the importation of certain types of goods or of goods containing certain types of materials from other countries, and other factors relating to foreign trade also are beyond our control. These and a majority of other factors affecting our suppliers and our access to products could adversely affect our business.
14
We also depend on our contract manufacturers to maintain high levels of productivity and satisfactory delivery schedules. We do not have long-term agreements with many of our contract manufacturers that guarantee production capacity, prices, lead times, or delivery schedules. Our contract manufacturers serve other customers, a number of which may have greater production requirements than we do. As a result, our contract manufacturers could determine to prioritize production capacity for other customers or reduce or eliminate deliveries to us on short notice. Lower than expected manufacturing efficiencies could increase our cost and disrupt or delay our supplies. Any of these problems could result in our inability to deliver our products in a timely manner or adversely affect our operating results.
We often rely on third parties, including independent sales representatives and agents that act on our behalf.
We are often represented by third parties, including independent sales representatives and agents. These representatives and agents sometimes have the ability to enter into agreements on our behalf. The actions of these third parties could adversely affect our business if they enter into low margin contracts or conduct themselves in a manner that damages our reputation in the marketplace. We also face a risk that these third parties could violate domestic or foreign laws, which could put us at risk for prosecution in the United States or internationally.
Poor product quality or performance could adversely affect our operating results and reputation.
Poor product quality or performance could adversely affect our operating results and reputation. We generally provide a limited one year warranty and a lifetime service policy to the original purchaser of our new firearm products and a limited one year warranty to the original purchaser of our new accessories products.
While we believe we have a strong track record of developing, manufacturing, and selling high-quality products, from time to time, we have experienced manufacturing and design issues with respect to some of our firearms and have initiated product recalls and safety alerts in the past. Based on the volume of products we have shipped into the market, any future recall, safety alerts, or product liability claims could harm our reputation; cause us to lose business; and cause us to incur significant warranty, support, and repair costs.
We may incur higher medical benefit costs in the future.
We are self-insured for our employee medical plan. While our medical costs in recent years have generally increased at the same level as the regional average, our aging workforce and other employee demographics could result in an increase in our medical costs beyond what we have experienced or expect. We have stop-loss coverage in place for catastrophic events, but the aggregate impact of a high number of claims up to our stop-loss limit may have an effect on our profitability.
The Patient Protection and Affordable Care Act, as amended by the Health Care and Education Reconciliation Act of 2010, will potentially impact our healthcare cost structure and may, over time, increase our employee healthcare related expenses. Provisions of this law have become and will become effective in calendar 2015 and at various dates over the next several years. Many of the regulations and guidance for this law still not have been implemented and some face legal challenges. Because of the breadth and complexity of this law, the uncertainty surrounding this law, the lack of regulations and guidance for implementation, and the phased-in nature of the new requirements, we cannot predict with certainty the future effect of this law on us. The new healthcare legislation may increase the costs of providing medical insurance to our employees, which could have an adverse effect on our operations.
Liability insurance is expensive and may be difficult to obtain.
Liability insurance coverage is expensive and from time to time may be difficult to obtain. Our liability insurance costs were $4.7 million in fiscal 2016 and $5.1 million in fiscal 2015. An inability to obtain liability insurance, significant increases in the cost of insurance we obtain, or losses in excess of our liability insurance coverage would have a material adverse effect on us.
Our business is seasonal.
Historically, our fourth fiscal quarter ending April 30 has been our strongest quarter with industry events and distributor shows heavily scheduled during the early spring months. In addition, because of our operating schedule, which includes a summer and a winter shutdown of our firearm facilities, we have increased operating days during our fourth fiscal quarter, which allows our shipping and production volumes to exceed other quarters.
15
Shortages of, and price increases for, components, parts, raw materials, and other supplies may delay or reduce our sales and increase our costs.
Although we manufacture most of the components for our firearms, we purchase certain components and parts, including bolt carriers, rifle receivers, magazines, slides, small parts, barrels, and rifle stocks, from third parties. We rely on third-party suppliers and manufacturers for substantially all of our accessories’ components and products, and we have limited control over these suppliers and manufacturers. We also purchase ammunition for product testing.
Most of our major suppliers for our firearm-division products are U.S.-based and provide materials, components, and parts, such as raw steel, polymer components, and metal-injected-molded components. The costs of these materials, components, and parts are at competitive rates. We have become increasingly dependent on a small number of key vendors that supply components and parts for our firearms as a result of our decision to enhance our manufacturing flexibility by using third parties that can supplement our internal capacity to better react to changes in market conditions. Most of our major suppliers for our accessories components and products are based in Asia. We also use numerous raw materials in producing and testing our products, including steel, wood, lead, brass, and plastics.
Our inability to obtain sufficient quantities of components, parts, raw materials, and other supplies from independent sources necessary for the production of our products could result in reduced or delayed sales or lost orders. Any delay in or loss of sales could adversely impact our operating results. Many of the components, parts, raw materials, and other supplies used in the production of our products are available only from a limited number of suppliers. In most cases, we do not have long-term supply contracts with these suppliers. As a result, we could be subject to increased costs, supply interruptions, and difficulties in obtaining materials and finished products. Our suppliers also may encounter difficulties or increased costs in obtaining the materials necessary to produce the components and parts that we use in our products. The time lost in seeking and acquiring new sources or the inability to locate alternative sources of comparable quality at an acceptable price, or at all, could negatively impact our net sales and profitability. Shortages of ammunition also can adversely affect the demand for our products.
We have occasionally received, and may receive in the future, product deliveries from suppliers that fail to conform to our quality control standards. In such circumstances, our ability to sell those products could have a negative effect on our net sales and increase our administrative and shipping costs if we are unable to obtain replacement products in a timely manner.
Damage or disruption to manufacturing and distribution capabilities of, or the disruption of deliveries from, our suppliers because of severe or catastrophic events, including weather, natural disaster, fire or explosion, terrorism, pandemics, or labor disruptions, including at ports or at our suppliers, could impair our ability to manufacture or sell our products. Although we have insurance to cover potential loss from most of our suppliers for these events, we could experience losses in excess of our insured limits. In addition, failure to take adequate steps to mitigate the likelihood or potential impact of such events, or to effectively manage such events if they occur, could have a material adverse effect on us, as well as require additional resources to restore our supply chain.
Interruptions in the proper functioning of our information systems or other issues with our ERP systems could cause disruption to our operations.
We rely extensively on our information systems to manage our ordering, pricing, billing, inventory replenishment, accounting functions, and other processes. Our systems are subject to damage or interruption from various sources, including power outages, computer and telecommunications failures, computer viruses, cyber security breaches, vandalism, severe weather conditions, catastrophic events, terrorism, and human error, and our disaster recovery planning cannot account for all eventualities. If our systems are damaged, fail to function properly, or otherwise become compromised or unavailable, we may incur substantial costs to repair or replace them, and we may experience loss of critical data and interruptions or delays in our ability to perform critical functions, which could adversely affect our business and operating results.
Our information technology systems require periodic modifications, upgrades, and replacement that subject us to costs and risks, including potential disruption to our internal control structure, substantial capital expenditures, additional administration and operating expenses, retention of sufficiently skilled personnel or outside firms to implement and operate existing or new systems, and other risks and costs of delays or difficulties in transitioning to new or modified systems or of integrating new or modified systems into our current systems. In addition, challenges implementing new or modified technology systems may cause disruptions in our business operations and have an adverse effect on our business operations if not anticipated and appropriately mitigated.
During fiscal 2014, we transitioned to a new all-inclusive ERP system, SAP, in our Springfield and Houlton facilities and we transitioned our Deep River facility during fiscal 2016. We experienced some disruption in August 2013 as we introduced our SAP system at our Springfield and Houlton facilities. In fiscal 2017, we intend to add additional functionality to SAP as well as convert our Columbia, Missouri facility to SAP. Those additions and new implementations could result in a major disruption to our business, and
16
any disruption could have a negative effect on our net sales and profitability. In addition, implementing our ERP system has required and will continue to require significant resources and refinement to fully realize the expected benefits of the system.
Breaches of our information systems could adversely affect our reputation, disrupt our operations, and result in increased costs and loss revenue.
There have been an increasing number of cyber security incidents affecting companies around the world, which have caused operational failures or compromised sensitive corporate data. Although we do not believe our systems are at a greater risk of cyber security incidents than other similar organizations, such cyber security incidents may result in the loss or compromise of customer, financial, or operational data; disruption of billing, collections, or normal operating activities; disruption of electronic monitoring and control of operational systems; and delays in financial reporting and other management functions. Possible impacts associated with a cyber security incident may include remediation costs related to lost, stolen, or compromised data; repairs to data processing systems; increased cyber security protection costs; reputational damage; and adverse effects on our compliance with applicable privacy and other laws and regulations.
We face intense competition that could result in our losing or failing to gain market share and suffering reduced sales.
We operate in intensely competitive markets that are characterized by competition from major domestic and international companies. This intense competition could result in pricing pressures, lower sales, reduced margins, and lower market share. Any movement away from high-quality, domestic firearms to lower priced or comparable foreign alternatives would adversely affect our business. Some of our competitors have greater financial, technical, marketing, distribution, and other resources and, in certain cases, may have lower cost structures than we possess and that may afford them competitive advantages. As a result, they may be able to devote greater resources to the promotion and sale of products, to negotiate lower prices on raw materials and components, to deliver competitive products at lower prices, and to introduce new products and respond to customer requirements more effectively and quickly than we can.
Competition in the firearm industry is primarily based on innovation, quality, reliability, durability, price, performance, consumer brand awareness, and customer service and support. Our ability to compete in one or more of these areas could have a negative impact on our business.
Potential strategic alliances may not achieve their objectives, which could impede our growth.
We have entered into strategic alliances in the past and anticipate that we will enter into new strategic alliances in the future. We continually explore strategic alliances designed to expand our product offerings, enter new markets, and improve our distribution channels. For example, in fiscal 2015, we announced our strategic alliance with General Dynamics Ordnance and Tactical Systems to pursue the U.S. Army’s modular handgun system solicitation to replace the M9 standard Army sidearm. Our existing strategic alliances and any new strategic alliances may not achieve their intended objectives, and parties to our strategic alliances may not perform as contemplated. The failure of these alliances may impede our ability to introduce new products and enter new markets.
Acquisitions involve significant risks, and any acquisitions that we undertake in the future could be difficult to integrate, disrupt our business, dilute stockholder value, and harm our operating results.
We have a strategy to expand our operations through strategic acquisitions in order to enhance existing products and offer new products, enter new markets and businesses, strengthen and avoid interruption from our supply chain, and enhance our position in current markets and business. Acquisitions involve significant risks. We cannot accurately predict the timing, size, and success of any future acquisitions. We may be unable to identify suitable acquisition candidates or to complete the acquisitions of candidates that we identify. Increased competition for acquisition candidates or increased asking prices by acquisition candidates may increase purchase prices for acquisitions to levels beyond our financial capability or to levels that would not result in the returns required by our acquisition criteria. Acquisitions also may become more difficult in the future as we or others acquire the most attractive candidates. Unforeseen expenses, difficulties, and delays frequently encountered in connection with expansion through acquisitions could inhibit our growth and negatively impact our operating results.
Our ability to complete acquisitions that we desire to make in the future will depend upon various factors, including the following:
|
|
· |
the availability of suitable acquisition candidates at attractive purchase prices; |
|
|
· |
the ability to compete effectively for available acquisition opportunities; |
17
|
|
· |
the availability of cash resources, borrowing capacity, or stock at favorable price levels to provide required purchase prices in acquisitions; |
|
|
· |
the ability of management to devote sufficient attention to acquisition efforts; and |
|
|
· |
the ability to obtain any requisite governmental or other approvals. |
We plan to pursue acquisitions of businesses that are not involved in the manufacture of firearms, such as businesses involved in shooting and hunting sports, companies involved in what we consider the rugged outdoor market (which may include camping, hiking, fishing, and a variety of other outdoor recreational and leisure activities), companies that perform manufacturing services for us or supply us with components or materials, and other businesses that we regard as complementary to our business. We may have little or no experience with certain acquired businesses, which could involve significantly different supply chains, production techniques, customers, and competitive factors than our core firearm business. This lack of experience would require us to rely to a great extent on the management teams of these acquired businesses. These acquisitions also could require us to make significant investments in systems, equipment, facilities, and personnel in anticipation of growth. These costs could be essential to implement our growth strategy in supporting our expanded activities and resulting corporate structure changes. We may be unable to achieve some or all of the benefits that we expect to achieve as we expand into these new markets in the time we expect, if at all. If we fail to achieve some or all of the benefits that we expect to achieve as we expand into these new markets, or do not achieve them in the time we expect, our business, financial condition, and results of operations could be adversely affected.
As a part of any potential acquisition, we may engage in discussions with various acquisition candidates. In connection with these discussions, we and each potential acquisition candidate may exchange confidential operational and financial information, conduct due diligence inquiries, and consider the structure, terms, and conditions of the potential acquisition. In certain cases, the prospective acquisition candidate agrees not to discuss a potential acquisition with any other party for a specific period of time and agrees to take other actions designed to enhance the possibility of the acquisition, such as preparing audited financial information. Potential acquisition discussions frequently take place over a long period of time and involve difficult business integration and other issues. As a result of these and other factors, a number of potential acquisitions that from time-to-time appear likely to occur do not result in binding legal agreements and are not consummated, but may result in increased legal, consulting, and other costs.
Unforeseen expenses, difficulties, and delays frequently encountered in connection with future acquisitions could inhibit our growth and negatively impact our profitability. Any future acquisitions may not meet our strategic objectives or perform as anticipated. In addition, the size, timing, and success of any future acquisitions may cause substantial fluctuations in our operating results from quarter to quarter. For example, our acquisition of Thompson/Center Arms in January 2007 and SWSS in July 2009 resulted in substantial write-offs of goodwill and long-lived intangible assets. Consequently, our operating results for any quarter may not be indicative of the results that may be achieved for any subsequent quarter or for a full fiscal year. These interim fluctuations could adversely affect the market price of our common stock.
If we finance any future acquisitions in whole or in part through the issuance of common stock or securities convertible into or exercisable for common stock, existing stockholders will experience dilution in the voting power of their common stock and earnings per share could be negatively impacted. The extent to which we will be able or willing to use our common stock for acquisitions will depend on the market price of our common stock from time-to-time and the willingness of potential acquisition candidates to accept our common stock as full or partial consideration for the sale of their businesses. Our inability to use our common stock as consideration, to generate cash from operations, or to obtain additional funding through debt or equity financings in order to pursue an acquisition could limit our growth.
Our recent acquisitions and any acquisitions that we undertake in the future could be difficult to integrate, disrupt our business, and harm our operations.
In order to pursue a successful acquisition, we may need to integrate the operations of acquired businesses into our operations, including centralizing certain functions to achieve cost savings and pursuing programs and processes that leverage our sales and growth opportunities. In fiscal 2015, we acquired the businesses of DRP and BTI, and we are in the process of integrating BTI. The integration of the management, operations, and facilities of acquired businesses with our own could involve difficulties, which could adversely affect our growth rate and operating results.
18
We may be unable to complete effectively an integration of the management, operations, facilities, and accounting and information systems of acquired businesses with our own; to manage efficiently the combined operations of the acquired businesses with our operations; to achieve our operating, growth, and performance goals for acquired businesses; to achieve additional sales as a result of our expanded operations; or to achieve operating efficiencies or otherwise realize cost savings as a result of anticipated acquisition synergies. The integration of acquired businesses involves numerous risks, including the following:
|
|
· |
the potential disruption of our core businesses; |
|
|
· |
risks associated with entering markets and businesses in which we have little or no prior experience; |
|
|
· |
diversion of management’s attention from our core businesses; |
|
|
· |
adverse effects on existing business relationships with suppliers and customers; |
|
|
· |
risks associated with increased regulatory or compliance matters; |
|
|
· |
failure to retain key customers, suppliers, or personnel of acquired businesses; |
|
|
· |
the potential strain on our financial and managerial controls and reporting systems and procedures; |
|
|
· |
greater than anticipated costs and expenses related to the integration of the acquired business with our business; |
|
|
· |
potential unknown liabilities associated with the acquired company; |
|
|
· |
meeting the challenges inherent in effectively managing an increased number of employees in diverse locations; |
|
|
· |
failure of acquired businesses to achieve expected results; |
|
|
· |
the risk of impairment charges related to potential write-downs of acquired assets in future acquisitions; and |
|
|
· |
the challenge of creating uniform standards, controls, procedures, policies, and information systems. |
Our growth strategy may require significant additional funds, the amount of which will depend upon our working capital and general corporate needs.
Any substantial borrowings made to finance operations or future acquisitions could make us more vulnerable to a downturn in our operating results, a downturn in economic conditions, or increases in interest rates on borrowings. If our cash flow from operations is insufficient to meet our debt service requirements, we could be required to sell additional equity securities, refinance our obligations, or dispose of assets in order to meet our debt service requirements. Adequate financing may not be available if and when we need it or may not be available on terms acceptable to us. The failure to obtain sufficient financing on favorable terms and conditions could have a material adverse effect on us.
From time to time, we may seek additional equity or debt financing to provide funds for the expansion of our business. We cannot predict the timing or amount of any such financing requirements at this time. If such financing is not available on satisfactory terms, we may be unable to expand our business or to develop new business at the rate desired and our operating results may suffer. Debt financing increases expenses and must be repaid regardless of operating results. Equity financing could result in additional dilution to existing stockholders.
As of April 30, 2016, we had $175.3 million of long-term debt outstanding, of which $6.3 million is payable in the next twelve months. The degree to which we are leveraged could adversely affect our ability to obtain further financing for working capital, acquisitions, or other purposes and could make us more vulnerable to industry downturns and competitive pressures. Our ability to meet our debt service obligations will depend upon our future performance, which will be subject to the financial condition, business environment, and other factors affecting our operations, many of which are beyond our control.
The failure to manage our growth could adversely affect our operations.
To continue to expand our business and enhance our competitive position, we must make significant investments in systems, equipment, facilities, and personnel. In addition, we may commit significant funds to enhance our sales, marketing, information technology, research and development, and licensing efforts in order to expand our business. As a result of the increase in fixed costs and operating expenses, our failure to increase sufficiently our net sales to offset these increased costs would adversely affect our operating results.
19
The failure to manage our growth effectively could adversely affect our operations. We have substantially increased the number of our manufacturing and design programs and plan to expand further the number and diversity of our programs in the future. Managing our planned growth effectively will require us to
|
|
· |
enhance our operational, financial, and management systems; |
|
|
· |
enhance our facilities and purchase additional equipment, which will include ongoing modernization and expansion of our Springfield, Massachusetts, Deep River, Connecticut, and Houlton, Maine facilities; and |
|
|
· |
successfully hire, train, and motivate additional employees, including additional personnel for our technological, sales, marketing, and licensing efforts. |
The expansion of our products and customer base may result in increases in our overhead and selling expenses. We also may be required to increase staffing and other expenses as well as our expenditures on capital equipment and leasehold improvements in order to meet the demand for our products. Any increase in expenditures in anticipation of future sales that do not materialize would adversely affect our profitability.
In fiscal 2011, we were awarded a $6.0 million refundable tax credit from the Massachusetts Economic Assistance Coordinating Council under the Economic Development Incentive Program, or EDIP. This credit was granted by the Commonwealth of Massachusetts in consideration of our restructuring plan to move the production of our hunting products from New Hampshire to Massachusetts and is subject to our compliance with a written EDIP Investment Analysis Plan, including the requirement to hire 225 employees during calendar year 2011 and to invest $62.9 million over five years on qualified depreciable assets. If significant external factors prevent us from maintaining the required level of employment or investment in the future, we may be required to repay part or all of the tax credit received. Through the end of fiscal 2015, we recorded all of the tax credits allowed to us because of our compliance with the written EDIP Investment Analysis Plan. However, we are still required to maintain employment and capital spending levels throughout the remaining term of the EDIP in order to ensure that we do not have to repay any of the credit received.
Our business is highly dependent upon our brand recognition and reputation, and the failure to maintain or enhance our brand recognition or reputation would likely have a material adverse effect on our business.
Our brand recognition and reputation are critical aspects of our business. We believe that maintaining and further enhancing our brands, particularly our Smith & Wesson, M&P, and Thompson/Center Arms brands and the various brands sold by our accessories division, as well as our reputation are critical to retaining existing customers and attracting new customers. We also believe that the importance of our brand recognition and reputation will continue to increase as competition in our markets continues to develop.
We anticipate that our advertising, marketing, and promotional efforts will increase in the foreseeable future as we continue to seek to enhance our brands and consumer demand for our products. Historically, we have relied on print and electronic media advertising to increase consumer awareness of our brands to increase purchasing intent and conversation. We anticipate that we will increasingly rely on other forms of media advertising, including social media and e-marketing. Our future growth and profitability will depend in large part upon the effectiveness and efficiency of our advertising, promotion, public relations, and marketing programs. These brand promotion activities may not yield increased revenue and the efficacy of these activities will depend on a number of factors, including our ability to do the following:
|
|
· |
determine the appropriate creative message and media mix for advertising, marketing, and promotional expenditures; |
|
|
· |
select the right markets, media, and specific media vehicles in which to advertise; |
|
|
· |
identify the most effective and efficient level of spending in each market, media, and specific media vehicle; and |
|
|
· |
effectively manage marketing costs, including creative and media expenses, in order to maintain acceptable customer acquisition costs. |
Increases in the pricing of one or more of our marketing and advertising channels could increase our marketing and advertising expenses or cause us to choose less expensive but possibly less effective marketing and advertising channels. If we implement new marketing and advertising strategies, we may utilize marketing and advertising channels with significantly higher costs than our current channels, which in turn could adversely affect our operating results. Implementing new marketing and advertising strategies also would increase the risk of devoting significant capital and other resources to endeavors that do not prove to be cost effective. We also may incur marketing and advertising expenses significantly in advance of the time we anticipate recognizing revenue associated with such expenses, and our marketing and advertising expenditures may not generate sufficient levels of brand awareness and conversation or result in increased revenue. Even if our marketing and advertising expenses result in increased revenue, the increase might not offset our related expenditures. If we are unable to maintain our marketing and advertising channels on cost-effective terms or replace or supplement existing marketing and advertising channels with similarly or more effective channels, our marketing and
20
advertising expenses could increase substantially, our customer base could be adversely affected, and our business, operating results, financial condition, and reputation could suffer.
We may have difficulty collecting amounts owed to us.
Certain of our customers have experienced, and may in the future experience, credit-related issues. We perform ongoing credit evaluations of customers, but these evaluations may not be completely effective. We grant payment terms to most customers ranging from 30 to 90 days and do not generally require collateral. However, in some instances we provide longer payment terms, particularly as it relates to our hunting products. Should more customers than we anticipate experience liquidity issues, or if payment is not received on a timely basis, we may have difficulty collecting amounts owed to us by such customers and our business, operating results, and financial condition could be adversely impacted.
For our fiscal years ended April 30, 2016 and 2015 we did not have any customers that exceeded 10% of net sales or 10% of accounts receivable. For the fiscal year ended April 30, 2014, one of our customers accounted for approximately 13.4% of our net sales.
Our inability to protect our intellectual property or obtain the right to use intellectual property from third parties could impair our competitive advantage, reduce our sales, and increase our costs.
Our success and ability to compete depend in part on our ability to protect our intellectual property. We rely on a combination of patents, copyrights, trade secrets, trademarks, confidentiality agreements, and other contractual provisions to protect our intellectual property, but these measures may provide only limited protection. Our failure to enforce and protect our intellectual property rights or obtain the right to use necessary intellectual property from third parties could reduce our sales and increase our costs. In addition, the laws of some foreign countries do not protect proprietary rights as fully as do the laws of the United States.
Patents may not be issued for the patent applications that we have filed or may file in the future. Our issued patents may be challenged, invalidated, or circumvented, and claims of our patents may not be of sufficient scope or strength, or issued in the proper geographic regions, to provide meaningful protection or any commercial advantage. We have registered certain of our trademarks in the United States and other countries. We may be unable to enforce existing or obtain new registrations of principle or other trademarks in key markets. Failure to obtain or enforce such registrations could compromise our ability to protect fully our trademarks and brands and could increase the risk of challenges from third parties to our use of our trademarks and brands.
In the past, we did not consistently require our employees and consultants to enter into confidentiality agreements, employment agreements, or proprietary information and invention agreements; however, such agreements are now required. Therefore, our former employees and consultants may try to claim some ownership interest in our intellectual property and may use our intellectual property competitively and without appropriate limitations.
We may incur substantial expenses and devote significant resources in prosecuting others for their unauthorized use of our intellectual property rights.
We may become involved in litigation regarding patents and other intellectual property rights. Other companies, including our competitors, may develop intellectual property that is similar or superior to our intellectual property, duplicate our intellectual property, or design around our patents and may have or obtain patents or other proprietary rights that would prevent, limit, or interfere with our ability to make, use, or sell our products. Effective intellectual property protection may be unavailable or limited in some foreign countries in which we sell products or from which competing products may be sold. Unauthorized parties may attempt to copy or otherwise use aspects of our intellectual property and products that we regard as proprietary. Our means of protecting our proprietary rights in the United States or abroad may prove to be inadequate and competitors may be able to independently develop similar intellectual property. If our intellectual property protection is insufficient to protect our intellectual property rights, we could face increased competition in the markets for our products.
Should any of our competitors file patent applications or obtain patents that claim inventions also claimed by us, we may choose to participate in an interference proceeding to determine the right to a patent for these inventions because our business would be harmed if we fail to enforce and protect our intellectual property rights. Even if the outcome is favorable, this proceeding could result in substantial cost to us and disrupt our business.
In the future, we also may need to file lawsuits to enforce our intellectual property rights, to protect our trade secrets, or to determine the validity and scope of the proprietary rights of others. This litigation, whether successful or unsuccessful, could result in substantial costs and diversion of resources, which could have a material adverse effect on us.
21
We face risks associated with international activities, including related to compliance with the Foreign Corrupt Practices Act or other applicable anti-corruption legislation.
Political and economic conditions abroad may result in a reduction of or inhibition of our growth in our sales in numerous foreign countries and our purchase of certain accessories and components from certain countries in Asia and Europe, including China, Taiwan, and Italy. Protectionist trade legislation in either the United States or foreign countries, such as a change in the current tariff structures, export or import compliance laws, or other trade policies, could reduce our ability to sell our products in foreign markets, the ability of foreign customers to purchase our products, and our ability to import components, parts, and products from foreign suppliers. Our efforts to comply with the Foreign Corrupt Practices Act, or FCPA, or other applicable anti-corruption laws and regulations may limit our international business activities, necessitate the implementation of certain processes and compliance programs, and subject us to enforcement actions or penalties for noncompliance. Both the U.S. and foreign governments have increased their oversight and enforcement activities in this area in recent years, and we expect applicable agencies to continue to increase such activities in the future.
Our foreign sales and purchases of certain accessories and components also create a number of logistical and communication challenges. These activities also expose us to various economic, political, and other risks, including the following:
|
|
· |
compliance with U.S. and local laws and regulatory requirements including adverse changes in those laws and requirements; |
|
|
· |
transportation delays or interruptions and other effects of less developed infrastructures; |
|
|
· |
foreign exchange rate fluctuations; |
|
|
· |
limitations on imports and exports; |
|
|
· |
imposition of restrictions on currency conversion or the transfer of funds; |
|
|
· |
the possibility of appropriation of our assets without just compensation; |
|
|
· |
taxes, tariffs, and duties; |
|
|
· |
the burdens and costs of compliance with a variety of foreign laws; and |
|
|
· |
political or economic instability in countries in which we conduct business, including possible terrorist acts. |
Certain of our businesses are subject to extensive regulation.
Our firearm business, as well as the business of all products and marketers of firearms and firearm parts, is subject to numerous federal, state, local, and foreign laws, regulations, and protocols, including the rules and regulations of the ATF. If we fail to comply with ATF rules and regulations, the ATF may limit our activities or growth, fine us, or ultimately put us out of business.
Also, the export of our products is controlled by the International Traffic in Arms Regulations, or ITAR. ITAR implements the provisions of the Arms Export Control Act as described in the Code of Federal Regulations and is enforced by the U.S. Department of State. In order for us to sell some of our products in accordance with ITAR, including firearms to foreign customers, we must obtain export licenses from the U.S. government, primarily the U.S. Department of State. The U.S. Department of State has discretion as to whether to grant a license, and approval depends on the foreign policies and national security interests of the United States. In addition, Congress may take action to block a proposed sale of firearms for export valued at $1 million or higher. Consequently, we may not be able to obtain export licenses, or to complete profitable contracts as a result of political or other reasons that are outside our control. Failure to receive required licenses or authorizations or the termination or suspension of our export privileges could have an adverse effect on our business. Further, because our manufacturing process includes certain toxic, flammable, and explosive chemicals, we are subject to the Chemical Facility Anti-Terrorism Standards, or CFATS, as administered by the Department of Homeland Security, which requires that we take additional reporting and security measures related to our manufacturing process.
In addition, like many other manufacturers, we are subject to compliance with the Fair Labor Standards Act, the Occupational Safety and Health Act, Massachusetts data privacy laws, and many other regulations surrounding employment law, environmental law, taxation, and consumer protection.
Compliance with all of these laws, regulations, and protocols is costly and time consuming. Although we take every measure to ensure compliance with the many regulations we are subject to, inadvertent violation of any of these regulations could cause us to incur fines and penalties and may also lead to restrictions on our ability to manufacture and sell our products and services and to import or export the products that we sell. In addition, these laws, regulations, and protocols, as well as their interpretation by
22
regulatory authorities, may change at any time. There can be no assurance that such changes to the laws, regulations, and protocols or to their interpretations will not adversely affect our business.
We are subject to lawsuits and governmental investigations and inquiries.
We are currently involved in numerous lawsuits, including a lawsuit involving a municipality and several product liability lawsuits.
We are vigorously defending ourselves in the lawsuits to which we are subject. There can be no assurance, however, that we will not have to pay significant damages or amounts in settlement above insurance coverage. An unfavorable outcome or prolonged litigation could harm our business. Litigation of this nature also is expensive and time consuming and diverts the time and attention of our management.
Reference is made to Note 17 to our consolidated financial statements for a discussion of these and other lawsuits to which we are subject.
We have been and may continue to be subject to governmental investigations and inquiries. Such investigations and inquiries could subject us to various sanctions, including significant civil and criminal penalties, the indictment of our company or various of our officers and employees, our being prevented from bidding on domestic military and government contracts, our disbarment by the U.S. Department of State, private civil litigation arising out of the outcome of the investigations or inquiries, the diversion of time and attention of our management from normal business operations, and a negative impact on the perception of our company by investors, customers, and others. For example, we remain subject to a settlement agreement with the SEC under which we have the obligation to report to the SEC on our FCPA compliance efforts. If the SEC determines that we have not met our obligations under the terms of the settlement agreement, it can reopen its investigation, which could adversely affect our business.
Environmental laws and regulations may impact our business.
We are subject to numerous federal, state, and local laws that regulate or otherwise relate to the protection of the environment, including the Clean Air Act, the Clean Water Act, CERCLA, and the Solid Waste Disposal Act, as amended by RCRA. CERCLA, RCRA, and related state laws subject us to the potential obligation to remove or mitigate the environmental effects of the disposal or release of certain pollutants at our manufacturing facilities and at third-party or formerly owned sites at which contaminants generated by us may be located. This requires us to make expenditures of both a capital and expense nature.
In our efforts to satisfy our environmental health and safety responsibilities and to comply with all applicable laws and regulations, we maintain policies relating to the environmental health and safety standards for our operations and conduct programs to monitor compliance with various environmental regulations. However, in the normal course of our manufacturing operations, we may become subject to governmental proceedings and orders pertaining to waste disposal, air emissions, and water discharges into the environment. We believe based on the information available to us that we are in substantial compliance with applicable environmental regulations.
From a remediation perspective, we may not have identified all existing contamination on our properties and we cannot predict whether our operations will cause contamination in the future. As a result, we could incur additional costs to clean up contamination that exceed the amount of our reserves. We will periodically review the probable and reasonably estimable environmental costs in order to update the environmental reserves. Furthermore, it is not possible to predict with certainty the impact on us of future environmental health and safety compliance requirements or of the cost of resolution of future regulatory proceedings and claims, in part because the scope of the remedies that may be required is not certain, liability under federal environmental laws is joint and several in nature, and environmental health and safety laws and regulations are subject to modification and changes in interpretation. Additional or changing environmental health and safety regulation may become burdensome in the future, and any such development could have an adverse effect on us.
Our indebtedness could adversely affect our business and limit our ability to plan for or respond to changes in our business, and we may be unable to generate sufficient cash flow to satisfy significant debt service obligations.
As of April 30, 2016, we had consolidated indebtedness of $175.3 million, of which $6.3 million is payable in the next twelve months. On June 15, 2015, we entered into a new unsecured credit facility, or the Credit Agreement, with TD Bank, N.A. and other lenders, or the Lenders, which included a $175.0 million revolving line of credit, or the Revolving Line, and a $105.0 million term loan, or the Term Loan, of which $100.3 million remained outstanding as of April 30, 2016. The Revolving Line provides availability until June 15, 2020 for general corporate purposes, with borrowings to bear interest at a variable rate equal to LIBOR or prime plus an applicable margin based on our consolidated leverage ratio, at our election. As of April 30, 2016, there were no borrowings
23
outstanding on the Revolving Line. The Term Loan, which bears interest at rates calculated in the same manner as the Revolving Line, was entered into for the purposes of redeeming the entire $100.0 million outstanding principal balance of our 5.875% Senior Notes due 2017, or the 5.875% Senior Notes, plus accrued and unpaid interest to the redemption date, in June 2015. We were required to obtain fixed interest rate protection on the Term Loan covering not less than 75% of the aggregate outstanding principal balance of the Term Loan. Accordingly, on June 18, 2015, we entered into an interest rate swap agreement, which expires on June 15, 2020, that covered 100% of the $105.0 million of floating rate debt. On July 6, 2015, we executed an interest rate swap pursuant to such agreement. This swap, when combined with the applicable margin based on our consolidated leverage ratio, effectively fixed our interest rate on the Term Loan at 3.06%, which is subject to change based on our consolidated leverage ratio.
We also have $75.0 million of 5.000% Senior Notes due 2018, or the 5.000% Senior Notes, outstanding. The Credit Agreement and the indenture governing the 5.000% Senior Notes, or the 5.000% Senior Notes Indenture, each contain certain affirmative and negative financial and other restrictive covenants. Reference is made to Note 5 to our consolidated financial statements for further discussion of our indebtedness. We may also incur additional indebtedness in the future, including borrowings under our credit facility. Our indebtedness, after taking into account additional borrowings under our credit facility, and the fact that a substantial portion of our cash flow from operations must be used to make principal and interest payments on our indebtedness, could have important consequences, including the following:
|
|
· |
increasing our vulnerability to general adverse economic and industry conditions; |
|
|
· |
reducing the availability of our cash flow for other purposes; |
|
|
· |
limiting our flexibility in planning for, or reacting to, changes in our business and the industry in which we operate, which would place us at a competitive disadvantage compared to our competitors that may have less debt; |
|
|
· |
limiting, by the financial and other restrictive covenants in our debt agreements, our ability to borrow additional funds; and |
|
|
· |
having a material adverse effect on our business if we fail to comply with the covenants in our debt agreements, because such failure could result in an event of default that, if not cured or waived, could result in all or a substantial amount of our indebtedness becoming immediately due and payable. |
Our ability to incur significant future indebtedness, whether to finance potential acquisitions or for general corporate purposes, will depend on our ability to generate cash. To a certain extent, our ability to generate cash is subject to general economic, financial, competitive, legislative, regulatory, and other factors that are beyond our control. If our business does not generate sufficient cash flow from operations or if future borrowings are not available to us under our credit facility in amounts sufficient to enable us to fund our liquidity needs, our financial condition and operating results may be adversely affected. If we cannot make scheduled principal and interest payments on our debt obligations in the future, we may need to refinance all or a portion of our indebtedness on or before maturity, sell assets, delay capital expenditures, or seek additional equity.
Our governing documents and Nevada law could make it more difficult for a third party to acquire us and discourage a takeover.
Certain provisions of our articles of incorporation and bylaws and Nevada law make it more difficult for a third party to acquire us and make a takeover more difficult to complete, even if such a transaction were in our stockholders’ interest or might result in a premium over the market price for the shares held by our stockholders.
The issuance of additional common stock in the future, including shares that we may issue pursuant to option grants, may result in dilution in the net tangible book value per share of our common stock.
Our board of directors has the legal power and authority to determine the terms of an offering of shares of our capital stock, or securities convertible into or exchangeable for these shares, to the extent of our shares of authorized and unissued capital stock.
The sale of a substantial number of shares that are eligible for sale could adversely affect the price of our common stock.
As of April 30, 2016, there were 55,996,011 shares of our common stock outstanding. Substantially all of these shares are freely tradable without restriction or further registration under the securities laws, unless held by an “affiliate” of our company, as that term is defined in Rule 144 under the securities laws. Shares held by affiliates of our company, which generally include our directors, officers, and certain principal stockholders, are subject to the resale limitations of Rule 144 described below.
In general, under Rule 144 as currently in effect, any person or persons whose shares are aggregated for purposes of Rule 144, who is deemed an affiliate of our company and beneficially owns restricted securities with respect to which at least six months has elapsed since the later of the date the shares were acquired from us, or from an affiliate of ours, is entitled to sell within any three-
24
month period a number of shares that does not exceed the greater of 1% of the then outstanding shares of our common stock and the average weekly trading volume in common stock during the four calendar weeks preceding such sale. Sales by affiliates under Rule 144 also are subject to certain manner-of-sale provisions and notice requirements and to the availability of current public information about us. Rule 701, as currently in effect, permits our employees, officers, directors, and consultants who purchase shares pursuant to a written compensatory plan or contract to resell these shares in reliance upon Rule 144, but without compliance with specific restrictions.
Rule 701 provides that affiliates may sell their Rule 701 shares under Rule 144 without complying with the holding period requirement and that non-affiliates may sell their shares in reliance on Rule 144 without complying with the holding period, public information, volume limitation, or notice provisions of Rule 144. A person who is not an affiliate, who has not been an affiliate within three months prior to sale, and who beneficially owns restricted securities with respect to which at least one year has elapsed since the later of the date the shares were acquired from us, or from an affiliate of ours, is entitled to sell such shares under Rule 144 without regard to any of the volume limitations or other requirements described above. Sales of substantial amounts of our common stock in the public market could adversely affect the market price for our common stock.
As of April 30, 2016, we had outstanding nonqualified stock options to purchase 389,360 shares of common stock under our incentive stock plans and other option agreements, 736,599 undelivered time-based restricted stock units, or RSUs, and 479,154 unearned performance-based restricted stock units, or PSUs, under our incentive stock plans. We issued 157,674 of the 6,000,000 shares of common stock reserved for issuance under our 2011 Employee Stock Purchase Plan, or the ESPP, during fiscal 2016. We have registered for offer and sale the shares of common stock that are reserved for issuance pursuant to our incentive stock plans and available for issuance pursuant to the ESPP. Shares covered by such registration statements upon the exercise of stock options or pursuant to the ESPP generally will be eligible for sale in the public market, except that affiliates will continue to be subject to volume limitations and other requirements of Rule 144. The issuance or sale of such shares could depress the market price of our common stock.
We may issue securities that could dilute stockholder ownership and the net tangible book value per share of our common stock.
We may decide to raise additional funds through public or private debt or equity financing to fund our operations. If we raise funds by issuing equity securities, the percentage ownership of our current stockholders will be reduced and the new equity securities may have rights superior to those of our common stock. We may not obtain sufficient financing on terms that are favorable to us. We may delay, limit, or eliminate some or all of our proposed operations if adequate funds are not available. We may also issue equity securities as consideration for acquisitions we may make. The issuance of additional common stock in the future, including shares that we may issue pursuant to option grants, may result in dilution in the net tangible book value per share of our common stock.
Our operating results may involve significant fluctuations.
Various factors contribute to significant periodic and seasonal fluctuations in our operating results. These factors include the following:
|
|
· |
the volume of customer orders relative to our capacity; |
|
|
· |
the success of product and service introductions and market acceptance of new products by us and our competitors; |
|
|
· |
timing of expenditures in anticipation of future customer orders; |
|
|
· |
effectiveness in managing manufacturing processes and costs; |
|
|
· |
changes in cost and availability of labor and components; |
|
|
· |
ability to manage inventory and inventory obsolescence; |
|
|
· |
social and political factors specific to our industry; |
|
|
· |
pricing and other competitive pressures; and |
|
|
· |
changes or anticipated changes in economic conditions. |
Accordingly, you should not rely on the results of any period as an indication of our future performance. If our operating results fall below expectations of securities analysts or investors, our stock price may decline.
25
The market price of our common stock could be subject to wide fluctuations as a result of many factors.
Many factors could affect the market price of our common stock, including the following:
|
|
· |
variations in our operating results; |
|
|
· |
the relatively small public float of our common stock; |
|
|
· |
introductions of new products and services by us or our competitors; |
|
|
· |
the performance of our distributors; |
|
|
· |
changes in the estimates of our operating performance or changes in recommendations by any securities analysts that follow our stock; |
|
|
· |
general economic, political, and market conditions and consumer spending patterns; |
|
|
· |
governmental policies and regulations; |
|
|
· |
the general performance of the markets in which we participate; and |
|
|
· |
factors relating to suppliers and competitors. |
In addition, market demand for small-capitalization stocks, and price and volume fluctuations in the stock market unrelated to our performance, could result in significant fluctuations in the market price of our common stock. The performance of our common stock could adversely affect our ability to raise equity in the public markets and adversely affect the growth of our business.
We depend on key personnel, our business may be harmed, if we fail to retain and attract skilled management and other key personnel.
Our success depends to a significant extent upon the continued services of our current management team, including P. James Debney, our President and Chief Executive Officer. The loss of Mr. Debney or one or more of our other key executives or employees could have a material adverse effect on our business. Except for Mr. Debney, we do not maintain “key person” insurance policies on the lives of any of our executive officers or any of our other employees. We employ all of our executive officers and key employees on an at-will basis, and their employment can be terminated by us or them at any time, for any reason and without advance notice, subject, to certain severance obligations upon termination. In order to retain valuable employees, in addition to salary and cash incentives, we regard our ability as a public company to grant stock-based compensation as an important component of our ability to attract and retain key personnel. The value to employees of stock-based compensation over time will be significantly affected by movements in our stock price that are beyond our control and may at any time be insufficient to counteract offers from other companies.
Our success also depends on our ability to attract, retain, and motivate additional skilled management personnel. We plan to continue to expand our work force to continue to enhance our business and operating results. We believe that there is significant competition for qualified personnel with the skills and knowledge that we require, particularly as a result of ongoing firearm industry consolidation and other industry developments. Many of the other companies with which we compete for qualified personnel have greater financial and other resources than we do. They also may provide more diverse opportunities and better chances for career advancement. Some of these characteristics may be more appealing to high-quality candidates than those which we have to offer. If we are not able to retain our current key personnel, or attract the necessary qualified key personnel to accomplish our business objectives, we may experience constraints that will impede significantly the achievement of our business objectives and our ability to pursue our business strategy. New hires require significant training and, in most cases, take significant time before they achieve full productivity. New employees may not become as productive as we expect, and we may be unable to hire or retain sufficient numbers of qualified individuals. If our recruiting, training, and retention efforts are not successful or do not generate a corresponding increase in revenue, our business will be harmed.
Item 1B. Unresolved Staff Comments
Not applicable.
We own or lease three manufacturing facilities for our firearms products. We own our principal facility, which is a 575,000 square-foot facility located in Springfield, Massachusetts. We also own a 38,000 square-foot facility located in Houlton, Maine and we lease a 150,000 square-foot facility located in Deep River, Connecticut. The Springfield facility is primarily used to
26
manufacture our handguns, modern sporting rifles, and hunting rifles; and the Houlton facility was primarily used to manufacture handguns, handcuffs, and restraints. In fiscal 2015, our Houlton facility was converted into a machining center and all assembly, finishing, and small parts operations were transferred to our Springfield facility. Our Deep River facility is primarily used for custom plastic injection molding services, rapid prototyping, tooling, and supports our firearms platform. Our accessories products are warehoused and assembled in a leased 145,000 square-foot facility located in Columbia, Missouri. We believe that each facility is in good condition and capable of producing products at current and levels of production capacity. In addition, we own a 57,000 square-foot facility in Springfield, Massachusetts that we use for the Smith & Wesson Academy, a state-accredited firearm training institution and a private shooting facility. The leases for our Deep River and Columbia facilities are set to expire on May 4, 2024 and April 30, 2023, respectively.
We lease 3,000 square feet of office space in Scottsdale, Arizona, which has offices for certain senior personnel in our investor relations, legal, and finance departments as well as office space for our board of directors. The lease expires on February 28, 2018.
We lease 4,800 square feet of a facility located in Somersworth, New Hampshire, which is used primarily for research and development activities. The lease expires on June 30, 2018.
We believe that all of our facilities are adequate for present requirements and that our current equipment is in good condition and suitable for the operations involved.
The nature of the legal proceedings against us is discussed in Note 17 to our consolidated financial statements, which is incorporated herein by reference.
Item 4. Mine Safety Disclosures
Not applicable.
27
Item 5. Market for Registrant’s Common Equity, Related Stockholder Matters and Issuer Purchases of Equity Securities
Our common stock has been traded on the Nasdaq Global Select Market under the symbol “SWHC” since July 20, 2006. The following table sets forth the high and low sale prices of our common stock for each quarter in our fiscal years ended on April 30 indicated as reported on the Nasdaq Global Select Market.
|
|
|
High |
|
|
Low |
|
||
|
2016 |
|
|
|
|
|
|
|
|
|
First quarter |
|
$ |
17.04 |
|
|
$ |
14.62 |
|
|
Second quarter |
|
$ |
19.22 |
|
|
$ |
14.71 |
|
|
Third quarter |
|
$ |
26.54 |
|
|
$ |
17.05 |
|
|
Fourth quarter |
|
$ |
30.44 |
|
|
$ |
20.40 |
|
|
2015 |
|
|
|
|
|
|
|
|
|
First quarter |
|
$ |
17.28 |
|
|
$ |
12.32 |
|
|
Second quarter |
|
$ |
13.43 |
|
|
$ |
9.03 |
|
|
Third quarter |
|
$ |
12.68 |
|
|
$ |
9.22 |
|
|
Fourth quarter |
|
$ |
15.30 |
|
|
$ |
12.16 |
|
On June 14, 2016, the last reported sale price of our common stock was $21.86 per share. On June 14, 2016, there were 758 record holders of our common stock.
Dividend Policy
We have never declared or paid cash dividends on our preferred stock or our common stock. We currently plan to retain any earnings to finance the growth of our business rather than to pay cash dividends. Payment of any cash dividends in the future will depend on our financial condition, operating results, and capital requirements as well as other factors deemed relevant by our board of directors. In addition, our credit facility and the indenture governing our 5.000% Senior Notes restrict our ability to pay dividends.
Equity Compensation Plan Information
For equity compensation plan information, refer to Item 12 in Part III of this Annual Report on Form 10-K.
28
Performance Graph
The following line graph compares cumulative total stockholder returns for the five years ended April 30, 2015 for (i) our common stock; (ii) the Russell 2000 Index; (iii) Sturm, Ruger & Company, Inc., which is the most direct comparable company (Peer Group (1) on the graph below); (iv) a peer group consisting of Sturm, Ruger & Company, Inc. TASER International, Inc., Arctic Cat Inc., and National Presto Industries, Inc. (Old Peer Group (2) on the graph below); (v) a peer group consisting of Sturm, Ruger & Company, Inc., Vista Outdoor, Inc., Arctic Cat Inc., and National Presto Industries, Inc. (New Peer Group (2) on the graph below). For the year ended April 30, 2016, we have changed the peer group index from Old Peer Group (2) to New Peer Group (2) because one of the prior peer group companies is significantly smaller than our company in terms of revenue. For the years following 2016, we will no longer provide a comparison of our stock performance with the Old Peer Group (2). We have constructed the New Peer Group (2) index of issuers that participate in the shooting, defense, or outdoor market. The graph assumes an investment of $100 on April 30, 2011. The calculation of cumulative stockholder return on the Russell 2000 Index and the peer groups include reinvestment of dividends, but the calculation of cumulative stockholder return on our common stock does not include reinvestment of dividends because we did not pay any dividends during the measurement period. The performance shown is not necessarily indicative of future performance.
COMPARISON OF FIVE-YEAR CUMULATIVE TOTAL RETURN*
Among Smith & Wesson Holding Corporation, The Russell 2000 Index,
And Three Peer Groups
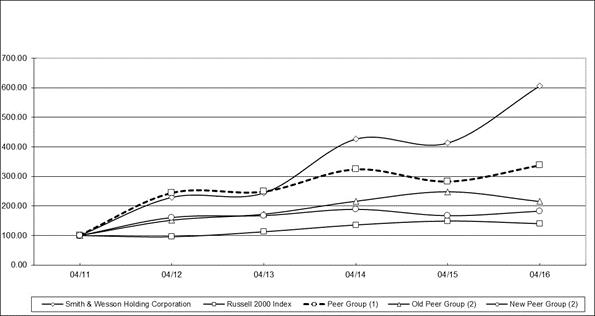
|
|
|
* |
$100 invested on April 30, 2011 in stock or index — including reinvestment of dividends. Fiscal year ending April 30. |
The performance graph above shall not be deemed “filed” for purposes of Section 18 of the Exchange Act, or otherwise subject to the liability of that section. The performance graph above will not be deemed incorporated by reference into any filing of our company under the Securities Act of 1933, as amended, or the Exchange Act.
29
Item 6. Selected Financial Data
The consolidated statements of income and cash flows data for the fiscal years ended April 30, 2016, 2015, and 2014 and the consolidated balance sheet data as of April 30, 2016 and 2015 have been derived from our audited consolidated financial statements included elsewhere in this report. The consolidated statements of income/(loss) and cash flows data for the fiscal years ended April 30, 2013 and 2012 and the consolidated balance sheet data as of April 30, 2014, 2013, and 2012 have been derived from our audited consolidated financial statements not included herein. You should read this information in conjunction with our consolidated financial statements, including the related notes, and “Management’s Discussion and Analysis of Financial Condition and Results of Operations” included elsewhere in this report.
|
|
Fiscal Year Ended April 30, |
|
||||||||||||||||||||||
|
|
2016 |
|
|
2015 |
|
|
2014 |
|
|
2013 |
|
|
2012 |
|
||||||||||
|
|
(In thousands, except share, per share, and ratio data) |
|
||||||||||||||||||||||
|
Net sales |
$ |
|
722,908 |
|
|
$ |
|
551,862 |
|
|
$ |
|
626,620 |
|
|
$ |
|
587,514 |
|
|
$ |
|
411,997 |
|
|
Cost of sales |
|
|
429,096 |
|
|
|
|
356,936 |
|
|
|
|
367,515 |
|
|
|
|
369,442 |
|
|
|
|
284,091 |
|
|
Gross profit |
|
|
293,812 |
|
|
|
|
194,926 |
|
|
|
|
259,105 |
|
|
|
|
218,072 |
|
|
|
|
127,906 |
|
|
Operating expenses |
|
|
135,169 |
|
|
|
|
105,298 |
|
|
|
|
108,117 |
|
|
|
|
85,238 |
|
|
|
|
82,990 |
|
|
Operating income |
|
|
158,643 |
|
|
|
|
89,628 |
|
|
|
|
150,988 |
|
|
|
|
132,834 |
|
|
|
|
44,916 |
|
|
Total other income/(expense), net |
|
|
(13,550 |
) |
|
|
|
(10,896 |
) |
|
|
|
(14,266 |
) |
|
|
|
(4,928 |
) |
|
|
|
(5,901 |
) |
|
Income from continuing operations before income taxes |
|
|
145,093 |
|
|
|
|
78,732 |
|
|
|
|
136,722 |
|
|
|
|
127,906 |
|
|
|
|
39,015 |
|
|
Income tax expense |
|
|
51,135 |
|
|
|
|
28,905 |
|
|
|
|
48,095 |
|
|
|
|
46,500 |
|
|
|
|
12,582 |
|
|
Income from continuing operations (a) |
|
|
93,958 |
|
|
|
|
49,827 |
|
|
|
|
88,627 |
|
|
|
|
81,406 |
|
|
|
|
26,433 |
|
|
Discontinued operations: |
|
|
|
|
|
|
|
|
|
|
|
|
|
|
|
|
|
|
|
|
|
|
|
|
|
Loss from operation of discontinued security solutions division |
|
— |
|
|
|
|
(297 |
) |
|
|
|
(456 |
) |
|
|
|
(3,605 |
) |
|
|
|
(15,945 |
) |
|
|
Income tax benefit |
|
— |
|
|
|
|
(83 |
) |
|
|
|
(1,134 |
) |
|
|
|
(912 |
) |
|
|
|
(5,617 |
) |
|
|
Income/(loss) from operation of discontinued security solutions division |
|
|
— |
|
|
|
|
(214 |
) |
|
|
|
678 |
|
|
|
|
(2,693 |
) |
|
|
|
(10,328 |
) |
|
Net income |
$ |
|
93,958 |
|
|
$ |
|
49,613 |
|
|
$ |
|
89,305 |
|
|
$ |
|
78,713 |
|
|
$ |
|
16,105 |
|
|
Net income per share: |
|
|
|
|
|
|
|
|
|
|
|
|
|
|
|
|
|
|
|
|
|
|
|
|
|
Basic - continuing operations |
$ |
|
1.72 |
|
|
$ |
|
0.92 |
|
|
$ |
|
1.51 |
|
|
$ |
|
1.25 |
|
|
$ |
|
0.41 |
|
|
Basic - total |
$ |
|
1.72 |
|
|
$ |
|
0.92 |
|
|
$ |
|
1.52 |
|
|
$ |
|
1.21 |
|
|
$ |
|
0.25 |
|
|
Diluted - continuing operations |
$ |
|
1.68 |
|
|
$ |
|
0.90 |
|
|
$ |
|
1.47 |
|
|
$ |
|
1.22 |
|
|
$ |
|
0.40 |
|
|
Diluted - total |
$ |
|
1.68 |
|
|
$ |
|
0.90 |
|
|
$ |
|
1.49 |
|
|
$ |
|
1.18 |
|
|
$ |
|
0.25 |
|
|
Weighted average number of shares outstanding: |
|
|
|
|
|
|
|
|
|
|
|
|
|
|
|
|
|
|
|
|
|
|
|
|
|
Basic |
|
|
54,765 |
|
|
|
|
53,988 |
|
|
|
|
58,668 |
|
|
|
|
65,155 |
|
|
|
|
64,788 |
|
|
Diluted |
|
|
55,965 |
|
|
|
|
55,228 |
|
|
|
|
60,114 |
|
|
|
|
66,642 |
|
|
|
|
67,277 |
|
|
Depreciation and amortization |
$ |
|
41,237 |
|
|
$ |
|
30,893 |
|
|
$ |
|
21,704 |
|
|
$ |
|
16,730 |
|
|
$ |
|
15,487 |
|
|
Capital expenditures |
$ |
|
29,474 |
|
|
$ |
|
28,199 |
|
|
$ |
|
53,282 |
|
|
$ |
|
41,421 |
|
|
$ |
|
13,770 |
|
|
Year-end financial position: |
|
|
|
|
|
|
|
|
|
|
|
|
|
|
|
|
|
|
|
|
|
|
|
|
|
Working capital |
$ |
|
210,639 |
|
|
$ |
|
116,065 |
|
|
$ |
|
146,628 |
|
|
$ |
|
146,973 |
|
|
$ |
|
107,369 |
|
|
Current ratio |
|
|
2.7 |
|
|
|
|
2.4 |
|
|
|
|
2.6 |
|
|
|
|
2.8 |
|
|
|
|
2.3 |
|
|
Total assets |
$ |
|
619,503 |
|
|
$ |
|
490,925 |
|
|
$ |
|
378,535 |
|
|
$ |
|
326,989 |
|
|
$ |
|
261,674 |
|
|
Current portion of notes payable |
$ |
|
6,300 |
|
|
$ |
— |
|
|
$ |
— |
|
|
$ |
— |
|
|
$ |
— |
|
||||
|
Notes payable, net of current portion |
$ |
|
166,564 |
|
|
$ |
|
170,933 |
|
|
$ |
|
97,031 |
|
|
$ |
|
43,559 |
|
|
$ |
|
50,000 |
|
|
|
(a) |
Income from continuing operations for fiscal 2016 and 2015 includes activity for the period subsequent to our DRP and BTI acquisitions in fiscal 2015. See Note 2 – Acquisitions to the consolidated financial statements for further detail. |
30
Item 7. Management’s Discussion and Analysis of Financial Condition and Results of Operations
You should read the following management’s discussion and analysis in conjunction with our consolidated financial statements and the related notes thereto contained elsewhere in this report. This discussion contains forward-looking statements that involve risks, uncertainties, and assumptions. Our actual results may differ materially from those anticipated in these forward-looking statements as a result of a variety of factors, including those set forth under Item 1A, “Risk Factors” and elsewhere in this report.
The results of SWSS, our former security solutions division, are being presented as discontinued operations in the consolidated statements of income for the fiscal years ending April 30, 2015 and 2014. See Note 4 — Discontinued Operations in the notes to consolidated financial statements for additional information regarding these discontinued operations. Unless otherwise indicated, any reference to income statement items in this Management’s Discussion and Analysis of Financial Condition and Results of Operations refers to results from continuing operations.
On May 5, 2014, we completed the DRP Acquisition, which expanded our capabilities to include custom injection molding services, rapid prototyping, and tooling. On December 11, 2014, we completed the BTI Acquisition. BTI, based in Columbia, Missouri, is a leading provider of hunting and shooting accessories and offers innovative, high-quality products under several brands. Results of operations for the fiscal year ended April 30, 2015 include activity for the period subsequent to the respective DRP and BTI Acquisitions. Subsequent to the BTI Acquisition, we began reporting our results of operations in two segments: (1) accessories, representing BTI, and (2) firearms, representing all other operations.
2016 Highlights
Our fiscal 2016 net sales of $722.9 million represented an increase of 31.0% over our fiscal 2015 net sales. Net sales for our firearm division increased by 23.8% over the prior fiscal year to $657.6 million. Net sales for our accessories division was $65.3 million in fiscal 2016 compared with net sales of $20.6 million for the prior fiscal year, following the BTI Acquisition on December 11, 2014. Income from continuing operations for fiscal 2016 was $94.0 million, or $1.68 per fully diluted share, compared with income from continuing operations of $49.8 million, or $0.90 per fully diluted share, for fiscal 2015. Our operating results for fiscal 2016 were affected by numerous factors, including the following:
|
|
· |
The 23.8% increase in firearm net sales was driven primarily by the ongoing increased consumer interest in firearms that has occurred over the past several years, as reflected by higher National Instant Criminal Background Check System, or NICS, as well as the impact of news events and the current political environment that appears to have increased demand in the second half of our fiscal year. We also believe that new products, product line extensions for our M&P branded products, specifically our small concealed carry polymer pistols, and annual promotional programs during this time helped to stimulate demand for our products. This increased consumer demand resulted in reduced overall firearm inventory at distributors in spite of increased shipments of the majority of our products into the sporting goods channel. We were able to address the increased demand during the second half of fiscal 2016 because we had built finished goods inventory during the slower summer months and were able to ramp production and outsourcing as well as shift production to better match our output to those products most in demand. The principal products in demand in our handgun category included our lower price point full-size polymer pistols, small concealed carry polymer pistols, and revolvers. For long guns, the principal products in demand were certain of our lower price point modern sporting rifles and bolt action hunting rifles. New products, defined as any new SKU not shipped in the prior year, represented 19.2% of firearm revenue for fiscal 2016 and included our Smith & Wesson branded sport series target pistol, our M&P branded sport model modern sporting rifle, a new Performance Center M&P branded ported concealed carry pistol, and many other product line extensions for our M&P branded products. The DRP and BTI Acquisitions represented 10.3% of total net sales for fiscal 2016. The increase in units produced to satisfy the increased consumer demand increased our firearm net sales by 23.5%. |
|
|
· |
Our gross margin increased 5.3 percentage points over the prior fiscal year, primarily as a result of a combination of higher sales volumes from increased demand and favorable manufacturing fixed-cost absorption, offset by higher manufacturing-related spending relative to sales volumes and additional promotional product discounts. Our accessories division recorded gross margin of 49.9% which had a 90 basis point favorable impact on total company gross margin. |
|
|
· |
Income from continuing operations increased $44.1 million, or 88.6%, primarily as the result of higher sales volumes and gross margin as described above combined with the additional sales and margin related to the December 2014 BTI Acquisition, net of the corresponding increase in BTI operating expenses, including acquisition related amortization. In addition, operating expenses were higher in fiscal 2016 because of increased profit sharing and management incentive partially offset by lower professional and acquisition related expenses. Interest expense was higher in fiscal 2016 as a result of the costs associated with retiring our 5.875% Senior Notes in exchange for a lower cost term loan, as described below. |
31
|
|
· |
On June 15, 2015, we entered into a new credit agreement, or the Credit Agreement, which provides for a $175.0 million Revolving Line and a $105.0 million Term Loan, which both mature on June 15, 2020. We used the proceeds from the Term Loan to redeem the entire $100.0 million outstanding principal balance of our 5.875% Senior Notes, plus accrued and unpaid interest at the redemption date. On June 18, 2015, we entered into an interest rate swap agreement, which expires on June 15, 2020, covering $105.0 million of floating rate debt under the Term Loan. On July 6, 2015, we executed an interest rate swap pursuant to such agreement, which requires us to pay interest at a defined rate of 1.56% while receiving interest at a defined variable rate of one-month LIBOR (0.188% at July 31, 2015). The notional amount of the interest rate swap was $105.0 million and had an aggregate fair value of $1.3 million as of April 30, 2016. This swap, when combined with the applicable margin based on our consolidated leverage ratio as of January 31, 2016, effectively fixed our interest rate on the Term Loan, subject to change based on changes in our consolidated leverage ratio. As of April 30, 2016, our interest rate on the Term Loan was 3.06%. |
Our Business
We are one of the world’s leading manufacturers of firearms and a provider of quality accessory products for the shooting, hunting, and rugged outdoor enthusiast. We manufacture a wide array of handguns (including revolvers and pistols), long guns (including modern sporting rifles, bolt action rifles, and single shot rifles), handcuffs, and firearm-related products and accessories for sale to a wide variety of customers, including gun enthusiasts, collectors, hunters, sportsmen, competitive shooters, individuals desiring home and personal protection, law enforcement and security agencies and officers, and military agencies in the United States and throughout the world. We are one of the largest manufacturers of handguns, modern sporting rifles, and handcuffs in the United States and an active participant in the hunting rifle market. We are also a leading provider of shooting, hunting, and outdoor accessories, including reloading, gunsmithing, gun cleaning supplies, tree saws, and vault accessories. We sell our products under the Smith & Wesson, M&P, Thompson/Center Arms, Caldwell Shooting Supplies, Wheeler Engineering, Tipton Gun Cleaning Supplies, Frankford Arsenal Reloading Tools, Lockdown Vault Accessories, Hooyman Premium Tree Saws, BOG-POD, and Golden Rod Moisture Control brands.
We manufacture our firearm products at our facilities in Springfield, Massachusetts; Houlton, Maine; and Deep River, Connecticut; and we develop and market our accessories products at our facility in Columbia, Missouri. We plan to continue to capitalize on the goodwill developed through our historic 164 year old “Smith & Wesson” brand as well as our other well-known brands by expanding consumer awareness of the products we produce.
Key Performance Indicators
We evaluate the performance of our business based upon operating profit, which includes net sales, cost of sales, selling and administrative expenses, and certain components of other income and expense. We also track our return on invested capital, and we use adjusted EBITDAS (earnings before interest, taxes, depreciation, amortization, and stock-based compensation expense, excluding certain non-operational items), which is a non-GAAP financial metric, as a supplemental measure of our performance in order to provide investors with an improved understanding of underlying performance trends. We evaluate our various firearm products by such measurements as gross margin per unit produced, units produced per day, revenue by trade channel, and incoming orders per day. We evaluate our various accessories products by such measurements as incoming orders per day, sales by customer, and gross margin by product line.
Key Industry Data
Firearms have been subject to legislative actions in the past, and the market has reacted to these actions. There was a substantial increase in sales in the early 1990s during the period leading up to and shortly after the enactment of the Brady Bill. In the period from 1992 through 1994, U.S. handgun sales increased by over 50%, as consumers purchased handguns because of the fear of prohibition of handgun ownership. Sales levels then returned to pre-1992 levels and grew at normal industry growth rates until late in calendar 2008, when sales increased in what appears to be fears surrounding crime and terrorism, an economic downturn, and a change in the White House administration. Similar to the increase in 1992, this increase in sales was temporary in nature and sales returned to more normal levels in fiscal 2010. In late calendar 2012 and early calendar 2013, orders again increased rapidly in what appeared to be in response to fears of renewed legislative activity surrounding restrictions on the sale or makeup of firearms and then returned to more normal levels during fiscal 2015. Orders again increased in fiscal 2016 in what appears to be related to ongoing increased consumer interest in firearms that has occurred over the past several years in addition to consumer reaction to news events and the current political environment. We believe that an expanding base of consumers, the variety of products we offer, and the attractive price points we maintain will be important factors to achieve our goal to increase our market share. Based on data from calendar 2015, we estimate that we have a 19% share of the U.S. consumer market for handguns. This compares with approximately 10% in the period just before we acquired Smith & Wesson Corp. in 2001.
32
Results of Operations
Net Sales
The following table sets forth certain information regarding net sales for the fiscal years ended April 30, 2016, 2015, and 2014 (dollars in thousands):
|
|
2016 |
|
|
2015 |
|
|
$ Change |
|
|
% Change |
|
|
2014 |
|
|||||
|
Handguns |
$ |
485,413 |
|
|
$ |
395,500 |
|
|
$ |
89,913 |
|
|
|
22.7 |
% |
|
$ |
422,992 |
|
|
Long Guns |
|
127,607 |
|
|
|
90,178 |
|
|
|
37,429 |
|
|
|
41.5 |
% |
|
|
155,311 |
|
|
Walther |
|
— |
|
|
|
506 |
|
|
|
(506 |
) |
|
|
-100.0 |
% |
|
|
5,651 |
|
|
Other Products & Services |
|
44,598 |
|
|
|
45,038 |
|
|
|
(440 |
) |
|
|
-1.0 |
% |
|
|
42,666 |
|
|
Firearms Division |
|
657,618 |
|
|
|
531,222 |
|
|
|
126,396 |
|
|
|
23.8 |
% |
|
|
626,620 |
|
|
Accessories Division |
|
65,290 |
|
|
|
20,640 |
|
|
|
44,650 |
|
|
|
216.3 |
% |
|
N/A |
|
|
|
Total Net Sales |
$ |
722,908 |
|
|
$ |
551,862 |
|
|
$ |
171,046 |
|
|
|
31.0 |
% |
|
$ |
626,620 |
|
The following table sets forth certain information regarding trade channel net sales for the fiscal years ended April 30, 2016, 2015, and 2014 (dollars in thousands):
|
|
2016 |
|
|
2015 |
|
|
$ Change |
|
|
% Change |
|
|
2014 |
|
|||||
|
Sporting Goods Distribution Channel |
$ |
579,597 |
|
|
$ |
446,798 |
|
|
$ |
132,799 |
|
|
|
29.7 |
% |
|
$ |
552,017 |
|
|
Professional Channel |
|
62,938 |
|
|
|
64,439 |
|
|
|
(1,501 |
) |
|
|
-2.3 |
% |
|
|
65,037 |
|
|
Other Products & Services |
|
15,083 |
|
|
|
19,985 |
|
|
|
(4,902 |
) |
|
|
-24.5 |
% |
|
|
9,566 |
|
|
Firearms Division |
|
657,618 |
|
|
|
531,222 |
|
|
|
126,396 |
|
|
|
23.8 |
% |
|
|
626,620 |
|
|
Accessories Division |
|
65,290 |
|
|
|
20,640 |
|
|
|
44,650 |
|
|
|
216.3 |
% |
|
N/A |
|
|
|
Total Net Sales |
$ |
722,908 |
|
|
$ |
551,862 |
|
|
$ |
171,046 |
|
|
|
31.0 |
% |
|
$ |
626,620 |
|
We include domestic handgun, long gun, and parts revenue in our sporting goods distribution channel, and we include international and law enforcement handgun, long gun, and handcuff revenue in our professional channel. We include specialty services and plastic injection molding revenue in other products and services. Effective October 1, 2015, our Thompson/Center accessories were transitioned from our firearms sporting goods distribution channel to our accessories division. Accessories division net sales for fiscal 2016 and fiscal 2015 were primarily into our sporting goods distribution channel.
The following table sets forth certain information regarding firearm units shipped by trade channel for the fiscal years ended April 30, 2016, 2015, and 2014 (units in thousands):
|
Total Units Shipped |
2016 |
|
|
2015 |
|
|
# Change |
|
|
% Change |
|
|
2014 |
|
|||||
|
Handguns |
|
1,565 |
|
|
|
1,229 |
|
|
|
336 |
|
|
|
27.3% |
|
|
|
1,324 |
|
|
Long Guns |
|
309 |
|
|
|
211 |
|
|
|
98 |
|
|
|
46.4% |
|
|
|
328 |
|
|
|
|
|
|
|
|
|
|
|
|
|
|
|
|
|
|
|
|
|
|
|
Sporting Goods Distribution Channel Units Shipped |
2016 |
|
|
2015 |
|
|
# Change |
|
|
% Change |
|
|
2014 |
|
|||||
|
Handguns |
|
1,417 |
|
|
|
1,076 |
|
|
|
341 |
|
|
|
31.7% |
|
|
|
1,188 |
|
|
Long Guns |
|
290 |
|
|
|
191 |
|
|
|
99 |
|
|
|
51.8% |
|
|
|
296 |
|
|
|
|
|
|
|
|
|
|
|
|
|
|
|
|
|
|
|
|
|
|
|
Professional Channel Units Shipped |
2016 |
|
|
2015 |
|
|
# Change |
|
|
% Change |
|
|
2014 |
|
|||||
|
Handguns |
|
148 |
|
|
|
153 |
|
|
|
(5) |
|
|
|
-3.3% |
|
|
|
136 |
|
|
Long Guns |
|
19 |
|
|
|
20 |
|
|
|
(1) |
|
|
|
-5.0% |
|
|
|
32 |
|
Fiscal 2016 Net Sales Compared with Fiscal 2015
Net sales in our firearm division for fiscal 2016 increased 23.8% over the prior fiscal year driven primarily by the ongoing increased consumer interest in firearms that has occurred over the past several years, as reflected by higher NICS, as well as the impact of news events and the current political environment impacting the second half of our fiscal year. We also believe that new products, product line extensions for our M&P branded products, specifically our small concealed carry polymer pistols, and annual promotional programs during this time helped to stimulate demand for our products. This increased consumer demand resulted in reduced overall firearm inventory at distribution channels despite increased shipments of the majority of our products into the sporting goods distribution channel. We were able to address the increased demand during the second half of our fiscal year because we had built finished goods inventory during the slower summer months and were able to ramp production and outsourcing as well as shift
33
production to better match our output to those products most in demand. Our handgun revenue increased $89.9 million, or 22.7%, over the prior fiscal year primarily due to increased consumer demand for concealed carry products, which resulted in increased unit shipments of our small concealed carry polymer pistols into our sporting goods distribution channel. The principal handgun products in highest demand included lower price point full-size polymer pistols, small concealed carry polymer pistols, and revolvers. Long gun revenue increased $37.4 million, or 41.5%, over the prior fiscal year as a result of the introduction of a new lower price point modern sporting rifle, increased demand in the sporting goods channel, as supported by increased NICS checks for long guns, and increases in market share as supported by dealer and distributor data. The principal long gun products in demand were certain of our lower price point modern sporting rifles and bolt action hunting rifles. Other products and services revenue were flat compared with the prior fiscal year. New products, defined as any new SKU not shipped in the prior year, represented 19.2% of firearm revenue for fiscal 2016 and included our Smith & Wesson branded sport series target pistol, our M&P branded sport model modern sporting rifle, a new Performance Center M&P branded ported concealed carry pistol, and many other product line extensions for our M&P branded products. In total, price increases favorably impacted firearm revenue for fiscal 2016 compared with the prior fiscal year by 30 basis points while increases in the number of units sold impacted firearm revenue by 23.5%. Our accessories division revenue was $65.3 million, an increase of $44.6 million over revenue of $20.6 million for the prior fiscal year because fiscal 2015 had only 19 weeks of revenue following the BTI Acquisition in December 2014.
Our firearm segment order backlog as of April 30, 2016 was $304.4 million, which was $135.0 million higher than at the end of fiscal 2015. Our accessories segment order backlog as of April 30, 2016 was $6.6 million, which was $3.2 million lower than at the end of fiscal 2015. We allow orders received that have not yet shipped to be cancelled, with cancellations being more likely in periods following surges in demand. Therefore, our backlog may not be indicative of future sales.
Although revenue for handguns increased 22.7%, our handgun unit shipments into the sporting goods distribution channel increased 31.7% over the prior fiscal year as a result of increased shipments of promotional products that lowered our average selling price. Our long gun unit shipments into the sporting goods distribution channel increased 51.8% over the prior fiscal year primarily driven by increased demand on two key products: our lower price point M&P Sport rifle and our Thompson/Center bolt action hunting rifle. In our professional channel, unit shipments were lower than the prior fiscal year because of lower M&P pistol sales to law enforcement agencies as well as lower international shipments to Canada, Italy, and Thailand as a result of economic conditions and delayed export licenses.
34
Fiscal 2015 Net Sales Compared with Fiscal 2014
Net sales in our firearm division for fiscal 2015 decreased 15.2% from the prior fiscal year. Although consumer demand for handguns, as reflected in NICS background checks, increased over fiscal 2014, we believe that a portion of the consumer demand was satisfied with excess channel inventory. Thus, our handgun revenue decreased $27.5 million, or 6.5%, from the prior fiscal year because of the decrease in sales of our larger frame M&P branded polymer pistol products, partially offset by increased sales of our small concealed carry polymer pistols and revolvers. Revenue for our long guns decreased $65.1 million, or 41.9%, from the prior fiscal year, primarily because of reduced sales of our modern sporting rifles as a result of lower demand, partially offset by increased lower price point sport rifle sales as well as bolt action and single-shot hunting rifle sales. Other products and services revenue increased by 5.6% over the prior fiscal year, primarily as a result of sales of our injection molding products following the DRP Acquisition in early fiscal 2015, which represented 2.0% of firearm revenue, as well as increased handcuff sales. Firearm revenue was positively impacted by a price increase in January 2014 on a selected number of our products. In total, price increases favorably impacted firearm revenue for fiscal 2015 compared with the prior fiscal year by 0.3% while decreases in the number of units sold impacted firearm revenue by 16.6%. New products, defined as any new SKU not shipped in the prior year, represented 17.4% of firearm revenue for fiscal 2015. Our accessories division revenue following the BTI Acquisition in December 2014 represented 3.7% of total revenue for fiscal 2015.
Handgun unit shipments into our sporting goods distribution channel decreased 9.4% for fiscal 2015 compared with fiscal 2014 primarily as a result of reduced shipments of our M&P branded polymer pistols partially offset by increased unit shipments for revolvers. Our long gun unit shipments into the sporting goods distribution channel decreased 35.5% in fiscal 2015 compared with fiscal 2014 primarily because of lower shipments of our modern sporting rifles. In our professional channel, unit shipments were relatively flat in fiscal 2015 compared with fiscal 2014.
Cost of Sales and Gross Profit
The following table sets forth certain information regarding cost of sales and gross profit for the fiscal years ended April 30, 2016, 2015, and 2014 (dollars in thousands):
|
Total Company |
2016 |
|
|
2015 |
|
|
$ Change |
|
|
% Change |
|
|
2014 |
|
|
|||||
|
Cost of sales |
$ |
429,096 |
|
|
$ |
356,936 |
|
|
$ |
72,160 |
|
|
|
20.2 |
% |
|
$ |
367,515 |
|
|
|
Gross profit |
$ |
293,812 |
|
|
$ |
194,926 |
|
|
$ |
98,886 |
|
|
|
50.7 |
% |
|
$ |
259,105 |
|
|
|
% of net sales (gross margin) |
|
40.6 |
% |
|
|
35.3 |
% |
|
|
|
|
|
|
|
|
|
|
41.3 |
% |
|
|
Firearms Division |
2016 |
|
|
2015 |
|
|
$ Change |
|
|
% Change |
|
|
2014 |
|
|
|||||
|
Cost of sales |
$ |
396,373 |
|
|
$ |
342,663 |
|
|
$ |
53,710 |
|
|
|
15.7 |
% |
|
$ |
367,515 |
|
|
|
Gross profit |
$ |
261,245 |
|
|
$ |
188,559 |
|
|
$ |
72,686 |
|
|
|
38.5 |
% |
|
$ |
259,105 |
|
|
|
% of net sales (gross margin) |
|
39.7 |
% |
|
|
35.5 |
% |
|
|
|
|
|
|
|
|
|
|
41.3 |
% |
|
|
Accessories Division |
2016 |
|
|
2015 |
|
|
$ Change |
|
|
% Change |
|
|
2014 |
|
||||
|
Cost of sales |
$ |
32,723 |
|
|
$ |
14,273 |
|
|
$ |
18,450 |
|
|
|
129.3 |
% |
|
N/A |
|
|
Gross profit |
$ |
32,567 |
|
|
$ |
6,367 |
|
|
$ |
26,200 |
|
|
|
411.5 |
% |
|
N/A |
|
|
% of net sales (gross margin) |
|
49.9 |
% |
|
|
30.8 |
% |
|
|
|
|
|
|
|
|
|
N/A |
|
Fiscal 2016 Cost of Sales and Gross Profit Compared with Fiscal 2015
Gross margin for fiscal 2016 increased by 5.3 percentage points over the prior fiscal year, primarily because of increased production volumes and improved manufacturing fixed-cost absorption, which had an aggregate 6.5 percentage point favorable impact. That increased production volume and favorable manufacturing fixed-cost absorption was partially offset by higher manufacturing spending relative to sales volumes and additional expense recorded as a result of promotional product discounts that, when combined, yielded a 3.1 percentage point reduction to gross margin but contributed to our improved production volumes and favorable absorption. In addition, we recorded inventory adjustments that resulted in a favorable impact on gross margin by 50 basis points. Gross margin for our accessories division favorably impacted total company gross margin by 90 basis points for fiscal 2016 in spite of sales of Thompson/Center accessories that were transitioned into our accessories division on October 1, 2015 that generally
35
have lower gross margins. Gross profit of our accessories division for fiscal 2015 included $4.2 million of increased cost of goods sold from the fair value step-up in inventory as a result of the BTI Acquisition in the prior fiscal year and negatively impacted gross margin for that division by 20.1 percentage points.
Fiscal 2015 Cost of Sales and Gross Profit Compared with Fiscal 2014
Gross margin for fiscal 2015 decreased by 6.0 percentage points from the prior fiscal year, primarily as a result of a combination of reduced sales volumes for our higher-margin products, higher spending relative to sales volumes, additional promotional product discounts, and unfavorable manufacturing fixed-cost absorption during fiscal 2015. That additional spending relative to sales volume and unfavorable manufacturing fixed-cost absorption negatively impacted gross margin by 5.4 percentage points, or $67.4 million, and the additional promotional product discounts resulted in a 1.1 percentage point, or $5.9 million, reduction to gross margin. Our price increases made in early calendar 2014 on selected firearm products increased gross margin by 20 basis points, or $1.9 million, and the DRP Acquisition resulted in a favorable impact of 30 basis points on gross margin for fiscal 2015. As a result of the BTI Acquisition, we were required to record $4.2 million of increased cost of goods sold related to the step-up of inventory, which negatively impacted gross margin for that division by 20.1 percentage points and the total company by 80 basis points.
Operating Expenses
The following table sets forth certain information regarding operating expenses for the fiscal years ended April 30, 2016, 2015, and 2014 (dollars in thousands):
|
|
2016 |
|
|
2015 |
|
|
$ Change |
|
|
% Change |
|
|
2014 |
|
|
|||||
|
Research and development |
$ |
10,005 |
|
|
$ |
6,943 |
|
|
$ |
3,062 |
|
|
|
44.1 |
% |
|
$ |
5,648 |
|
|
|
Selling and marketing |
|
42,257 |
|
|
|
36,033 |
|
|
|
6,224 |
|
|
|
17.3 |
% |
|
|
33,515 |
|
|
|
General and administrative |
|
82,907 |
|
|
|
62,322 |
|
|
|
20,585 |
|
|
|
33.0 |
% |
|
|
68,954 |
|
|
|
Total operating expenses |
$ |
135,169 |
|
|
$ |
105,298 |
|
|
$ |
29,871 |
|
|
|
28.4 |
% |
|
$ |
108,117 |
|
|
|
% of net sales |
|
18.7 |
% |
|
|
19.1 |
% |
|
|
|
|
|
|
|
|
|
|
17.3 |
% |
|
Fiscal 2016 Operating Expenses Compared with Fiscal 2015
Research and development expenses increased $3.1 million from the prior fiscal year, primarily because of $1.2 million of increased salaries and benefits and management incentive accruals and $732,000 of increased depreciation expense on machinery and equipment for new product development as well as $1.2 million increased expenses largely due to the full versus partial year of BTI. Selling and marketing expenses increased $6.2 million over the prior fiscal year as a result of our accessories division having only 19 weeks of expenses in the prior fiscal year as a result of the timing of our BTI Acquisition. In addition, increases in salary and benefits and management incentive accruals were almost entirely offset by reduced advertising and promotional expenses. Excluding the $11.5 million increase in general and administrative expense impact caused by a full year of BTI expenses subsequent to the December 2014 BTI Acquisition, general and administrative costs increased $9.1 million over the prior fiscal year, primarily as a result a $5.7 million increase in salary and benefits and management incentive accruals, $5.3 million of increased profit sharing accruals, partially offset by $2.6 million of lower professional and acquisition related expenses and a $1.8 million insurance recovery during fiscal 2016 for partial reimbursement of defense costs incurred in prior fiscal years related to a previously resolved matter.
36
Fiscal 2015 Operating Expenses Compared with Fiscal 2014
Research and development expenses increased $1.3 million over the prior fiscal year, primarily because of increased expenses related to new product development testing materials. Selling and marketing expenses increased $2.5 million over the prior fiscal year primarily because of additional co-op advertising and other advertising and promotional expenses offset by decreases in salary and benefit costs. General and administrative costs decreased $6.6 million from the prior fiscal year and reflected a $7.5 million reduction from eliminating management incentive compensation expense, a $4.8 million reduction in profit sharing expense, a $3.7 million reduction in stock-based compensation expense, and a $3.2 million reduction in professional fees, primarily relating to consulting services for training and post-implementation support of our ERP system, all of which were partially offset by $3.6 million of intangible amortization expense as a result of the BTI Acquisition, $2.1 million of acquisition-related costs, and $1.7 million of additional depreciation expense.
Operating Income from Continuing Operations
The following table sets forth certain information regarding operating income from continuing operations for the fiscal years ended April 30, 2016, 2015, and 2014 (dollars in thousands):
|
|
2016 |
|
|
2015 |
|
|
$ Change |
|
|
% Change |
|
|
2014 |
|
|
|||||
|
Operating income |
$ |
158,643 |
|
|
$ |
89,628 |
|
|
$ |
69,015 |
|
|
|
77.0 |
% |
|
$ |
150,988 |
|
|
|
% of net sales (operating margin) |
|
21.9 |
% |
|
|
16.2 |
% |
|
|
|
|
|
|
|
|
|
|
24.1 |
% |
|
Fiscal 2016 Operating Income from Continuing Operations Compared with Fiscal 2015
For fiscal 2016, operating income from continuing operations increased $69.0 million over the prior fiscal year, primarily because of higher sales and production volumes for most of our firearm products and the related gross margin impacts as well as the increased sales and margin impacts of owning BTI for a full year, partially offset by increased promotional product expense, higher manufacturing spending relative to revenue, increased profit-related compensation expense, and additional intangible amortization recorded as a result of the BTI Acquisition.
Fiscal 2015 Operating Income from Continuing Operations Compared with Fiscal 2014
For fiscal 2015, operating income from continuing operations declined $61.4 million compared with the prior fiscal year, primarily because of lower sales of our modern sporting rifles and large frame M&P branded polymer pistols and the related operating profit impacts from higher spending, unfavorable manufacturing fixed-cost absorption from reduced net sales, increased advertising and promotional spending, additional depreciation expense from increased capital expenditures, and acquisition-related costs.
Other (Expense)/Income
The following table sets forth certain information regarding other (expense)/income for the fiscal years ended April 30, 2016, 2015, and 2014 (dollars in thousands):
|
|
2016 |
|
|
2015 |
|
|
$ Change |
|
|
% Change |
|
|
2014 |
|
|
|||||
|
Other (expense)/income |
$ |
(22 |
) |
|
$ |
39 |
|
|
$ |
(61 |
) |
|
|
-156.4 |
% |
|
$ |
(2,154 |
) |
|
Other expense for fiscal 2014 included a $2.0 million expense related to the resolution of an SEC investigation.
Interest Expense
The following table sets forth certain information regarding interest expense for the fiscal years ended April 30, 2016, 2015, and 2014 (dollars in thousands):
|
|
2016 |
|
|
2015 |
|
|
$ Change |
|
|
% Change |
|
|
2014 |
|
|
|||||
|
Interest expense |
$ |
13,704 |
|
|
$ |
11,330 |
|
|
$ |
2,374 |
|
|
|
21.0 |
% |
|
$ |
12,261 |
|
|
37
Interest expense increased by $2.4 million primarily as a result of $2.9 million of Senior Note call premium and the write off of $1.7 million of unamortized debt issuance costs, which were expensed in connection with replacing the then-outstanding $100.0 million 5.875% Senior Notes on June 15, 2015, which were replaced with a $105.0 million floating interest rate Term Loan that has been fixed at 3.06% by entering into an interest rate swap agreement. The additional expense for the call premium and debt issuance write off costs was offset by lower interest rate debt subsequent to the Credit Facility restructure.
Interest expense decreased for fiscal 2015 compared with the prior fiscal year primarily as a result of $4.3 million of bond premium and $795,000 of debt issuance write off costs incurred to retire the then-outstanding 9.5% Senior Notes due 2016, or the 9.5% Senior Notes, during fiscal 2014. Interest expense for fiscal 2015 also included the additional interest expense to service our $75.0 million of 5.000% Senior Notes that were not outstanding during fiscal 2014 as well as amortization of debt issuance costs.
Income Tax Expense
The following table sets forth certain information regarding income tax expense for the fiscal years ended April 30, 2016, 2015, and 2014 (dollars in thousands):
|
|
2016 |
|
|
2015 |
|
|
$ Change |
|
|
% Change |
|
|
2014 |
|
|
|||||
|
Income tax expense |
$ |
51,135 |
|
|
$ |
28,905 |
|
|
$ |
22,230 |
|
|
|
76.9 |
% |
|
$ |
48,095 |
|
|
Our income tax expense for fiscal 2016 increased $22.2 million over the prior fiscal year because of higher operating profit partially offset by a decrease in effective tax rate. Our effective tax rate for the fiscal year ended April 30, 2016 was 35.24%, which was a decrease of 1.47% from the effective tax rate of 36.71% for the fiscal year ended April 30, 2015 due to a proportionately larger increase in permanent book versus tax differences as well as a reduction in state taxes.
Income from Continuing Operations
The following table sets forth certain information regarding income from continuing operations and the related per share data for the fiscal years ended April 30, 2016, 2015, and 2014 (dollars in thousands, except per share data):
|
|
2016 |
|
|
2015 |
|
|
$ Change |
|
|
% Change |
|
|
2014 |
|
|
|||||
|
Income from continuing operations |
$ |
93,958 |
|
|
$ |
49,827 |
|
|
$ |
44,131 |
|
|
|
88.6 |
% |
|
$ |
88,627 |
|
|
|
Income per share from continuing operations |
|
|
|
|
|
|
|
|
|
|
|
|
|
|
|
|
|
|
|
|
|
Basic |
$ |
1.72 |
|
|
$ |
0.92 |
|
|
$ |
0.80 |
|
|
|
87.0 |
% |
|
$ |
1.51 |
|
|
|
Diluted |
$ |
1.68 |
|
|
$ |
0.90 |
|
|
$ |
0.78 |
|
|
|
86.7 |
% |
|
$ |
1.47 |
|
|
Fiscal 2016 Income from Continuing Operations Compared with Fiscal 2015
Income from continuing operations of $94.0 million for fiscal 2016 was $44.1 million higher than the $49.8 million for the prior fiscal year, primarily because of higher revenue and gross margin as described above combined with a full year of operating results for BTI. In addition, operating expenses were higher in the current fiscal year because of increased profit sharing and management incentive, partially offset by lower professional and acquisition related expenses. Interest expense was higher in the current fiscal year as a result of retiring our 5.875% Senior Notes in exchange for a lower cost term loan. The increased call premium and debt issuance write off costs as a result of retiring our 5.875% Senior Notes as well as additional intangible amortization expense recorded as a result of the BTI Acquisition negatively impacted net income per diluted share by $0.17 per share, when combined.
Fiscal 2015 Income from Continuing Operations Compared with Fiscal 2014
Income from continuing operations of $49.8 million for fiscal 2015 was $38.8 million lower than the $88.6 million for the prior fiscal year, primarily because of lower sales volumes, a corresponding decrease in gross profit, unfavorable manufacturing spending, additional advertising and promotional expense, additional depreciation expense from increased capital expenditures, and acquisition-related costs. Income per share from continuing operations for fiscal 2015 was favorably impacted by $0.02 from our open market purchases of our common stock that occurred during fiscal 2015 under our stock repurchase program. There was also a favorable impact to income per share from continuing operations of $0.04 per share as a result of the DRP Acquisition. Income per share from continuing operations for fiscal 2015 was negatively impacted by $0.12 per share as a result of increased cost of goods sold from the fair value inventory step-up, acquisition-related costs, and additional intangible amortization expense as a result of the DRP and BTI Acquisitions completed during fiscal 2015. Excluding the expenses for inventory step-up and amortization of intangible assets, the fiscal 2015 acquisitions had a favorable impact on income per share from continuing operations.
38
Liquidity and Capital Resources
Our principal cash requirements are to finance the growth of our operations, including capital expenditures and any potential acquisitions, and to service our existing debt. Capital expenditures for enhancements to manufacturing flexibility, tooling for new product offerings, and various information technology projects represent important cash needs.
The following table sets forth certain cash flow information for the fiscal years ended April 30, 2016, 2015, and 2014 (dollars in thousands):
|
|
2016 |
|
|
2015 |
|
|
$ Change |
|
|
% Change |
|
|
2014 |
|
|||||
|
Operating activities |
$ |
168,557 |
|
|
$ |
114,807 |
|
|
$ |
53,750 |
|
|
|
46.8 |
% |
|
$ |
90,206 |
|
|
Investing activities |
|
(31,992 |
) |
|
|
(186,057 |
) |
|
|
154,065 |
|
|
|
82.8 |
% |
|
|
(62,616 |
) |
|
Financing activities |
|
12,492 |
|
|
|
44,612 |
|
|
|
(32,120 |
) |
|
|
(72.0 |
)% |
|
|
(59,217 |
) |
|
Total cash flow |
$ |
149,057 |
|
|
$ |
(26,638 |
) |
|
$ |
175,695 |
|
|
|
(659.6 |
)% |
|
$ |
(31,627 |
) |
Operating Activities
Operating activities represent the principal source of our cash flow.
Cash flows from operating activities in fiscal 2016 were $168.6 million, or $53.8 million higher than for the prior fiscal year. Cash generated by operating activities for fiscal 2016 was favorably impacted by increased net income of $54.7 million before depreciation and amortization, $13.0 million of increased accounts payable resulting from an effort by procurement to negotiate longer terms with suppliers as well as timing of inventory purchases, $11.2 million of higher payroll accruals because of increased management incentive accruals, and $5.3 million of higher profit sharing accruals because of higher operating profit, partially offset by $2.3 million of increased accounts receivable related to the timing of firearms sales.
Cash flows from operating activities in fiscal 2015 were $114.8 million, or $24.6 million higher than for the prior fiscal year, primarily as a result of the following: a $25.7 million decrease in inventory levels as a result of an initiative to reduce finished parts inventory as well as reduced manufacturing volumes; a decrease in accounts receivable of $11.0 million due to the timing of customer payments and lower sales volumes; a $9.2 million increase in amortization and depreciation expense from increased capital spending and as a result of our acquisitions; and lower income tax payments from lower taxable income. Cash from operating activities was negatively impacted by $7.3 million of reduced accounts payable as a result of reduced manufacturing purchases; a $9.5 million reduction in payroll accruals due to lower profit-related compensation accruals; and a $4.9 million reduction in profit sharing accruals as a result of lower operating profits compared with the prior fiscal year.
Investing Activities
Cash used in investing activities was $32.0, or $154.1 million lower for fiscal 2016 compared with the prior fiscal year, primarily because of the $159.2 million of payments made for acquisitions in the prior fiscal year compared with $1.2 million in the current fiscal year. Slightly offsetting the impact of acquisitions is an increase in cash used for deposits on machinery in the current year of $2.6 million as compared with the prior fiscal year. In addition, we recorded capital spending of $29.5 million, an increase of $1.3 million compared with the prior fiscal year. Major capital expenditures in fiscal 2016 primarily related to enhancements to manufacturing flexibility, tooling for new product offerings, and various information technology projects.
Cash used in investing activities was $186.1 million, or $123.4 million higher for fiscal 2015 compared with the prior fiscal year, primarily as a result of $135.4 million of payments for the BTI Acquisition and to acquire substantially all of the net assets of Hooyman LLC, and a $23.8 million payment for the DRP Acquisition, partially offset by $3.5 million of refunds of deposits for machinery and equipment. We also recorded capital spending of $28.2 million, a reduction of $25.1 million compared with the prior fiscal year.
Financing Activities
Cash provided by financing activities was $12.5 million, or $32.1 million lower for fiscal 2016 compared with the prior fiscal year. Cash provided by financing activities during the current fiscal year was primarily impacted by receiving $11.3 million of proceeds from the exercise of options to acquire our common stock. The $105.0 million of borrowings on our new Term Loan was entirely offset by the retirement of the $100.0 million outstanding principal balance of 5.875% Senior Notes in June 2015 and subsequent quarterly payments on the Term Loan totaling $4.7 million. We paid $1.0 million of debt issuance costs related to the Credit Agreement as discussed below.
Cash provided by financing activities was $44.6 million for fiscal 2015 compared with cash used in financing activities of $59.2 million for fiscal 2014. Cash provided by financing activities was primarily a result of $75.0 million of proceeds related to the
39
issuance of our 5.000% Senior Notes, partially offset by our completed $30.0 million stock repurchase program. We also paid $2.4 million of debt issuance costs related to the 5.000% Senior Notes issuance as discussed in Note 6 to our consolidated financial statements.
During the past three fiscal years, our board of directors authorized the repurchase of $195.0 million of our common stock through multiple stock repurchase programs, of which $50.0 million remained authorized to repurchase, subject to certain conditions, in the open market or in privately negotiated transactions as of April 30, 2016. Since fiscal 2014, we repurchased 10.8 million shares of our common stock in the open market for $129.4 million and 1.4 million shares of our common stock pursuant to a tender offer for $15.6 million utilizing cash on hand.
During fiscal 2015, we partially exercised an accordion feature on our line of credit to increase it by $50.0 million to $125.0 million, and on December 11, 2014, we borrowed $100.0 million on our expanded line of credit to fund the BTI Acquisition. We repaid the entire $100.0 million of borrowings under our line of credit during the fourth quarter of fiscal 2015. On April 13, 2015, we exercised the remaining $50.0 million expansion under the accordion feature of our credit agreement to increase the line of credit available to us to $175.0 million.
On June 15, 2015, we entered into a Credit Agreement, which provides for a $175.0 million Revolving Line and a $105.0 million Term Loan, which both mature on June 15, 2020. We had no borrowings on our Revolving Line and $100.3 million outstanding on our Term Loan as of April 30, 2016. We used the proceeds from the Term Loan to redeem the entire $100.0 million outstanding principal balance of our then outstanding 5.875% Senior Notes, plus accrued and unpaid interest to the redemption date, in June 2015. See Note 6 – Notes Payable and Financing Arrangements in the notes to the consolidated financial statements for additional information regarding our credit facility. Additional proceeds under the credit facility are expected to be used for general corporate purposes.
On June 18, 2015, we entered into an interest rate swap agreement, which expires on June 15, 2020, covering $105.0 million of floating rate debt under the Term Loan. On July 6, 2015, we executed an interest rate swap pursuant to such agreement, which requires us to pay interest at a defined rate of 1.56% while receiving interest at a defined variable rate of one-month LIBOR (0.188% at July 31, 2015). The notional amount of the interest rate swap was $105.0 million and had an aggregate fair value of $1.3 million as of April 30, 2016. This swap, when combined with the applicable margin based on our consolidated leverage ratio as of January 31, 2016, effectively fixed our interest rate on the Term Loan, subject to change based on changes in our consolidated leverage ratio. As of April 30, 2016, our interest rate on the Term Loan was 3.06%. We do not expect the interest rate swap to have any material effect on earnings within the next 12 months.
During fiscal 2015, we issued an aggregate of $75.0 million of 5.000% Senior Notes due 2018, or the 5.000% Senior Notes, to various institutional investors pursuant to the terms and conditions of an indenture, or the 5.000% Senior Notes Indenture, and collectively with the indenture governing the 5.875% Senior Notes, the Senior Notes Indentures, and purchase agreements. The 5.000% Senior Notes bear interest at a rate of 5.000% per annum payable on January 15 and July 15 of each year, beginning on January 15, 2015.
At any time prior to July 15, 2016, we may, at our option (a) upon not less than 30 nor more than 60 days’ prior notice, redeem all or a portion of the 5.000% Senior Notes at the redemption price of 100% of the principal amount of the 5.000% Senior Notes, plus an applicable premium, plus accrued and unpaid interest as of the redemption date; or (b) redeem up to 35% of the aggregate principal amount of the 5.000% Senior Notes with the net cash proceeds of one or more equity offerings at a redemption price of 105.000% of the principal amount of the 5.000% Senior Notes, plus accrued and unpaid interest as of the redemption date; provided, that in the case of the foregoing clause, at least 65% of the aggregate original principal amount of the 5.000% Senior Notes remains outstanding, and the redemption occurs within 60 days after the closing of the equity offering. On and after July 15, 2016, we may, at our option, upon not less than 30 nor more than 60 days’ prior notice, redeem all or a portion of the 5.000% Senior Notes at the redemption price of (a) 102.500% of the principal amount of the 5.000% Senior Notes to be redeemed, if redeemed during the 12-month period beginning on July 15, 2016; or (b) 100% of the principal amount of the 5.000% Senior Notes to be redeemed, if redeemed during the 12-month period beginning on July 15, 2017, plus, in either case, accrued and unpaid interest on the 5.000% Senior Notes as of the applicable redemption date. Subject to certain restrictions and conditions, we may be required to make an offer to repurchase the 5.000% Senior Notes from the holders of the 5.000% Senior Notes in connection with a change of control or disposition of assets. If not redeemed by us or repaid pursuant to the holders’ right to require repurchase, the 5.000% Senior Notes mature on July 15, 2018.
The 5.000% Senior Notes are general, unsecured obligations of our company. The 5.000% Senior Notes Indenture contains certain affirmative and negative covenants, including limitations on restricted payments (such as share repurchases, dividends, and early payment of indebtedness), limitations on indebtedness, limitations on the sale of assets, and limitations on liens. Payments that would otherwise be characterized as restricted payments are permitted under the 5.000% Senior Notes Indenture in an amount not to
40
exceed 50% of our consolidated net income for the period from the issue date to the date of the restricted payment, provided that at the time of making such payments, (a) no default has occurred or would result from the making of such payments, and (b) we are able to satisfy the debt incurrence test under the 5.000% Senior Notes Indenture, or the 5.000% Senior Notes Lifetime Aggregate Limit. In addition, the 5.000% Senior Notes Indenture provides for other exceptions to the restricted payments covenant, each of which are independent of the 5.000% Senior Notes Lifetime Aggregate Limit. Among such exceptions are (i) the ability to make share repurchases each fiscal year in an amount not to exceed the lesser of (A) $50.0 million in any fiscal year or (B) 75.0% of our consolidated net income for the previous four consecutive published fiscal quarters prior to the date of the determination of such consolidated net income, and (ii) share repurchases over the life of the 5.000% Senior Notes in an aggregate amount not to exceed $75.0 million.
The limitation on indebtedness in the 5.000% Senior Notes Indenture is only applicable at such time that the consolidated coverage ratio (as set forth in the 5.000% Senior Notes Indenture) for us and our restricted subsidiaries is less than 3.00 to 1.00. In general, as set forth in the 5.000% Senior Notes Indenture, the consolidated coverage ratio is determined by comparing our prior four quarters’ consolidated EBITDA (earnings before interest, taxes, depreciation, and amortization) to our consolidated interest expense.
The Credit Agreement contains financial covenants relating to maintaining maximum leverage and minimum debt service coverage. The 5.000% Senior Notes Indenture contains a financial covenant relating to times interest earned. We were in compliance with all debt covenants as of April 30, 2016.
At April 30, 2016, we had $191.3 million in cash and cash equivalents on hand.
Based upon our current working capital position, current operating plans, and expected business conditions, we believe that our existing capital resources and credit facilities will be adequate to fund our operations, including our outstanding debt and other commitments, for the next 12 months, apart from any major acquisitions.
Our future capital requirements will depend on many factors, including net sales, the timing and extent of spending to support product development efforts, the expansion of sales and marketing activities, the timing of introductions of new products and enhancements to existing products, the costs to ensure access to adequate manufacturing capacity, and any acquisitions or strategic investments that we may determine to make. Further equity or debt financing may not be available to us on acceptable terms or at all. If sufficient funds are not available or are not available on acceptable terms, our ability to take advantage of unexpected business opportunities or to respond to competitive pressures could be limited or severely constrained.
Inflation
We do not believe that inflation had a material impact on us during fiscal 2016, 2015, or 2014.
Critical Accounting Policies
Revenue Recognition
For our firearm and accessories products, we recognize revenue when the following four basic criteria have been met: (1) persuasive evidence of an arrangement exists; (2) delivery has occurred or services have been provided; (3) the fee is fixed or determinable; and (4) collection is reasonably assured.
Product sales account for most of our revenue. We recognize revenue from product sales when the earnings process is complete and the risks and rewards of ownership have transferred to the customer, which is generally upon shipment but could be delayed until the receipt of customer acceptance. We also provide tooling, forging, heat treating, finishing, plating, and engineering support services to customers; we recognize this revenue when accepted by the customer, if applicable, when no further contingencies or material performance obligations exist, and when collectability is reasonably assured, thereby earning us the right to receive and retain payments for services performed and billed.
Valuation of Long-lived Tangible and Intangible Assets
We evaluate the recoverability of long-lived assets, or asset groups, whenever events or changes in circumstances indicate that carrying amounts may not be recoverable. When such evaluations indicate that the related future undiscounted cash flows are not sufficient to recover the carrying values of the assets, such carrying values are reduced to fair value and this adjusted carrying value becomes the asset’s new cost basis. We determine fair value primarily using future anticipated cash flows that are directly associated with and that are expected to arise as a direct result of the use and eventual disposition of the asset, or asset group, discounted using an interest rate commensurate with the risk involved.
41
We have significant long-lived tangible and intangible assets, which are susceptible to valuation adjustments as a result of changes in various factors or conditions. The most significant long-lived tangible and intangible assets are property, plant, and equipment, patents, trademarks, and trade names. We amortize all finite-lived intangible assets either on a straight-line basis or based upon patterns in which we expect to utilize the economic benefits of such assets. We initially determine the values of intangible assets by a risk-adjusted, discounted cash flow approach. We assess the potential impairment of identifiable intangible assets and fixed assets whenever events or changes in circumstances indicate that the carrying values may not be recoverable and at least annually. Factors we consider important, which could trigger an impairment of such assets, include the following:
|
|
· |
significant underperformance relative to historical or projected future operating results; |
|
|
· |
significant changes in the manner of or use of the assets or the strategy for our overall business; |
|
|
· |
significant negative industry or economic trends; |
|
|
· |
significant decline in our stock price for a sustained period; and |
|
|
· |
a decline in our market capitalization below net book value. |
Future adverse changes in these or other unforeseeable factors could result in an impairment charge that could materially impact future results of operations and financial position in the reporting period identified. No impairment charges were recorded in fiscal 2016, 2015, or 2014 based on the review of long-lived tangible and intangible assets.
In accordance with Accounting Standards Codification, or ASC, 350, Intangibles-Goodwill and Other, we test goodwill for impairment on an annual basis on February 1 and between annual tests if indicators of potential impairment exist. The impairment test compares the fair value of the reporting unit to its carrying amount, including intangible assets with indefinite lives, to assess whether impairment is present. We have reviewed the provisions of ASC 280-10, Segment Reporting Topic, with respect to the criteria necessary to evaluate the number of reporting units that exist. Based on our review of ASC 280-10-50, we have determined that we operate our operations in two reporting units: firearms and accessories. As of April 30, 2016, we have recorded $76.4 million of goodwill, of which, $13.8 million was recorded as a result of our DRP Acquisition and $62.6 million was recorded as a result of our BTI Acquisition and subsequent acquisitions by BTI.
We estimate the fair value of our firearms and accessories business units using an equal weighting of the fair values derived from the income approach and the market approach because we believe a market participant would equally weight both approaches when valuing the reporting units. The income approach is based on the projected cash flows that are discounted to their present value using discount rates that consider the timing and risk of the forecasted cash flows. Fair value is estimated using internally-developed forecasts and assumptions. The discount rate used is the average estimated value of a market participant’s cost of capital and debt, derived using customary market metrics. Other significant assumptions include revenue growth rates, profitability projections, and terminal value growth rates. The market approach estimates fair values based on the determination of appropriate publicly traded market comparison companies and market multiples of revenue and earnings derived from those companies with similar operating and investment characteristics as the reporting unit being valued. Finally, we compare and reconcile our overall fair value to our market capitalization in order to assess the reasonableness of the calculated fair values of our reporting units. The foregoing assumptions could deviate materially from actual results. Based on our annual impairment assessment, we determined that the fair value of our firearms and accessories reporting units were significantly in excess of their respective book values.
Inventories
We value firearm inventories, consisting primarily of finished firearms, firearm components, and related products, as well as our accessories inventories, at the lower of cost, using the first-in, first-out, or FIFO, method, or market. An allowance for potential non-saleable inventory due to excess stock or obsolescence is based upon a detailed review of inventory components, past history, and expected future usage.
Warranty
We generally provide a limited one year warranty and a lifetime service policy to the original purchaser of our new firearm products. We provide for estimated warranty obligations in the period in which we recognize the related revenue. We quantify and record an estimate for warranty-related costs based on our actual historical claims experience and current repair costs. We make adjustments to accruals as warranty claims data and historical experience warrant. Should we experience actual claims and repair costs that are higher than the estimated claims and repair costs used to calculate the provision, our operating results for the period or periods in which such returns or additional costs materialize would be adversely impacted.
42
Recent Accounting Pronouncements
The nature and impact of recent accounting pronouncements is discussed in Note 3 to our consolidated financial statements, which is incorporated herein by reference.
Contractual Obligations and Commercial Commitments
The following table sets forth a summary of our material contractual obligations and commercial commitments as of April 30, 2016 (in thousands):
|
|
|
|
|
|
|
Less Than |
|
|
|
|
|
|
|
|
|
|
|
|
More Than |
|
||||
|
|
Total |
|
|
1 Year |
|
|
1-3 Years |
|
|
3-5 Years |
|
|
5 Years |
|
||||||||||
|
|
|
|
|
|
|
|
|
|
|
|
|
|
|
|
|
|
|
|
|
|
|
|
|
|
|
Long-term debt obligations |
$ |
|
194,705 |
|
|
$ |
|
13,055 |
|
|
$ |
|
97,556 |
|
|
$ |
|
84,094 |
|
|
$ |
— |
|
|
|
Capital lease obligation |
|
|
1,494 |
|
|
|
|
1,494 |
|
|
|
|
— |
|
|
|
— |
|
|
|
— |
|
||
|
Operating lease obligations |
|
|
14,443 |
|
|
|
|
2,122 |
|
|
|
|
3,994 |
|
|
|
|
3,759 |
|
|
|
|
4,568 |
|
|
Purchase obligations |
|
|
67,154 |
|
|
|
|
67,154 |
|
|
|
— |
|
|
|
— |
|
|
|
— |
|
|||
|
Total obligations |
$ |
|
277,796 |
|
|
$ |
|
83,825 |
|
|
$ |
|
101,550 |
|
|
$ |
|
87,853 |
|
|
$ |
|
4,568 |
|
During fiscal 2016, we entered into our credit facility, which consists of a $175.0 million Revolving Line and a $105.0 million Term Loan, which both mature on June 15, 2020. We used the proceeds from the Term Loan to redeem the then outstanding $100.0 million principal balance of our 5.875% Senior Notes, plus accrued interest and unpaid interest to the redemption date, in June 2015. Included in the above long-term debt obligation is $11.1 million of contractually obligated interest payments pertaining to the $100.3 million remaining balance of our Term Loan, which represents interest payments through July 15, 2020.
During fiscal 2015, we issued an aggregate of $75.0 million of 5.000% Senior Notes to various institutional investors. Included in the above long-term debt obligation is $8.3 million of contractually obligated interest payments pertaining to the $75.0 million remaining balance of our 5.000% Senior Notes, which represents interest payments through July 15, 2018.
Off-Balance Sheet Arrangements
We do not have any transactions, arrangements, or other relationships with unconsolidated entities that are reasonably likely to affect our liquidity or capital resources. We have no special purpose or limited purpose entities that provide off-balance sheet financing, liquidity, or market or credit risk support or that engage in leasing, hedging, research and development services, or other relationships that expose us to liability that is not reflected on the face of the financial statements.
Item 7A. Quantitative and Qualitative Disclosures about Market Risk
We do not enter into any market risk sensitive instruments for trading purposes. Our principal market risk relates to the variable interest rate associated with our Credit Agreement, which consists of a $175.0 million revolving line of credit and a $105.0 million Term Loan, that bear interest at a variable rate equal to LIBOR or prime, at our election, plus an applicable margin based on our consolidated leverage ratio. As of April 30, 2016, there were no borrowings outstanding on the Revolving Line. Had there been borrowings, they would have borne an interest rate of 4.00% per annum if we had selected the prime rate option and a range of 1.94% to 2.13% per annum if we had selected the LIBOR rate option. We were required to obtain fixed interest rate protection on the Term Loan covering not less than 75% of the aggregate outstanding principal balance of the Term Loan. Accordingly, on June 18, 2015, we entered into an interest rate swap agreement, which expires on June 15, 2020, that covered 100% of the $105.0 million of floating rate debt. On July 6, 2015, we executed an interest rate swap pursuant to such agreement. This swap, when combined with the applicable margin based on our consolidated leverage ratio, effectively fixed our interest rate on the Term Loan at 3.06%, which is subject to change based on our consolidated leverage ratio.
Item 8. Financial Statements and Supplementary Data
Reference is made to the financial statements, the notes thereto, and the report thereon, commencing on page F-1 of this report, which financial statements, notes, and report are incorporated herein by reference.
Item 9. Changes in and Disagreements with Accountants on Accounting and Financial Disclosure
Not applicable.
43
Item 9A. Controls and Procedures
Conclusions Regarding Disclosure Controls and Procedures
Under the supervision and with the participation of our management, including our Chief Executive Officer and Chief Financial Officer, we conducted an evaluation of the effectiveness of the design and operation of our disclosure controls and procedures (as defined in Rules 13a-15(e) and 15d-15(e) under the Exchange Act). Based on this evaluation, our Chief Executive Officer and Chief Financial Officer, as of April 30, 2016, concluded that our disclosure controls and procedures (as defined in Rules 13a-15(e) and 15d-15(e) under the Exchange Act) are effective to ensure that information required to be disclosed by us in reports that we file or submit under the Exchange Act was recorded, processed, summarized, and reported within the time periods specified in SEC rules and forms, and that such information is accumulated and communicated to our management, including our Chief Executive Officer and Chief Financial Officer, as appropriate, to allow timely decisions regarding required disclosure.
Changes in Internal Control Over Financial Reporting
There was no change in our internal control over financial reporting that occurred during our fourth fiscal quarter of 2016 that has materially affected, or is reasonably likely to materially affect, our internal control over financial reporting.
Inherent Limitations on Effectiveness of Controls
Our management, including our Chief Executive Officer and Chief Financial Officer, does not expect that our disclosure controls and procedures or our internal controls will prevent all error and all fraud. A control system, no matter how well conceived and operated, can provide only reasonable, not absolute, assurance that the objectives of the control system are met. Further, the design of a control system must reflect the fact that there are resource constraints, and the benefits of controls must be considered relative to their costs. Because of the inherent limitations in all control systems, no evaluation of controls can provide absolute assurance that all control issues, misstatements, errors, and instances of fraud, if any, within our company have been or will be prevented or detected. Further, internal controls may become inadequate as a result of changes in conditions, or through the deterioration of the degree of compliance with policies or procedures.
44
MANAGEMENT’S REPORT ON INTERNAL CONTROL OVER FINANCIAL REPORTING
Management of Smith & Wesson Holding Corporation (the “Company”) is responsible for establishing and maintaining adequate internal control over financial reporting, as such term is defined in Rule 13a-15(f) of the Securities Exchange Act of 1934. With the participation of the Chief Executive Officer and the Chief Financial Officer, management conducted an evaluation of the effectiveness of the Company’s internal control over financial reporting as of April 30, 2016 as required by Rule 13a-15(c) under the Securities Exchange Act of 1934. The Company utilized the criteria and framework established by the Committee of Sponsoring Organizations (COSO) of the Treadway Commission in Internal Control — Integrated Framework (2013) in performing this assessment. Based on this evaluation, management concluded that the Company’s internal control over financial reporting was effective as of April 30, 2016.
Internal control over financial reporting is a process designed to provide reasonable assurance regarding the reliability of financial reporting and the preparation of financial statements for external purposes in accordance with generally accepted accounting principles. Because of its inherent limitations, internal control over financial reporting may not prevent or detect misstatements.
The Company’s independent registered public accounting firm, Deloitte & Touche LLP, has audited the effectiveness of the Company’s internal control over financial reporting as of April 30, 2016 as stated in their report dated June 16, 2016, on page F-2 of this Annual Report on Form 10-K.
|
/s/ P. James Debney |
|
P. James Debney |
|
President and Chief Executive Officer
|
|
|
|
/s/ Jeffrey D. Buchanan |
|
Jeffrey D. Buchanan |
|
Executive Vice President, Chief Financial Officer, and Treasurer |
45
Not applicable.
Item 10. Directors, Executive Officers and Corporate Governance
The information required by this Item relating to our directors and corporate governance is incorporated herein by reference to the definitive Proxy Statement to be filed pursuant to Regulation 14A of the Exchange Act for our 2016 Annual Meeting of Stockholders. The information required by this Item relating to our executive officers is included in Item 1, “Business — Executive Officers” of this report.
Item 11. Executive Compensation
The information required by this Item is incorporated herein by reference to the definitive Proxy Statement to be filed pursuant to Regulation 14A of the Exchange Act for our 2016 Annual Meeting of Stockholders.
Item 12. Security Ownership of Certain Beneficial Owners and Management and Related Stockholder Matters
The information required by this Item is incorporated herein by reference to the definitive Proxy Statement to be filed pursuant to Regulation 14A of the Exchange Act for our 2016 Annual Meeting of Stockholders.
Item 13. Certain Relationships and Related Transactions, and Director Independence
The information required by this Item is incorporated herein by reference to the definitive Proxy Statement to be filed pursuant to Regulation 14A of the Exchange Act for our 2016 Annual Meeting of Stockholders.
Item 14. Principal Accountant Fees and Services
The information required by this Item is incorporated herein by reference to the definitive Proxy Statement to be filed pursuant to Regulation 14A of the Exchange Act for our 2016 Annual Meeting of Stockholders.
46
Item 15. Exhibits and Financial Statement Schedules
(a) Financial Statements and Financial Statement Schedules
(1) Consolidated Financial Statements are listed in the Index to Consolidated Financial Statements on page F-1 of this report.
(2) Financial Statement Schedules: Schedule II — Valuation and Qualifying Accounts for the years ended April 30, 2016, 2015, and 2014 is set forth on page F-32 of this report.
(b) Exhibits
|
Exhibit Number |
|
Exhibit |
|
|
|
|
|
2.9 |
|
Stock Purchase and Sale Agreement, dated November 25, 2014, by and among the Registrant, Clearview Battenfeld Acquisition Company LLC, and the Members named therein(1) |
|
|
|
|
|
3.1 |
|
Amended and Restated Articles of Incorporation(2) |
|
|
|
|
|
3.3(b) |
|
Amended and Restated Bylaws(3) |
|
|
|
|
|
3.9(a) |
|
Certificate of Withdrawal of Certificate of Designation(4) |
|
|
|
|
|
4.1 |
|
Form of Common Stock Certificate(5) |
|
|
|
|
|
4.30 |
|
Indenture, dated as of June 17, 2014, among the Registrant and The Bank of New York Mellon Trust Company, N.A., as Trustee(6) |
|
|
|
|
|
4.30(a) |
|
First Supplemental Indenture, dated as of June 26, 2014, among the Registrant and The Bank of New York Mellon Trust Company, N.A., as Trustee(7) |
|
|
|
|
|
10.24(a)* |
|
Amended and Restated 2004 Incentive Stock Plan(8) |
|
|
|
|
|
|
|
|
|
10.28* |
|
Amendments to 2004 Incentive Stock Plan(9) |
|
|
|
|
|
10.51** |
|
Agreement with Respect to Defense of Smith & Wesson: Firearms Litigation, dated as of November 11, 2004(10) |
|
|
|
|
|
|
|
|
|
10.56* |
|
Form of Restricted Stock Unit Award Agreement to the 2004 Incentive Stock Plan(11) |
|
|
|
|
|
10.72* |
|
Form of Indemnity Agreement entered into with the following directors and executive officers: As of June 29, 2009 with Barry M. Monheit, Michael F. Golden, Robert L. Scott, John B. Furman, Mitch A. Saltz, I. Marie Wadecki, and Jeffrey D. Buchanan; as of November 2009 with P. James Debney; as of July 2011 with Robert H. Brust; as of December 14, 2011 with Mark P. Smith; and as of April 24, 2013 with Robert J. Cicero(12) |
|
|
|
|
|
10.83(a)* |
|
Amended and Restated Severance and Change in Control Agreement, executed December 8, 2011 as of January 3, 2011, by and between the Registrant and Jeffrey D. Buchanan(13) |
|
|
|
|
|
10.91(a)* |
|
Amended and Restated Employment Agreement, executed December 8, 2011 as of September 26, 2011, between P. James Debney and Smith & Wesson Holding Corporation(13) |
|
|
|
|
|
10.95* |
|
Letter of Amendment, dated September 9, 2011, between Jeffrey D. Buchanan and the Registrant(13) |
|
|
|
|
|
10.96* |
|
Letter of Amendment, dated September 9, 2011, between P. James Debney and Smith & Wesson Holding Corporation(13) |
|
|
|
|
|
|
|
|
|
10.98* |
|
Form of Non-Qualified Stock Option Award Grant Notice and Agreement to the 2004 Incentive Stock Plan(13) |
|
|
|
|
|
10.99* |
|
Form of Restricted Stock Unit Award Grant Notice and Agreement to the 2004 Incentive Stock Plan(13) |
|
|
|
|
|
10.100* |
|
Amended and Restated 2011 Employee Stock Purchase Plan(14) |
|
|
|
|
|
10.101* |
|
Form of Performance-Based Restricted Stock Unit Award Grant Notice and Agreement to the 2004 Incentive Stock Plan for awards made beginning in April 2012(14) |
47
|
Exhibit Number |
|
Exhibit |
|
|
|
|
|
10.102* |
|
Form of Time-Based Restricted Stock Unit Award Grant Notice and Agreement to the 2004 Incentive Stock Plan for awards made beginning in April 2012(14) |
|
|
|
|
|
10.104 |
|
Credit Agreement, dated as of August 15, 2014, among the Registrant and Smith & Wesson Corp., as Borrowers, the Subsidiaries of the Borrowers party thereto, as the Guarantors, TD Bank, N.A., as the Administrative Agent, the other lenders party thereto from time to time, and TD Securities (USA) LLC, as Sole Lead Arranger and Sole Bookrunner, including all exhibits thereto(15) |
|
|
|
|
|
10.104(a) |
|
First Amendment to Credit Agreement, dated as of November 25, 2014, by and among the Registrant, Smith & Wesson Corp., the guarantors, the lenders, and TD Bank, N.A. as Administrative Agent amd Swingline Lender(1) |
|
|
|
|
|
10.104(b) |
|
Second Amendment to Credit Agreement, dated as of April 13, 2015, by and among the Registrant, Smith & Wesson Corp., the guarantors, the lenders, and TD Bank, N.A. as Administrative Agent and Swingline Lender(16) |
|
|
|
|
|
|
|
|
|
10.106 |
|
Master Letter of Credit Agreement, dated as of August 15, 2014, between TD Bank, N.A. and the Registrant and Smith & Wesson Corp., as modified by the letter agreement, dated as of August 15, 2014, addressed to the Registrant and its Subsidiaries from T.D. Bank, N.A.(15) |
|
|
|
|
|
10.106(a) |
|
First Amendment to Master Letter of Credit Agreement, dated as of June 15, 2015, between TD Bank, N.A. and the Registrant and Smith & Wesson Corp.(17) |
|
|
|
|
|
10.107* |
|
Smith & Wesson Holding Corporation Executive Severance Pay Plan(18) |
|
|
|
|
|
10.108* |
|
Adoption Agreement to the Smith & Wesson Nonqualified Supplemental Deferred Compensation Plan(19) |
|
|
|
|
|
10.109* |
|
Smith & Wesson Nonqualified Supplemental Deferred Compensation Plan Document(19) |
|
|
|
|
|
10.110* |
|
2013 Incentive Stock Plan(20) |
|
|
|
|
|
10.111* |
|
Form of Restricted Stock Unit Award Grant Notice and Agreement to the 2014 Incentive Stock Plan for awards made beginning in April 2014(21) |
|
|
|
|
|
10.111(a)* |
|
Form of Restricted Stock Unit Grant Notice and Agreement to the 2013 Incentive Stock Plan for awards made beginning in September 2014(17) |
|
|
|
|
|
10.111(b)* |
|
Form of Restricted Stock Unit Award Grant Notice and Agreement to the 2013 Incentive Stock Plan for awards made beginning in April 2015(17) |
|
|
|
|
|
10.112* |
|
Form of Performance Stock Unit Award Grant Notice and Agreement to the 2013 Incentive Stock Plan for awards made beginning in April 2014(21) |
|
|
|
|
|
10.112(a)* |
|
Form of Performance Stock Unit Award Grant Notice and Agreement to the 2013 Incentive Stock Plan for awards made beginning in April 2015(17) |
|
|
|
|
|
10.113 |
|
Credit Agreement, dated as of June 15, 2015, among the Registrant and Smith & Wesson Corp., as Borrowers, the Subsidiaries of the Borrowers party thereto, as the guarantors, TD Bank, N.A., as the Administrative Agent, the other lenders party thereto from time to time, TD Securities (USA) LLC, Branch Banking and Trust Company, Regions Business Capital, and Wells Fargo Securities, LLC, as Joint Lead Arrangers and Joint Bookrunners, and Branch Banking and Trust Company, Regions Bank, and Wells Fargo Securities, LLC, as Co-Syndication Agents, including all exhibits thereto(17) |
|
|
|
|
|
16 |
|
Letter of BDO USA, LLP to the Securities and Exchange Commission dated June 25, 2014(22) |
|
|
|
|
|
21.1 |
|
Subsidiaries of the Registrant |
|
|
|
|
|
23.1 |
|
Consent of Deloitte & Touche LLP, an Independent Registered Public Accounting Firm |
|
|
|
|
|
23.2 |
|
Consent of BDO USA, LLP, an Independent Registered Public Accounting Firm |
48
|
Exhibit Number |
|
Exhibit |
|
|
|
|
|
31.1 |
|
Rule 13a-14(a)/15d-14(a) Certification of Principal Executive Officer |
|
|
|
|
|
31.2 |
|
Rule 13a-14(a)/15d-14(a) Certification of Principal Financial Officer |
|
|
|
|
|
32.1 |
|
Section 1350 Certification of Principal Executive Officer |
|
|
|
|
|
32.2 |
|
Section 1350 Certification of Principal Financial Officer |
|
|
|
|
|
101.INS |
|
XBRL Instance Document |
|
|
|
|
|
101.SCH |
|
XBRL Taxonomy Extension Schema Document |
|
|
|
|
|
101.CAL |
|
XBRL Taxonomy Extension Calculation Linkbase Document |
|
|
|
|
|
101.DEF |
|
XBRL Taxonomy Extension Definition Linkbase Document |
|
|
|
|
|
101.LAB |
|
XBRL Taxonomy Extension Label Linkbase Document |
|
|
|
|
|
101.PRE |
|
XBRL Taxonomy Extension Presentation Linkbase Document |
|
|
|
* |
Management contract or compensatory arrangement. |
|
** |
An application has been submitted to the Securities and Exchange Commission for confidential treatment, pursuant to Rule 24b-2 of the Securities Exchange Act of 1934, of portions of this exhibit. These portions have been omitted from this exhibit. |
|
(1) |
Incorporated by reference to the Registrant’s Form 8-K filed with the SEC on November 26, 2014. |
|
(2) |
Incorporated by reference to the Registrant’s Proxy Statement on Schedule 14A filed with the SEC on August 11, 2004. |
|
(3) |
Incorporated by reference to the Registrant’s Form 8-K filed with the SEC on March 20, 2015. |
|
(4) |
Incorporated by reference to the Registrant’s Form 8-K filed with the SEC on October 1, 2013. |
|
(5) |
Incorporated by reference to the Registrant’s Form S-3 (No. 333-136842) filed with the SEC on August 23, 2006. |
|
(6) |
Incorporated by reference to the Registrant’s Form 8-K/A filed with the SEC on June 17, 2013. |
|
(7) |
Incorporated by reference to the Registrant’s Form 8-K filed with the SEC on June 26, 2013. |
|
(8) |
Incorporated by reference to the Registrant’s Form 8-K filed with the SEC on September 28, 2011. |
|
(9) |
Incorporated by reference to the Registrant’s Proxy Statement on Schedule 14A filed with the SEC on August 14, 2006. |
|
(10) |
Incorporated by reference to the Registrant’s Form 10-Q filed with the SEC on March 10, 2005. |
|
(11) |
Incorporated by reference to the Registrant’s Form 8-K filed with the SEC on May 19, 2006. |
|
(12) |
Incorporated by reference to the Registrant’s Form 10-K filed with the SEC on June 30, 2009. |
|
(13) |
Incorporated by reference to the Registrant’s Form 10-Q filed with the SEC on December 8, 2011. |
|
(14) |
Incorporated by reference to the Registrant’s Form 10-K filed with the SEC on June 28, 2012. |
|
(15) |
Incorporated by reference to the Registrant’s Form 8-K filed with the SEC on August 19, 2013. |
|
(16) |
Incorporated by reference to the Registrant’s Form 8-K filed with the SEC on April 15, 2015. |
|
(17) |
Incorporated by reference to the Registrant’s Form 10-K filed with the SEC on June 22, 2015. |
|
(18) |
Incorporated by reference to the Registrant’s Amendment No.2 to Schedule TO filed with the SEC on July 10, 2013. |
|
(19) |
Incorporated by reference to the Registrant’s Form 8-K filed with the SEC on December 20, 2013. |
|
(20) |
Incorporated by reference to the Registrant’s Form S-8 filed with the SEC on December 20, 2013. |
|
(21) |
Incorporated by reference to the Registrant’s Form 10-K filed with the SEC on June 19, 2014. |
|
(22) |
Incorporated by reference to the Registrant’s Form 8-K filed with the SEC on June 26, 2014. |
49
Pursuant to the requirements of Section 13 or 15(d) of the Securities Exchange Act of 1934, the registrant has duly caused this report to be signed on its behalf by the undersigned, thereunto duly authorized.
|
SMITH & WESSON HOLDING CORPORATION |
|
|
|
/s/ P. James Debney |
|
P. James Debney President and Chief Executive Officer |
Date: June 16, 2016
Pursuant to the requirements of the Securities Exchange Act of 1934, this report has been signed below by the following persons on behalf of the registrant and in the capacities and on the date indicated.
|
Signature |
|
Capacity |
|
Date |
|
|
|
|
|
|
|
/s/ P. James Debney |
|
President, Chief Executive Officer, and Director (Principal Executive Officer) |
|
June 16, 2016 |
|
P. James Debney |
||||
|
|
|
|
|
|
|
/s/ Jeffrey D. Buchanan |
|
Executive Vice President, Chief Financial Officer, and Treasurer (Principal Accounting and Financial Officer) |
|
June 16, 2016 |
|
Jeffrey D. Buchanan
|
||||
|
|
|
|
|
|
|
/s/ Barry M. Monheit |
|
Chairman of the Board |
|
June 16, 2016 |
|
Barry M. Monheit |
||||
|
|
|
|
|
|
|
|
|
|
|
|
|
/s/ Robert L. Scott |
|
Vice Chairman of the Board |
|
June 16, 2016 |
|
Robert L. Scott |
||||
|
|
|
|
|
|
|
/s/ Robert H. Brust |
|
Director |
|
June 16, 2016 |
|
Robert H. Brust |
|
|
|
|
|
|
|
|
|
|
|
/s/ John B. Furman |
|
Director |
|
June 16, 2016 |
|
John B. Furman |
||||
|
|
|
|
|
|
|
/s/ Gregory J. Gluchowski, Jr. |
|
Director |
|
June 16, 2016 |
|
Gregory J. Gluchowski, Jr. |
||||
|
|
|
|
|
|
|
/s/ Michael F. Golden |
|
Director |
|
June 16, 2016 |
|
Michael F. Golden |
||||
|
|
|
|
|
|
|
/s/ Mitchell A. Saltz |
|
Director |
|
June 16, 2016 |
|
Mitchell A. Saltz |
||||
|
|
|
|
|
|
|
/s/ I. Marie Wadecki |
|
Director |
|
June 16, 2016 |
|
I. Marie Wadecki |
50
INDEX TO CONSOLIDATED FINANCIAL STATEMENTS
SMITH & WESSON HOLDING CORPORATION AND SUBSIDIARIES
F-1
REPORT OF INDEPENDENT REGISTERED PUBLIC ACCOUNTING FIRM
To the Board of Directors and Shareholders of
Smith & Wesson Holding Corporation
Springfield, Massachusetts
We have audited the accompanying consolidated balance sheets of Smith & Wesson Holding Corporation and subsidiaries (the "Company") as of April 30, 2016 and 2015, and the related consolidated statements of income and comprehensive income, changes in stockholders' equity, and cash flows for the years then ended. Our audits also included the financial statement schedule listed in the index at Item 15 for the years ended April 30, 2016 and 2015. We also have audited the Company’s internal control over financial reporting as of April 30, 2016, based on criteria established in Internal Control – Integrated Framework (2013) issued by the Committee of Sponsoring Organizations of the Treadway Commission. The Company’s management is responsible for these financial statements and financial statement schedule, for maintaining effective internal control over financial reporting, and for its assessment of the effectiveness of internal control over financial reporting, included in the accompanying Management Report on Internal Control. Our responsibility is to express an opinion on these financial statements and financial statement schedule and an opinion on the Company’s internal control over financial reporting based on our audits.
We conducted our audits in accordance with the standards of the Public Company Accounting Oversight Board (United States). Those standards require that we plan and perform the audit to obtain reasonable assurance about whether the financial statements are free of material misstatement and whether effective internal control over financial reporting was maintained in all material respects. Our audits of the financial statements included examining, on a test basis, evidence supporting the amounts and disclosures in the financial statements, assessing the accounting principles used and significant estimates made by management, and evaluating the overall financial statement presentation. Our audit of internal control over financial reporting included obtaining an understanding of internal control over financial reporting, assessing the risk that a material weakness exists, and testing and evaluating the design and operating effectiveness of internal control based on the assessed risk. Our audits also included performing such other procedures as we considered necessary in the circumstances. We believe that our audits provide a reasonable basis for our opinions.
A company’s internal control over financial reporting is a process designed by, or under the supervision of, the company’s principal executive and principal financial officers, or persons performing similar functions, and effected by the company’s board of directors, management, and other personnel to provide reasonable assurance regarding the reliability of financial reporting and the preparation of financial statements for external purposes in accordance with generally accepted accounting principles. A company’s internal control over financial reporting includes those policies and procedures that (1) pertain to the maintenance of records that, in reasonable detail, accurately and fairly reflect the transactions and dispositions of the assets of the company; (2) provide reasonable assurance that transactions are recorded as necessary to permit preparation of financial statements in accordance with generally accepted accounting principles and that receipts and expenditures of the company are being made only in accordance with authorizations of management and directors of the company; and (3) provide reasonable assurance regarding prevention or timely detection of unauthorized acquisition, use, or disposition of the company’s assets that could have a material effect on the financial statements.
Because of the inherent limitations of internal control over financial reporting, including the possibility of collusion or improper management override of controls, material misstatements due to error or fraud may not be prevented or detected on a timely basis. Also, projections of any evaluation of the effectiveness of the internal control over financial reporting to future periods are subject to the risk that the controls may become inadequate because of changes in conditions, or that the degree of compliance with the policies or procedures may deteriorate.
In our opinion, such 2016 and 2015 consolidated financial statements present fairly, in all material respects, the financial position of the Company at April 30, 2016 and 2015, and the results of their operations and their cash flows for the years then ended in conformity with accounting principles generally accepted in the United States of America. Also, in our opinion, for the years 2016 and 2015, such financial statement schedule, when considered in relation to the basic consolidated financial statements taken as a whole, presents fairly, in all material respects, the information set forth therein. Also, in our opinion, the Company maintained, in all material respects, effective internal control over financial reporting as of April 30, 2016, based on the criteria established in Internal Control — Integrated Framework (2013) issued by the Committee of Sponsoring Organizations of the Treadway Commission.
/s/ Deloitte & Touche LLP
Hartford, Connecticut
June 16, 2016
F-2
Report of Independent Registered Public Accounting Firm
Board of Directors and Stockholders
Smith & Wesson Holding Corporation
Springfield, Massachusetts
We have audited the accompanying consolidated statement of income and comprehensive income, changes in stockholders’ equity, and cash flows of Smith & Wesson Holding Corporation and subsidiaries (the “Company”) for the year ended April 30, 2014. In connection with our audit of the consolidated financial statements, we have also audited the financial statement schedule for the year ended April 30, 2014 listed in the accompanying index. The financial statements and schedule are the responsibility of the Company’s management. Our responsibility is to express an opinion on these financial statements and schedule based on our audit.
We conducted our audit in accordance with the standards of the Public Company Accounting Oversight Board (United States). Those standards require that we plan and perform the audit to obtain reasonable assurance about whether the financial statements are free of material misstatement. An audit includes examining, on a test basis, evidence supporting the amounts and disclosures in the financial statements, assessing the accounting principles used and significant estimates made by management, as well as evaluating the overall presentation of the financial statements and schedule. We believe that our audit provide a reasonable basis for our opinion.
In our opinion, the consolidated financial statements referred to above present fairly, in all material respects, the results of Smith & Wesson Holding Corporation’s operations and their cash flows for the year ended April 30, 2014, in conformity with accounting principles generally accepted in the United States of America.
Also, in our opinion, the financial statement schedule for the year ended April 30, 2014, when considered in relation to the basic consolidated financial statements taken as a whole, present fairly, in all material respects, the information set forth therein.
|
/s/ BDO USA, LLP |
|
Boston, Massachusetts June 19, 2014 |
F-3
SMITH & WESSON HOLDING CORPORATION AND SUBSIDIARIES
|
|
As of: |
|
|||||
|
|
April 30, 2016 |
|
|
April 30, 2015 |
|
||
|
|
(In thousands, except par value and share data) |
|
|||||
|
ASSETS |
|
||||||
|
Current assets: |
|
|
|
|
|
|
|
|
Cash and cash equivalents |
$ |
191,279 |
|
|
$ |
42,222 |
|
|
Accounts receivable, net of allowance for doubtful accounts of $680 on April 30, 2016 and $722 on April 30, 2015 |
|
57,792 |
|
|
|
55,280 |
|
|
Inventories |
|
77,789 |
|
|
|
76,895 |
|
|
Prepaid expenses and other current assets |
|
4,307 |
|
|
|
6,306 |
|
|
Deferred income taxes |
|
— |
|
|
|
16,373 |
|
|
Income tax receivable |
|
2,064 |
|
|
|
— |
|
|
Total current assets |
|
333,231 |
|
|
|
197,076 |
|
|
Property, plant, and equipment, net |
|
135,405 |
|
|
|
133,844 |
|
|
Intangibles, net |
|
62,924 |
|
|
|
73,768 |
|
|
Goodwill |
|
76,357 |
|
|
|
75,426 |
|
|
Other assets |
|
11,586 |
|
|
|
10,811 |
|
|
|
$ |
619,503 |
|
|
$ |
490,925 |
|
|
LIABILITIES AND STOCKHOLDERS’ EQUITY |
|
||||||
|
Current liabilities: |
|
|
|
|
|
|
|
|
Accounts payable |
$ |
45,513 |
|
|
$ |
32,360 |
|
|
Accrued expenses |
|
28,447 |
|
|
|
24,302 |
|
|
Accrued payroll and incentives |
|
18,784 |
|
|
|
7,556 |
|
|
Accrued income taxes |
|
5,960 |
|
|
|
4,224 |
|
|
Accrued profit sharing |
|
11,459 |
|
|
|
6,165 |
|
|
Accrued warranty |
|
6,129 |
|
|
|
6,404 |
|
|
Current portion of notes payable |
|
6,300 |
|
|
— |
|
|
|
Total current liabilities |
|
122,592 |
|
|
|
81,011 |
|
|
Deferred income taxes |
|
12,161 |
|
|
|
33,905 |
|
|
Notes payable, net of current portion |
|
166,564 |
|
|
|
170,933 |
|
|
Other non-current liabilities |
|
10,370 |
|
|
|
10,706 |
|
|
Total liabilities |
|
311,687 |
|
|
|
296,555 |
|
|
Commitments and contingencies |
|
|
|
|
|
|
|
|
Stockholders’ equity: |
|
|
|
|
|
|
|
|
Preferred stock, $.001 par value, 20,000,000 shares authorized, no shares issued or outstanding |
|
— |
|
|
|
— |
|
|
Common stock, $.001 par value, 100,000,000 shares authorized, 71,558,633 shares issued and 55,996,011 shares outstanding on April 30, 2016 and 69,625,081 shares issued and 54,062,459 shares outstanding on April 30, 2015 |
|
72 |
|
|
|
70 |
|
|
Additional paid-in capital |
|
239,505 |
|
|
|
219,198 |
|
|
Retained earnings |
|
241,310 |
|
|
|
147,352 |
|
|
Accumulated other comprehensive (loss)/income |
|
(748 |
) |
|
|
73 |
|
|
Treasury stock, at cost (15,562,622 shares on April 30, 2016 and April 30, 2015) |
|
(172,323 |
) |
|
|
(172,323 |
) |
|
Total stockholders’ equity |
|
307,816 |
|
|
|
194,370 |
|
|
|
$ |
619,503 |
|
|
$ |
490,925 |
|
The accompanying notes are an integral part of these consolidated financial statements.
F-4
SMITH & WESSON HOLDING CORPORATION AND SUBSIDIARIES
CONSOLIDATED STATEMENTS OF INCOME AND COMPREHENSIVE INCOME
|
|
|
For the Years Ended April 30, |
|
|||||||||
|
|
|
2016 |
|
|
2015 |
|
|
2014 |
|
|||
|
|
(In thousands, except per share data) |
|
||||||||||
|
Net sales |
|
$ |
722,908 |
|
|
$ |
551,862 |
|
|
$ |
626,620 |
|
|
Cost of sales |
|
|
429,096 |
|
|
|
356,936 |
|
|
|
367,515 |
|
|
Gross profit |
|
|
293,812 |
|
|
|
194,926 |
|
|
|
259,105 |
|
|
Operating expenses: |
|
|
|
|
|
|
|
|
|
|
|
|
|
Research and development |
|
|
10,005 |
|
|
|
6,943 |
|
|
|
5,648 |
|
|
Selling and marketing |
|
|
42,257 |
|
|
|
36,033 |
|
|
|
33,515 |
|
|
General and administrative |
|
|
82,907 |
|
|
|
62,322 |
|
|
|
68,954 |
|
|
Total operating expenses |
|
|
135,169 |
|
|
|
105,298 |
|
|
|
108,117 |
|
|
Operating income |
|
|
158,643 |
|
|
|
89,628 |
|
|
|
150,988 |
|
|
Other (expense)/income: |
|
|
|
|
|
|
|
|
|
|
|
|
|
Other (expense)/income, net |
|
|
(22 |
) |
|
|
39 |
|
|
|
(2,154 |
) |
|
Interest income |
|
|
176 |
|
|
|
395 |
|
|
|
149 |
|
|
Interest expense |
|
|
(13,704 |
) |
|
|
(11,330 |
) |
|
|
(12,261 |
) |
|
Total other (expense)/income, net |
|
|
(13,550 |
) |
|
|
(10,896 |
) |
|
|
(14,266 |
) |
|
Income from continuing operations before income taxes |
|
|
145,093 |
|
|
|
78,732 |
|
|
|
136,722 |
|
|
Income tax expense |
|
|
51,135 |
|
|
|
28,905 |
|
|
|
48,095 |
|
|
Income from continuing operations |
|
|
93,958 |
|
|
|
49,827 |
|
|
|
88,627 |
|
|
Discontinued operations: |
|
|
|
|
|
|
|
|
|
|
|
|
|
Loss from operations of discontinued security solutions division |
|
|
— |
|
|
|
(297 |
) |
|
|
(456 |
) |
|
Income tax benefit |
|
|
— |
|
|
|
(83 |
) |
|
|
(1,134 |
) |
|
(Loss)/income from discontinued operations |
|
|
— |
|
|
|
(214 |
) |
|
|
678 |
|
|
Net income |
|
|
93,958 |
|
|
|
49,613 |
|
|
|
89,305 |
|
|
Comprehensive income: |
|
|
|
|
|
|
|
|
|
|
|
|
|
Change in unrealized loss on interest rate swap |
|
|
(1,289 |
) |
|
— |
|
|
— |
|
||
|
Other comprehensive loss, before income taxes |
|
|
(1,289 |
) |
|
— |
|
|
— |
|
||
|
Income tax benefit on other comprehensive loss |
|
|
468 |
|
|
— |
|
|
— |
|
||
|
Other comprehensive loss, net of tax |
|
|
(821 |
) |
|
— |
|
|
— |
|
||
|
Comprehensive income |
|
$ |
93,137 |
|
|
$ |
49,613 |
|
|
$ |
89,305 |
|
|
Net income per share: |
|
|
|
|
|
|
|
|
|
|
|
|
|
Basic - continuing operations |
|
$ |
1.72 |
|
|
$ |
0.92 |
|
|
$ |
1.51 |
|
|
Basic - total |
|
$ |
1.72 |
|
|
$ |
0.92 |
|
|
$ |
1.52 |
|
|
Diluted - continuing operations |
|
$ |
1.68 |
|
|
$ |
0.90 |
|
|
$ |
1.47 |
|
|
Diluted - total |
|
$ |
1.68 |
|
|
$ |
0.90 |
|
|
$ |
1.49 |
|
|
Weighted average number of common shares outstanding: |
|
|
|
|
|
|
|
|
|
|
|
|
|
Basic |
|
|
54,765 |
|
|
|
53,988 |
|
|
|
58,668 |
|
|
Diluted |
|
|
55,965 |
|
|
|
55,228 |
|
|
|
60,114 |
|
The accompanying notes are an integral part of these consolidated financial statements.
F-5
SMITH & WESSON HOLDING CORPORATION AND SUBSIDIARIES
CONSOLIDATED STATEMENT OF CHANGES IN STOCKHOLDERS’ EQUITY
|
|
|
|
|
|
|
|
|
|
|
|
|
|
|
|
|
|
|
Accumulated |
|
|
|
|
|
|
|
|
|
|
|
|
|
|
|
|
|
Common |
|
|
Additional |
|
|
|
|
|
|
Other |
|
|
|
|
|
|
|
|
|
|
Total |
|
||||||||
|
|
|
Stock |
|
|
Paid-In |
|
|
Retained |
|
|
Comprehensive |
|
|
Treasury Stock |
|
|
Stockholders’ |
|
||||||||||||||
|
(In thousands) |
|
Shares |
|
|
Amount |
|
|
Capital |
|
|
Earnings |
|
|
(Loss)/Income |
|
|
Shares |
|
|
Amount |
|
|
Equity |
|
||||||||
|
|
|
|
|
|
|
|
|
|
|
|
|
|
|
|
|
|
|
|
|
|
|
|
|
|
|
|
|
|
|
|
|
|
|
Balance at April 30, 2013 |
|
|
67,597 |
|
|
$ |
68 |
|
|
$ |
199,120 |
|
|
$ |
8,434 |
|
|
$ |
73 |
|
|
|
3,300 |
|
|
$ |
(26,396 |
) |
|
$ |
181,299 |
|
|
Exercise of employee stock options |
|
732 |
|
|
|
1 |
|
|
|
1,998 |
|
|
— |
|
|
— |
|
|
— |
|
|
— |
|
|
|
1,999 |
|
|||||
|
Repurchase of treasury stock |
|
— |
|
|
— |
|
|
— |
|
|
— |
|
|
— |
|
|
|
10,158 |
|
|
|
(115,887 |
) |
|
|
(115,887 |
) |
|||||
|
Stock-based compensation |
|
— |
|
|
— |
|
|
|
8,212 |
|
|
— |
|
|
— |
|
|
— |
|
|
— |
|
|
|
8,212 |
|
||||||
|
Excess tax benefit for stock-based compensation |
|
— |
|
|
— |
|
|
|
2,647 |
|
|
— |
|
|
— |
|
|
— |
|
|
— |
|
|
|
2,647 |
|
||||||
|
Shares issued under employee stock purchase plan |
|
176 |
|
|
— |
|
|
|
1,316 |
|
|
— |
|
|
— |
|
|
— |
|
|
— |
|
|
|
1,316 |
|
||||||
|
Issuance of common stock under restricted stock unit awards, net of shares surrendered |
|
|
305 |
|
|
— |
|
|
|
(2,068 |
) |
|
— |
|
|
— |
|
|
— |
|
|
— |
|
|
|
(2,068 |
) |
|||||
|
Net income |
|
— |
|
|
— |
|
|
— |
|
|
|
89,305 |
|
|
— |
|
|
— |
|
|
— |
|
|
|
89,305 |
|
||||||
|
Balance at April 30, 2014 |
|
|
68,810 |
|
|
|
69 |
|
|
|
211,225 |
|
|
|
97,739 |
|
|
|
73 |
|
|
|
13,458 |
|
|
|
(142,283 |
) |
|
|
166,823 |
|
|
Exercise of employee stock options |
|
366 |
|
|
|
1 |
|
|
|
1,813 |
|
|
|
— |
|
|
|
— |
|
|
|
— |
|
|
|
— |
|
|
|
1,814 |
|
|
|
Repurchase of common stock |
|
|
— |
|
|
|
— |
|
|
|
— |
|
|
|
— |
|
|
|
— |
|
|
|
2,105 |
|
|
|
(30,040 |
) |
|
|
(30,040 |
) |
|
Stock-based compensation |
|
|
— |
|
|
|
— |
|
|
|
5,808 |
|
|
|
— |
|
|
|
— |
|
|
|
— |
|
|
|
— |
|
|
|
5,808 |
|
|
Excess tax benefit for stock-based compensation |
|
|
— |
|
|
|
— |
|
|
|
771 |
|
|
|
— |
|
|
|
— |
|
|
|
— |
|
|
|
— |
|
|
|
771 |
|
|
Shares issued under employee stock purchase plan |
|
163 |
|
|
|
— |
|
|
|
1,289 |
|
|
|
— |
|
|
|
— |
|
|
|
— |
|
|
|
— |
|
|
|
1,289 |
|
|
|
Issuance of common stock under restricted stock unit awards, net of shares surrendered |
|
286 |
|
|
|
— |
|
|
|
(1,708 |
) |
|
|
— |
|
|
|
— |
|
|
|
— |
|
|
|
— |
|
|
|
(1,708 |
) |
|
|
Net income |
|
|
— |
|
|
|
— |
|
|
— |
|
|
|
49,613 |
|
|
|
— |
|
|
|
— |
|
|
|
— |
|
|
|
49,613 |
|
|
|
Balance at April 30, 2015 |
|
|
69,625 |
|
|
|
70 |
|
|
|
219,198 |
|
|
|
147,352 |
|
|
|
73 |
|
|
|
15,563 |
|
|
|
(172,323 |
) |
|
|
194,370 |
|
|
Proceeds from exercise of employee stock options |
|
|
1,490 |
|
|
|
2 |
|
|
|
9,568 |
|
|
|
— |
|
|
|
— |
|
|
|
— |
|
|
|
— |
|
|
|
9,570 |
|
|
Stock-based compensation |
|
|
— |
|
|
|
— |
|
|
|
6,472 |
|
|
|
— |
|
|
|
— |
|
|
|
— |
|
|
|
— |
|
|
|
6,472 |
|
|
Excess tax benefit for stock-based compensation |
|
|
— |
|
|
|
— |
|
|
|
5,218 |
|
|
|
— |
|
|
|
— |
|
|
|
— |
|
|
|
— |
|
|
|
5,218 |
|
|
Shares issued under employee stock purchase plan |
|
158 |
|
|
|
— |
|
|
|
1,695 |
|
|
|
— |
|
|
|
— |
|
|
|
— |
|
|
|
— |
|
|
|
1,695 |
|
|
|
Change in unrealized loss on interest rate swap, net of tax effect |
|
— |
|
|
— |
|
|
— |
|
|
— |
|
|
|
(821 |
) |
|
— |
|
|
— |
|
|
|
(821 |
) |
||||||
|
Issuance of common stock under restricted stock unit awards, net of shares surrendered |
|
286 |
|
|
|
— |
|
|
|
(2,646 |
) |
|
|
— |
|
|
|
— |
|
|
|
— |
|
|
|
— |
|
|
|
(2,646 |
) |
|
|
Net income |
|
|
— |
|
|
|
— |
|
|
— |
|
|
|
93,958 |
|
|
|
— |
|
|
|
— |
|
|
|
— |
|
|
|
93,958 |
|
|
|
Balance at April 30, 2016 |
|
|
71,559 |
|
|
$ |
72 |
|
|
$ |
239,505 |
|
|
$ |
241,310 |
|
|
$ |
(748 |
) |
|
|
15,563 |
|
|
$ |
(172,323 |
) |
|
$ |
307,816 |
|
The accompanying notes are an integral part of these consolidated financial statements.
F-6
SMITH & WESSON HOLDING CORPORATION AND SUBSIDIARIES
CONSOLIDATED STATEMENTS OF CASH FLOWS
|
|
|
For the Years Ended April 30, |
|
|||||||||
|
|
|
2016 |
|
|
2015 |
|
|
2014 |
|
|||
|
|
|
(In thousands) |
|
|||||||||
|
Cash flows from operating activities: |
|
|
|
|
|
|
|
|
|
|
|
|
|
Net income |
|
$ |
93,958 |
|
|
$ |
49,613 |
|
|
$ |
89,305 |
|
|
Adjustments to reconcile net income to net cash provided by operating activities: |
|
|
|
|
|
|
|
|
|
|
|
|
|
Depreciation and amortization |
|
|
41,237 |
|
|
|
30,893 |
|
|
|
21,704 |
|
|
Loss on sale/disposition of assets |
|
|
256 |
|
|
|
267 |
|
|
|
150 |
|
|
Provision for losses on notes and accounts receivable |
|
|
511 |
|
|
|
122 |
|
|
|
(214 |
) |
|
Deferred income taxes |
|
|
(4,448 |
) |
|
|
2,341 |
|
|
|
(1,463 |
) |
|
Stock-based compensation expense |
|
|
6,472 |
|
|
|
5,808 |
|
|
|
8,212 |
|
|
Changes in operating assets and liabilities (net effect of acquisitions): |
|
|
|
|
|
|
|
|
|
|
|
|
|
Accounts receivable |
|
|
(2,254 |
) |
|
|
10,983 |
|
|
|
(9,588 |
) |
|
Inventories |
|
|
(804 |
) |
|
|
25,662 |
|
|
|
(23,744 |
) |
|
Prepaid expenses and other current assets |
|
|
1,999 |
|
|
|
(569 |
) |
|
|
(1,856 |
) |
|
Income tax payable |
|
|
(328 |
) |
|
|
8,965 |
|
|
|
(1,534 |
) |
|
Accounts payable |
|
|
13,048 |
|
|
|
(7,345 |
) |
|
|
6,468 |
|
|
Accrued payroll and incentives |
|
|
11,228 |
|
|
|
(9,525 |
) |
|
|
2,720 |
|
|
Accrued profit sharing |
|
|
5,294 |
|
|
|
(4,895 |
) |
|
|
1,473 |
|
|
Accrued expenses |
|
|
3,929 |
|
|
|
1,361 |
|
|
|
(467 |
) |
|
Accrued warranty |
|
|
(275 |
) |
|
|
891 |
|
|
|
(244 |
) |
|
Other assets |
|
|
(237 |
) |
|
|
(348 |
) |
|
|
(356 |
) |
|
Other non-current liabilities |
|
|
(1,029 |
) |
|
|
583 |
|
|
|
(360 |
) |
|
Net cash provided by operating activities |
|
|
168,557 |
|
|
|
114,807 |
|
|
|
90,206 |
|
|
Cash flows from investing activities: |
|
|
|
|
|
|
|
|
|
|
|
|
|
Payments for the net assets of Tri-Town Precision Plastics, Inc. |
|
|
— |
|
|
|
(23,805 |
) |
|
|
— |
|
|
Payments to acquire Battenfeld Technologies, Inc., net of cash acquired |
|
|
— |
|
|
|
(135,437 |
) |
|
|
— |
|
|
Payments to acquire PowerTech, Inc. |
|
|
(1,220 |
) |
|
|
— |
|
|
|
— |
|
|
(Deposits)/refunds on machinery and equipment |
|
|
(1,128 |
) |
|
|
1,431 |
|
|
|
(9,269 |
) |
|
Receipts from note receivable |
|
|
84 |
|
|
|
81 |
|
|
|
77 |
|
|
Payments to acquire patents and software |
|
|
(315 |
) |
|
|
(392 |
) |
|
|
(243 |
) |
|
Proceeds from sale of property and equipment |
|
|
61 |
|
|
|
264 |
|
|
|
101 |
|
|
Payments to acquire property and equipment |
|
|
(29,474 |
) |
|
|
(28,199 |
) |
|
|
(53,282 |
) |
|
Net cash used in investing activities |
|
|
(31,992 |
) |
|
|
(186,057 |
) |
|
|
(62,616 |
) |
|
Cash flows from financing activities: |
|
|
|
|
|
|
|
|
|
|
|
|
|
Proceeds from loans and notes payable |
|
|
105,000 |
|
|
|
175,000 |
|
|
|
101,584 |
|
|
Cash paid for debt issuance costs |
|
|
(1,024 |
) |
|
|
(2,558 |
) |
|
|
(3,791 |
) |
|
Payments on capital lease obligation |
|
|
(596 |
) |
|
|
(596 |
) |
|
|
(596 |
) |
|
Payments on notes payable |
|
|
(104,725 |
) |
|
|
(100,000 |
) |
|
|
(45,143 |
) |
|
Proceeds from Economic Development Incentive Program |
|
|
— |
|
|
|
640 |
|
|
|
722 |
|
|
Payments to acquire treasury stock |
|
|
— |
|
|
|
(30,040 |
) |
|
|
(115,887 |
) |
|
Proceeds from exercise of options to acquire common stock, including employee stock purchase plan |
|
|
11,265 |
|
|
|
3,103 |
|
|
|
3,315 |
|
|
Payment of employee withholding tax related to restricted stock units |
|
|
(2,646 |
) |
|
|
(1,708 |
) |
|
|
(2,068 |
) |
|
Excess tax benefit of stock-based compensation |
|
|
5,218 |
|
|
|
771 |
|
|
|
2,647 |
|
|
Net cash provided by/(used in) financing activities |
|
|
12,492 |
|
|
|
44,612 |
|
|
|
(59,217 |
) |
|
Net increase/(decrease) in cash and cash equivalents |
|
|
149,057 |
|
|
|
(26,638 |
) |
|
|
(31,627 |
) |
|
Cash and cash equivalents, beginning of period |
|
|
42,222 |
|
|
|
68,860 |
|
|
|
100,487 |
|
|
Cash and cash equivalents, end of period |
|
$ |
191,279 |
|
|
$ |
42,222 |
|
|
$ |
68,860 |
|
|
Supplemental disclosure of cash flow information |
|
|
|
|
|
|
|
|
|
|
|
|
|
Cash paid for: |
|
|
|
|
|
|
|
|
|
|
|
|
|
Interest |
|
$ |
13,007 |
|
|
$ |
8,617 |
|
|
$ |
7,688 |
|
|
Income taxes |
|
|
50,924 |
|
|
|
16,926 |
|
|
|
48,778 |
|
The accompanying notes are an integral part of these consolidated financial statements.
F-7
|
SMITH & WESSON HOLDING CORPORATION AND SUBSIDIARIES |
|
|||||||||||
|
CONSOLIDATED STATEMENTS OF CASH FLOWS - (Continued) |
|
|||||||||||
|
|
|
|
|
|
|
|
|
|
|
|
|
|
|
Supplemental Disclosure of Non-cash Investing and Financing Activities: |
|
|
|
|
|
|
|
|
|
|
|
|
|
|
|
|
|
|
|
|
|
|
|
|
|
|
|
|
|
|
|
|
|
|
|
|
|
|
|
|
|
|
|
For the Years Ended April 30, |
|
|||||||||
|
|
|
2016 |
|
|
2015 |
|
|
2014 |
|
|||
|
|
|
|
|
|
|
|
|
|
|
|
|
|
|
Purchases of property and equipment included in accounts payable |
$ |
|
2,005 |
|
$ |
|
— |
|
$ |
|
— |
|
The accompanying notes are an integral part of these consolidated financial statements
F-8
SMITH & WESSON HOLDING CORPORATION AND SUBSIDIARIES
NOTES TO CONSOLIDATED FINANCIAL STATEMENTS
1. Organization
Organization — We are one of the world’s leading manufacturers of firearms and a provider of quality accessory products for the shooting, hunting, and rugged outdoor enthusiast. We manufacture a wide array of handguns (including revolvers and pistols), long guns (including modern sporting rifles, bolt action rifles, and single shot rifles), handcuffs, and firearm-related products and accessories for sale to a wide variety of customers, including gun enthusiasts, collectors, hunters, sportsmen, competitive shooters, individuals desiring home and personal protection, law enforcement and security agencies and officers, and military agencies in the United States and throughout the world. We are one of the largest manufacturers of handguns, modern sporting rifles, and handcuffs in the United States and an active participant in the hunting rifle market. We are also a leading provider of shooting, hunting, and outdoor accessories, including reloading, gunsmithing, gun cleaning supplies, tree saws, and vault accessories. We sell our products under the Smith & Wesson, M&P, Thompson/Center Arms, Caldwell Shooting Supplies, Wheeler Engineering, Tipton Gun Cleaning Supplies, Frankford Arsenal Reloading Tools, Lockdown Vault Accessories, Hooyman Premium Tree Saws, BOG-POD, and Golden Rod Moisture Control brands.
We manufacture our firearm products at our facilities in Springfield, Massachusetts; Houlton, Maine; and Deep River, Connecticut; and we develop and market our accessories products at our facility in Columbia, Missouri. We plan to continue to capitalize on the goodwill developed through our historic 164 year old “Smith & Wesson” brand as well as our other well-known brands by expanding consumer awareness of the products we produce.
On May 5, 2014, we acquired substantially all of the net assets of Tri-Town Precision Plastics, Inc., or TTPP, which we refer to as the DRP Acquisition. See Note 2 – Acquisitions below for more information regarding this transaction.
On December 11, 2014, we acquired all of the issued and outstanding stock of Battenfeld Acquisition Company Inc., including its wholly owned subsidiary, Battenfeld Technologies, Inc., or BTI, which we refer to as the BTI Acquisition. See Note 2 – Acquisitions below for more information regarding this transaction.
On February 26, 2016, we acquired substantially all of the net assets of PowerTech, Inc., for $1.2 million, utilizing cash on hand. PowerTech, Inc., is a manufacturer of tactical flashlights, universal LED lights, and personal pocket lights designed for military, law enforcement, and sporting enthusiasts primarily utilizing the Smith & Wesson and M&P brands. We transitioned and relocated its operations to our Columbia, Missouri facility.
These acquisitions have been accounted for in accordance with ASC 805-20, Business Combinations, and accordingly, the results of operations from the acquired businesses have been included in our consolidated financial statements following the acquisition dates.
2. Acquisitions
DRP Acquisition
On May 5, 2014, we acquired substantially all of the net assets of TTPP for $22.8 million, plus a $1.0 million working capital adjustment, for a total purchase price of $23.8 million, utilizing cash on hand. The DRP Acquisition of TTPP’s custom polymer injection molding capabilities was designed to vertically integrate a key component of our manufacturing operations and provide us with increased flexibility within our supply chain.
F-9
SMITH & WESSON HOLDING CORPORATION AND SUBSIDIARIES
NOTES TO CONSOLIDATED FINANCIAL STATEMENTS — (Continued)
The following table summarizes the estimated fair values of the assets acquired and liabilities assumed at the acquisition date, as well as measurement period adjustments (in thousands):
|
|
May 5, 2014 |
|
|
Measurement |
|
|
|
|
|
||
|
|
(As Initially |
|
|
Period |
|
|
May 5, 2014 |
|
|||
|
|
Reported) |
|
|
Adjustments |
|
|
(As Adjusted) |
|
|||
|
Accounts receivable |
$ |
2,614 |
|
|
$ |
5 |
|
|
$ |
2,619 |
|
|
Inventories |
|
2,430 |
|
|
|
460 |
|
|
|
2,890 |
|
|
Total current assets |
|
5,044 |
|
|
|
465 |
|
|
|
5,509 |
|
|
Property, plant, and equipment |
|
4,243 |
|
|
|
155 |
|
|
|
4,398 |
|
|
Goodwill |
|
15,183 |
|
|
|
(1,413 |
) |
|
|
13,770 |
|
|
Intangibles assets: |
|
|
|
|
|
|
|
|
|
|
|
|
Customer relationships |
— |
|
|
|
840 |
|
|
|
840 |
|
|
|
Order backlog |
— |
|
|
|
150 |
|
|
|
150 |
|
|
|
Other assets |
|
8 |
|
|
— |
|
|
|
8 |
|
|
|
Total assets acquired |
|
24,478 |
|
|
|
197 |
|
|
|
24,675 |
|
|
Accounts payable |
|
358 |
|
|
|
12 |
|
|
|
370 |
|
|
Accrued expenses |
|
25 |
|
|
|
114 |
|
|
|
139 |
|
|
Accrued payroll |
— |
|
|
|
361 |
|
|
|
361 |
|
|
|
Total liabilities assumed |
|
383 |
|
|
|
487 |
|
|
|
870 |
|
|
|
$ |
24,095 |
|
|
$ |
(290 |
) |
|
$ |
23,805 |
|
General and administrative costs include $440,000 and $471,000 of acquisition-related costs incurred during the years ended April 30, 2015 and 2014, respectively, related to the DRP Acquisition.
The goodwill that was recorded relating to the DRP Acquisition resulted from expected synergies related to vertically integrating a key component of our manufacturing operations as well as increased flexibility within our supply chain. This goodwill will be deductible for tax purposes and amortized over 15 years and is included in our firearm segment.
We amortize customer relationships in proportion to expected yearly revenue generated from the customer lists acquired or products to be sold. We amortized order backlog over the contract lives as they were executed. The following are the identifiable intangible assets acquired (in thousands) and their respective weighted average lives:
|
|
|
|
|
|
Weighted Average |
|
|
|
|
|
|
|
|
Life |
|
|
|
|
Amount |
|
|
(In years) |
|
||
|
Customer relationships |
$ |
840 |
|
|
|
3.3 |
|
|
Order backlog |
|
150 |
|
|
|
1.0 |
|
|
|
$ |
990 |
|
|
|
|
|
Pro forma results of operations assuming that this acquisition had occurred on May 1, 2014 are not required because of the immaterial impact on our consolidated financial statements for all periods presented.
BTI Acquisitions
On December 11, 2014, we acquired all of the issued and outstanding stock of BTI for $130.5 million, plus a $3.1 million working capital adjustment, for a total purchase price of $133.6 million, pursuant to a Stock Purchase and Sale Agreement. The BTI Acquisition was financed using a combination of existing cash balances and cash from a $100.0 million draw on our line of credit, which was expanded to $125.0 million as a result of our partial exercise of the accordion feature on that line of credit.
Based in Columbia, Missouri, BTI is a provider of hunting and shooting accessories, which develops, produces, and delivers innovative, high-quality products under several brands.
On January 9, 2015, we acquired substantially all of the net assets of Hooyman LLC, a manufacturer of extendable tree saws designed for the hunting and outdoor industry, for $1.9 million utilizing cash on hand. We have relocated its operations to our Columbia, Missouri facility.
F-10
SMITH & WESSON HOLDING CORPORATION AND SUBSIDIARIES
NOTES TO CONSOLIDATED FINANCIAL STATEMENTS — (Continued)
The aggregate purchase price of these acquisitions, including the working capital adjustments, was $135.5 million.
The following table summarizes the estimated allocation of the purchase price for BTI at the acquisition date, which includes the net assets from the Hooyman acquisition, as well as measurement period adjustments to date (in thousands):
|
|
December 11, 2014 |
|
|
Measurement |
|
|
|
|
||||||
|
|
(As Initially |
|
|
Period |
|
|
December 11, 2014 |
|
||||||
|
|
Reported) |
|
|
Adjustments |
|
|
(As Adjusted) |
|
||||||
|
|
|
|
|
|
|
|
|
|
|
|
|
|
|
|
|
Cash |
$ |
|
24 |
|
|
$ |
— |
|
|
$ |
|
24 |
|
|
|
Accounts receivable |
|
|
7,873 |
|
|
|
|
3 |
|
|
|
|
7,876 |
|
|
Inventories |
|
|
12,819 |
|
|
|
|
(2 |
) |
|
|
|
12,817 |
|
|
Income tax receivable |
|
|
393 |
|
|
|
|
(279 |
) |
|
|
|
114 |
|
|
Other current assets |
|
|
563 |
|
|
|
— |
|
|
|
|
563 |
|
|
|
Property, plant, and equipment |
|
|
2,826 |
|
|
|
|
(318 |
) |
|
|
|
2,508 |
|
|
Intangibles |
|
|
73,550 |
|
|
|
|
(1,000 |
) |
|
|
|
72,550 |
|
|
Goodwill |
|
|
62,142 |
|
|
|
|
252 |
|
|
|
|
62,394 |
|
|
Total assets acquired |
|
|
160,190 |
|
|
|
|
(1,344 |
) |
|
|
|
158,846 |
|
|
Accounts payable |
|
|
1,647 |
|
|
|
|
2 |
|
|
|
|
1,649 |
|
|
Accrued expenses |
|
|
326 |
|
|
|
|
83 |
|
|
|
|
409 |
|
|
Accrued payroll |
|
|
904 |
|
|
|
— |
|
|
|
|
904 |
|
|
|
Accrued taxes other than income |
|
|
9 |
|
|
|
— |
|
|
|
|
9 |
|
|
|
Deferred income taxes |
|
|
21,128 |
|
|
|
|
(714 |
) |
|
|
|
20,414 |
|
|
Total liabilities assumed |
|
|
24,014 |
|
|
|
|
(629 |
) |
|
|
|
23,385 |
|
|
|
$ |
|
136,176 |
|
|
$ |
|
(715 |
) |
|
$ |
|
135,461 |
|
General and administrative costs include $1.7 million of acquisition-related costs incurred for the year ended April 30, 2015 related to the BTI Acquisition.
The goodwill that was recorded relating to the BTI Acquisition resulted from our ability to expand our presence in the firearm accessories market and leverage BTI’s broad portfolio of hunting and shooting accessories brands. Previously acquired goodwill of $12.0 million will be deductible for tax purposes over its remaining useful life. The remaining goodwill recorded as a result of the BTI Acquisition is not expected to be deductible for tax purposes. We allocated all of the goodwill recorded as result of the BTI Acquisition to our accessories segment.
We amortize intangible assets in proportion to expected yearly revenue generated from the intangibles that were acquired. We amortized order backlog over the contract lives as they were executed. The following are the identifiable intangible assets acquired (in thousands) and their respective weighted average lives:
|
|
|
|
|
|
Weighted Average |
|
|||
|
|
|
|
|
|
Life |
|
|||
|
|
Amount |
|
|
|
(In years) |
|
|||
|
Developed technology |
$ |
|
16,430 |
|
|
|
|
4.3 |
|
|
Customer relationships |
|
|
25,280 |
|
|
|
|
4.4 |
|
|
Trade names |
|
|
30,740 |
|
|
|
|
5.4 |
|
|
Order backlog |
|
|
100 |
|
|
|
|
0.3 |
|
|
|
$ |
|
72,550 |
|
|
|
|
|
|
F-11
SMITH & WESSON HOLDING CORPORATION AND SUBSIDIARIES
NOTES TO CONSOLIDATED FINANCIAL STATEMENTS — (Continued)
The following table reflects the unaudited pro forma results of operations assuming that the BTI Acquisition had occurred on May 1, 2014 (in thousands, except per share data):
|
|
|
|
||
|
|
For the Year Ended |
|
||
|
|
April 30, 2015 |
|
||
|
Net sales |
$ |
|
582,875 |
|
|
Income from continuing operations |
|
|
50,396 |
|
|
Net income per share - diluted |
|
|
0.91 |
|
The unaudited pro forma income from continuing operations for the year ended April 30, 2015 has been adjusted to reflect increased amortization of intangibles as if the acquisition had occurred on May 1, 2014. The unaudited pro forma information is presented for informational purposes only and is not necessarily indicative of the actual results that would have been achieved had the BTI Acquisition occurred as of May 1, 2014 or the results that may be achieved in future periods.
3. Significant Accounting Policies
Use of Estimates — The preparation of consolidated financial statements in conformity with accounting principles generally accepted in the United States requires us to make estimates and assumptions that affect the reported amounts of assets and liabilities and the disclosure of contingent assets and liabilities at the financial statement dates and the reported amounts of revenue and expenses during the reporting periods. Our significant estimates include the accrual for warranty, reserves for excess and obsolete inventory, and valuation of intangible assets. Actual results could differ from those estimates.
Principles of Consolidation — The accompanying consolidated financial statements include the accounts of Smith & Wesson Holding Corporation and its wholly owned subsidiaries, including Smith & Wesson Corp., Thompson/Center Arms Company, LLC, Deep River Plastics, LLC, BTI, reported as our accessories division, and SWSS LLC, formerly Smith & Wesson Security Solutions, Inc., or SWSS, our former security solutions division. In our opinion, all adjustments, which include only normal recurring adjustments necessary to fairly present the financial position, results of operations, changes in stockholders’ equity, and cash flows at April 30, 2016 and 2015 and for the periods presented, have been included. All significant intercompany accounts and transactions have been eliminated in consolidation.
SWSS is being presented as discontinued operations in the consolidated statements of income for all periods presented. See Note 4 for additional information regarding these discontinued operations. Unless stated otherwise, any reference to the consolidated statements of income items in the notes to the consolidated financial statements refers to results from continuing operations.
Fair Value of Financial Instruments — Unless otherwise indicated, the fair values of all reported assets and liabilities, which represent financial instruments not held for trading purposes, approximate the carrying values of such amounts because of their short-term nature or market rates of interest.
Cash and Cash Equivalents — We consider all highly liquid investments purchased with original maturities of three months or less at the date of acquisition to be cash equivalents. We maintain our cash in bank deposit accounts that, at times, may exceed federally insured limits. We have not experienced any losses in such accounts. As of April 30, 2016, all of our accounts exceeded federally insured limits.
Financial Instruments — We account for derivative instruments under Accounting Standards Codification (“ASC”) 815-10, Fair Value Measurements and Disclosure Topic, which establishes accounting and reporting standards for derivative instruments and hedging activities and requires us to recognize these instruments as either assets or liabilities on the balance sheet and measure them at fair value. The fair value of our Term Loan is equal to the carrying value as of April 30, 2016. The fair value of the 5.000% Senior Notes as of April 30, 2016 is approximate to the carrying value in considering Level 2 inputs within the hierarchy as the Senior Notes are not frequently traded. The fair value of the interest rate swap of $1.3 million as of April 30, 2016 was estimated by a third party using inputs that are observable or that can be corroborated by observable market data, such as interest rate yield curves, and, therefore, are classified within Level 2 of the valuation hierarchy.
Trade Receivables — We extend credit to our domestic customers and some foreign distributors based on their financial condition. We sometimes offer discounts for early payment on invoices. When we believe the extension of credit is not advisable, we rely on either a prepayment or a letter of credit. We write off balances deemed uncollectible by us against our allowance for doubtful accounts. We estimate our allowance for doubtful accounts through current past due balances, knowledge of our customers’ financial situations, and past payment history.
F-12
SMITH & WESSON HOLDING CORPORATION AND SUBSIDIARIES
NOTES TO CONSOLIDATED FINANCIAL STATEMENTS — (Continued)
Concentrations of Credit Risk — Financial instruments that potentially subject us to concentration of credit risk consist principally of cash, cash equivalents, and trade receivables. We place our cash and cash equivalents in overnight U.S. government securities. Concentrations of credit risk with respect to trade receivables are limited by the large number of customers comprising our customer base and their geographic and business dispersion. We perform ongoing credit evaluations of our customers’ financial condition and generally do not require collateral.
For our fiscal year ended April 30, 2016 and 2015, we did not have any customers that exceeded 10% of net sales or 10% of accounts receivable. However, one of our customers accounted for approximately 13.4% of our net sales for the year ended April 30, 2014.
Inventories — We value firearm inventories, consisting primarily of finished firearms, finished firearm components, as well as related products, and accessories inventories, at the lower of cost, using the first-in, first-out, or FIFO method, or market. An allowance for potential non-saleable inventory due to excess stock or obsolescence is based upon a detailed review of inventory components, past history, and expected future usage.
Property, Plant, and Equipment — We record property, plant, and equipment, consisting of land, building, building improvements, machinery, equipment, software, hardware, furniture, and fixtures, at cost and depreciate them using the straight-line method over their estimated useful lives. We charge expenditures for maintenance and repairs to earnings as incurred, and we capitalize additions, renewals, and betterments. Upon the retirement or other disposition of property and equipment, we remove the related cost and accumulated depreciation from the respective accounts and include any gain or loss in operations. A summary of the estimated useful lives is as follows:
|
Description |
|
Useful Life |
|
|
|
Building and improvements |
|
|
10 to 40 years |
|
|
Software and hardware |
|
|
3 to 7 years |
|
|
Machinery and equipment |
|
|
2 to 10 years |
|
We include tooling, dies, and fixtures as part of machinery and equipment and depreciate them over a period not exceeding five years.
Intangible Assets — We record intangible assets at cost or based on the fair value of assets acquired. Intangible assets consist of developed technology, customer relationships, trademarks, trade names, and patents. We amortize intangible assets over their estimated useful lives or in proportion to expected yearly revenue generated from the intangibles that were acquired.
Revenue Recognition — We recognize revenue when the following four basic criteria have been met: (1) persuasive evidence of an arrangement exists; (2) delivery has occurred or services have been provided; (3) the fee is fixed or determinable; and (4) collection is reasonably assured.
Product sales account for most of our revenue. We recognize revenue from product sales when the earnings process is complete and the risks and rewards of ownership have transferred to the customer, which is generally upon shipment but could be delayed until the receipt of customer acceptance. We also provide tooling, forging, heat treating, finishing, plating, and engineering support services to customers; we recognize this revenue when accepted by the customer, if applicable, when no further contingencies or material performance obligations exist, and when collectability is reasonably assured, thereby earning us the right to receive and retain payments for services performed and billed.
Segment Information — We have two reportable segments: one for our firearm division and a second for our accessories division. See Note 20 – Segment Reporting for more information regarding our segments.
Research and Development — We engage in both internal and external research and development, or R&D, in order to remain competitive and to exploit possible untapped market opportunities. We approve prospective R&D projects after analysis of the cost and benefits associated with the potential product. Costs in R&D expense include, among other items, salaries, materials, utilities, and administrative costs.
Earnings/(Loss) per Share — We calculate basic and diluted earnings/(loss) per common share in accordance with the provisions of ASC 260-10, Earnings Per Share. Basic earnings/(loss) per common share equals net income/(loss) divided by the weighted average number of common shares outstanding during the period. Diluted earnings/(loss) per common share equals net
F-13
SMITH & WESSON HOLDING CORPORATION AND SUBSIDIARIES
NOTES TO CONSOLIDATED FINANCIAL STATEMENTS — (Continued)
income/(loss) divided by the weighted average number of common shares outstanding during the period, including the effect of outstanding stock options and other stock-based instruments if their effect is dilutive.
The following table provides a reconciliation of the net income/(loss) amounts and weighted average number of common and common equivalent shares used to determine basic and diluted earnings/(loss) per common share (in thousands, except per share data):
|
|
|
For the Year Ended April 30, |
|
||||||||||
|
|
|
2016 |
|
|
2015 |
|
|
2014 |
|
||||
|
Net income |
|
|
|
|
|
|
|
|
|
|
|
|
|
|
Income from continuing operations |
|
$ |
93,958 |
|
|
$ |
49,827 |
|
|
|
$ |
88,627 |
|
|
(Loss)/income from discontinued operations |
|
|
— |
|
|
|
(214 |
) |
|
|
|
678 |
|
|
Net income |
|
$ |
93,958 |
|
|
$ |
49,613 |
|
|
|
$ |
89,305 |
|
|
Weighted average shares outstanding — Basic |
|
|
54,765 |
|
|
|
53,988 |
|
|
|
|
58,668 |
|
|
Dilutive effect of stock option and award plans |
|
|
1,200 |
|
|
|
1,240 |
|
|
|
|
1,446 |
|
|
Diluted shares outstanding |
|
|
55,965 |
|
|
|
55,228 |
|
|
|
|
60,114 |
|
|
Earnings per share — Basic |
|
|
|
|
|
|
|
|
|
|
|
|
|
|
Income from continuing operations |
|
$ |
1.72 |
|
|
$ |
0.92 |
|
|
|
$ |
1.51 |
|
|
Income from discontinued operations |
|
$ |
— |
|
|
$ |
— |
|
|
|
$ |
0.01 |
|
|
Net income |
|
$ |
1.72 |
|
|
$ |
0.92 |
|
|
|
$ |
1.52 |
|
|
Earnings per share — Diluted |
|
|
|
|
|
|
|
|
|
|
|
|
|
|
Income from continuing operations |
|
$ |
1.68 |
|
|
$ |
0.90 |
|
|
|
$ |
1.47 |
|
|
Income from discontinued operations |
|
$ |
— |
|
|
$ |
— |
|
|
|
$ |
0.01 |
|
|
Net income |
|
$ |
1.68 |
|
|
$ |
0.90 |
|
|
|
$ |
1.49 |
|
All of our outstanding stock options and restricted stock units, or RSUs, were included in the computation of diluted earnings per share for the year ended April 30, 2016. For fiscal 2015, and 2014, 73,546, and 77,622 shares of common stock, respectively, issuable upon the exercise of stock options were excluded from the computation of diluted income per share because the effect would be antidilutive.
Valuation of Long-lived Tangible and Intangible Assets — We evaluate the recoverability of long-lived assets, or asset groups, whenever events or changes in circumstances indicate that carrying amounts may not be recoverable. When such evaluations indicate that the related future undiscounted cash flows are not sufficient to recover the carrying values of the assets, such carrying values are reduced to fair value and this adjusted carrying value becomes the asset’s new cost basis. We determine fair value primarily using future anticipated cash flows that are directly associated with and that are expected to arise as a direct result of the use and eventual disposition of the asset, or asset group, discounted using an interest rate commensurate with the risk involved.
We have significant long-lived tangible and intangible assets, which are susceptible to valuation adjustments as a result of changes in various factors or conditions. The most significant long-lived tangible and intangible assets, other than goodwill, are property, plant, and equipment, developed technology, customer relationships, patents, trademarks, and trade names. We amortize all finite-lived intangible assets either on a straight-line basis or based upon patterns in which we expect to utilize the economic benefits of such assets. We initially determine the values of intangible assets by a risk-adjusted, discounted cash flow approach. We assess the potential impairment of identifiable intangible assets and fixed assets whenever events or changes in circumstances indicate that the carrying values may not be recoverable and at least annually. Factors we consider important, which could trigger an impairment of such assets, include the following:
|
|
· |
significant underperformance relative to historical or projected future operating results; |
|
|
· |
significant changes in the manner or use of the assets or the strategy for our overall business; |
|
|
· |
significant negative industry or economic trends; |
|
|
· |
a significant decline in our stock price for a sustained period; and |
|
|
· |
a decline in our market capitalization below net book value. |
Future adverse changes in these or other unforeseeable factors could result in an impairment charge that could materially impact future results of operations and financial position in the reporting period identified. No impairment charges were recorded in fiscal 2016, 2015, or 2014 based on the review of long-lived tangible and intangible assets.
F-14
SMITH & WESSON HOLDING CORPORATION AND SUBSIDIARIES
NOTES TO CONSOLIDATED FINANCIAL STATEMENTS — (Continued)
In accordance with ASC 350, Intangibles-Goodwill and Other, we test goodwill for impairment on an annual basis on February 1 and between annual tests if indicators of potential impairment exist. For the firearms and accessories reporting units, the impairment test compares the fair value of the reporting unit to its carrying amount to assess whether impairment is present. We have reviewed the provisions of ASC 280-10, Segment Reporting Topic, with respect to the criteria necessary to evaluate the number of reporting units that exist. Based on our review of ASC 280-10-50, we have determined that we operate in two reporting units: firearms and accessories. As of April 30, 2016, we had $76.4 million of goodwill, of which $13.8 million related to our DRP Acquisition and $62.6 million related to our BTI Acquisition and subsequent acquisitions by BTI.
We estimate the fair value of our firearms and accessories business units using an equal weighting of the fair values derived from the income approach and the market approach because we believe a market participant would equally weight both approaches when valuing the reporting units. The income approach is based on the projected cash flows that are discounted to their present value using discount rates that consider the timing and risk of the forecasted cash flows. Fair value is estimated using internally-developed forecasts and assumptions. The discount rate used is the average estimated value of a market participant’s cost of capital and debt, derived using customary market metrics. Other significant assumptions include revenue growth rates, profitability projections, and terminal value growth rates. The market approach estimates fair values based on the determination of appropriate publicly traded market comparison companies and market multiples of revenue and earnings derived from those companies with similar operating and investment characteristics as the reporting unit being valued. Finally, we compare and reconcile our overall fair value to our market capitalization in order to assess the reasonableness of the calculated fair values of our reporting units. The foregoing assumptions could deviate materially from actual results. Based on our annual impairment assessment, we determined that the fair value of our firearms and accessories reporting units were significantly in excess of their respective book values.
Income Taxes — We use the asset and liability approach for financial accounting and reporting income taxes. The provision for income taxes is based upon income reported in the accompanying consolidated financial statements as required by ASC 740-10, Accounting for Income Taxes. We determine deferred tax assets and liabilities based on temporary differences between financial reporting and tax bases in assets and liabilities and measure them by applying enacted rates and laws expected to be in place when the deferred items become subject to income tax or deductible for income tax purposes. We recognize the effect on deferred taxes and liabilities of a change in tax rates in the period that includes the enactment date. In assessing the realization of our deferred income tax assets, we consider whether it is more likely than not that the deferred income tax assets will be realized. The ultimate realization of our deferred income tax assets depends upon generating future taxable income during the periods in which our temporary differences become deductible and before our net operating loss carryforwards expire. We evaluate the recoverability of our deferred income tax assets by assessing the need for a valuation allowance on a quarterly basis. If we determine that it is more likely than not that our deferred income tax assets will not be recovered, we establish a valuation allowance against some or all of our deferred income tax assets. Recording a valuation allowance or reversing a valuation allowance could have a significant effect on our future results of operations and financial position.
Warranty — We generally provide a limited one-year warranty and a lifetime service policy to the original purchaser of our new firearm products. We provide for estimated warranty obligations in the period in which we recognize the related revenue. We quantify and record an estimate for warranty-related costs based on our actual historical claims experience and current repair costs. We make adjustments to accruals as warranty claims data and historical experience warrant. Should we experience actual claims and repair costs that are higher than the estimated claims and repair costs used to calculate the provision, our operating results for the period or periods in which such returns or additional costs materialize would be adversely impacted.
From time to time, we have experienced certain manufacturing and design issues with respect to some of our firearms and have initiated some product recalls and safety alerts in the past. As of April 30, 2016, we estimate the remaining cost of our recalls and safety alerts to be $4.0 million, which is recorded in the accrued warranty balance. Warranty expense for the fiscal years ended April 30, 2016, 2015, and 2014 amounted to $2.5 million, $4.3 million, and $3.6 million, respectively.
The following table sets forth the change in accrued warranties, a portion of which is recorded as a non-current liability, in the fiscal years ended April 30, 2016, 2015, and 2014 (in thousands):
|
|
April 30, 2016 |
|
|
April 30, 2015 |
|
|
April 30, 2014 |
|
|||||||
|
Beginning Balance |
$ |
|
8,653 |
|
|
$ |
|
7,565 |
|
|
$ |
|
8,423 |
|
|
|
|
Warranties issued and adjustments to provisions |
|
|
2,546 |
|
|
|
|
4,292 |
|
|
|
|
3,620 |
|
|
|
Warranty claims |
|
|
(2,796 |
) |
|
|
|
(3,204 |
) |
|
|
|
(4,478 |
) |
|
Ending Balance |
$ |
|
8,403 |
|
|
$ |
|
8,653 |
|
|
$ |
|
7,565 |
|
|
F-15
SMITH & WESSON HOLDING CORPORATION AND SUBSIDIARIES
NOTES TO CONSOLIDATED FINANCIAL STATEMENTS — (Continued)
Sales and Promotional Related Expenses — We present product sales in our consolidated financial statements, net of customer promotional program costs that depend upon the volume of sales. For promotional program costs that are not dependent on the volume of sales, we record promotional costs in cost of goods sold. The total of these promotional programs amounted to $20.7 million, $6.9 million, and $1.6 million for the fiscal years ended April 30, 2016, 2015, and 2014, respectively. We have a co-op advertising program at the retail level. We expensed costs amounting to $6.5 million, $2.8 million, and $1.9 million for fiscal 2016, 2015, and 2014, respectively, as selling and marketing expenses.
Shipping and Handling — In the accompanying consolidated financial statements, we included amounts billed to customers for shipping and handling in net sales. We included our costs relating to shipping and handling charges, including inbound freight charges, internal transfer costs, and the other costs of our distribution network, in cost of goods sold.
Insurance Reserves — We are self-insured through retentions or deductibles for the majority of our workers’ compensation, automobile, general liability, product liability, and group health insurance programs. Self-insurance amounts vary up to $10.0 million per occurrence; however, we believe the likelihood of reaching the maximum per occurrence limit is remote. We record our liability for estimated premiums and incurred losses in the accompanying consolidated financial statements on an undiscounted basis.
Recently Issued Accounting Standard — In May 2014, the Financial Accounting Standards Board issued Accounting Standards Update 2014-09, Revenue from Contracts with Customers (Topic 606), or ASU 2014-09. The core principle of ASU 2014-09 is that an entity should recognize revenue to depict the transfer of promised goods or services to customers in an amount that reflects the consideration to which the entity expects to be entitled in exchange for those goods or services. ASU 2014-09 is effective for interim reporting periods beginning October 1, 2017. Early adoption is not permitted. Additionally, in March 2016, the FASB issued ASU No. 2016-08, Revenue from Contracts with Customers: Identifying Performance Obligations and Licensing, which clarifies the identification of performance obligations and the licensing implementation guidance. In May 2016, the FASB issued ASU 2016-12, Narrow-Scope Improvements and Practical Expedients (Topic 606), which provides clarifying guidance in certain narrow areas and adds some practical expedients. The effective dates for these ASU’s is the same as the effective date for ASU No. 2014-09. We are currently evaluating the impact, if any, that these ASUs will have on our consolidated financial statements.
In April 2015, the FASB issued ASU 2015-03, Interest - Imputation of Interest (Topic 835-30), which requires that debt issuance costs related to a recognized debt liability be presented in the balance sheet as a direct deduction from the carrying amount of that debt liability, consistent with debt discounts. The recognition and measurement guidance for debt issuance costs are not affected by this ASU. The disclosure requirements are effective for annual periods (and interim periods within those annual periods) beginning after December 15, 2015 and require retrospective application. We elected to early adopt ASU 2015-03 in the first quarter of fiscal 2016. Accordingly, unamortized debt issuance costs of $4.1 million as of April 30, 2015, which were previously included in other assets, are included in notes payable in the accompanying consolidated balance sheet.
In July 2015, the FASB issued ASU 2015-11, Inventory - Simplifying the Measurement of Inventory (Topic 330), which simplifies the subsequent measurement of inventories by replacing the lower of cost or market test with a lower of cost and net realizable value test. The guidance applies only to inventories for which cost is determined other than by the last-in first-out (LIFO) method and the retail inventory method. ASU 2015-11 is effective for periods beginning after December 15, 2016, and early adoption is permitted. The new guidance must be applied prospectively. We are currently evaluating the impact, if any, that ASU 2015-11 will have on our consolidated financial statements.
In September 2015, the FASB issued ASU No. 2015-16, Business Combinations (Topic 805): Simplifying the Accounting for Measurement-Period Adjustments, which eliminates the current requirement to recognize measurement-period adjustments to provisional amounts retrospectively. Instead, ASU 2015-16 requires the acquirer to recognize measurement-period adjustments, as well as the impact on earnings of changes in depreciation, amortization, and similar items, if any, resulting from the change to the provisional amounts, in the period when the amount of each measurement-period adjustment is determined. This amendment is effective for fiscal years, and interim periods within those fiscal years, beginning after December 15, 2015. We elected to early adopt ASU 2015-16 in the second quarter of fiscal 2016. As a result of the early adoption, goodwill was not restated for measurement period adjustments during the year ended April 30, 2016.
In November 2015, the FASB issued ASU No. 2015-17, Income Taxes (Topic 740): Balance Sheet Classification of Deferred Taxes, which amends the existing guidance to require that deferred income tax liabilities and assets be classified as noncurrent in a classified balance sheet and eliminates the prior guidance, which required an entity to separate deferred tax liabilities and assets into a current amount and a noncurrent amount in a classified balance sheet. The amendments to this ASU are effective for financial statements for annual periods and interim periods within those annual periods beginning after December 15, 2016, and early adoption
F-16
SMITH & WESSON HOLDING CORPORATION AND SUBSIDIARIES
NOTES TO CONSOLIDATED FINANCIAL STATEMENTS — (Continued)
is permitted. In addition, the new guidance can be applied either prospectively to all deferred tax liabilities and assets or retrospectively to all periods presented. We elected to early adopt ASU 2015-17 in the fourth quarter of fiscal 2016 on a prospective basis. We have classified all deferred tax assets and liabilities as non-current in our classified balance sheet as of April 30, 2016.
In February 2016, the FASB issued ASU No. 2016-02, Leases (Topic 842), which amends the existing guidance to require lessees to recognize lease assets and lease liabilities arising from operating leases in a classified balance sheet. The amendments of this ASU are effective for financial statements for annual periods and interim periods within those annual periods beginning after December 15, 2018, and early adoption is permitted. We are currently evaluating the impact that ASU 2016-02 will have on our consolidated financial statements.
In March 2016, the FASB issued ASU No. 2016-09, Compensation - Stock Compensation (Topic 718): Improvements to Employee Share-Based Payment Accounting, which includes multiple amendments intended to simplify aspects of share-based payment transactions, including accounting for income taxes, forfeitures, and statutory tax withholding requirements, as well as classification in the statement of cash flows. The amendments of this ASU are effective for annual periods beginning after December 15, 2017, and interim periods within annual periods beginning December 15, 2018, early adoption is permitted. We are currently evaluating the impact that ASU 2016-09 will have on our consolidated financial statements.
4. Discontinued Operations
During fiscal 2013, we committed to a plan to divest the assets, liabilities, and ongoing operations of our security solutions division. Accordingly, the operating results of this discontinued division are presented as discontinued operations as a separate line in the consolidated statements of income for all periods presented. The amounts reported for the fiscal years ended April 30, 2015 and 2014 relate primarily to legal fees associated with retained liabilities.
5. Goodwill
The changes in the carrying amount of goodwill for the year ended April 30, 2016 by reporting segment are as follows:
|
|
|
|
Firearms |
|
|
|
Accessories |
|
|
|
Total |
|
|
|||
|
|
|
|
Division |
|
|
|
Division |
|
|
|
Goodwill |
|
|
|||
|
|
|
|
|
|
|
|
|
|
|
|
|
|
|
|
|
|
|
Balance as of April 30, 2015 |
|
$ |
|
13,770 |
|
|
$ |
|
61,656 |
|
|
$ |
|
75,426 |
|
|
|
Measurement period adjustments |
|
|
— |
|
|
|
|
738 |
|
|
|
|
738 |
|
|
|
|
Acquisitions |
|
|
— |
|
|
|
|
193 |
|
|
|
|
193 |
|
|
|
|
Balance as of April 30, 2016 |
|
$ |
|
13,770 |
|
|
$ |
|
62,587 |
|
|
$ |
|
76,357 |
|
|
|
|
|
|
|
|
|
|
|
|
|
|
|
|
|
|
|
|
6. Notes Payable and Financing Arrangements
Credit Facilities — On July 15, 2014, we entered into a $75.0 million unsecured credit facility. On November 25, 2014, we partially exercised the accordion feature of the credit facility to increase it by $50.0 million to $125.0 million in connection with the BTI Acquisition. On April 13, 2015, we exercised the remaining $50.0 million expansion under the accordion feature to increase the line of credit available to us to $175.0 million. The credit facility was scheduled to mature on December 15, 2016 and bore interest at a variable rate equal to LIBOR or prime, at our election, plus an applicable margin based on our consolidated leverage ratio.
On June 15, 2015, we entered into a new unsecured credit facility, or the Credit Agreement, with TD Bank, N.A. and other lenders, or the Lenders, which included a $175.0 million revolving line of credit, or the Revolving Line, and a $105.0 million term loan, or the Term Loan, of which $100.3 million remains outstanding as of April 30, 2016. The Revolving Line provides for availability until June 15, 2020 for general corporate purposes with borrowings to bear interest at a variable rate equal to LIBOR or prime plus an applicable margin based on our consolidated leverage ratio, at our election. As of April 30, 2016, there were no borrowings outstanding on the Revolving Line. Had there been borrowings, they would have borne an interest rate of 4.00% per annum if we had selected the prime rate option and a range of 1.94% to 2.13% per annum if we had selected the LIBOR rate option. The Term Loan, which bears interest at a variable rate, was entered into for the purpose of redeeming the entire $100.0 million of then outstanding 5.875% Senior Notes due 2017, or the 5.875% Senior Notes. The Term Loan requires principal payments of $6.3 million per annum plus interest, payable quarterly. Any remaining outstanding amount on the maturity date of June 15, 2020 will be due in full. Concurrent with closing the Term Loan, we redeemed our 5.875% Senior Notes for a $2.9 million call premium, which is included in interest expense, plus accrued and unpaid interest. As part of the redemption, in fiscal 2016, we wrote off $1.7 million of debt-issue costs related to the 5.875% Senior Notes.
F-17
SMITH & WESSON HOLDING CORPORATION AND SUBSIDIARIES
NOTES TO CONSOLIDATED FINANCIAL STATEMENTS — (Continued)
We were required to obtain interest rate protection on the Term Loan covering not less than 75% of the aggregate outstanding principal balance of the Term Loan. Accordingly, on June 18, 2015, we entered into an interest rate swap agreement, which expires on June 15, 2020, that covered 100% of the $105.0 million of floating rate debt. On July 6, 2015, we executed an interest rate swap pursuant to such agreement, which requires us to pay interest at a defined rate of 1.56% while receiving interest at a defined variable rate of one-month LIBOR (0.188% at July 31, 2015). This swap, when combined with the applicable margin based on our consolidated leverage ratio, effectively fixed our interest rate on the Term Loan, which is subject to change based on changes in our consolidated leverage ratio. As of April 30, 2016, our interest rate on the Term Loan is 3.06%.
We recognize derivatives as either assets or liabilities on our consolidated balance sheets at fair value. The accounting for changes in the fair value (i.e., unrealized gains or losses) of a derivative instrument depends on whether it has been designated and qualifies as part of a hedging relationship and on the type of hedging relationship. Derivatives that do not qualify for hedge accounting must be adjusted to fair value through earnings. Our interest rate swap agreement is considered effective and qualifies as a cash flow hedge. The effective portion of the gain or loss on the derivative that is designated and qualifies as a cash flow hedge is recorded as a component of accumulated other comprehensive income or loss and reclassified into earnings in the same period or periods during which the hedged transaction affects earnings. As of April 30, 2016, the interest rate swap was considered effective and had no effect on earnings. The fair value of the interest rate swap on April 30, 2016 was a liability of $1.3 million and was included in other long-term liabilities on our consolidated balance sheet. We do not expect the interest rate swap to have any material effect on earnings within the next 12 months. As of April 30, 2016, the effective interest rate of our Term Loan was 3.06%.
5.000% Senior Notes – During fiscal 2015, we issued an aggregate of $75.0 million of 5.000% Senior Notes due 2018, or the 5.000% Senior Notes, to various institutional investors pursuant to the terms and conditions of an indenture, or the 5.000% Senior Notes Indenture, and purchase agreements. The 5.000% Senior Notes bear interest at a rate of 5.000% per annum payable on January 15 and July 15 of each year, beginning on January 15, 2015. We incurred $2.3 million of debt issuance costs related to the issuance of the 5.000% Senior Notes.
At any time prior to July 15, 2016, we may, at our option (a) upon not less than 30 nor more than 60 days’ prior notice, redeem all or a portion of the 5.000% Senior Notes at the redemption price of 100% of the principal amount of the 5.000% Senior Notes, plus an applicable premium, plus accrued and unpaid interest as of the redemption date; or (b) redeem up to 35% of the aggregate principal amount of the 5.000% Senior Notes with the net cash proceeds of one or more equity offerings at a redemption price of 105.000% of the principal amount of the 5.000% Senior Notes, plus accrued and unpaid interest as of the redemption date; provided, that in the case of the foregoing clause, at least 65% of the aggregate original principal amount of the 5.000% Senior Notes remains outstanding, and the redemption occurs within 60 days after the closing of the equity offering. On and after July 15, 2016, we may, at our option, upon not less than 30 nor more than 60 days’ prior notice, redeem all or a portion of the 5.000% Senior Notes at a redemption price of (a) 102.500% of the principal amount of the 5.000% Senior Notes to be redeemed, if redeemed during the 12-month period beginning on July 15, 2016; or (b) 100% of the principal amount of the 5.000% Senior Notes to be redeemed, if redeemed during the 12-month period beginning on July 15, 2017, plus, in either case, accrued and unpaid interest on the 5.000% Senior Notes as of the applicable redemption date. Subject to certain restrictions and conditions, we may be required to make an offer to repurchase the 5.000% Senior Notes from the holders of the 5.000% Senior Notes in connection with a change of control or disposition of assets. If not redeemed by us or repaid pursuant to the holders’ right to require repurchase, the 5.000% Senior Notes mature on July 15, 2018.
The 5.000% Senior Notes are general, unsecured obligations of our company. The 5.000% Senior Notes Indenture contains certain affirmative and negative covenants, including limitations on restricted payments (such as share repurchases, dividends, and early payment of indebtedness), limitations on indebtedness, limitations on the sale of assets, and limitations on liens. Payments that would otherwise be characterized as restricted payments are permitted under the 5.000% Senior Notes Indenture in an amount not to exceed 50% of our consolidated net income for the period from the issue date to the date of the restricted payment, provided that at the time of making such payments, (a) no default has occurred or would result from the making of such payments, and (b) we are able to satisfy the debt incurrence test under the 5.000% Senior Notes Indenture, or the 5.000% Senior Notes Lifetime Aggregate Limit. In addition, the 5.000% Senior Notes Indenture provides for other exceptions to the restricted payments covenant, each of which are independent of the 5.000% Senior Notes Lifetime Aggregate Limit. Among such exceptions are (i) the ability to make share repurchases each fiscal year in an amount not to exceed the lesser of (A) $50.0 million in any fiscal year or (B) 75.0% of our consolidated net income for the previous four consecutive published fiscal quarters prior to the date of the determination of such consolidated net income, and (ii) share repurchases over the life of the 5.000% Senior Notes in an aggregate amount not to exceed $75.0 million.
The limitation on indebtedness in the 5.000% Senior Notes Indenture is only applicable at such time that the consolidated coverage ratio (as set forth in the 5.000% Senior Notes Indenture) for us and our restricted subsidiaries is less than 3.00 to 1.00. In general, as set forth in the 5.000% Senior Notes Indenture, the consolidated coverage ratio is determined by comparing our prior four quarters’ consolidated EBITDA (earnings before interest, taxes, depreciation, and amortization) to our consolidated interest expense.
F-18
SMITH & WESSON HOLDING CORPORATION AND SUBSIDIARIES
NOTES TO CONSOLIDATED FINANCIAL STATEMENTS — (Continued)
The carrying value of our 5.000% Senior Notes as of April 30, 2016 approximates fair value in considering Level 2 inputs within the hierarchy.
Debt Issuance Costs — We recorded, in notes payable, $1.0 million and $2.6 million of debt issuance costs for the fiscal years ended April 30, 2016 and 2015, respectively. These costs are being amortized to expense over the life of the credit facility or the 5.000% Senior Notes Indenture. In total, we amortized $2.7 million, $1.5 million, and $1.9 million to interest expense for all debt issuance costs in fiscal 2016, 2015, and 2014, respectively, including write-offs related to extinguishment.
The Credit Agreement for our credit facility contains financial covenants relating to maintaining maximum leverage and minimum debt service coverage. The 5.000% Senior Notes Indenture contains a financial covenant relating to times interest earned.
Letters of Credit — At April 30, 2016, we had outstanding letters of credit aggregating $1.0 million.
7. Net Sales
The following table sets forth the breakdown of net sales for the fiscal years ended April 30, 2016, 2015, and 2014, respectively (in thousands):
|
|
For the Year Ended April 30, |
|
||||||||||||
|
|
2016 |
|
|
2015 |
|
|
2014 |
|
||||||
|
Handguns |
$ |
|
485,413 |
|
|
$ |
|
395,500 |
|
|
$ |
|
422,992 |
|
|
Long Guns |
|
|
127,607 |
|
|
|
|
90,178 |
|
|
|
|
155,311 |
|
|
Walther |
|
|
— |
|
|
|
|
506 |
|
|
|
|
5,651 |
|
|
Other Products & Services |
|
|
44,598 |
|
|
|
|
45,038 |
|
|
|
|
42,666 |
|
|
Firearm Division |
|
|
657,618 |
|
|
|
|
531,222 |
|
|
|
|
626,620 |
|
|
Accessories Division |
|
|
65,290 |
|
|
|
|
20,640 |
|
|
|
N/A |
|
|
|
Total Net Sales |
$ |
|
722,908 |
|
|
$ |
|
551,862 |
|
|
$ |
|
626,620 |
|
All of our firearms are currently sold under our Smith & Wesson, M&P, and Thompson/Center Arms brands. In addition, through our Performance Center, we offer small, specialized, and enhanced models sold under the Smith & Wesson and M&P brands. Depending upon the product or service, our firearm customers include distributors; federal, state, and municipal law enforcement agencies and officers; government and military agencies; businesses; retailers; and consumers. We sell accessories under our Caldwell Shooting Supplies, Wheeler Engineering, Tipton Gun Cleaning Supplies, Thompson/Center Arms, Frankford Arsenal Reloading Tools, Lockdown Vault Accessories, Hooyman Premium Tree Saws, BOG-POD, and Golden Rod Moisture Control brands. Our accessories customers are generally businesses, retailers, and consumers.
We sell our products worldwide. The following table sets forth the breakdown of export net sales included in the above table. Our export net sales accounted for 3%, 4%, and 3% of total net sales for the fiscal years ended April 30, 2016, 2015, and 2014, respectively (in thousands):
|
|
For the Year Ended April 30, |
|
|
||||||||||||
|
Region |
2016 |
|
|
2015 |
|
|
2014 |
|
|
||||||
|
|
|
||||||||||||||
|
Europe |
$ |
|
8,913 |
|
|
$ |
|
8,164 |
|
|
$ |
|
6,279 |
|
|
|
Asia |
|
|
3,989 |
|
|
|
|
1,463 |
|
|
|
|
1,766 |
|
|
|
Latin America |
|
|
2,593 |
|
|
|
|
1,643 |
|
|
|
|
200 |
|
|
|
All others international |
|
|
9,120 |
|
|
|
|
11,570 |
|
|
|
|
9,605 |
|
|
|
|
|
|
|
|
|
|
|
|
|
|
|
|
|
|
|
|
Total international net sales |
$ |
|
24,615 |
|
|
$ |
|
22,840 |
|
|
$ |
|
17,850 |
|
|
We had no assets relating to our firearm business located outside the United States during any of the periods presented; we own tooling relating to our accessories business that is located at various suppliers in Asia.
8. Advertising Costs
We expense advertising costs, primarily consisting of magazine advertisements, printed materials, and television advertisements, either as incurred or upon the first occurrence of the advertising. Advertising expense, included in selling and
F-19
SMITH & WESSON HOLDING CORPORATION AND SUBSIDIARIES
NOTES TO CONSOLIDATED FINANCIAL STATEMENTS — (Continued)
marketing expenses for the fiscal years ended April 30, 2016, 2015, and 2014, amounted to $21.8 million, $20.2 million, and $19.5 million, respectively.
9. Property, Plant, and Equipment
The following table summarizes property, plant, and equipment as of April 30, 2016 and 2015 (in thousands):
|
|
April 30, 2016 |
|
|
April 30, 2015 |
|
|
||||
|
|
|
|||||||||
|
Machinery and equipment |
$ |
|
211,186 |
|
|
$ |
|
191,480 |
|
|
|
Software and hardware |
|
|
34,642 |
|
|
|
|
30,945 |
|
|
|
Building and improvements |
|
|
23,388 |
|
|
|
|
19,946 |
|
|
|
Land and improvements |
|
|
3,235 |
|
|
|
|
3,214 |
|
|
|
|
|
|
|
|
|
|
|
|
|
|
|
|
|
|
272,451 |
|
|
|
|
245,585 |
|
|
|
Less: Accumulated depreciation and amortization |
|
|
(142,137 |
) |
|
|
|
(116,663 |
) |
|
|
|
|
|
|
|
|
|
|
|
|
|
|
|
|
|
130,314 |
|
|
|
|
128,922 |
|
|
|
Construction in progress |
|
|
5,091 |
|
|
|
|
4,922 |
|
|
|
|
|
|
|
|
|
|
|
|
|
|
|
Total property, plant, and equipment, net |
$ |
|
135,405 |
|
|
$ |
|
133,844 |
|
|
Depreciation of tangible assets and amortization of software expense amounted to $27.8 million, $24.8 million, and $19.1 million for the fiscal years ended April 30, 2016, 2015, and 2014, respectively.
The following table summarizes depreciation and amortization expense, which includes amortization of intangibles and debt financing costs, by line item for the fiscal years ended April 30, 2016, 2015, and 2014 (in thousands):
|
|
For the Year Ended April 30, |
|
|
||||||||||||
|
|
2016 |
|
|
2015 |
|
|
2014 |
|
|
||||||
|
Cost of products and services sold |
$ |
|
22,332 |
|
|
$ |
|
20,640 |
|
|
$ |
|
16,505 |
|
|
|
Research and development |
|
|
1,136 |
|
|
|
|
403 |
|
|
|
|
325 |
|
|
|
Selling and marketing |
|
|
221 |
|
|
|
|
255 |
|
|
|
|
207 |
|
|
|
General and administrative (a) |
|
|
14,869 |
|
|
|
|
8,134 |
|
|
|
|
2,720 |
|
|
|
Interest expense |
|
|
2,679 |
|
|
|
|
1,461 |
|
|
|
|
1,947 |
|
|
|
Total depreciation and amortization |
$ |
|
41,237 |
|
|
$ |
|
30,893 |
|
|
$ |
|
21,704 |
|
|
|
|
(a) |
General and administrative expenses for fiscal 2016 and 2015 include $9.9 million and $3.6 million, respectively, of amortization recorded as a result of the BTI Acquisition. |
10. Inventories
The following table sets forth a summary of inventories, net of reserves, stated at lower of cost or market, as of April 30, 2016 and 2015 (in thousands):
|
|
April 30, 2016 |
|
|
April 30, 2015 |
|
||
|
Finished goods |
$ |
26,574 |
|
|
$ |
28,240 |
|
|
Finished parts |
|
32,804 |
|
|
|
34,269 |
|
|
Work in process |
|
9,263 |
|
|
|
7,492 |
|
|
Raw material |
|
9,148 |
|
|
|
6,894 |
|
|
Total inventories |
$ |
77,789 |
|
|
$ |
76,895 |
|
F-20
SMITH & WESSON HOLDING CORPORATION AND SUBSIDIARIES
NOTES TO CONSOLIDATED FINANCIAL STATEMENTS — (Continued)
11. Intangible Assets
The following table presents a summary of intangible assets as of April 30, 2016 and 2015 (in thousands):
|
|
|
April 30, 2016 |
|
|
April 30, 2015 |
|
||||||||||||||||||||||||
|
|
|
Gross |
|
|
|
|
|
|
|
|
|
|
|
|
Gross |
|
|
|
|
|
|
|
|
|
|
|
||||
|
|
|
Carrying |
|
|
Accumulated |
|
|
Net Carrying |
|
|
Carrying |
|
|
Accumulated |
|
|
Net Carrying |
|
||||||||||||
|
|
|
Amount |
|
|
Amortization |
|
|
Amount |
|
|
Amount |
|
|
Amortization |
|
|
Amount |
|
||||||||||||
|
Customer relationships |
|
$ |
|
28,560 |
|
|
$ |
|
(6,423 |
) |
|
$ |
|
22,137 |
|
|
$ |
|
28,260 |
|
|
$ |
|
(1,633 |
) |
|
$ |
|
26,627 |
|
|
Developed technology |
|
|
|
16,430 |
|
|
|
|
(2,890 |
) |
|
|
|
13,540 |
|
|
|
|
16,630 |
|
|
|
|
(1,014 |
) |
|
|
|
15,616 |
|
|
Patents, trademarks, and trade names |
|
|
|
36,076 |
|
|
|
|
(9,262 |
) |
|
|
|
26,814 |
|
|
|
|
36,378 |
|
|
|
|
(5,303 |
) |
|
|
|
31,075 |
|
|
|
|
|
|
81,066 |
|
|
|
|
(18,575 |
) |
|
|
|
62,491 |
|
|
|
|
81,268 |
|
|
|
|
(7,950 |
) |
|
|
|
73,318 |
|
|
Patents in progress |
|
|
|
433 |
|
|
|
|
— |
|
|
|
|
433 |
|
|
|
|
450 |
|
|
|
|
— |
|
|
|
|
450 |
|
|
|
|
$ |
|
81,499 |
|
|
$ |
|
(18,575 |
) |
|
$ |
|
62,924 |
|
|
$ |
|
81,718 |
|
|
$ |
|
(7,950 |
) |
|
$ |
|
73,768 |
|
Intangible assets with determinable lives are amortized over a weighted-average period of approximately five years. The weighted-average periods of amortization by intangible asset class is approximately five years for customer relationships, six years for developed technology, and five years for patents, trademarks, and trade names. Amortization expense, excluding amortization of deferred financing costs, amounted to $10.7 million, $4.6 million, and $645,000 for the fiscal years ended April 30, 2016, 2015, and 2014, respectively.
The following table represents future expected amortization expense as of April 30, 2016, which will primarily be recorded in our accessories segment (in thousands):
|
Fiscal |
|
|
Amount |
|
|
|
2017 |
|
$ |
|
10,673 |
|
|
2018 |
|
|
|
9,896 |
|
|
2019 |
|
|
|
8,670 |
|
|
2020 |
|
|
|
7,496 |
|
|
2021 |
|
|
|
6,501 |
|
|
Thereafter |
|
|
|
19,255 |
|
|
Total |
|
$ |
|
62,491 |
|
12. Accrued Expenses
The following table sets forth other accrued expenses as of April 30, 2016 and 2015 (in thousands):
|
|
April 30, 2016 |
|
|
April 30, 2015 |
|
||||
|
Accrued rebates and promotions |
$ |
|
7,937 |
|
|
$ |
|
4,126 |
|
|
Accrued taxes other than income |
|
|
5,931 |
|
|
|
|
5,281 |
|
|
Accrued employee benefits |
|
|
4,326 |
|
|
|
|
3,065 |
|
|
Accrued professional fees |
|
|
2,195 |
|
|
|
|
2,335 |
|
|
Current portion of capital lease obligation |
|
|
1,455 |
|
|
|
|
496 |
|
|
Interest payable |
|
|
1,218 |
|
|
|
|
3,362 |
|
|
Accrued other |
|
|
5,385 |
|
|
|
|
5,637 |
|
|
Total accrued expenses |
$ |
|
28,447 |
|
|
$ |
|
24,302 |
|
F-21
SMITH & WESSON HOLDING CORPORATION AND SUBSIDIARIES
NOTES TO CONSOLIDATED FINANCIAL STATEMENTS — (Continued)
13. Fair Value Measurement
We follow the provisions of ASC 820-10, Fair Value Measurements and Disclosures Topic, for our financial assets and liabilities. ASC 820-10 provides a framework for measuring fair value under GAAP and requires expanded disclosures regarding fair value measurements. ASC 820-10 defines fair value as the exchange price that would be received for an asset or paid to transfer a liability (an exit price) in the principal or most advantageous market for the asset or liability in an orderly transaction between market participants on the measurement date. ASC 820-10 also establishes a fair value hierarchy which requires an entity to maximize the use of observable inputs, where available, and minimize the use of unobservable inputs when measuring fair value.
Financial assets and liabilities recorded on the accompanying consolidated balance sheets are categorized based on the inputs to the valuation techniques as follows:
Level 1 — Financial assets and liabilities whose values are based on unadjusted quoted prices for identical assets or liabilities in an active market that we have the ability to access at the measurement date (examples include active exchange-traded equity securities, listed derivatives, and most U.S. Government and agency securities).
Our cash and cash equivalents, which are measured at fair value on a recurring basis, totaled $191.3 million and $42.2 million as of April 30, 2016 and 2015, respectively. We utilized Level 1 of the value hierarchy to determine the fair values of these assets.
Level 2 — Financial assets and liabilities whose values are based on quoted prices in markets in which trading occurs infrequently or whose values are based on quoted prices of instruments with similar attributes in active markets. Level 2 inputs include the following:
|
|
· |
quoted prices for identical or similar assets or liabilities in non-active markets (such as corporate and municipal bonds which trade infrequently); |
|
|
· |
inputs other than quoted prices that are observable for substantially the full term of the asset or liability (such as interest rate and currency swaps); and |
|
|
· |
inputs that are derived principally from or corroborated by observable market data for substantially the full term of the asset or liability (such as certain securities and derivatives). |
The fair value of our Term Loan is equal to the carrying value of April 30, 2016. The fair value of our 5.000% Senior Notes as of April 30, 2016 is approximate to the carrying value in considering Level 2 inputs within the hierarchy as our Senior Notes are not frequently traded. The fair value of our interest rate swap was estimated by a third party using inputs that are observable or that can be corroborated by observable market data, such as interest rate yield curves, and, therefore, are classified within Level 2 of the valuation hierarchy. For more information regarding the interest rate swap, refer to Note 6.
Level 3 — Financial assets and liabilities whose values are based on prices or valuation techniques that require inputs that are both unobservable and significant to the overall fair value measurement. These inputs reflect our assumptions about the assumptions a market participant would use in pricing the asset or liability.
We currently do not have any Level 3 financial assets or liabilities.
14. Self-Insurance Reserves
As of April 30, 2016 and 2015, we had reserves for workers’ compensation, product liability, municipal liability, and medical/dental costs totaling $10.1 million and $9.6 million, respectively, of which $5.8 million and $6.2 million, respectively, were classified as other non-current liabilities. As of April 30, 2016 and 2015, $4.3 million were included in accrued expenses on the accompanying consolidated balance sheets. In addition, as of April 30, 2016 and 2015, $621,000 and $587,000 of workers’ compensation recoverable was classified as other assets. While we believe these reserves to be adequate, it is possible that the ultimate liabilities will exceed such estimates.
F-22
SMITH & WESSON HOLDING CORPORATION AND SUBSIDIARIES
NOTES TO CONSOLIDATED FINANCIAL STATEMENTS — (Continued)
The following table is a summary of the activity in the workers’ compensation, product liability, municipal liability, and medical/dental reserves in the fiscal years ended April 30, 2016, 2015, and 2014 (in thousands):
|
|
For the Year Ended April 30, |
|
|
||||||||||||
|
|
2016 |
|
|
2015 |
|
|
2014 |
|
|
||||||
|
|
|
|
|
|
|
|
|
|
|
|
|
|
|
|
|
|
Beginning balance |
$ |
|
9,610 |
|
|
$ |
|
9,185 |
|
|
$ |
|
9,570 |
|
|
|
Additional provision charged to expense |
|
|
16,781 |
|
|
|
|
12,925 |
|
|
|
|
10,721 |
|
|
|
Payments |
|
|
(16,309 |
) |
|
|
|
(12,500 |
) |
|
|
|
(11,106 |
) |
|
|
|
|
|
|
|
|
|
|
|
|
|
|
|
|
|
|
|
Ending balance |
$ |
|
10,082 |
|
|
$ |
|
9,610 |
|
|
$ |
|
9,185 |
|
|
It is our policy to provide an estimate for loss as a result of expected adverse findings or legal settlements on product liability, municipal liability, workers’ compensation, and other matters when such losses are probable and are reasonably estimable. It is also our policy to accrue for reasonable estimable legal costs associated with defending such litigation. While such estimates involve a range of possible costs, we determine, in consultation with litigation counsel, the most likely cost within such range on a case-by-case basis. We also record receivables from insurance carriers relating to these matters when their collection is probable. As of April 30, 2016 and 2015, we had accrued reserves for product and municipal litigation liabilities of $3.8 million (of which $3.1 million were non-current), consisting entirely of expected legal defense costs. In addition, as of April 30, 2016 and 2015, we had recorded receivables from insurance carriers related to these liabilities of $1.9 million, nearly all of which has been classified as other assets with $25,000 classified as other current assets.
15. Stockholders’ Equity
Treasury Stock
During fiscal 2016, our board of directors authorized the repurchase of up to $50.0 million of our common stock, subject to certain conditions, in the open market or in privately negotiated transactions until June 23, 2017. As of April 30, 2016, there we no share repurchases under this stock repurchase program.
At the end of fiscal 2014, our board of directors authorized the repurchase of up to $30.0 million of our common stock, subject to certain conditions, in the open market or privately negotiated transactions, commencing no earlier than May 1, 2014. During fiscal 2015, we completed this stock repurchase program by repurchasing 2,105,315 shares of our common stock for $30.0 million, utilizing cash on hand. Fees and expenses incurred related to open market purchases in fiscal 2015 were $40,000 and were recorded in treasury stock.
During fiscal 2014, our board of directors authorized the repurchase of up to $115.0 million of our common stock, of which up to $75.0 million was authorized for purchase in a tender offer and the remainder of which could be repurchased in the open market or in privately negotiated transactions. During fiscal 2014, we repurchased 1,417,233 shares of our common stock pursuant to the tender offer that expired on July 23, 2013 for $15.6 million and 8,740,471 shares of our common stock in the open market for $99.4 million, in each case, utilizing cash on hand, completing our $115.0 million stock repurchase program. Fees and expenses incurred related to the tender offer and open market purchases in fiscal 2014 were $887,000 and were recorded in treasury stock.
Incentive Stock and Employee Stock Purchase Plans
We have two stock plans, or SPs: the 2004 Incentive Stock Plan and the 2013 Incentive Stock Plan. New grants under the 2004 Incentive Stock Plan have not been made since the approval of the 2013 Incentive Stock Plan at our September 23, 2013 annual meeting of stockholders. All new grants covering all participants are issued under the 2013 Incentive Stock Plan.
The 2013 Incentive Stock Plan authorizes the issuance of 3,000,000 shares, plus any shares that were reserved and remained available for grant and delivery under the 2004 Incentive Stock Plan as of September 23, 2013, the effective date of the 2013 Incentive Stock Plan. The plan permits the grant of options to acquire common stock, restricted stock awards, RSUs, stock appreciation rights, bonus stock and awards in lieu of obligations, performance awards, and dividend equivalents. Our board of directors, or a committee established by our board, administers the SPs, selects recipients to whom awards are granted, and determines the grants to be awarded. Options granted under the SPs are exercisable at a price determined by our board or committee at the time of grant, but in no event, less than fair market value of our common stock on the date granted. Grants of options may be made to employees and directors without regard to any performance measures. All options issued pursuant to the SPs are generally nontransferable and subject to forfeiture.
F-23
SMITH & WESSON HOLDING CORPORATION AND SUBSIDIARIES
NOTES TO CONSOLIDATED FINANCIAL STATEMENTS — (Continued)
Unless terminated earlier by our board of directors, the 2013 Incentive Stock Plan will terminate at the earliest of (1) the tenth anniversary of the effective date of the 2013 Stock Plan, or (2) such time as no shares of common stock remain available for issuance under the plan and we have no further rights or obligations with respect to outstanding awards under the plan. The date of grant of an award is deemed to be the date upon which our board of directors or board committee authorizes the granting of such award.
Except in specific circumstances, grants vest over a period of three or four years and are exercisable for a period of 10 years. The plan also permits the grant of awards to non-employees, which our board of directors has authorized in the past.
The number of shares and weighted average exercise prices of options for the fiscal years ended April 30, 2016, 2015, and 2014 are as follows:
|
|
For the Year Ended April 30, |
|||||||||||||||||||||
|
|
2016 |
|
|
2015 |
|
|
2014 |
|||||||||||||||
|
|
|
|
|
|
Weighted |
|
|
|
|
|
|
Weighted |
|
|
|
|
|
|
Weighted |
|||
|
|
|
|
|
|
Average |
|
|
|
|
|
|
Average |
|
|
|
|
|
|
Average |
|||
|
|
Shares |
|
|
Exercise Price |
|
|
Shares |
|
|
Exercise Price |
|
|
Shares |
|
|
Exercise Price |
||||||
|
Options outstanding, beginning of year |
|
1,879,630 |
|
|
$ |
6.37 |
|
|
|
2,258,349 |
|
|
$ |
6.15 |
|
|
|
3,019,127 |
|
|
$ 5.31 |
|
|
Exercised during the period |
|
(1,490,270 |
) |
|
|
6.42 |
|
|
|
(365,719 |
) |
|
|
4.96 |
|
|
|
(732,778 |
) |
|
2.73 |
|
|
Canceled/forfeited during period |
— |
|
|
— |
|
|
|
(13,000 |
) |
|
|
7.98 |
|
|
|
(28,000 |
) |
|
5.59 |
|||
|
Options outstanding, end of period |
|
389,360 |
|
|
$ |
6.16 |
|
|
|
1,879,630 |
|
|
$ |
6.37 |
|
|
|
2,258,349 |
|
|
$ 6.15 |
|
|
Weighted average remaining contractual life |
5.04 years |
|
|
|
|
|
|
5.02 years |
|
|
|
|
|
|
6.04 years |
|
|
|
|
|||
|
Options exercisable, end of period |
|
389,360 |
|
|
$ |
6.16 |
|
|
|
1,878,464 |
|
|
$ |
6.36 |
|
|
|
1,873,494 |
|
|
$ 6.29 |
|
|
Weighted average remaining contractual life |
5.04 years |
|
|
|
|
|
|
5.02 years |
|
|
|
|
|
|
5.75 years |
|
|
|
||||
As of April 30, 2016, there were 5,428,331 shares available for grant under the 2013 Incentive Stock Plan. We use our unissued share pool for all shares issued for options, restricted share awards, RSUs, PSUs, and Employee Stock Purchase Plan, or ESPP, issuances.
The aggregate intrinsic value of outstanding options as of April 30, 2016, 2015, and 2014 was $6.1 million, $16.1 million, and $20.8 million, respectively. The aggregate intrinsic value of outstanding options that were exercisable as of April 30, 2016, 2015, and 2014 was $6.1 million, $16.0 million, and $17.0 million, respectively. The aggregate intrinsic value of the options exercised for the years ended April 30, 2016, 2015, and 2014 was $27.2 million, $2.9 million, and $7.3, respectively. At April 30, 2016, there were no unrecognized compensation cost of outstanding options.
On September 26, 2011, our stockholders approved our 2011 ESPP, which authorized the sale of up to 6,000,000 shares of our common stock to employees. All options and rights to participate in our ESPP are nontransferable and subject to forfeiture in accordance with our ESPP guidelines. Our current ESPP will be implemented in a series of successive offering periods, each with a maximum duration of 12 months. If the fair market value, or FMV, per share of our common stock on any purchase date is less than the FMV per share on the start date of a 12-month offering period, then that offering period will automatically terminate, and a new 12-month offering period will begin on the next business day. Each offering period will begin on April 1 or October 1, as applicable, immediately following the end of the previous offering period. Payroll deductions will be on an after-tax basis, in an amount of not less than 1% and not more than 20% (or such greater percentage as the committee appointed to administer our ESPP may establish from time to time before the first day of an offering period) of a participant’s compensation on each payroll date. The option exercise price per share will equal 85% of the lower of the FMV on the first day of the offering period or the FMV on the exercise date. The maximum number of shares that a participant may purchase during any purchase period is 12,500 shares, or a total of $25,000 in shares, based on the FMV on the first day of the offering period. Our ESPP will remain in effect until the earliest of (a) the exercise date that participants become entitled to purchase a number of shares greater than the number of reserved shares available for purchase under our ESPP, (b) such date as is determined by our Board of Directors in its discretion, or (c) March 31, 2022. In the event of certain corporate transactions, each option outstanding under our ESPP will be assumed or an equivalent option will be substituted by the successor corporation or a parent or subsidiary of such successor corporation. During fiscal 2016, 2015, and 2014, 157,674, 161,456, and 176,204 shares, respectively, were purchased under our ESPP.
We measure the cost of employee services received in exchange for an award of an equity instrument based on the grant-date fair value of the award. We calculate the fair value of our stock options issued to employees using the Black-Scholes model at the time the options were granted. That amount is then amortized over the vesting period of the option. With our ESPP, fair value is determined at the beginning of the purchase period and amortized over the term of each exercise period.
F-24
SMITH & WESSON HOLDING CORPORATION AND SUBSIDIARIES
NOTES TO CONSOLIDATED FINANCIAL STATEMENTS — (Continued)
The following assumptions were used in valuing our ESPP purchases during the years ended April 30, 2016, 2015, and 2014:
|
|
For the Year Ended April 30, |
|
|||||||
|
|
2016 |
|
2015 |
|
|
2014 |
|
||
|
Risk-free interest rate |
0.19% |
|
0.07% |
|
|
|
0.08 |
% |
|
|
Expected term |
6 months |
|
6 months |
|
|
6 months |
|
||
|
Expected volatility |
40.9% |
|
|
38.2 |
% |
|
|
41.9 |
% |
|
Dividend yield |
0% |
|
0% |
|
|
|
0 |
% |
|
We estimate expected volatility using historical volatility for the expected term. The fair value of each stock option or ESPP purchase was estimated on the date of the grant using the Black-Scholes option pricing model (using the risk-free interest rate, expected term, expected volatility, and dividend yield variables, as noted in the above table). The total stock-based compensation expense, including stock options, purchases under our ESPP, and RSU and PSU awards, was $6.5 million, $5.8 million, and $8.2 million, for fiscal years 2016, 2015, and 2014, respectively.
The following table summarizes stock compensation expense by line item for the fiscal years ended April 30, 2016, 2015, and 2014 (in thousands):
|
|
For the Year Ended April 30, |
|
||||||||||||
|
|
|
|
2016 |
|
|
|
|
2015 |
|
|
|
|
2014 |
|
|
Cost of sales |
$ |
|
564 |
|
|
$ |
|
520 |
|
|
$ |
|
332 |
|
|
Research and development |
|
|
169 |
|
|
|
|
139 |
|
|
|
|
74 |
|
|
Selling and marketing |
|
|
494 |
|
|
|
|
379 |
|
|
|
|
225 |
|
|
General and administrative |
|
|
5,245 |
|
|
|
|
4,770 |
|
|
|
|
7,581 |
|
|
Total stock-based compensation |
$ |
|
6,472 |
|
|
$ |
|
5,808 |
|
|
$ |
|
8,212 |
|
We grant service-based RSUs to employees, consultants, and directors. The awards are made at no cost to the recipient. An RSU represents the right to acquire one share of our common stock and does not carry voting or dividend rights. Except in specific circumstances, RSU grants to employees generally vest over a period of three or four years with one-third or one-fourth of the units vesting, respectively, on each anniversary date of the grant date. The aggregate fair value of our RSU grants is amortized to compensation expense over the vesting period.
We grant PSUs with market conditions to our executive officers, and we grant PSUs without market-conditions to our employees who are not executive officers. At the time of grant, we calculate the fair value of our market-condition PSUs using the Monte-Carlo simulation. We incorporate the following variables into the valuation model:
|
|
|
For the Year Ended April 30, |
|
|||||||||||
|
|
|
|
2016 |
|
|
|
2015 |
|
|
|
2014 |
|
||
|
Grant date fair market value |
|
|
|
|
|
|
|
|
|
|
|
|
|
|
|
Smith & Wesson Holding Corporation |
$ |
|
21.93 |
|
|
$ |
|
14.90 |
|
|
$ |
15.21 |
|
|
|
Russell 2000 Index |
$ |
|
1,140.40 |
|
|
$ |
|
1,246.95 |
|
|
$ |
|
1,120.83 |
|
|
Volatility (a) |
|
|
|
|
|
|
|
|
|
|
|
|
|
|
|
Smith & Wesson Holding Corporation |
|
|
39.93 |
% |
|
|
|
44.51 |
% |
|
|
|
49.85 |
% |
|
Russell 2000 Index |
|
|
16.75 |
% |
|
|
|
15.76 |
% |
|
|
|
23.07 |
% |
|
Correlation coefficient (b) |
|
|
0.32 |
|
|
|
|
0.32 |
|
|
|
0.46 |
|
|
|
Risk-free interest rate (c) |
|
|
0.93 |
% |
|
|
|
0.91 |
% |
|
|
|
0.91 |
% |
|
Dividend yield (d) |
|
|
0 |
% |
|
|
|
0 |
% |
|
|
|
0 |
% |
|
|
|
(a) |
Expected volatility is calculated over the most recent period that represents the remaining term of the performance period as of the valuation date, or three years. |
|
(b) |
The correlation coefficient utilizes the same historical price data used to develop the volatility assumptions. |
|
(c) |
The risk-free interest rate is based on the yield of a zero-coupon U.S. Treasury bill, commensurate with the three-year performance period. |
|
(d) |
We do not expect to pay dividends in the foreseeable future. |
F-25
SMITH & WESSON HOLDING CORPORATION AND SUBSIDIARIES
NOTES TO CONSOLIDATED FINANCIAL STATEMENTS — (Continued)
The market-condition PSUs vest, and the fair value of such PSUs will be recognized, over the corresponding three-year performance period. Our market-condition PSUs have a maximum aggregate award equal to 200% of the target amount granted. The number of market-condition PSUs that may be earned depends upon the total stockholder return, or TSR, of our common stock compared with the TSR of the Russell 2000 Index, or RUT, over the three-year performance period. For our fiscal 2014 PSUs, our stock must outperform the RUT by 10% in order for the target award to vest. For our fiscal 2016 and 2015 PSUs, our stock must outperform the RUT by 5% in order for the target award to vest. In addition, there is a cap on the number of shares that can be earned under the fiscal 2016 and 2015 PSUs equal to six times the grant-date value of each award.
In certain circumstances, the vested awards will be delivered on the first anniversary of the applicable vesting date. We have applied a discount to the grant date fair value when determining the amount of compensation expense to be recorded for these RSUs and PSUs.
During the year ended April 30, 2016, we granted an aggregate of 137,775 market-condition PSUs to certain of our executive officers and 5,379 PSUs without market conditions to non-executive officer employees. We also granted 321,692 service-based RSUs during the year ended April 30, 2016, including 117,100 RSUs to certain of our executive officers, 36,379 RSUs to our directors, and 168,213 RSUs to non-executive officer employees. In addition, in connection with a 2012 grant, we vested 104,000 market-condition PSUs (i.e., the target amount granted), which achieved 173.3% of the maximum aggregate award possible resulting in awards totaling 180,231 shares to certain of our executive officers. Compensation expense recognized related to grants of RSUs and PSUs was $5.9 million for the fiscal year ended April 30, 2016.
During the fiscal year ended April 30, 2016, we canceled 66,185 service-based RSUs and 19,250 market-condition PSUs as a result of the service period condition not being met and delivered 430,768 shares of common stock to current employees under vested RSUs and PSUs with a total market value of $7.8 million.
During the year ended April 30, 2015, we granted 112,000 market-condition PSUs to certain of our executive officers. We also granted 554,933 service-based RSUs during the year ended April 30, 2015, including 125,000 RSUs to certain of our executive officers, 46,639 RSUs to our directors, and 379,433 RSUs to non-executive officer employees. In addition, in connection with a 2011 grant, we vested 46,600 market-condition PSUs (i.e., the target amount granted), which achieved the maximum aggregate award possible resulting in awards totaling 93,200 shares to certain of our executive officers and a former executive officer. Compensation expense recognized related to grants of RSUs and PSUs was $5.1 million for the fiscal year ended April 30, 2015.
During the fiscal year ended April 30, 2015, we canceled 57,752 service-based RSUs and 41,250 PSUs without market-conditions as a result of the service period condition not being met and delivered 433,266 shares of common stock to current employees under vested RSUs and PSUs with a total market value of $5.4 million.
During the fiscal year ended April 30, 2014, we granted 117,500 market-condition PSUs to certain of our executive officers. We also granted 565,556 service-based RSUs during the year ended April 30, 2014, including 351,400 RSUs to certain of our executive officers, 42,238 RSUs to our directors, 164,918 RSUs to non-executive officer employees, and 7,000 RSUs to consultants. In addition, we granted and vested 30,000 market-condition PSUs to an executive officer and a former executive officer in connection with a 2010 award that achieved the maximum aggregate award. Compensation expense recognized related to grants of RSUs and PSUs was $6.4 million for the fiscal year ended April 30, 2014.
During the fiscal year ended April 30, 2014, we cancelled 17,316 service-based RSUs and 9,000 PSUs without market-conditions as a result of the service period condition not being met and delivered 457,851 shares of common stock to current employees under vested RSUs and PSUs with a total market value of $5.7 million.
The grant date fair value of RSUs and PSUs that vested in fiscal 2016, 2015, and 2014 was $4.6 million, $4.0 million, and $4.0 million, respectively.
F-26
SMITH & WESSON HOLDING CORPORATION AND SUBSIDIARIES
NOTES TO CONSOLIDATED FINANCIAL STATEMENTS — (Continued)
A summary of activity in unvested RSUs and PSUs for fiscal years 2016, 2015, and 2014 is as follows:
|
|
For the Year Ended April 30, |
|
||||||||||||||||||||||
|
|
2016 |
|
|
2015 |
|
|
2014 |
|
||||||||||||||||
|
|
|
|
|
|
Weighted |
|
|
|
|
|
|
Weighted |
|
|
|
|
|
|
|
Weighted |
|
|||
|
|
Total # of |
|
|
Average |
|
|
Total # of |
|
|
Average |
|
|
Total # of |
|
|
|
Average |
|
||||||
|
|
Restricted |
|
|
Grant Date |
|
|
Restricted |
|
|
Grant Date |
|
|
Restricted |
|
|
|
Grant Date |
|
||||||
|
|
Stock Units |
|
|
Fair Value |
|
|
Stock Units |
|
|
Fair Value |
|
|
Stock Units |
|
|
|
Fair Value |
|
||||||
|
RSUs and PSUs outstanding, beginning of year |
|
1,190,879 |
|
|
$ |
12.45 |
|
|
|
1,015,475 |
|
|
$ |
10.56 |
|
|
|
781,586 |
|
|
$ |
$ |
8.42 |
|
|
Awarded |
|
541,077 |
|
|
|
17.72 |
|
|
|
709,672 |
|
|
|
11.82 |
|
|
|
718,056 |
|
|
|
|
11.87 |
|
|
Vested |
|
(430,768 |
) |
|
|
10.57 |
|
|
|
(433,266 |
) |
|
|
9.18 |
|
|
|
(457,851 |
) |
|
|
|
8.75 |
|
|
Forfeited |
|
(85,435 |
) |
|
|
10.94 |
|
|
|
(101,002 |
) |
|
|
11.93 |
|
|
|
(26,316 |
) |
|
|
|
8.88 |
|
|
RSUs and PSUs outstanding, end of period |
|
1,215,753 |
|
|
$ |
15.38 |
|
|
|
1,190,879 |
|
|
$ |
12.45 |
|
|
|
1,015,475 |
|
|
$ |
$ |
10.56 |
|
As of April 30, 2016, there was $9.0 million of unrecognized compensation cost related to unvested RSUs and PSUs. This cost is expected to be recognized over a weighted average remaining contractual term of 1.8 years.
16. Employer Sponsored Benefit Plans
Contributory Defined Investment Plan — We offer two contributory defined investment plans covering substantially all employees, subject to service requirements. Employees may contribute up to 100% of their annual pay, depending on the plan. We generally make discretionary matching contributions of up to 50% of the first 6% of employee contributions to the plan. We contributed $2.4 million, $2.3 million, and $1.9 million for the fiscal years ended April 30, 2016, 2015, and 2014, respectively.
Non-Contributory Profit Sharing Plan — We have a non-contributory profit sharing plan covering substantially all of our Springfield, Massachusetts and Houlton, Maine employees. Employees become eligible on May 1 following the completion of a full fiscal year of continuous service. Our contributions to the plan are discretionary. For fiscal 2016, we plan to contribute approximately $11.5 million, which has been recorded in general and administrative costs. We contributed $6.2 million and $11.1 million for the fiscal years ended April 30, 2015 and 2014, respectively. Contributions are funded after the fiscal year-end.
17. Income Taxes
Income tax expense from continuing operations consists of the following (in thousands):
|
|
For the Year Ended April 30, |
|
|
||||||||||||
|
|
2016 |
|
|
2015 |
|
|
2014 |
|
|
||||||
|
Current: |
|
|
|
|
|
|
|
|
|
|
|
|
|
|
|
|
Federal |
$ |
|
48,961 |
|
|
$ |
|
22,471 |
|
|
$ |
|
43,470 |
|
|
|
State |
|
|
6,622 |
|
|
|
|
4,188 |
|
|
|
|
6,167 |
|
|
|
Total current |
|
|
55,583 |
|
|
|
|
26,659 |
|
|
|
|
49,637 |
|
|
|
Deferred: |
|
|
|
|
|
|
|
|
|
|
|
|
|
|
|
|
Deferred federal |
|
|
(4,187 |
) |
|
|
|
2,274 |
|
|
|
|
(1,352 |
) |
|
|
Deferred state |
|
|
(261 |
) |
|
|
|
(28 |
) |
|
|
|
(190 |
) |
|
|
Total deferred |
|
|
(4,448 |
) |
|
|
|
2,246 |
|
|
|
|
(1,542 |
) |
|
|
Total income tax expense |
$ |
|
51,135 |
|
|
$ |
|
28,905 |
|
|
$ |
|
48,095 |
|
|
F-27
SMITH & WESSON HOLDING CORPORATION AND SUBSIDIARIES
NOTES TO CONSOLIDATED FINANCIAL STATEMENTS — (Continued)
The following table presents a reconciliation of the provision for income taxes from continuing operations at statutory rates to the provision in the consolidated financial statements (in thousands):
|
|
For the Year Ended April 30, |
|
|
||||||||||||
|
|
2016 |
|
|
2015 |
|
|
2014 |
|
|
||||||
|
Federal income taxes expected at 35% statutory rate |
$ |
|
50,783 |
|
|
$ |
|
27,556 |
|
|
$ |
|
47,853 |
|
|
|
State income taxes, less federal income tax benefit |
|
|
4,349 |
|
|
|
|
3,015 |
|
|
|
|
4,535 |
|
|
|
Employee Stock Purchase Plan |
|
|
108 |
|
|
|
|
82 |
|
|
|
|
77 |
|
|
|
Business meals and entertainment |
|
|
233 |
|
|
|
|
205 |
|
|
|
|
187 |
|
|
|
Domestic production activity deduction |
|
|
(4,414 |
) |
|
|
|
(2,462 |
) |
|
|
|
(4,325 |
) |
|
|
Research and development tax credit |
|
|
(215 |
) |
|
|
|
(100 |
) |
|
|
|
(100 |
) |
|
|
Change in uncertain tax positions |
|
|
(91 |
) |
|
|
— |
|
|
|
|
(265 |
) |
|
|
|
Other |
|
|
382 |
|
|
|
|
609 |
|
|
|
|
133 |
|
|
|
Total income tax expense |
$ |
|
51,135 |
|
|
$ |
|
28,905 |
|
|
$ |
|
48,095 |
|
|
Deferred tax assets (deferred tax liabilities) related to temporary differences are the following (in thousands):
|
|
For the Years Ended April 30, |
|
|
|||||||
|
|
2016 |
|
|
2015 |
|
|
||||
|
Current tax assets (liabilities): |
$ |
|
|
|
|
$ |
|
|
|
|
|
Inventories |
|
|
— |
|
|
|
|
9,587 |
|
|
|
Product liability |
|
|
— |
|
|
|
|
276 |
|
|
|
Accrued expenses, including compensation |
|
|
— |
|
|
|
|
2,934 |
|
|
|
Warranty reserve |
|
|
— |
|
|
|
|
2,449 |
|
|
|
Property taxes |
|
|
— |
|
|
|
|
(122 |
) |
|
|
Accrued promotions |
|
|
— |
|
|
|
|
1,497 |
|
|
|
Less valuation allowance |
|
|
— |
|
|
|
|
(510 |
) |
|
|
Other |
|
|
— |
|
|
|
|
262 |
|
|
|
Net deferred tax asset — current |
|
|
— |
|
|
|
|
16,373 |
|
|
|
|
|
|
|
|
|
|
|
|
|
|
|
Non-current tax assets (liabilities): |
|
|
|
|
|
|
|
|
|
|
|
Net operating loss carryforwards and tax credits |
|
|
2,712 |
|
|
|
|
2,809 |
|
|
|
Inventories |
|
|
8,789 |
|
|
|
|
— |
|
|
|
Accrued expenses, including compensation |
|
|
7,255 |
|
|
|
|
— |
|
|
|
Environmental reserves |
|
|
264 |
|
|
|
|
258 |
|
|
|
Product liability |
|
|
748 |
|
|
|
|
461 |
|
|
|
Accrued promotions |
|
|
2,463 |
|
|
|
|
— |
|
|
|
Workers' compensation |
|
|
1,082 |
|
|
|
|
991 |
|
|
|
Warranty reserve |
|
|
3,194 |
|
|
|
|
860 |
|
|
|
Stock-based compensation |
|
|
3,295 |
|
|
|
|
4,429 |
|
|
|
State bonus depreciation |
|
|
937 |
|
|
|
|
1,002 |
|
|
|
Property taxes |
|
|
(140 |
) |
|
|
|
— |
|
|
|
Property, plant, and equipment |
|
|
(27,006 |
) |
|
|
|
(25,612 |
) |
|
|
Intangible assets |
|
|
(14,289 |
) |
|
|
|
(17,083 |
) |
|
|
Pension |
|
|
123 |
|
|
|
|
91 |
|
|
|
Other |
|
|
973 |
|
|
|
|
— |
|
|
|
Less valuation allowance |
|
|
(2,561 |
) |
|
|
|
(2,111 |
) |
|
|
Net deferred tax liability — non-current |
|
|
(12,161 |
) |
|
|
|
(33,905 |
) |
|
|
Net deferred tax asset/(liability) — total |
$ |
|
(12,161 |
) |
|
$ |
|
(17,532 |
) |
|
We had federal net operating loss carryforwards amounting to $433,000 as of April 30, 2016, which expire in fiscal 2020. We obtained $8.2 million in additional loss carryforwards through our acquisition of SWSS on July 20, 2009, the majority of which was utilized in fiscal 2010. Utilization of the remaining losses is limited by Section 382 of the Internal Revenue Code to $108,000 in fiscal 2016 and for each taxable year thereafter. It is possible that future substantial changes in our ownership could occur that could result
F-28
SMITH & WESSON HOLDING CORPORATION AND SUBSIDIARIES
NOTES TO CONSOLIDATED FINANCIAL STATEMENTS — (Continued)
in additional ownership changes pursuant to Section 382 of the Internal Revenue Code. If such an ownership change were to occur, there could be an annual limitation on the remaining tax loss carryforward.
There were $16.8 million in state net operating loss carryforwards as of April 30, 2016 and 2015. The state net operating loss carryforwards will expire between April 30, 2025 and April 30, 2033. There were $2.9 million and $3.0 million of state tax credit carryforwards as of April 30, 2016 and 2015, respectively. The state tax credit carryforwards will expire between April 30, 2019 and April 30, 2025 or have no expiration date.
As of April 30, 2016, valuation allowances of $708,000 and $1.9 million were provided on our deferred tax assets for those state net operating loss carryforward, and state tax credits, respectively, that we do not anticipate using prior to their expiration. As of April 30, 2015, valuation allowances of $700,000 and $1.9 million were provided on our deferred tax assets for those state net operating loss carryforwards and state tax credits, respectively, that we do not anticipate using prior to their expiration. The increase in the valuation allowance on our deferred tax assets for state net operating losses and credits and other state deferred tax assets related mainly to Massachusetts Investment Tax Credits. No valuation allowances were provided on our deferred federal income tax assets as of April 30, 2016 or 2015, as we believe that it is more likely than not that all such assets will be realized. Recording a valuation allowance or reversing a valuation allowance could have a significant effect on our future results of operations and financial position. We are unaware of any recent or expected future changes in tax laws that would have a material impact on our financial statements.
At April 30, 2016, we did not have any gross tax-effected unrecognized tax benefits. As of April 30, 2015, we had gross tax-effected unrecognized tax benefits of $91,000, the entire amount of which, if recognized, would have favorably impacted the effective tax rate. Included in the unrecognized tax benefits at April 30, 2015 were $23,000 of accrued interest and penalties related to uncertain tax positions, which have been recorded in non-current liabilities.
A reconciliation of the beginning and ending amount of unrecognized tax benefits is as follows (in thousands):
|
|
April 30, |
|
|
|||||||
|
|
2016 |
|
|
2015 |
|
|
||||
|
Beginning balance |
$ |
|
91 |
|
|
$ |
|
84 |
|
|
|
Interest, penalties, and impact of state deductions on federal taxes |
|
|
— |
|
|
|
|
7 |
|
|
|
Lapse of statute of limitations |
|
|
(91 |
) |
|
|
— |
|
|
|
|
Ending balance |
$ |
|
— |
|
|
$ |
|
91 |
|
|
All of our unrecognized tax benefits were classified as current income tax liabilities and are recorded in other current liabilities because a payment of cash is anticipated within one year of the balance sheet date or the statute will expire within one year of the balance sheet date.
With limited exception, we are subject to U.S. federal, state, and local, or non-U.S. income tax audits by tax authorities for fiscal years subsequent to April 30, 2012.
18. Commitments and Contingencies
Litigation
We are a defendant in seven product liability cases and are aware of nine other product liability claims, primarily alleging defective product design, defective manufacturing, or failure to provide adequate warnings. In addition, we are a co-defendant in a case filed on August 27, 1999 by the city of Gary, Indiana against numerous firearm manufacturers, distributors, and dealers seeking to recover damages allegedly arising out of the misuse of firearms by third parties. We believe that the various allegations as described above are unfounded, and, in addition, that any accident and any results from them were due to negligence or misuse of the firearm by the claimant or a third party.
In addition, we are involved in lawsuits, claims, investigations, and proceedings, including commercial, environmental, and employment matters, which arise in the ordinary course of business.
The relief sought in individual cases primarily includes compensatory and, sometimes, punitive damages. Certain of the cases and claims seek unspecified compensatory or punitive damages. In others, compensatory damages sought may range from less than $75,000 to approximately $1.5 million. In our experience, initial demands do not generally bear a reasonable relationship to the facts
F-29
SMITH & WESSON HOLDING CORPORATION AND SUBSIDIARIES
NOTES TO CONSOLIDATED FINANCIAL STATEMENTS — (Continued)
and circumstances of a particular matter. We believe that our accruals for product liability cases and claims, as described below, are a reasonable quantitative measure of the cost to us of product liability cases and claims.
We are vigorously defending ourselves in the lawsuits to which we are subject. An unfavorable outcome or prolonged litigation could harm our business. Litigation of this nature also is expensive and time consuming and diverts the time and attention of our management.
We monitor the status of known claims and the related product liability accrual, which includes amounts for defense costs for asserted and unasserted claims. After consultation with litigation counsel and the review of the merit of each claim, we have concluded that we are unable to reasonably estimate the probability or the estimated range of reasonably possible losses related to material adverse judgments related to such claims and, therefore, we have not accrued for any such judgments. In the future, should we determine that a loss (or an additional loss in excess of our accrual) is at least reasonably possible and material, we would then disclose an estimate of the possible loss or range of loss, if such estimate could be made, or disclose that an estimate could not be made. We believe that we have provided adequate accruals for defense costs.
For the fiscal years ended April 30, 2016, 2015, and 2014, we paid $264,000, $252,000, and $1.0 million, respectively, in defense and administrative costs relative to product liability and municipal litigation. In addition, we spent an aggregate of $55,000, $177,000, and $460,000, respectively, in those fiscal years in settlement fees related to product liability cases.
We have recorded our liability for defense costs before consideration for reimbursement from insurance carriers. We have also recorded the amount due as reimbursement under existing policies from the insurance carriers as a receivable shown in other current assets and other assets. During the year ended April 30, 2016, we received a $1.8 million insurance recovery, which was recorded in general and administrative expenses, as a result of an insurance settlement agreement for partial reimbursement of defense costs we incurred in prior fiscal years related to our resolved government investigation.
In fiscal 2016, 2015, and 2014 we recorded expense of $299,000, $183,000, and $533,000, respectively, to recognize changes in our product liability and municipal litigation liability.
At this time, an estimated range of reasonably possible additional losses relating to unfavorable outcomes cannot be made.
Environmental Remediation
We are subject to numerous federal, state, and local laws that regulate both the health and safety of our workforce as well as our environmental liability, including, but not limited to, those regulations monitored by the Occupational Health and Safety Administration (OSHA), the National Fire Protection Association, and the Department of Public Health. Though not exhaustive, examples of applicable regulations include confined space safety, walking and working surfaces, machine guarding, and life safety.
We are required to comply with regulations that mitigate any release into the environment. These laws have require us to make significant expenditures of both a capital and expense nature. Several of the more significant federal laws applicable to our operations include the Clean Air Act, the Clean Water Act, the Comprehensive Environmental Response, Compensation and Liability Act, or CERCLA, and the Solid Waste Disposal Act, as amended by the Resource Conservation and Recovery Act.
We have in place programs and personnel to monitor compliance with various federal, state, and local environmental regulations. In the normal course of our manufacturing operations, we are subject to governmental proceedings and orders pertaining to waste disposal, air emissions, and water discharges into the environment. We fund our environmental costs through cash flows from operations. We believe that we are in compliance with applicable environmental regulations in all material respects.
We are required to remediate hazardous waste at our facilities. Currently, we own a designated site in Springfield, Massachusetts that contains two release areas, which are the focus of remediation projects as part of the Massachusetts Contingency Plan, or MCP. The MCP provides a structured environment for the voluntary remediation of regulated releases. We may be required to remove hazardous waste or remediate the alleged effects of hazardous substances on the environment associated with past disposal practices at sites not owned by us. We have received notice that we are a potentially responsible party from the Environmental Protection Agency and/or individual states under CERCLA or a state equivalent at two sites.
As of April 30, 2016 and 2015, respectively, we had recorded $694,000 and $675,000 of the environmental reserve in non-current liabilities. We have calculated the net present value of the environmental reserve to be equal to the carrying value of the liability recorded on our books. Our estimate of these costs is based upon currently enacted laws and regulations, currently available
F-30
SMITH & WESSON HOLDING CORPORATION AND SUBSIDIARIES
NOTES TO CONSOLIDATED FINANCIAL STATEMENTS — (Continued)
facts, experience in remediation efforts, existing technology, and the ability of other potentially responsible parties or contractually liable parties to pay the allocated portions of any environmental obligations.
When the available information is sufficient to estimate the amount of liability, that estimate has been used, when the information is only sufficient to establish a range of probable liability and no point within the range is more likely than any other, the lower end of the range has been used. We may not have insurance coverage for our environmental remediation costs. We have not recognized any gains from probable recoveries or other gain contingencies. The environmental reserve was calculated using undiscounted amounts based on independent environmental remediation reports obtained.
On May 5, 2014, we acquired substantially all of the net assets of TTPP. Under the asset purchase agreement, the former stockholder of TTPP indemnified us for losses arising from, among other things, environmental conditions related to its manufacturing activities. Of the purchase price, $3.0 million was placed in an escrow account, of which $250,000 million remains available. A portion of the remaining escrow account may be applied to environmental remediation at the manufacturing site in Deep River, Connecticut. We believe the likelihood of environmental remediation costs exceeding the amount available in escrow to be remote.
Based on information known to us, we do not expect current environmental regulations or environmental proceedings and claims to have a material adverse effect on our consolidated financial position, results of operations, or cash flows. However, it is not possible to predict with certainty the impact on us of future environmental compliance requirements or of the cost of resolution of future environmental health and safety proceedings and claims, in part because the scope of the remedies that may be required is not certain, liability under federal environmental laws is joint and several in nature, and environmental laws and regulations are subject to modification and changes in interpretation. There can be no assurance that additional or changing environmental regulation will not become more burdensome in the future and that any such development would not have a material adverse effect on our company.
Contracts
Employment Agreements — We have employment, severance, and change of control agreements with certain officers and managers.
Other Agreements — We have distribution agreements with various third parties in the ordinary course of business.
Rental Leases
We lease office and/or manufacturing space in Scottsdale, Arizona; Somersworth, New Hampshire; Deep River, Connecticut; and Columbia, Missouri under operating leases which expire on February 28, 2018; June 30, 2018; May 4, 2024; and April 30, 2023, respectively. We also lease machinery, photocopiers, and vehicles for our national sales force with various expiration dates.
As of April 30, 2016, the lease commitments were as follows (in thousands):
|
For the Year Ended April 30, |
|
Amount |
|
|
||
|
|
|
|||||
|
2017 |
|
$ |
|
2,122 |
|
|
|
2018 |
|
|
|
2,070 |
|
|
|
2019 |
|
|
|
1,923 |
|
|
|
2020 |
|
|
|
1,926 |
|
|
|
2021 |
|
|
|
1,833 |
|
|
|
Thereafter |
|
|
|
4,569 |
|
|
|
|
|
$ |
|
14,443 |
|
|
Rent expense in the fiscal years ended April 30, 2016, 2015, and 2014 was $4.1 million, $3.3 million, and $2.2 million, respectively.
F-31
SMITH & WESSON HOLDING CORPORATION AND SUBSIDIARIES
NOTES TO CONSOLIDATED FINANCIAL STATEMENTS — (Continued)
19. Quarterly Financial Information (Unaudited)
The following table summarizes quarterly financial results in fiscal 2016 and 2015. In our opinion, all adjustments necessary to present fairly the information for such quarters have been reflected (in thousands, except per share data):
|
|
For the Year Ended April 30, 2016 |
|
|
||||||||||||||||||||||
|
|
First |
|
|
Second |
|
|
Third |
|
|
Fourth |
|
|
Full |
|
|
||||||||||
|
|
Quarter |
|
|
Quarter |
|
|
Quarter |
|
|
Quarter |
|
|
Year |
|
|
||||||||||
|
Net sales |
$ |
|
147,763 |
|
|
$ |
|
143,242 |
|
|
$ |
|
210,786 |
|
|
$ |
|
221,117 |
|
|
$ |
|
722,908 |
|
|
|
Gross profit |
|
|
58,870 |
|
|
|
|
56,215 |
|
|
|
|
86,658 |
|
|
|
|
92,069 |
|
|
|
|
293,812 |
|
|
|
Income from continuing operations, net of tax |
|
|
14,412 |
|
|
|
|
12,466 |
|
|
|
|
31,434 |
|
|
|
|
35,646 |
|
|
|
|
93,958 |
|
|
|
Net income |
$ |
|
14,412 |
|
|
$ |
|
12,466 |
|
|
$ |
|
31,434 |
|
|
$ |
|
35,646 |
|
|
$ |
|
93,958 |
|
|
|
Per common share (a) |
|
|
|
|
|
|
|
|
|
|
|
|
|
|
|
|
|
|
|
|
|
|
|
|
|
|
Basic - continuing operations |
$ |
|
0.27 |
|
|
$ |
|
0.23 |
|
|
$ |
|
0.57 |
|
|
$ |
|
0.64 |
|
|
$ |
|
1.72 |
|
|
|
Diluted - continuing operations |
$ |
|
0.26 |
|
|
$ |
|
0.22 |
|
|
$ |
|
0.56 |
|
|
$ |
|
0.63 |
|
|
$ |
|
1.68 |
|
|
|
Basic - total |
$ |
|
0.27 |
|
|
$ |
|
0.23 |
|
|
$ |
|
0.57 |
|
|
$ |
|
0.64 |
|
|
$ |
|
1.72 |
|
|
|
Diluted - total |
$ |
|
0.26 |
|
|
$ |
|
0.22 |
|
|
$ |
|
0.56 |
|
|
$ |
|
0.63 |
|
|
$ |
|
1.68 |
|
|
|
Market price (low-high) |
$ |
14.62-17.04 |
|
|
$ |
14.71-19.22 |
|
|
$ |
17.05-26.54 |
|
|
$ |
20.40-30.44 |
|
|
$ |
14.62-30.44 |
|
|
|||||
|
|
For the Year Ended April 30, 2015 |
|
|
||||||||||||||||||||||
|
|
First |
|
|
Second |
|
|
Third |
|
|
Fourth |
|
|
Full |
|
|
||||||||||
|
|
Quarter |
|
|
Quarter |
|
|
Quarter |
|
|
Quarter |
|
|
Year |
|
|
||||||||||
|
Net sales |
$ |
|
131,869 |
|
|
$ |
|
108,446 |
|
|
$ |
|
130,550 |
|
|
$ |
|
180,997 |
|
|
$ |
|
551,862 |
|
|
|
Gross profit |
|
|
49,118 |
|
|
|
|
34,840 |
|
|
|
|
43,824 |
|
|
|
|
67,144 |
|
|
|
|
194,926 |
|
|
|
Income from continuing operations, net of tax |
|
|
14,618 |
|
|
|
|
5,091 |
|
|
|
|
8,178 |
|
|
|
|
21,940 |
|
|
|
|
49,827 |
|
|
|
Loss from discontinued operations, net of tax |
|
|
(62 |
) |
|
|
|
(41 |
) |
|
|
|
(57 |
) |
|
|
|
(54 |
) |
|
|
|
(214 |
) |
|
|
Net income |
$ |
|
14,556 |
|
|
$ |
|
5,050 |
|
|
$ |
|
8,121 |
|
|
$ |
|
21,886 |
|
|
$ |
|
49,613 |
|
|
|
Per common share (a) |
|
|
|
|
|
|
|
|
|
|
|
|
|
|
|
|
|
|
|
|
|
|
|
|
|
|
Basic - continuing operations |
$ |
|
0.27 |
|
|
$ |
|
0.10 |
|
|
$ |
|
0.15 |
|
|
$ |
|
0.41 |
|
|
$ |
|
0.92 |
|
|
|
Diluted - continuing operations |
$ |
|
0.26 |
|
|
$ |
|
0.09 |
|
|
$ |
|
0.15 |
|
|
$ |
|
0.40 |
|
|
$ |
|
0.90 |
|
|
|
Basic - total |
$ |
|
0.27 |
|
|
$ |
|
0.09 |
|
|
$ |
|
0.15 |
|
|
$ |
|
0.41 |
|
|
$ |
|
0.92 |
|
|
|
Diluted - total |
$ |
|
0.26 |
|
|
$ |
|
0.09 |
|
|
$ |
|
0.15 |
|
|
$ |
|
0.40 |
|
|
$ |
|
0.90 |
|
|
|
Market price (low-high) |
$ |
12.32-17.28 |
|
|
$ |
9.03-13.43 |
|
|
$ |
9.22-12.68 |
|
|
$ |
12.16-15.30 |
|
|
$ |
9.03-17.28 |
|
|
|||||
|
|
(a) |
Basic and diluted earnings per share may not equal the sum of the quarterly basic and diluted earnings per share due to rounding. |
20. Segment Reporting
Subsequent to the BTI Acquisition, we began reporting our results of operations in two segments: firearms and accessories. The firearm segment has been determined to be a single operating segment and reporting segment based on our reliance on production metrics such as gross margin per unit produced, units produced per day, incoming orders per day, and revenue produced by trade channel, all of which are particular to the firearm segment. We evaluate our accessories products by a measurement of incoming orders per day, sales by customers, and gross margin by product line.
The firearm segment consists of products and services manufactured and sold from our Springfield, Massachusetts; Houlton, Maine; and Deep River, Connecticut facilities, which includes firearms, handcuffs, and other related products sold through a distribution chain and direct sales to consumers and international, state, and federal governments. The accessories segment consists of shooting, hunting, and outdoor accessories developed and marketed from our Columbia, Missouri facility. Operating costs are reported based on the activities performed within each segment.
Segment assets are those directly used in or clearly allocable to an operating segment’s operations. Total assets for our firearm segment as of April 30, 2016 were $458.1 million. Included in the assets of our firearm segment are intangible assets totaling $2.9 million; property, plant, and equipment totaling $132.3 million; and goodwill totaling $13.8 million. Total assets for our accessories segment as of April 30, 2016 were $161.4 million. Included in the assets of our accessories segment are intangible assets totaling $60.0 million; property, plant, and equipment totaling $3.1 million; and goodwill totaling $62.6 million.
F-32
SMITH & WESSON HOLDING CORPORATION AND SUBSIDIARIES
NOTES TO CONSOLIDATED FINANCIAL STATEMENTS — (Continued)
Results by business segment are presented in the following table for the years ended April 30, 2016 and 2015 (in thousands):
|
|
|
For the Year Ended April 30, 2016 |
|
|||||||||||||||||||||
|
|
|
Firearms |
|
|
|
Accessories |
|
|
|
Corporate |
|
|
|
Intersegment Eliminations |
|
|
|
Total |
|
|||||
|
Revenue from external customers |
|
$ |
657,618 |
|
|
|
$ |
65,290 |
|
|
|
$ — |
|
|
|
$ — |
|
|
|
$ |
722,908 |
|
||
|
Intersegment revenue |
|
|
1,821 |
|
|
|
|
743 |
|
|
|
|
— |
|
|
|
|
(2,564 |
) |
|
|
|
— |
|
|
Total net sales |
|
|
659,439 |
|
|
|
|
66,033 |
|
|
|
|
— |
|
|
|
|
(2,564 |
) |
|
|
|
722,908 |
|
|
Cost of sales |
|
|
398,550 |
|
|
|
|
33,104 |
|
|
|
|
— |
|
|
|
|
(2,558 |
) |
|
|
|
429,096 |
|
|
Gross margin |
|
|
260,889 |
|
|
|
|
32,929 |
|
|
|
|
— |
|
|
|
|
(6 |
) |
|
|
|
293,812 |
|
|
Operating income |
|
|
154,851 |
|
|
|
|
2,026 |
|
(b) |
|
|
(17,201 |
) |
(a) |
|
|
18,967 |
|
|
|
|
158,643 |
|
|
Income tax expense |
|
|
58,103 |
|
|
|
|
1,006 |
|
|
|
|
(7,974 |
) |
|
|
|
— |
|
|
|
|
51,135 |
|
|
|
|
For the Year Ended April 30, 2015 |
|
|||||||||||||||||||||
|
|
|
Firearms |
|
|
|
Accessories |
|
(c) |
|
Corporate |
|
|
|
Intersegment Eliminations |
|
|
|
Total |
|
|||||
|
Revenue from external customers |
|
$ |
531,222 |
|
|
|
$ |
20,640 |
|
|
|
$ — |
|
|
|
$ — |
|
|
|
$ |
551,862 |
|
||
|
Intersegment revenue |
|
|
— |
|
|
|
|
— |
|
|
|
|
— |
|
|
|
|
— |
|
|
|
|
— |
|
|
Total net sales |
|
|
531,222 |
|
|
|
|
20,640 |
|
|
|
|
— |
|
|
|
|
— |
|
|
|
|
551,862 |
|
|
Cost of sales |
|
|
342,663 |
|
|
|
|
14,273 |
|
(d) |
|
|
— |
|
|
|
|
— |
|
|
|
|
356,936 |
|
|
Gross margin |
|
|
188,559 |
|
|
|
|
6,367 |
|
|
|
|
— |
|
|
|
|
— |
|
|
|
|
194,926 |
|
|
Operating income |
|
|
91,788 |
|
|
|
|
(3,505 |
) |
(e) |
|
|
(13,695 |
) |
(a) |
|
|
15,040 |
|
|
|
|
89,628 |
|
|
Income tax expense |
|
|
35,427 |
|
|
|
|
(1,133 |
) |
|
|
|
(5,389 |
) |
|
|
|
— |
|
|
|
|
28,905 |
|
_________________
(a) For the year ended April 30, 2016, we allocated all of corporate overhead expenses, such as general and administrative expenses and other corporate-level expenses on the basis of each segment’s revenue to total company revenue, to both our firearm and accessories segments. For the year ended April 30, 2015, segment information herein has been restated from that previously presented to allocate corporate overhead expenses on the same basis. Corporate overhead expenses were not previously allocated for the year ended April 30, 2015 due to the timing of the BTI Acquisition.
(b) Amount includes $9.9 million for the year ended April 30, 2016 of amortization of intangible assets identified as a result of the BTI Acquisition.
(c) For the year ended April 30, 2015, results of operations include activity for the period subsequent to the BTI Acquisition.
(d) Amount includes $4.2 million of additional cost of goods sold from the fair value step-up in inventory at the date of the BTI Acquisition.
(e) Amount includes $3.6 million for the year ended April 30, 2015 of amortization of intangible assets identified as a result of the BTI Acquisition.
F-33
SMITH & WESSON HOLDING CORPORATION AND SUBSIDIARIES
VALUATION AND QUALIFYING ACCOUNTS
For the Years Ended April 30, 2016, 2015, and 2014
|
|
|
|
|
Additions |
|
|
|
|
|
|
|
|||||||||||||
|
|
|
|
|
Charged to |
|
|
Charged to |
|
|
|
|
|
|
|
||||||||||
|
|
Balance at |
|
|
Costs and |
|
|
Other |
|
|
|
|
|
Balance at |
|
||||||||||
|
|
May 1, |
|
|
Expenses |
|
|
Accounts |
|
|
Deductions |
|
|
April 30, |
|
||||||||||
|
2016 |
|
|
|
|
|
|
|
|
|
|
|
|
|
|
|
|
|
|
|
|
|
|
|
|
|
Allowance for doubtful accounts |
$ |
|
722 |
|
|
$ |
|
5 |
|
(1) |
$ |
— |
|
|
$ |
|
(47 |
) |
|
$ |
|
680 |
|
|
|
Deferred tax valuation allowance |
|
|
2,621 |
|
|
|
|
(60 |
) |
|
|
— |
|
|
|
— |
|
|
|
|
2,561 |
|
||
|
2015 |
|
|
|
|
|
|
|
|
|
|
|
|
|
|
|
|
|
|
|
|
|
|
|
|
|
Allowance for doubtful accounts |
$ |
|
844 |
|
|
$ |
|
(122 |
) |
|
$ |
|
127 |
|
(2) |
$ |
|
(127 |
) |
|
$ |
|
722 |
|
|
Deferred tax valuation allowance |
|
|
2,418 |
|
|
|
|
203 |
|
|
|
— |
|
|
|
— |
|
|
|
|
2,621 |
|
||
|
2014 |
|
|
|
|
|
|
|
|
|
|
|
|
|
|
|
|
|
|
|
|
|
|
|
|
|
Allowance for doubtful accounts |
$ |
|
1,128 |
|
|
$ |
|
(214 |
) |
|
$ |
— |
|
|
$ |
|
(70 |
) |
|
$ |
|
844 |
|
|
|
Deferred tax valuation allowance |
|
|
2,458 |
|
|
|
|
(40 |
) |
|
|
— |
|
|
|
— |
|
|
|
|
2,418 |
|
||
(1) Amount does not include $506,000 Charged to Costs and Expenses related notes receivable.
(2) Increase in fiscal 2015 valuation accounts represents acquired balances related to the DRP and BTI Acquisitions.
F-34