Attached files
| file | filename |
|---|---|
| EX-99.1 - EX-99.1 - PAR PACIFIC HOLDINGS, INC. | d210986dex991.htm |
| 8-K - FORM 8-K - PAR PACIFIC HOLDINGS, INC. | d210986d8k.htm |

Wyoming Acquisition Overview June 2016 Exhibit 99.2
Forward-Looking Statements / Disclaimers The information contained in this presentation has been prepared to assist you in making your own evaluation of the company and does not purport to contain all of the information you may consider important. Any estimates or projections with respect to future performance have been provided to assist you in your evaluation but should not be relied upon as an accurate representation of future results. Certain statements, estimates and financial information contained in this presentation constitute forward-‐ looking statements. Such forward-looking statements involve known and unknown risks and uncertainties that could cause actual events or results to differ materially from the results implied or expressed in such forward-‐ looking statements. While presented with numerical specificity, certain forward-looking statements are based (1) upon assumptions that are inherently subject to significant business, economic, regulatory, environmental, seasonal and competitive uncertainties, contingencies and risks including, without limitation, our ability to consummate, successfully integrate, and realize the anticipated synergies and other benefits of the Wyoming Refining acquisition, the anticipated financial and operating results of Wyoming Refining and the effect on our financial results, including our estimates for adjusted EBITDA and monetization of our NOL asset, maintain adequate liquidity, realize the potential benefit of our net operating loss tax carryforwards, obtain sufficient debt and equity financings, capital costs, well production performance, operating costs, commodity pricing, differentials or crack spreads, realize the potential benefits of our supply and offtake agreements, assumptions inherent in a sum-of-the-parts valuation, realize the benefit of our investment in Laramie Energy, LLC, assumptions related to our investment in Laramie Energy, LLC, our ability to meet environmental and regulatory requirements without additional capital expenditures, our acquisition integration strategy, and our ability to complete the Hawaii refinery turnaround and increase throughput and profitability, our ability to evaluate and pursue strategic and growth opportunities, our estimates of 2016 on-island sales volume, our estimates related to capital expenditures and certain other financial measures, and other known and unknown risks (all of which are difficult to predict and many of which are beyond the company's control) some of which are further discussed in the company’s periodic and other filings with the SEC and (2) upon assumptions with respect to future business decisions that are subject to change. There can be no assurance that the results implied or expressed in such forward-looking statements or the underlying assumptions will be realized and that actual results of operations or future events will not be materially different from the results implied or expressed in such forward-looking statements. Under no circumstances should the inclusion of the forward-looking statements be regarded as a representation, undertaking, warranty or prediction by the company or any other person with respect to the accuracy thereof or the accuracy of the underlying assumptions, or that the company will achieve or is likely to achieve any particular results. The forward-looking statements are made as of the date hereof and the company disclaims any intent or obligation to update publicly or to revise any of the forward-looking statements, whether as a result of new information, future events or otherwise, except as may be required by applicable law. Recipients are cautioned that forward-looking statements are not guarantees of future performance and, accordingly, recipients are expressly cautioned not to put undue reliance on forward-looking statements due to the inherent uncertainty therein. This presentation contains non-GAAP financial measures, such as Adjusted EBITDA and cash flows, including certain key statistics and estimates. Please see the Appendix for the definitions and reconciliations of the non-GAAP financial measures that are based on reconcilable historical information. This Wyoming Acquisition Overview does not constitute an offer of any securities for sale. Any securities that may be offered pursuant to the financing referenced above may not be offered or sold in the United States absent registration or an applicable exemption from registration requirements.
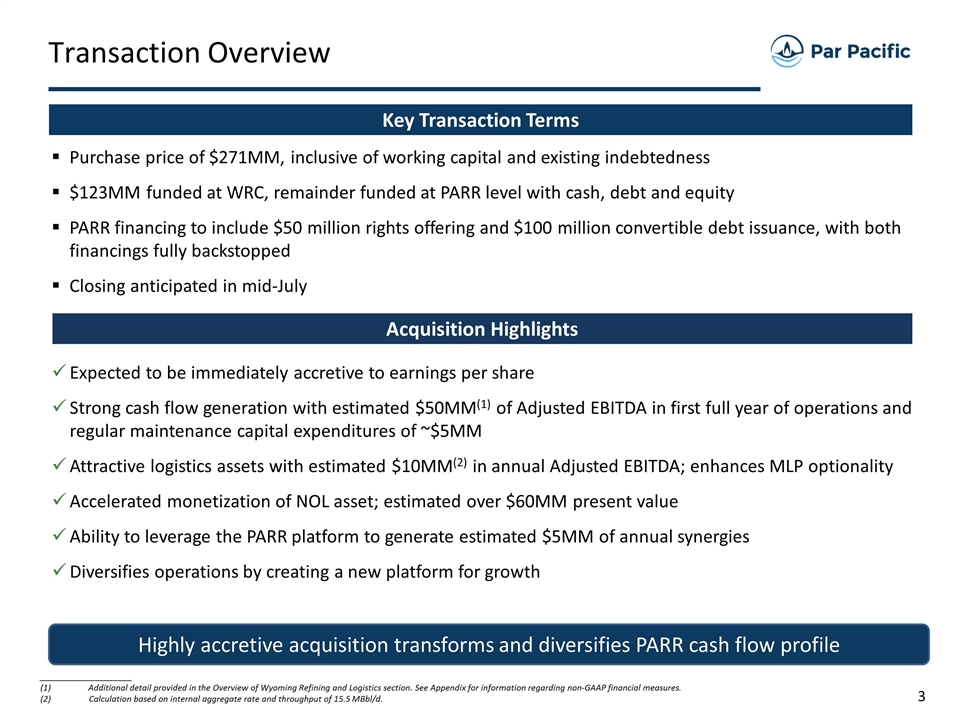
Transaction Overview Acquisition Highlights Key Transaction Terms Purchase price of $271MM, inclusive of working capital and existing indebtedness $123MM funded at WRC, remainder funded at PARR level with cash, debt and equity PARR financing to include $50 million rights offering and $100 million convertible debt issuance, with both financings fully backstopped Closing anticipated in mid-July Expected to be immediately accretive to earnings per share Strong cash flow generation with estimated $50MM(1) of Adjusted EBITDA in first full year of operations and regular maintenance capital expenditures of ~$5MM Attractive logistics assets with estimated $10MM(2) in annual Adjusted EBITDA; enhances MLP optionality Accelerated monetization of NOL asset; estimated over $60MM present value Ability to leverage the PARR platform to generate estimated $5MM of annual synergies Diversifies operations by creating a new platform for growth Highly accretive acquisition transforms and diversifies PARR cash flow profile ____________________ Additional detail provided in the Overview of Wyoming Refining and Logistics section. See Appendix for information regarding non-GAAP financial measures. Calculation based on internal aggregate rate and throughput of 15.5 MBbl/d.
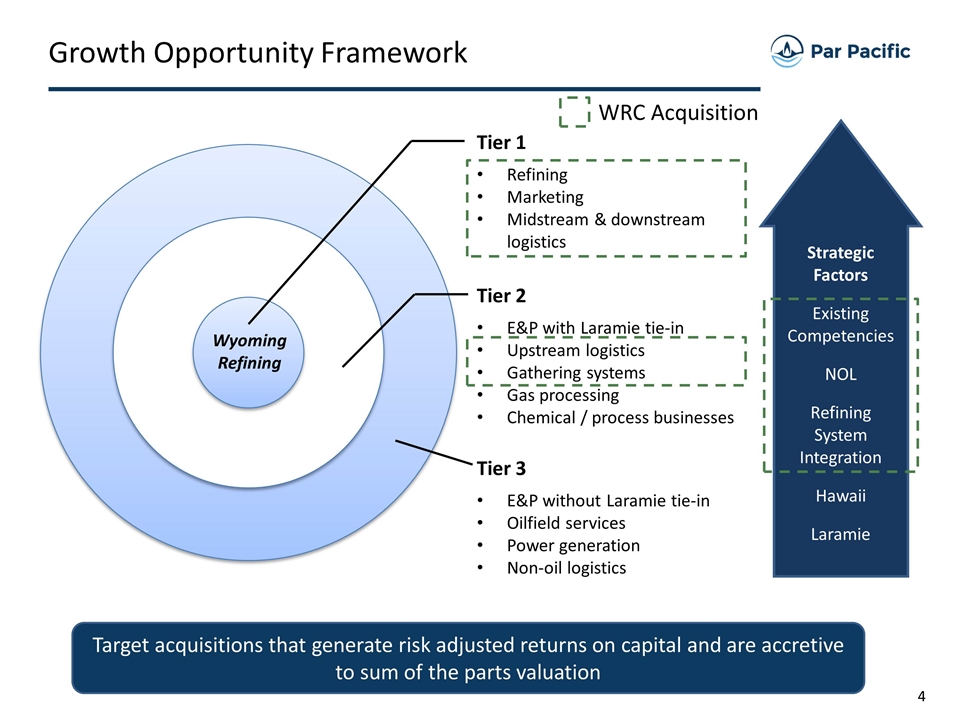
Growth Opportunity Framework Tier 1 Refining Marketing Midstream & downstream logistics Tier 2 E&P with Laramie tie-in Upstream logistics Gathering systems Gas processing Chemical / process businesses Tier 3 E&P without Laramie tie-in Oilfield services Power generation Non-oil logistics Strategic Factors Existing Competencies NOL Refining System Integration Hawaii Laramie Target acquisitions that generate risk adjusted returns on capital and are accretive to sum of the parts valuation Wyoming Refining WRC Acquisition
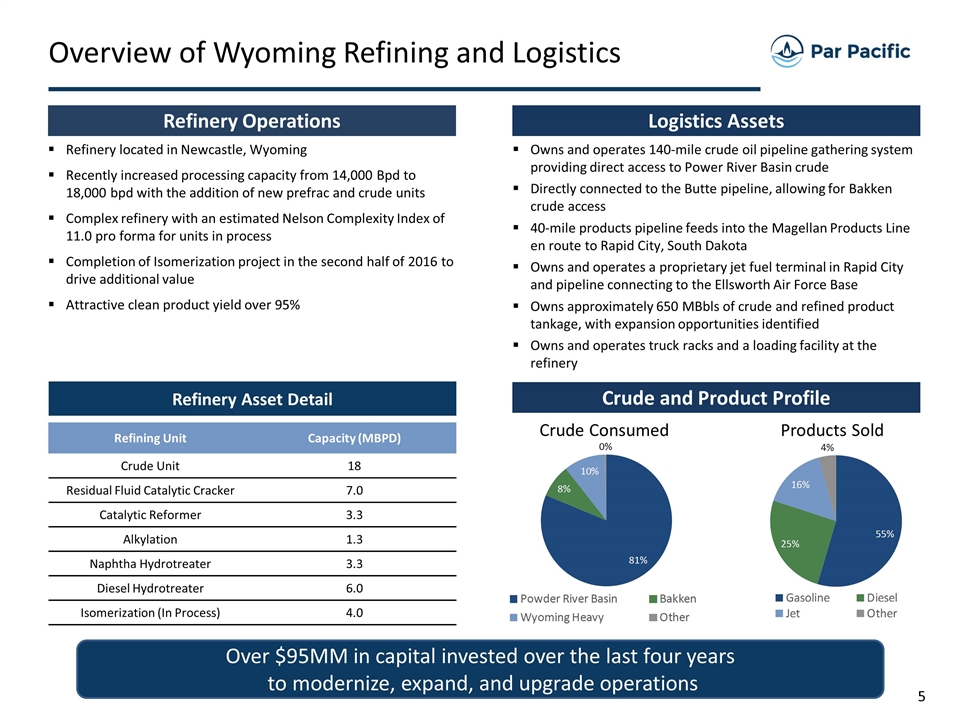
Overview of Wyoming Refining and Logistics Refinery Operations Logistics Assets Crude and Product Profile Refinery Asset Detail Refining Unit Capacity (MBPD) Crude Unit 18 Residual Fluid Catalytic Cracker 7.0 Catalytic Reformer 3.3 Alkylation 1.3 Naphtha Hydrotreater 3.3 Diesel Hydrotreater 6.0 Isomerization (In Process) 4.0 Crude Consumed Products Sold Refinery located in Newcastle, Wyoming Recently increased processing capacity from 14,000 Bpd to 18,000 bpd with the addition of new prefrac and crude units Complex refinery with an estimated Nelson Complexity Index of 11.0 pro forma for units in process Completion of Isomerization project in the second half of 2016 to drive additional value Attractive clean product yield over 95% Owns and operates 140-mile crude oil pipeline gathering system providing direct access to Power River Basin crude Directly connected to the Butte pipeline, allowing for Bakken crude access 40-mile products pipeline feeds into the Magellan Products Line en route to Rapid City, South Dakota Owns and operates a proprietary jet fuel terminal in Rapid City and pipeline connecting to the Ellsworth Air Force Base Owns approximately 650 MBbls of crude and refined product tankage, with expansion opportunities identified Owns and operates truck racks and a loading facility at the refinery Over $95MM in capital invested over the last four years to modernize, expand, and upgrade operations
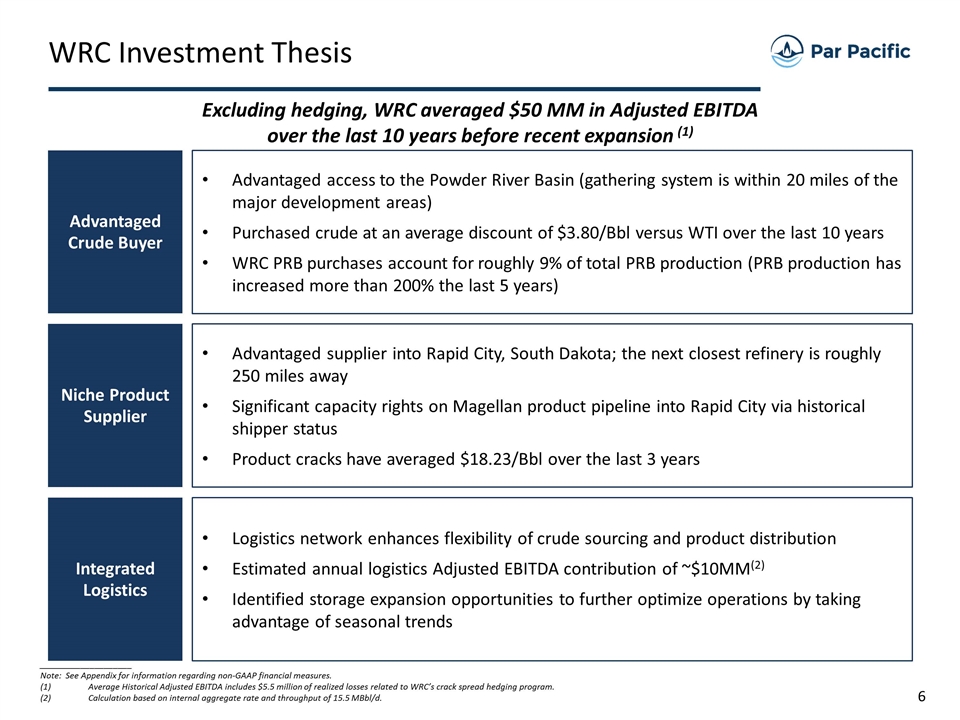
WRC Investment Thesis Niche Product Supplier Advantaged supplier into Rapid City, South Dakota; the next closest refinery is roughly 250 miles away Significant capacity rights on Magellan product pipeline into Rapid City via historical shipper status Product cracks have averaged $18.23/Bbl over the last 3 years Excluding hedging, WRC averaged $50 MM in Adjusted EBITDA over the last 10 years before recent expansion (1) Integrated Logistics Logistics network enhances flexibility of crude sourcing and product distribution Estimated annual logistics Adjusted EBITDA contribution of ~$10MM(2) Identified storage expansion opportunities to further optimize operations by taking advantage of seasonal trends Advantaged Crude Buyer Advantaged access to the Powder River Basin (gathering system is within 20 miles of the major development areas) Purchased crude at an average discount of $3.80/Bbl versus WTI over the last 10 years WRC PRB purchases account for roughly 9% of total PRB production (PRB production has increased more than 200% the last 5 years) ____________________ Note: See Appendix for information regarding non-GAAP financial measures. Average Historical Adjusted EBITDA includes $5.5 million of realized losses related to WRC’s crack spread hedging program. Calculation based on internal aggregate rate and throughput of 15.5 MBbl/d.
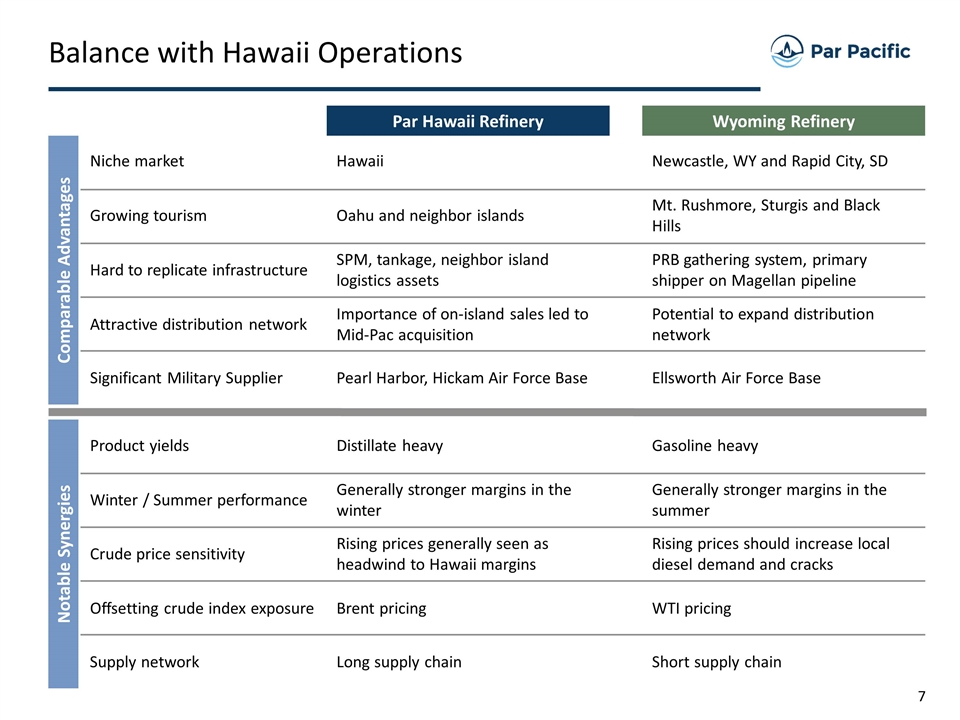
Balance with Hawaii Operations Comparable Advantages Notable Synergies Niche market Growing tourism Hard to replicate infrastructure Attractive distribution network Product yields Winter / Summer performance Crude price sensitivity Offsetting crude index exposure Par Hawaii Refinery Wyoming Refinery Hawaii Oahu and neighbor islands SPM, tankage, neighbor island logistics assets Importance of on-island sales led to Mid-Pac acquisition Distillate heavy Generally stronger margins in the winter Rising prices generally seen as headwind to Hawaii margins Brent pricing Long supply chain Supply network Newcastle, WY and Rapid City, SD Mt. Rushmore, Sturgis and Black Hills PRB gathering system, primary shipper on Magellan pipeline Potential to expand distribution network Gasoline heavy Generally stronger margins in the summer Rising prices should increase local diesel demand and cracks WTI pricing Short supply chain Significant Military Supplier Pearl Harbor, Hickam Air Force Base Ellsworth Air Force Base
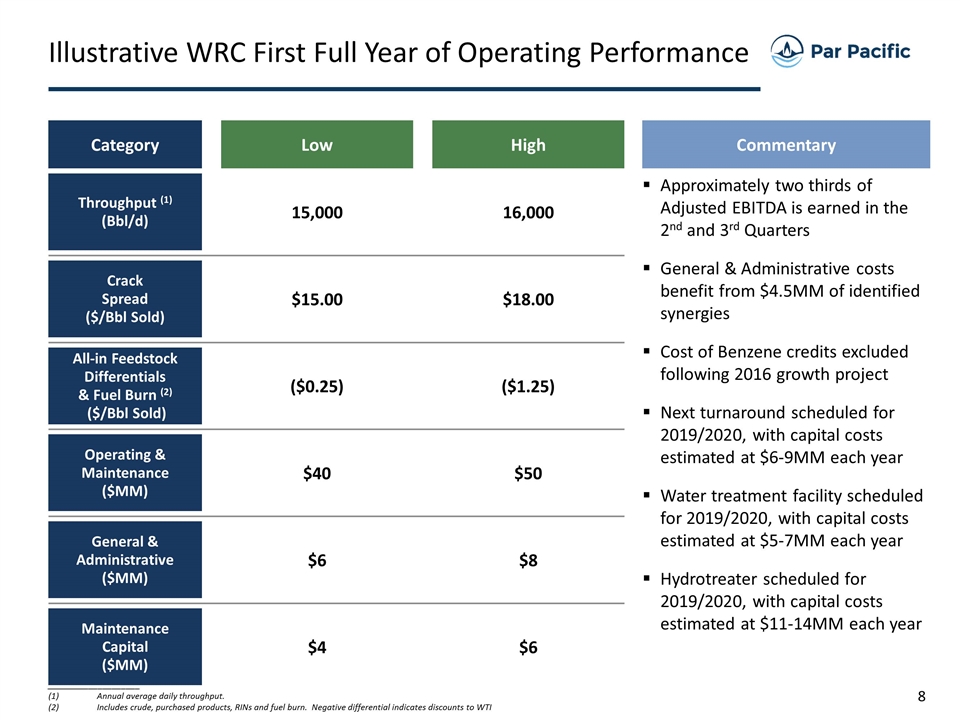
Illustrative WRC First Full Year of Operating Performance Category Low Throughput (1) (Bbl/d) 15,000 Approximately two thirds of Adjusted EBITDA is earned in the 2nd and 3rd Quarters General & Administrative costs benefit from $4.5MM of identified synergies Cost of Benzene credits excluded following 2016 growth project Next turnaround scheduled for 2019/2020, with capital costs estimated at $6-9MM each year Water treatment facility scheduled for 2019/2020, with capital costs estimated at $5-7MM each year Hydrotreater scheduled for 2019/2020, with capital costs estimated at $11-14MM each year High All-in Feedstock Differentials & Fuel Burn (2) ($/Bbl Sold) Crack Spread ($/Bbl Sold) Operating & Maintenance ($MM) General & Administrative ($MM) Maintenance Capital ($MM) Commentary 16,000 $15.00 $18.00 ($0.25) ($1.25) $40 $50 $6 $8 $4 $6 ____________________ Annual average daily throughput. Includes crude, purchased products, RINs and fuel burn. Negative differential indicates discounts to WTI
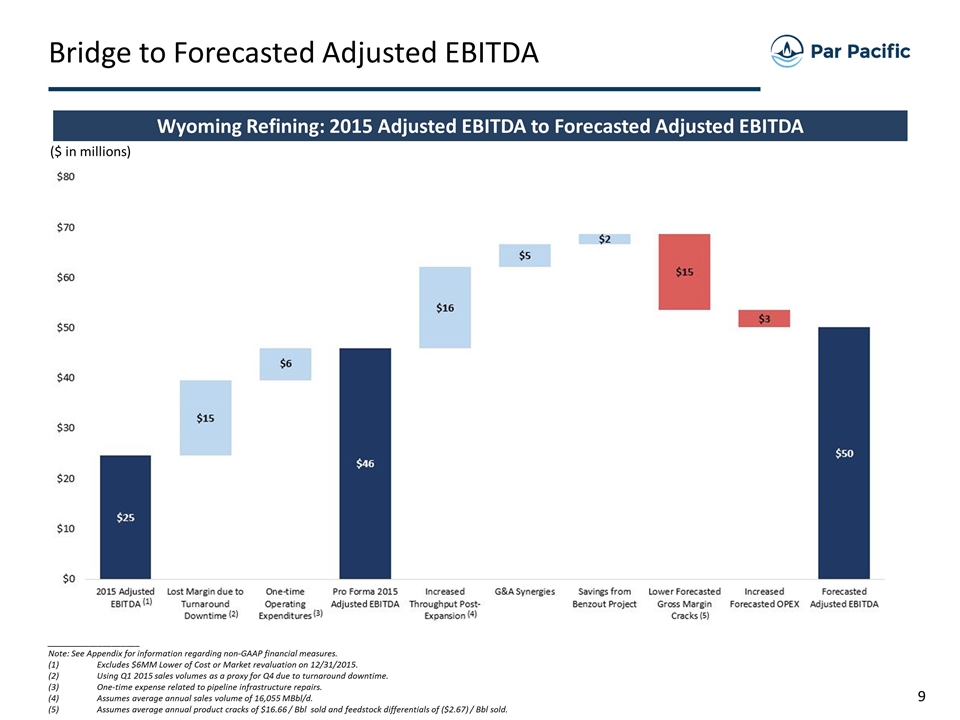
Bridge to Forecasted Adjusted EBITDA ____________________ Note: See Appendix for information regarding non-GAAP financial measures. Excludes $6MM Lower of Cost or Market revaluation on 12/31/2015. Using Q1 2015 sales volumes as a proxy for Q4 due to turnaround downtime. One-time expense related to pipeline infrastructure repairs. Assumes average annual sales volume of 16,055 MBbl/d. Assumes average annual product cracks of $16.66 / Bbl sold and feedstock differentials of ($2.67) / Bbl sold. ($ in millions) Wyoming Refining: 2015 Adjusted EBITDA to Forecasted Adjusted EBITDA
Laramie Update
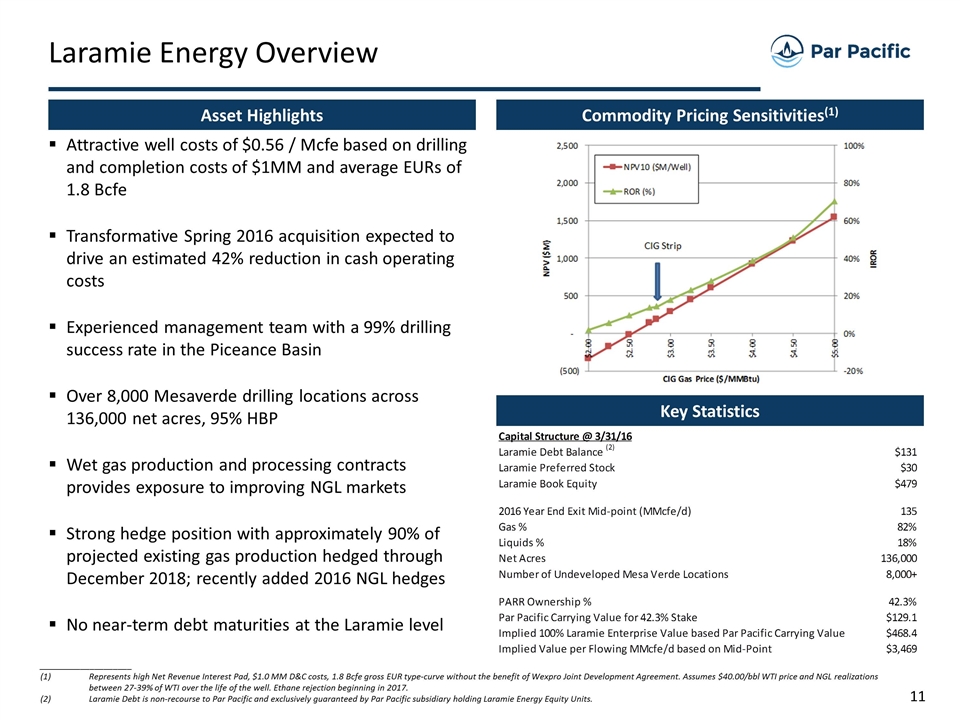
Attractive well costs of $0.56 / Mcfe based on drilling and completion costs of $1MM and average EURs of 1.8 Bcfe Transformative Spring 2016 acquisition expected to drive an estimated 42% reduction in cash operating costs Experienced management team with a 99% drilling success rate in the Piceance Basin Over 8,000 Mesaverde drilling locations across 136,000 net acres, 95% HBP Wet gas production and processing contracts provides exposure to improving NGL markets Strong hedge position with approximately 90% of projected existing gas production hedged through December 2018; recently added 2016 NGL hedges No near-term debt maturities at the Laramie level Asset Highlights Laramie Energy Overview Commodity Pricing Sensitivities(1) ____________________ Represents high Net Revenue Interest Pad, $1.0 MM D&C costs, 1.8 Bcfe gross EUR type-curve without the benefit of Wexpro Joint Development Agreement. Assumes $40.00/bbl WTI price and NGL realizations between 27-39% of WTI over the life of the well. Ethane rejection beginning in 2017. Laramie Debt is non-recourse to Par Pacific and exclusively guaranteed by Par Pacific subsidiary holding Laramie Energy Equity Units. Key Statistics
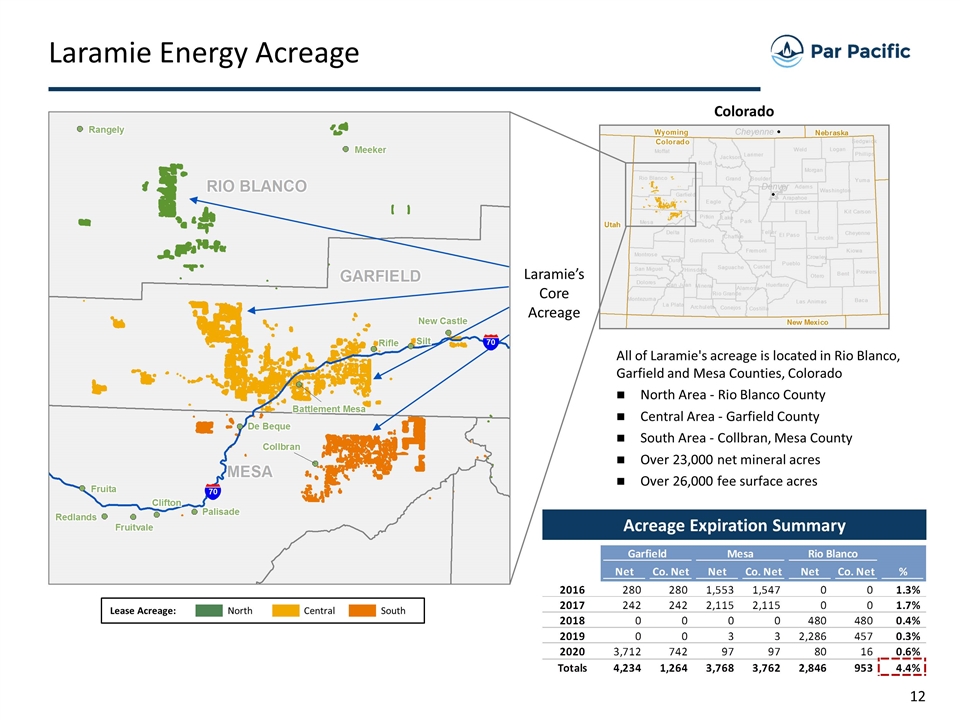
Laramie Energy Acreage Colorado All of Laramie's acreage is located in Rio Blanco, Garfield and Mesa Counties, Colorado North Area - Rio Blanco County Central Area - Garfield County South Area - Collbran, Mesa County Over 23,000 net mineral acres Over 26,000 fee surface acres Laramie’s Core Acreage North Central South Lease Acreage: 70 70 Acreage Expiration Summary
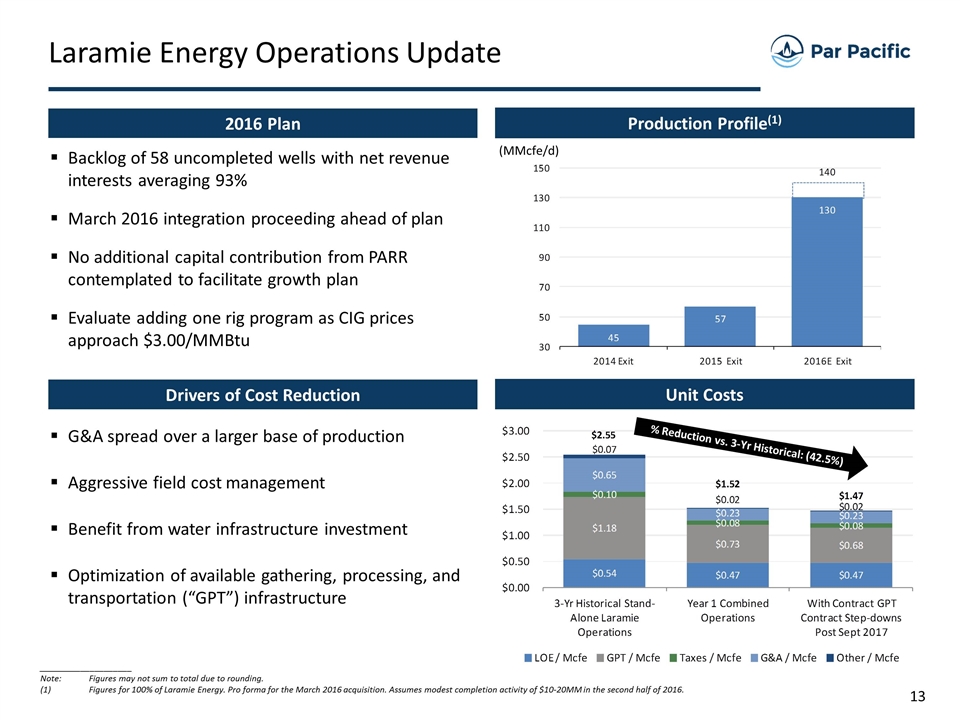
Backlog of 58 uncompleted wells with net revenue interests averaging 93% March 2016 integration proceeding ahead of plan No additional capital contribution from PARR contemplated to facilitate growth plan Evaluate adding one rig program as CIG prices approach $3.00/MMBtu 2016 Plan Laramie Energy Operations Update ____________________ Note:Figures may not sum to total due to rounding. Figures for 100% of Laramie Energy. Pro forma for the March 2016 acquisition. Assumes modest completion activity of $10-20MM in the second half of 2016. Production Profile(1) (MMcfe/d) Drivers of Cost Reduction Unit Costs G&A spread over a larger base of production Aggressive field cost management Benefit from water infrastructure investment Optimization of available gathering, processing, and transportation (“GPT”) infrastructure % Reduction vs. 3-Yr Historical: (42.5%)
Contact Information Par Pacific Holdings, Inc. (NYSE MKT: PARR) 800 Gessner Road, Suite 875 Houston, TX 77024 (281) 899-4800 www.parpacific.com Christine Thorp Director, Investor Relations cthorp@parpacific.com (832) 916-3396
Appendix
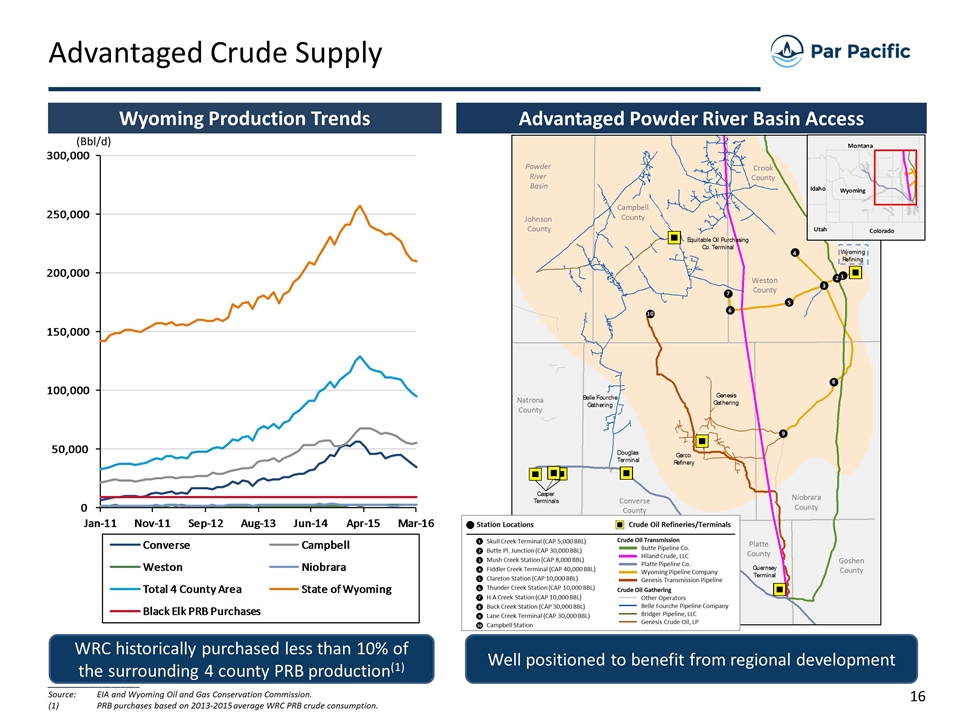
Wyoming Production Trends Advantaged Crude Supply ____________________ Source:EIA and Wyoming Oil and Gas Conservation Commission. (1)PRB purchases based on 2013-2015 average WRC PRB crude consumption. WRC historically purchased less than 10% of the surrounding 4 county PRB production(1) (Bbl/d) Well positioned to benefit from regional development Skull Creek Terminal (CAP 5,000 BBL) Butte Pl. Junction (CAP 30,000 BBL) Mush Creek Station (CAP 8,000 BBL) Fiddler Creek Terminal (CAP 40,000 BBL) Clareton Station (CAP 10,000 BBL) Thunder Creek Station (CAP 10,000 BBL) H A Creek Station (CAP 10,000 BBL) Buck Creek Station (CAP 30,000 BBL) Lane Creek Terminal (CAP 30,000 BBL) Campbell Station 1 2 3 4 5 6 7 8 9 10 Crude Oil Transmission Butte Pipeline Co. Hiland Crude, LLC Platte Pipeline Co. Wyoming Pipeline Company Genesis Transmission Pipeline Crude Oil Gathering Other Operators Belle Fourche Pipeline Company Bridger Pipeline, LLC Genesis Crude Oil, LP Station Locations Crude Oil Refineries/Terminals Advantaged Powder River Basin Access
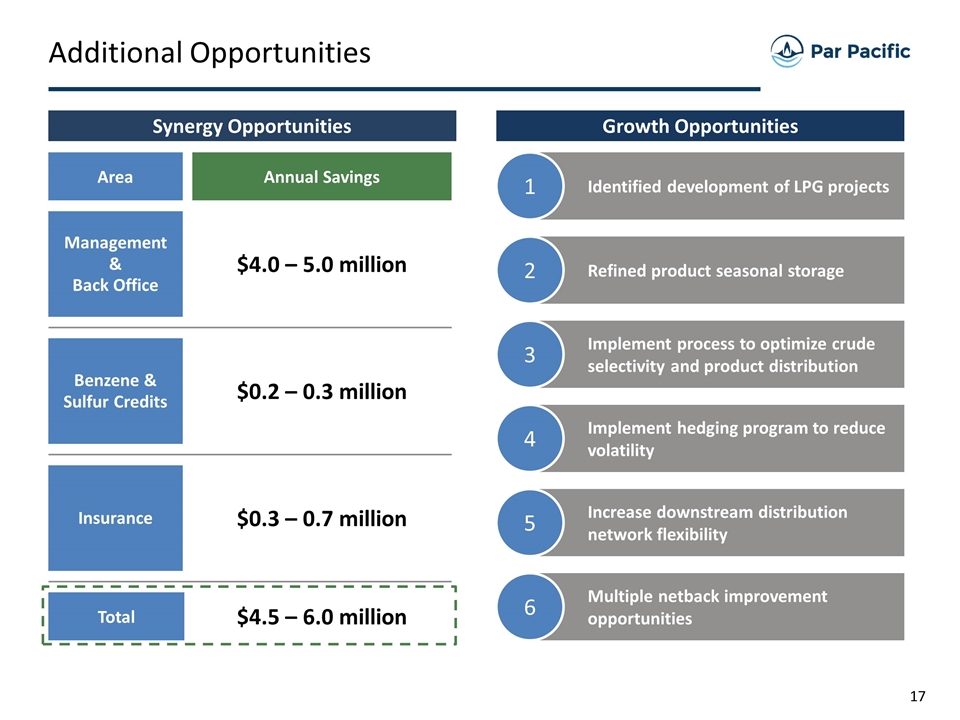
Synergy Opportunities Growth Opportunities Additional Opportunities Area Annual Savings Management & Back Office Benzene & Sulfur Credits Insurance Total $4.0 – 5.0 million $0.2 – 0.3 million $0.3 – 0.7 million $4.5 – 6.0 million Identified development of LPG projects 1 Refined product seasonal storage 2 Implement process to optimize crude selectivity and product distribution 3 Implement hedging program to reduce volatility 4 Increase downstream distribution network flexibility 5 Multiple netback improvement opportunities 6
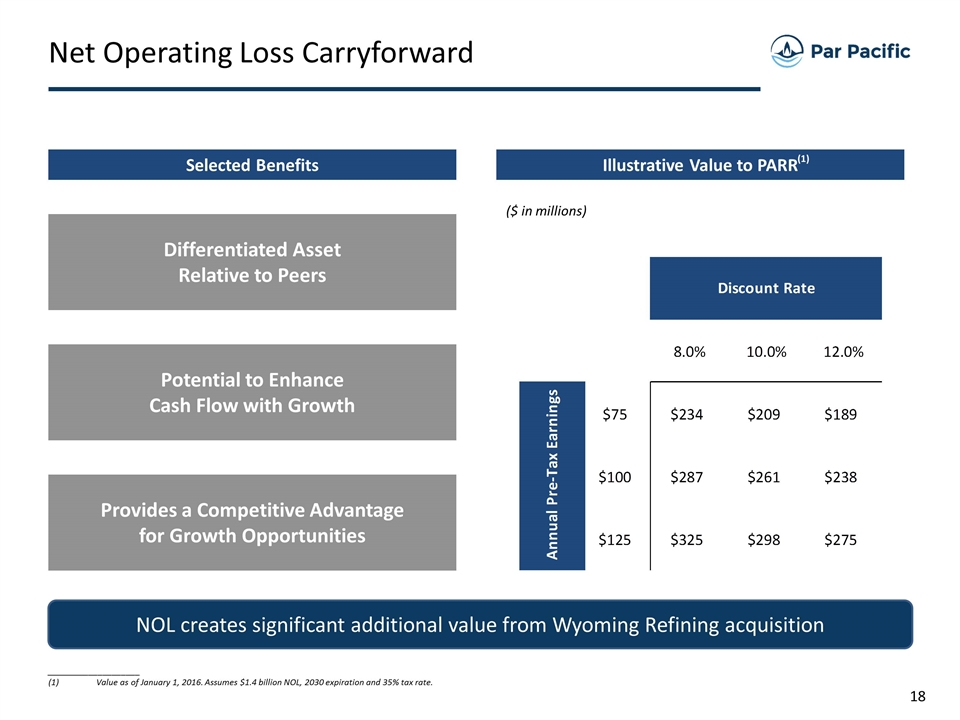
Net Operating Loss Carryforward Differentiated Asset Relative to Peers Potential to Enhance Cash Flow with Growth Provides a Competitive Advantage for Growth Opportunities NOL creates significant additional value from Wyoming Refining acquisition Selected Benefits Illustrative Value to PARR ($ in millions) (1) ____________________ Value as of January 1, 2016. Assumes $1.4 billion NOL, 2030 expiration and 35% tax rate.
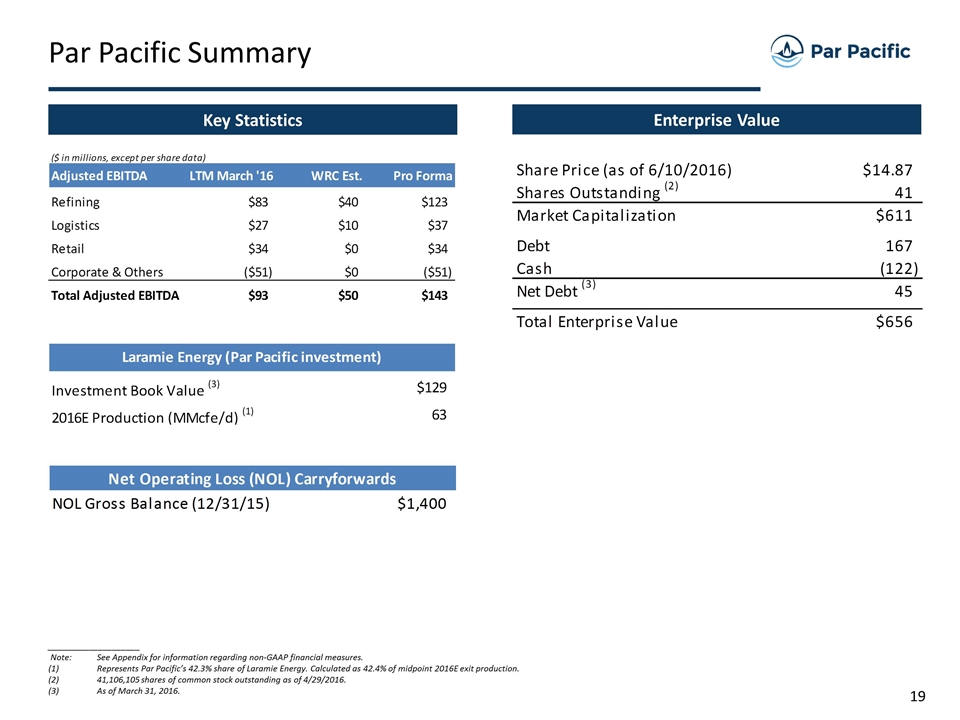
Par Pacific Summary Enterprise Value Key Statistics ____________________ Note:See Appendix for information regarding non-GAAP financial measures. Represents Par Pacific’s 42.3% share of Laramie Energy. Calculated as 42.4% of midpoint 2016E exit production. 41,106,105 shares of common stock outstanding as of 4/29/2016. As of March 31, 2016.
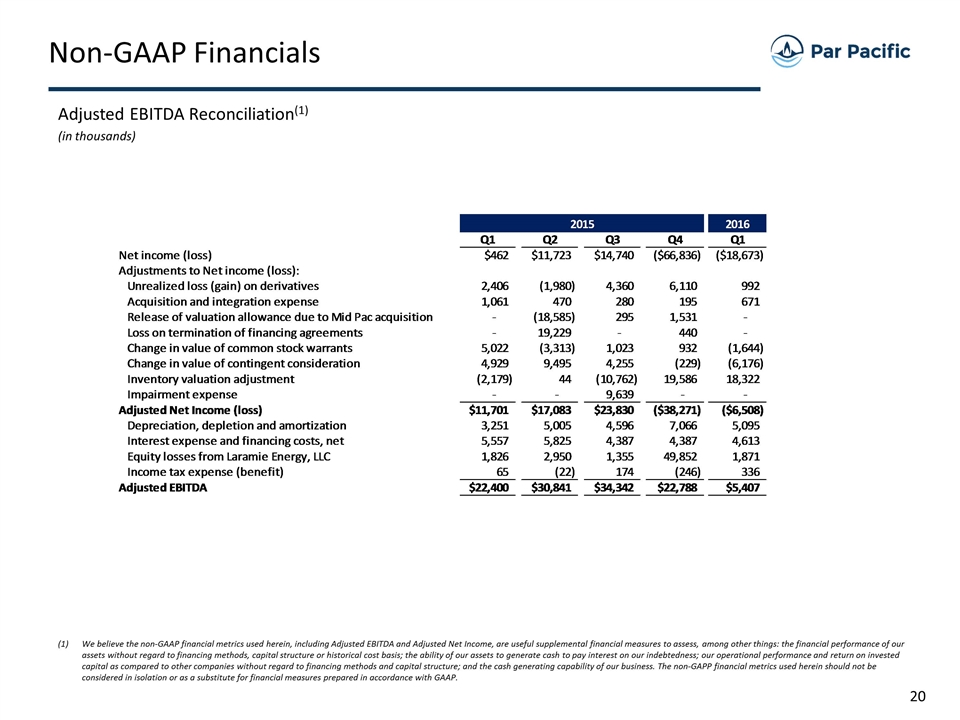
Non-GAAP Financials Adjusted EBITDA Reconciliation(1) (in thousands) (1) We believe the non-GAAP financial metrics used herein, including Adjusted EBITDA and Adjusted Net Income, are useful supplemental financial measures to assess, among other things: the financial performance of our assets without regard to financing methods, capital structure or historical cost basis; the ability of our assets to generate cash to pay interest on our indebtedness; our operational performance and return on invested capital as compared to other companies without regard to financing methods and capital structure; and the cash generating capability of our business. The non-GAPP financial metrics used herein should not be considered in isolation or as a substitute for financial measures prepared in accordance with GAAP. Company Company's Share of Laramie Energy reserves Total PV-10* $1,766 $,170,599 $,172,365 Present Value of future income taxes discounted at 10% 0 0 0 Standardized measure of discounted future net cash flows $1,766 $,170,599 $,172,365 1 2 3 4 FY 2014 1 2 Adj. EBITDA -9.0839999999999996 -18.965 -28.332000000000001 47.173999999999999 -9.2070000000000007 22.401512574765391 30.840369227433907 2015 2016 Interest -1.1379999999999999 -0.88900000000000023 -1.3209999999999997 -1.1779999999999999 -4.5259999999999998 -0.41499999999999998 -0.80900000000000005 Q2 2014 Q3 2014 Q4 2014 Q1 Q2 Q3 Q4 Q1 Capital Expenditures -2.0179999999999998 -3.891 -0.81700000000000017 -7.5740000000000007 -14.3 -4.7469999999999999 -5.1260000000000003 Net income (loss) $,-24,700 $,-39,456 $31,660 $462 $11,723 $14,740 $,-66,836 $,-18,673 Adjustments to Net income (loss): Cash Flow 0 0 0 0 -23.744999999999997 38.422000000000004 0 Unrealized loss (gain) on derivatives 0 0 -,698 2,406 -1,980 4,360 6,110 992 Acquisition and integration expense 2,400 3,856 2,561 1,061 470 280 195 671 Release of valuation allowance due to Mid Pac acquisition 0 ,-18,585 295 1,531 0 Loss on termination of financing agreements 0 19,229 0 440 0 Change in value of common stock warrants -,100 -2,401 -,315 5,022 -3,313 1,023 932 -1,644 Change in value of contingent consideration -2,300 -,996 2,909 4,929 9,495 4,255 -,229 -6,176 Inventory valuation adjustment -2,179 44 ,-10,762 19,586 18,322 Impairment expense 0 0 9,639 0 0 Adjusted Net Income (loss) $,-24,700 $,-38,997 $38,561 $11,701 $17,083 $23,830 $,-38,271 $-6,508 Depreciation, depletion and amortization 3,300 3,918 4,628 3,251 5,005 4,596 7,066 5,095 Interest expense and financing costs, net 3,400 7,076 5,803 5,557 5,825 4,387 4,387 4,613 Equity losses from Laramie Energy, LLC -,800 -,835 -1,475 1,826 2,950 1,355 49,852 1,871 Income tax expense (benefit) -,150 -,342 65 -22 174 -,246 336 Adjusted EBITDA $,-18,800 $,-28,988 $47,175 $22,400 $30,841 $34,342 $22,788 $5,407 Other cash flow data: Cash Interest -,889.23 -1,320.9999999999998 -1,178 -,415 -,809 -3,000 -2,667 -2,667 Cash Capital Expenditures -3,891 -,817.23 -7,574.9 -4,747 -5,126 -5,984 -6,488 ,-22,345
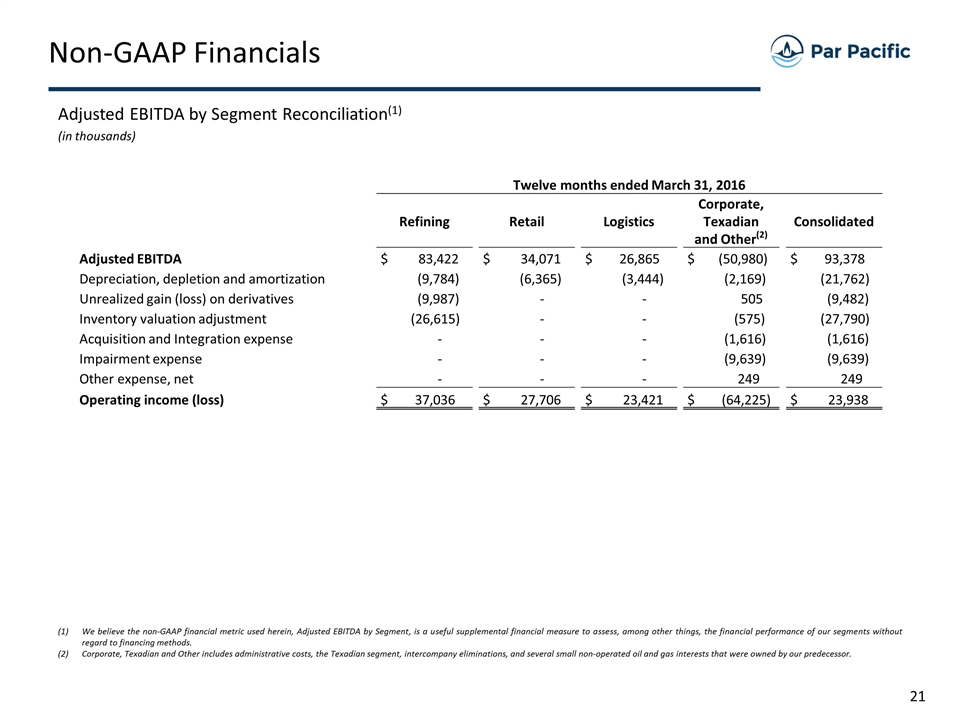
Non-GAAP Financials Adjusted EBITDA by Segment Reconciliation(1) (in thousands) We believe the non-GAAP financial metric used herein, Adjusted EBITDA by Segment, is a useful supplemental financial measure to assess, among other things, the financial performance of our segments without regard to financing methods. Corporate, Texadian and Other includes administrative costs, the Texadian segment, intercompany eliminations, and several small non-operated oil and gas interests that were owned by our predecessor. Twelve months ended March 31, 2016 Refining Retail Logistics Corporate, Texadian and Other(2) Consolidated Adjusted EBITDA $ 83,422 $ 34,071 $ 26,865 $ (50,980) $ 93,378 Depreciation, depletion and amortization (9,784) (6,365) (3,444) (2,169) (21,762) Unrealized gain (loss) on derivatives (9,987) - - 505 (9,482) Inventory valuation adjustment (26,615) - - (575) (27,790) Acquisition and Integration expense - - - (1,616) (1,616) Impairment expense - - - (9,639) (9,639) Other expense, net - - - 249 249 Operating income (loss) $ 37,036 $ 27,706 $ 23,421 $ (64,225) $ 23,938
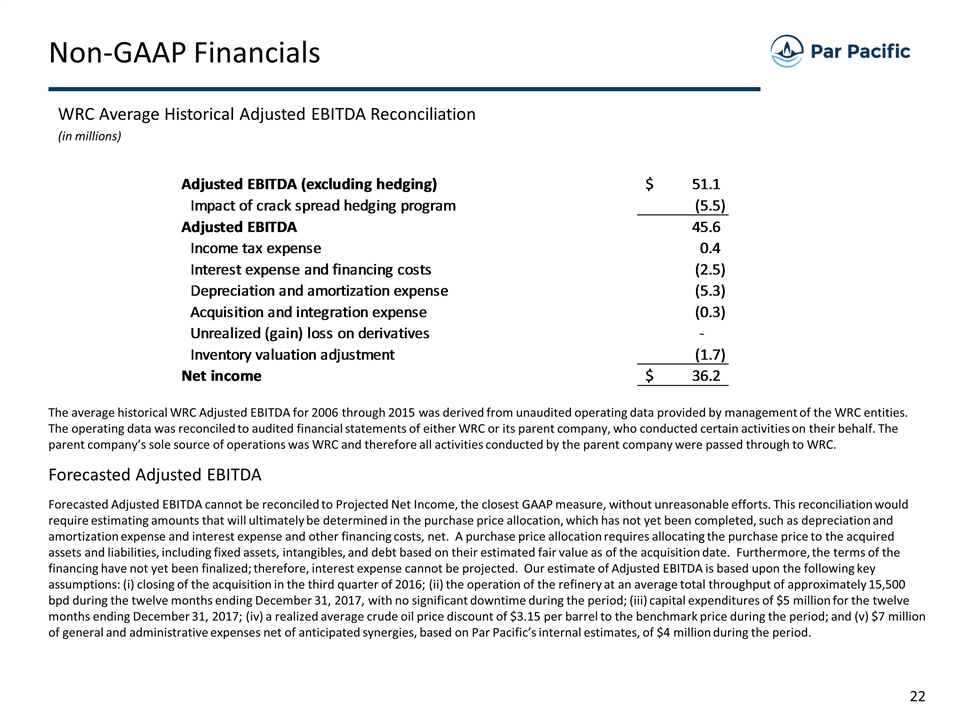
Non-GAAP Financials WRC Average Historical Adjusted EBITDA Reconciliation (in millions) The average historical WRC Adjusted EBITDA for 2006 through 2015 was derived from unaudited operating data provided by management of the WRC entities. The operating data was reconciled to audited financial statements of either WRC or its parent company, who conducted certain activities on their behalf. The parent company’s sole source of operations was WRC and therefore all activities conducted by the parent company were passed through to WRC. Forecasted Adjusted EBITDA Forecasted Adjusted EBITDA cannot be reconciled to Projected Net Income, the closest GAAP measure, without unreasonable efforts. This reconciliation would require estimating amounts that will ultimately be determined in the purchase price allocation, which has not yet been completed, such as depreciation and amortization expense and interest expense and other financing costs, net. A purchase price allocation requires allocating the purchase price to the acquired assets and liabilities, including fixed assets, intangibles, and debt based on their estimated fair value as of the acquisition date. Furthermore, the terms of the financing have not yet been finalized; therefore, interest expense cannot be projected. Our estimate of Adjusted EBITDA is based upon the following key assumptions: (i) closing of the acquisition in the third quarter of 2016; (ii) the operation of the refinery at an average total throughput of approximately 15,500 bpd during the twelve months ending December 31, 2017, with no significant downtime during the period; (iii) capital expenditures of $5 million for the twelve months ending December 31, 2017; (iv) a realized average crude oil price discount of $3.15 per barrel to the benchmark price during the period; and (v) $7 million of general and administrative expenses net of anticipated synergies, based on Par Pacific’s internal estimates, of $4 million during the period.
